Line Chart Analysis template for PowerPoint & Google Slides

Description
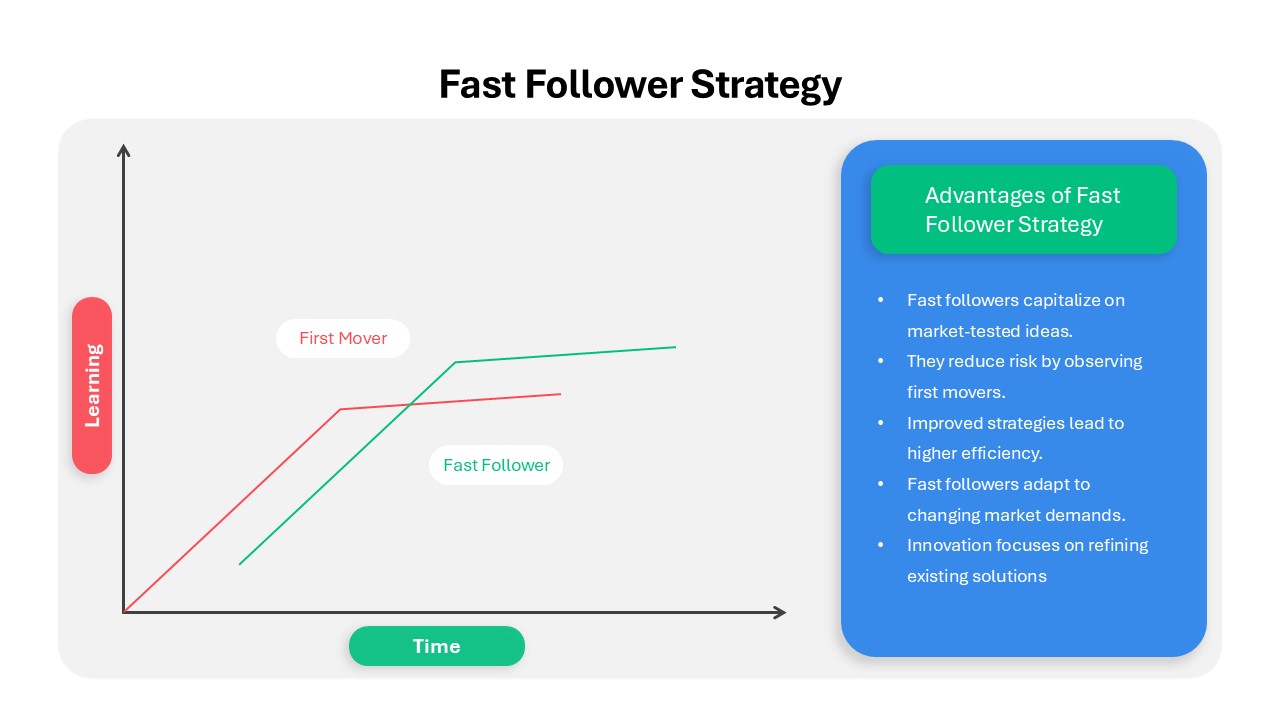
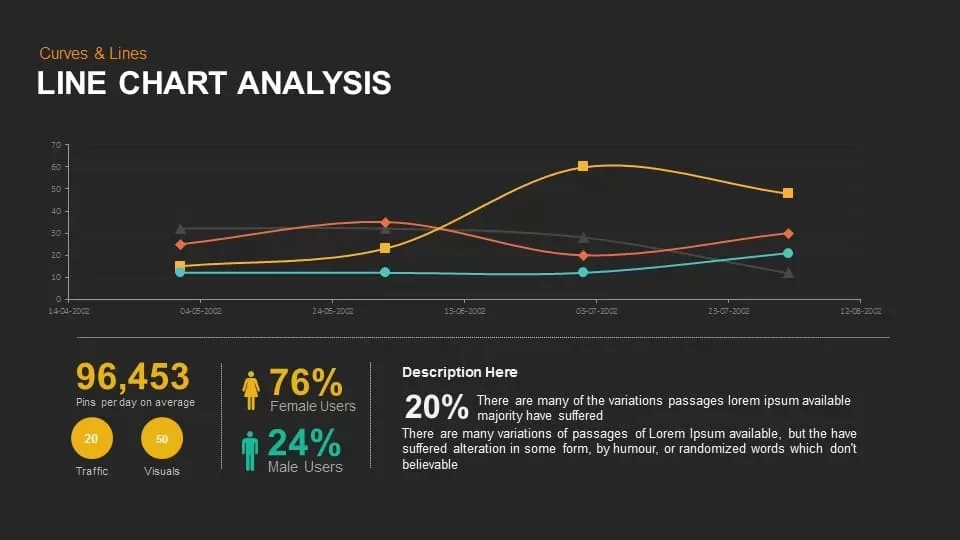
The Line Chart Analysis template offers a clear and visually engaging way to present and analyze data trends over time. This template features a line chart with multiple data series, each represented by a distinct color, showing trends or patterns. The chart is complemented by key statistics and insights, such as the average number of pins, user demographics (male vs. female), and other relevant information.
Ideal for reporting on user behavior, traffic analysis, or performance metrics, this template lets you present complex data in an easy-to-understand format. The line chart provides clarity by plotting multiple trends over time, making it perfect for tracking growth, comparisons, or seasonal patterns. The data below the chart highlights specific insights, helping you communicate key takeaways with precision.
Fully customizable, this template can be adapted to your specific dataset, whether you’re analyzing website traffic, user demographics, or performance trends. Its professional design makes it perfect for business presentations, marketing reports, and data-driven discussions.
Who is it for
This template is ideal for business analysts, marketers, and project managers who need to present data insights, track trends, or analyze user behavior. It’s especially useful for those working with web analytics, social media metrics, or sales performance data.
Other Uses
Beyond line chart analysis, this template can be used to present any type of data trend or comparison. It can be adapted for market research, financial reports, sales forecasting, or any scenario that requires a visual representation of data over time.
Login to download this file

Item ID
SB00754
Related Templates

Dynamic Financial Analysis Line Chart Template for PowerPoint & Google Slides
Finance
Line Graph Analysis template for PowerPoint & Google Slides
Charts

Application Revenue Line Chart KPI Template for PowerPoint & Google Slides
Revenue
Combination Bar and Line Chart Template for PowerPoint & Google Slides
Bar/Column
Editable Multi-Series Peak Line Chart Template for PowerPoint & Google Slides
Comparison Chart
Arrow Line Chart Template for PowerPoint & Google Slides
Comparison Chart
Data Over Time Line Chart template for PowerPoint & Google Slides
Charts
Growth Curve Line Chart Visualization Template for PowerPoint & Google Slides
Charts
Evolution Line Chart with Milestones Template for PowerPoint & Google Slides
Timeline
Multiple Line Chart Comparison Template for PowerPoint & Google Slides
Comparison Chart
Multi-Series Line Chart with Icons Template for PowerPoint & Google Slides
Comparison Chart
Interactive Jump Line Data Chart Template for PowerPoint & Google Slides
Comparison Chart
Skimming Pricing Strategy Line Chart Template for PowerPoint & Google Slides
Business Strategy
3D Line Chart for PowerPoint & Google Slides
Charts
Data-Driven Line Chart Diagram Template for PowerPoint
Comparison Chart
Multi-Series Curved Line Graph Analytics Template for PowerPoint & Google Slides
Comparison Chart
Sales Growth Dashboard: KPI Gauge & Line Template for PowerPoint & Google Slides
Revenue

Creative Clothing Line Presentation Template for PowerPoint & Google Slides
Pitch Deck
Fast Follower Strategy Line Graph Template for PowerPoint & Google Slides
Comparison Chart
3Ps Triple Bottom Line Venn Diagram Template for PowerPoint & Google Slides
Circular
4 People Racing to Finish Line Template for PowerPoint & Google Slides
Accomplishment
Curved Line Graph for PowerPoint & Google Slides
Timeline
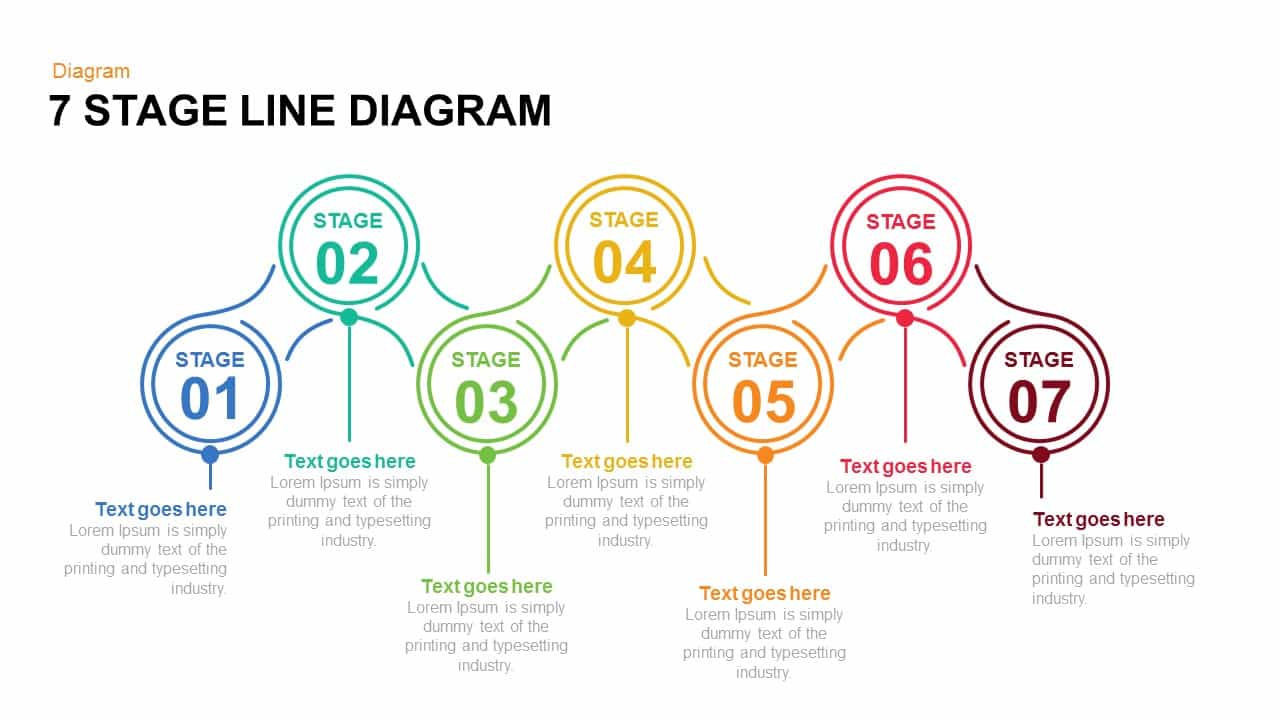
7 and 6 Stage Line Diagram Overview for PowerPoint & Google Slides
Infographics
Five and Six Step Line Linear Stage Diagram for PowerPoint & Google Slides
Infographics
Mobile Data Analysis Chart template for PowerPoint & Google Slides
Charts
Creative Data Analysis Bar Chart template for PowerPoint & Google Slides
Bar/Column
Pencil Bar Chart Data Analysis Template for PowerPoint & Google Slides
Bar/Column
Population Pyramid Chart Analysis Template for PowerPoint & Google Slides
Bar/Column
Waterfall Column Chart Analysis Template for PowerPoint & Google Slides
Bar/Column
Simple Scatter Chart Analysis Template for PowerPoint & Google Slides
Comparison Chart
Simple Area Chart Data Trends Analysis Template for PowerPoint & Google Slides
Comparison Chart
Waterfall Bar Chart Analysis Template for PowerPoint & Google Slides
Bar/Column
Four Quadrant Scatter Chart Analysis Template for PowerPoint & Google Slides
Comparison Chart
Proportional Area Chart Analysis Template for PowerPoint & Google Slides
Comparison Chart
Expanding Margins Analysis Bar Chart Template for PowerPoint & Google Slides
Charts
Annual Growth Trend Analysis Chart template for PowerPoint & Google Slides
Business Report
Data Analysis Bar Chart with Insights Template for PowerPoint & Google Slides
Bar/Column
Free
Skills Gap Analysis Comparison Chart Template for PowerPoint & Google Slides
Gap
Clustered Column Chart Data Analysis Template for PowerPoint
Bar/Column
Quad Chart Infographic Pack of 8 Slides Template for PowerPoint & Google Slides
Comparison Chart
Free Professional Gantt Chart Pack – 4 Slides Template for PowerPoint & Google Slides
Gantt Chart
Free
PEST Analysis PowerPoint Template for PowerPoint & Google Slides
Business Strategy
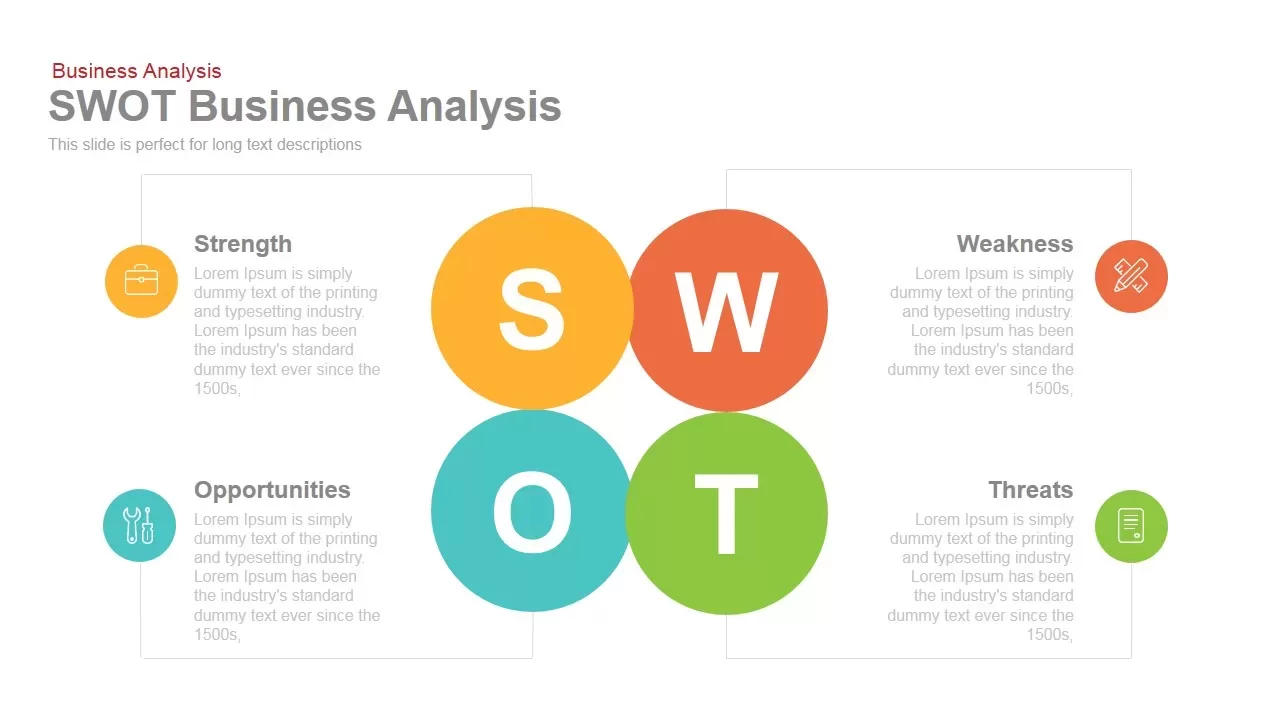
SWOT Business Analysis template for PowerPoint & Google Slides
SWOT
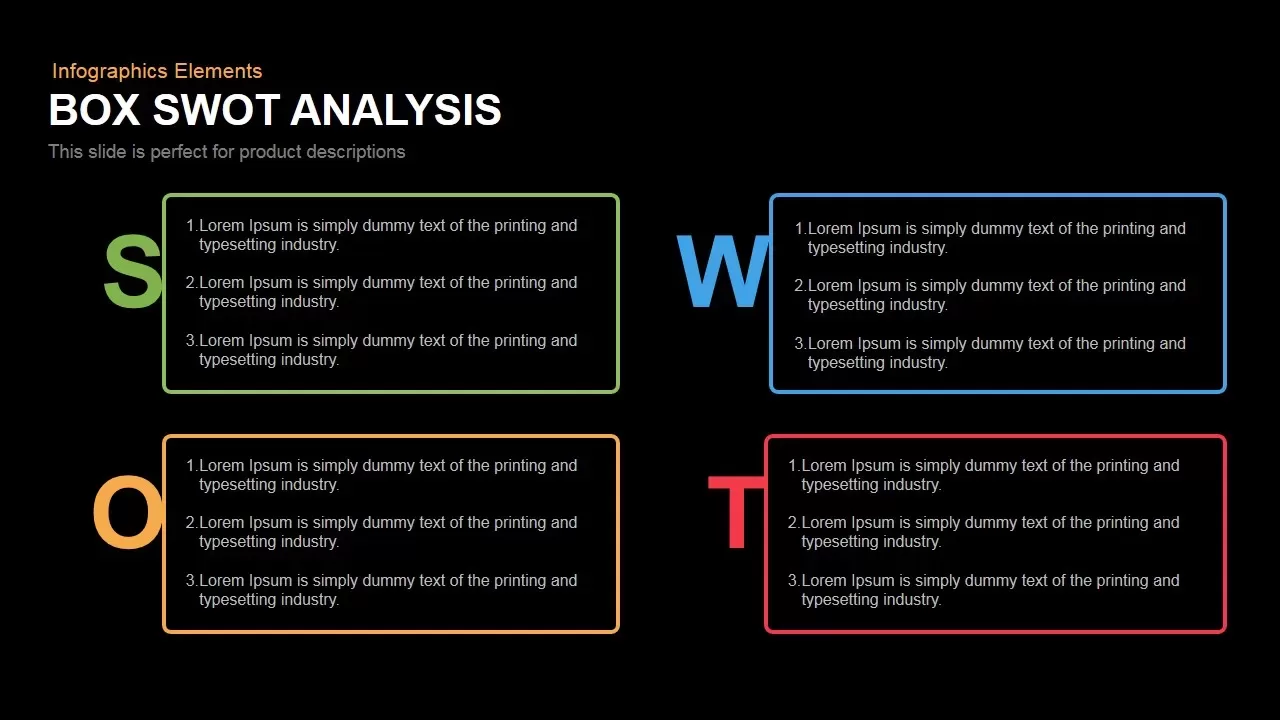
Box SWOT Analysis Infographic Template for PowerPoint & Google Slides
SWOT
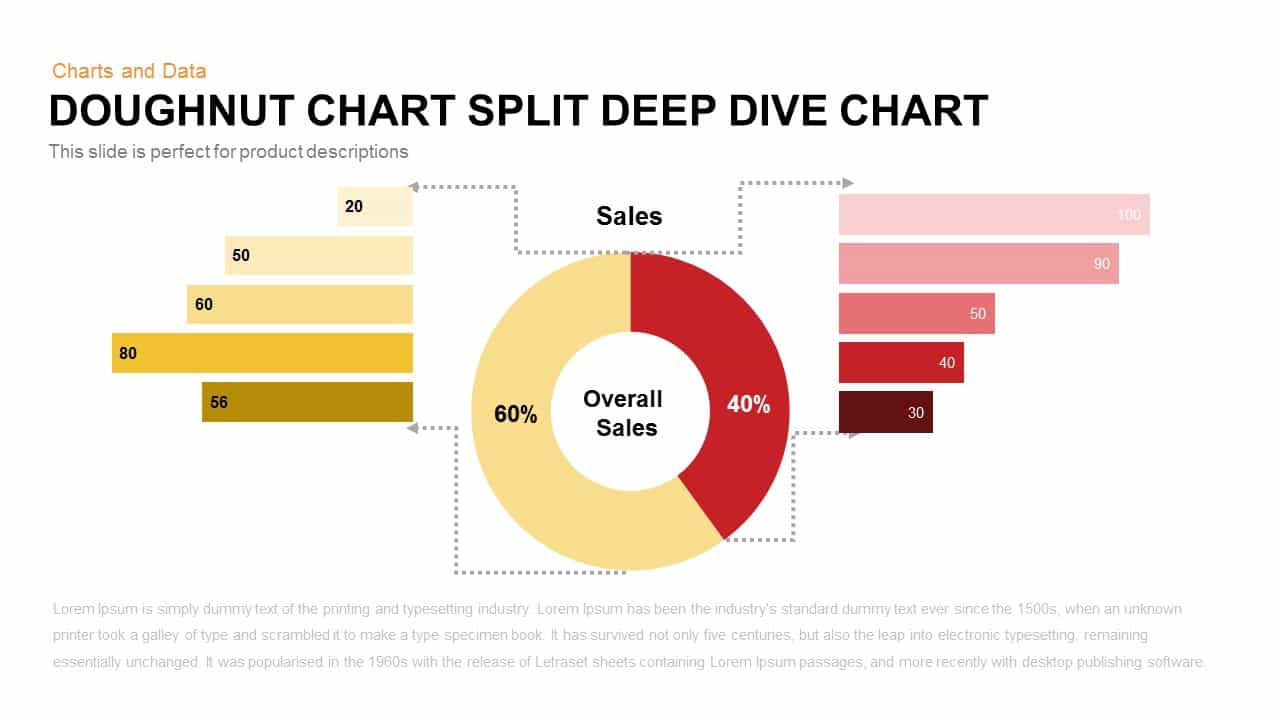
Split Doughnut Deep Dive Sales Analysis Template for PowerPoint & Google Slides
Pie/Donut
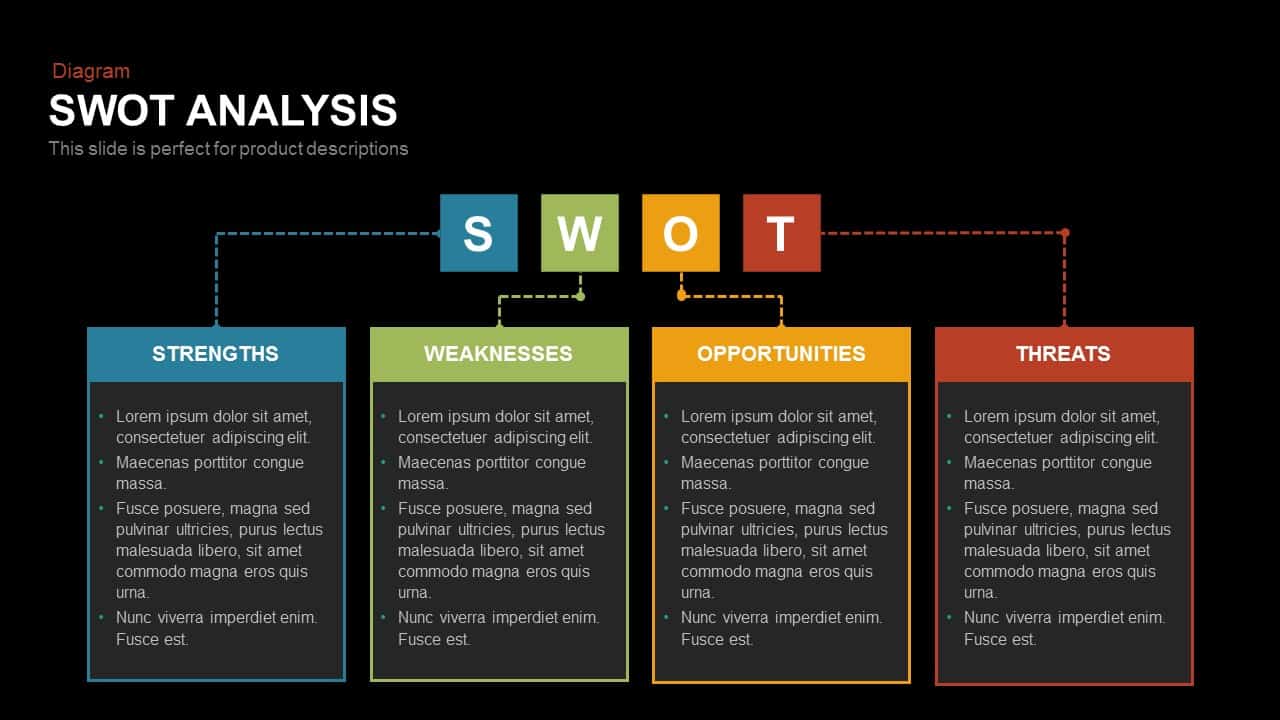
SWOT Analysis template for PowerPoint & Google Slides
SWOT
Editable Force Field Analysis Diagram Template for PowerPoint & Google Slides
Business Plan
PESTLE Analysis Table Layout Diagram Template for PowerPoint & Google Slides
PEST
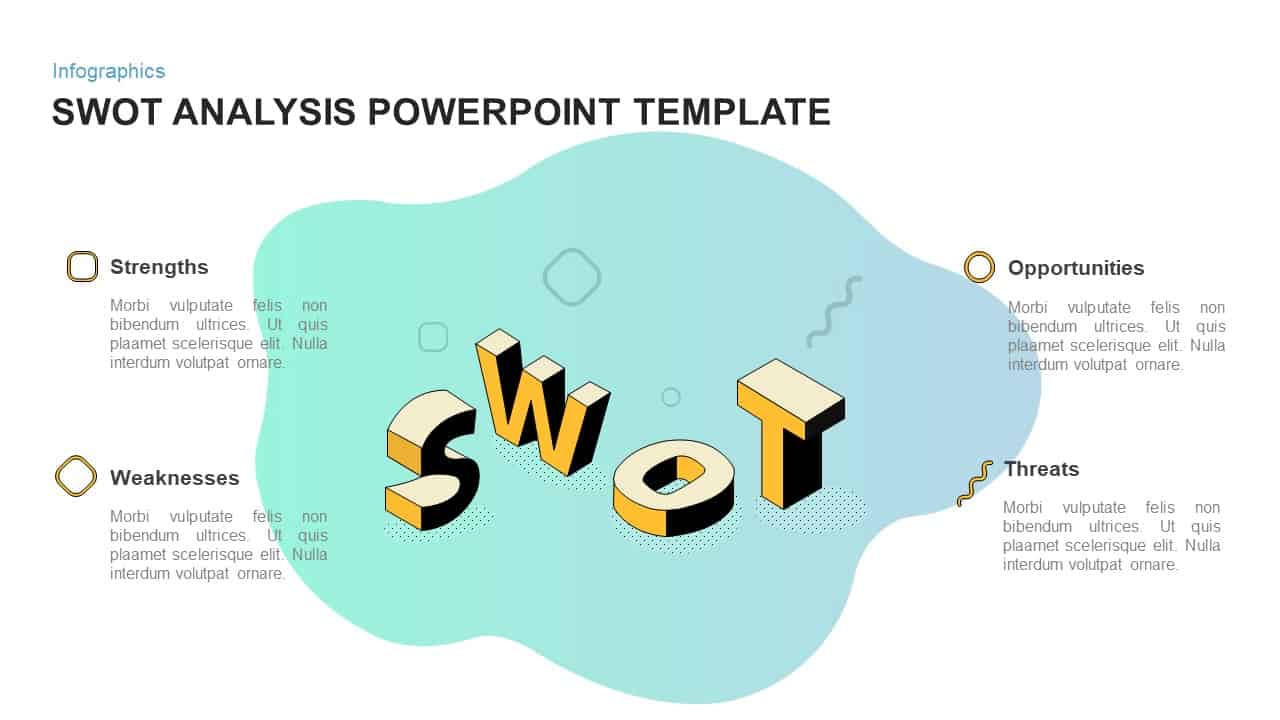
3D Blob SWOT Analysis Infographic Template for PowerPoint & Google Slides
SWOT
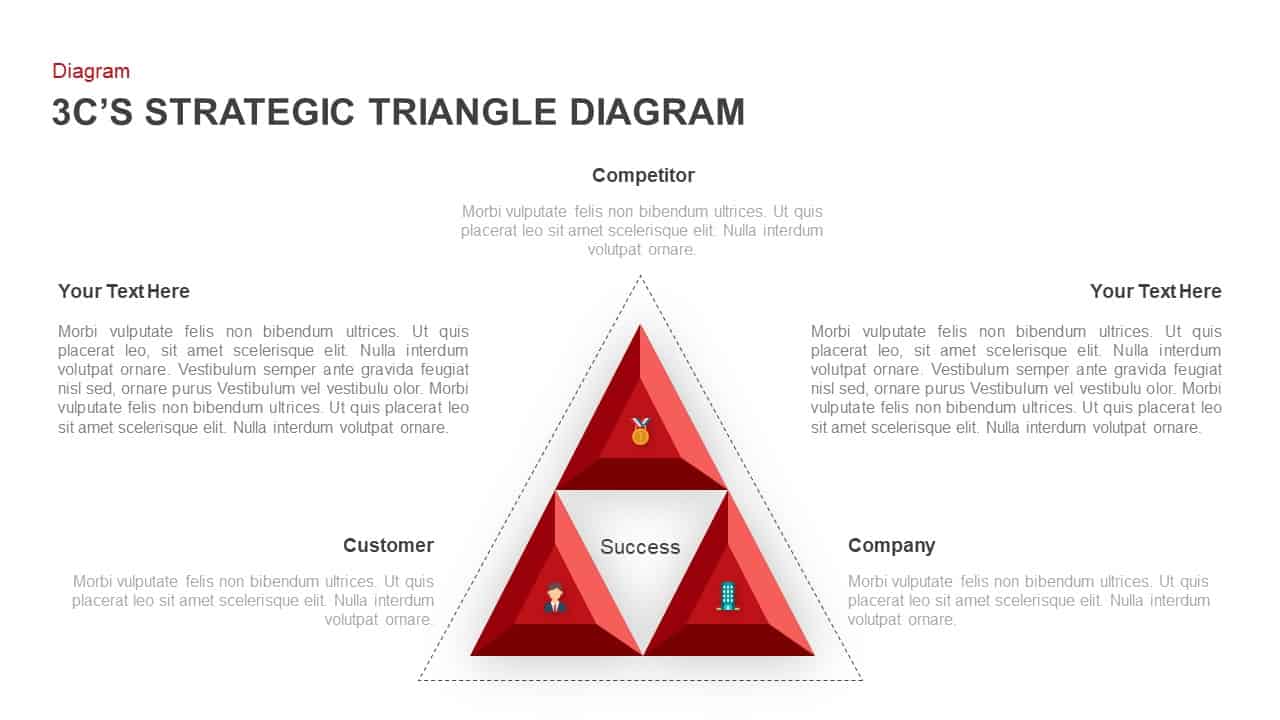
3C Strategic Triangle Analysis Template for PowerPoint & Google Slides
Competitor Analysis
Business Target Analysis Diagram Template for PowerPoint & Google Slides
Circular
Gradient Petal SWOT Analysis Quadrant Template for PowerPoint & Google Slides
SWOT
Butterfly SWOT Analysis Diagram Template for PowerPoint & Google Slides
SWOT
SWOT Analysis Metaphor Illustration Template for PowerPoint & Google Slides
SWOT
Versatile SWOT Analysis Slide Collection Template for PowerPoint & Google Slides
SWOT
3D Cube SWOT Analysis Infographic Template for PowerPoint & Google Slides
SWOT

SWOT Analysis Infographic Diagram Template for PowerPoint & Google Slides
SWOT
PESTLE and PEST Strategic Analysis Diagrams Template for PowerPoint & Google Slides
Business Strategy
Sky and Tree Root Cause Analysis Deck Template for PowerPoint & Google Slides
Opportunities Challenges
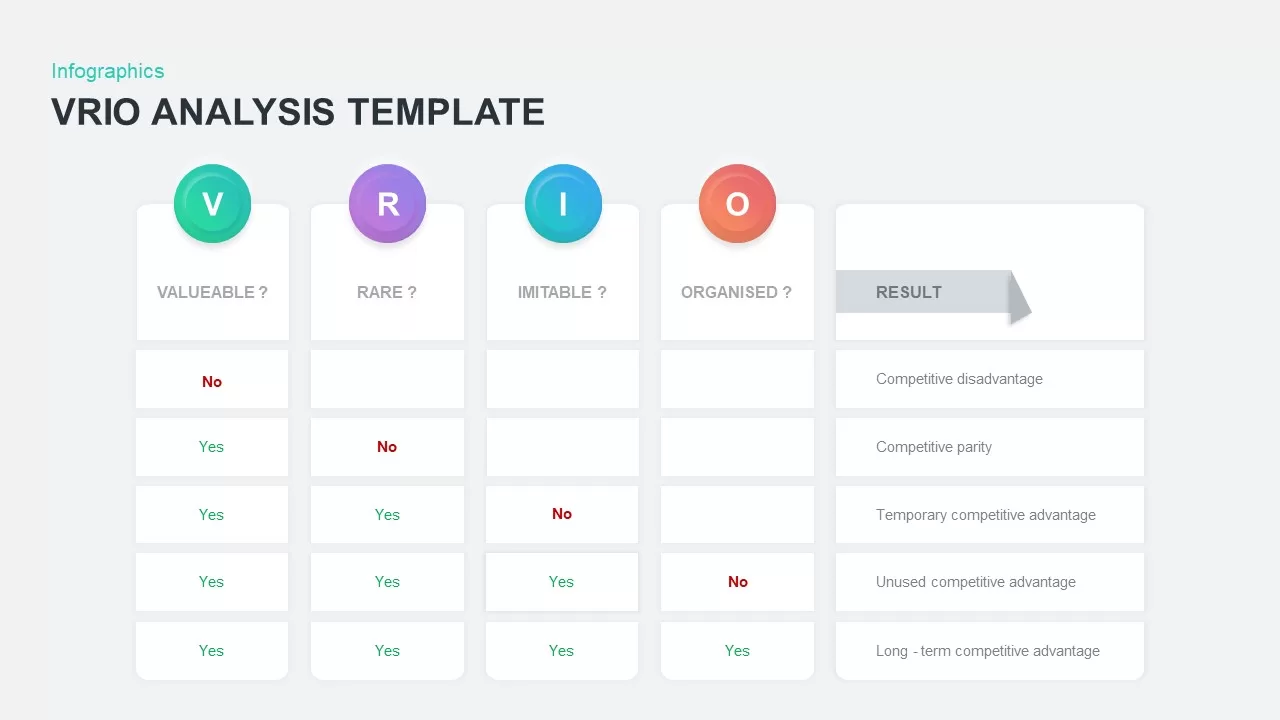
VRIO Analysis Infographic Template for PowerPoint & Google Slides
Business Strategy
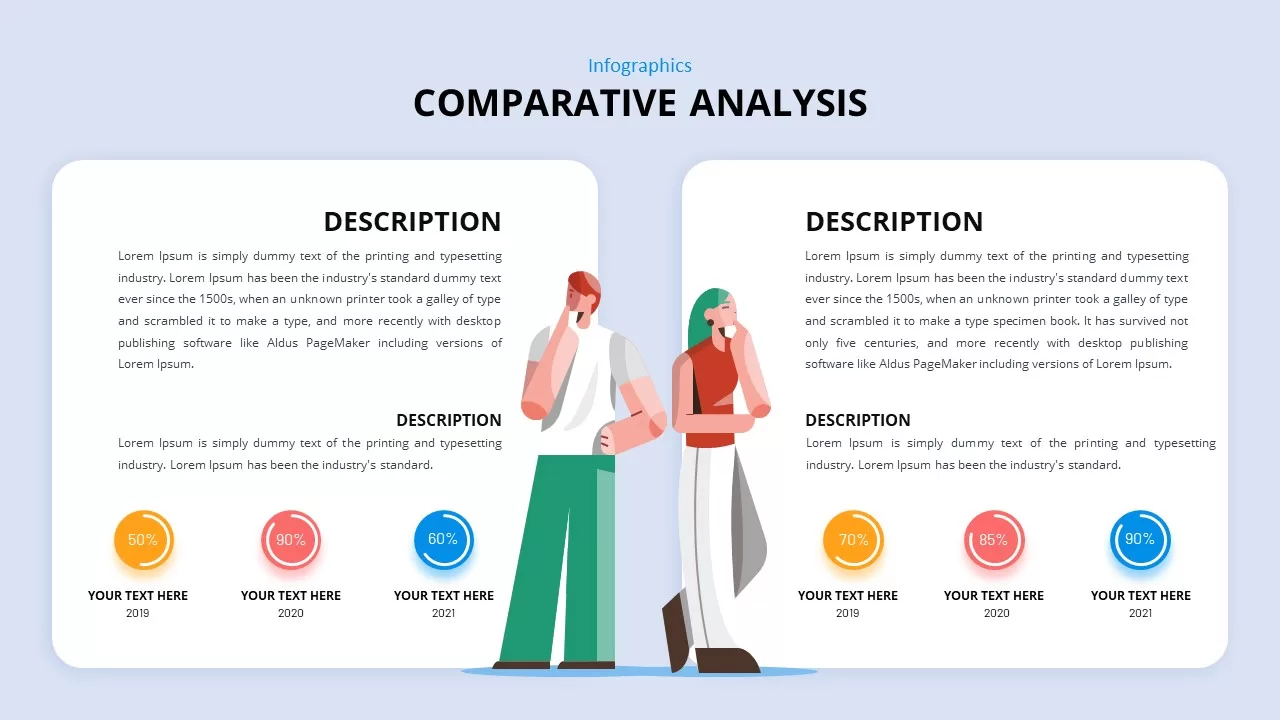
Comparative Analysis Template for PowerPoint & Google Slides
Comparison
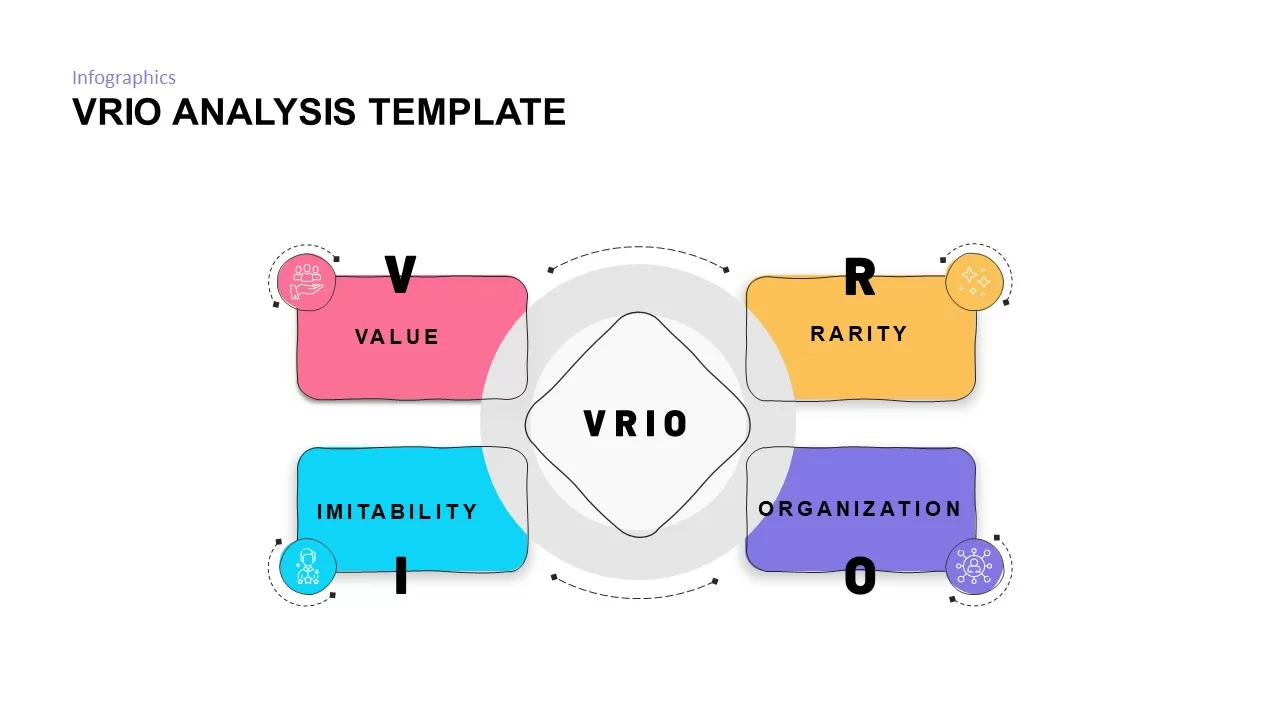
VRIO Analysis Framework template for PowerPoint & Google Slides
Business Strategy
Problem Statement Analysis template for PowerPoint & Google Slides
Business Strategy
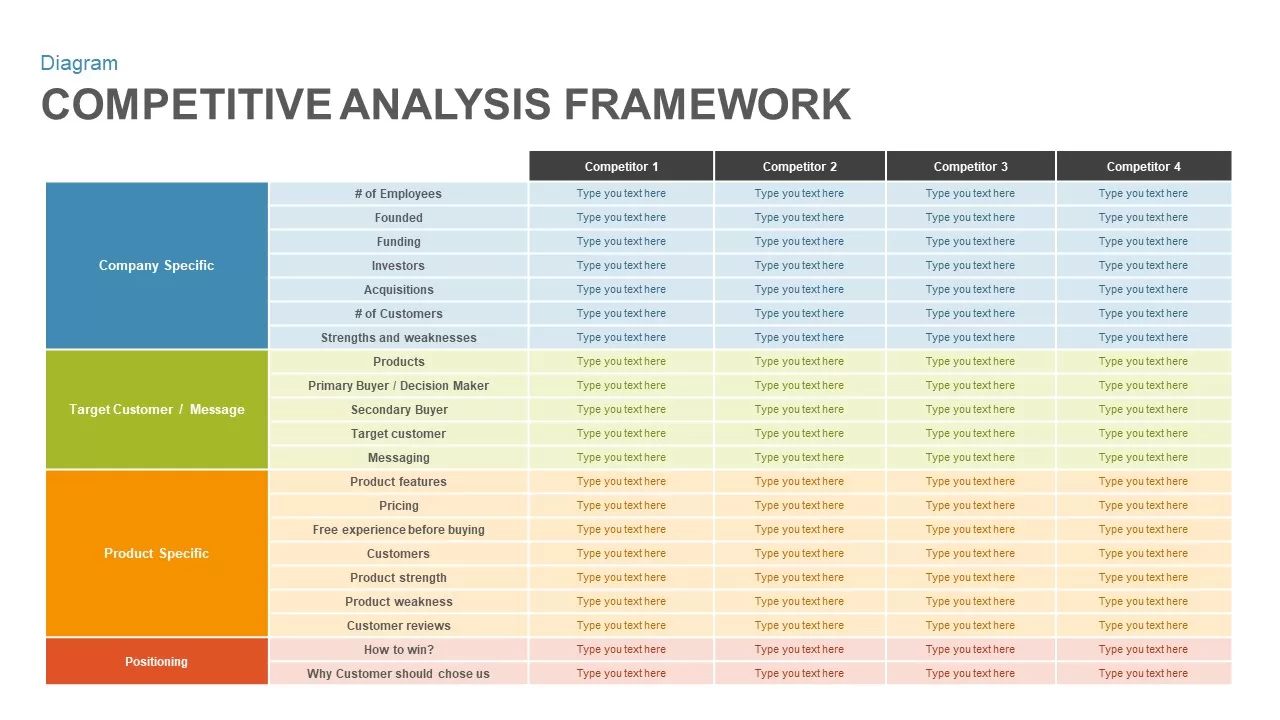
Competitive Analysis Framework template for PowerPoint & Google Slides
Business Report
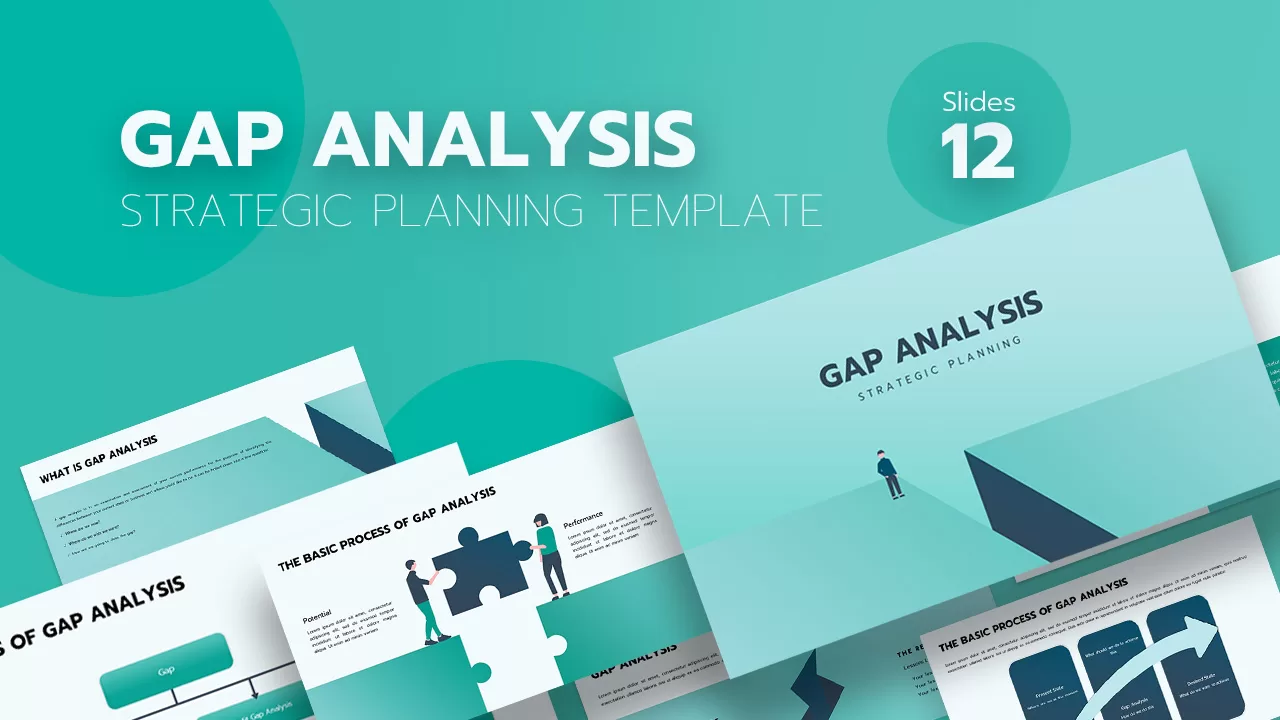
Gap Analysis Strategic Planning Template for PowerPoint & Google Slides
Gap
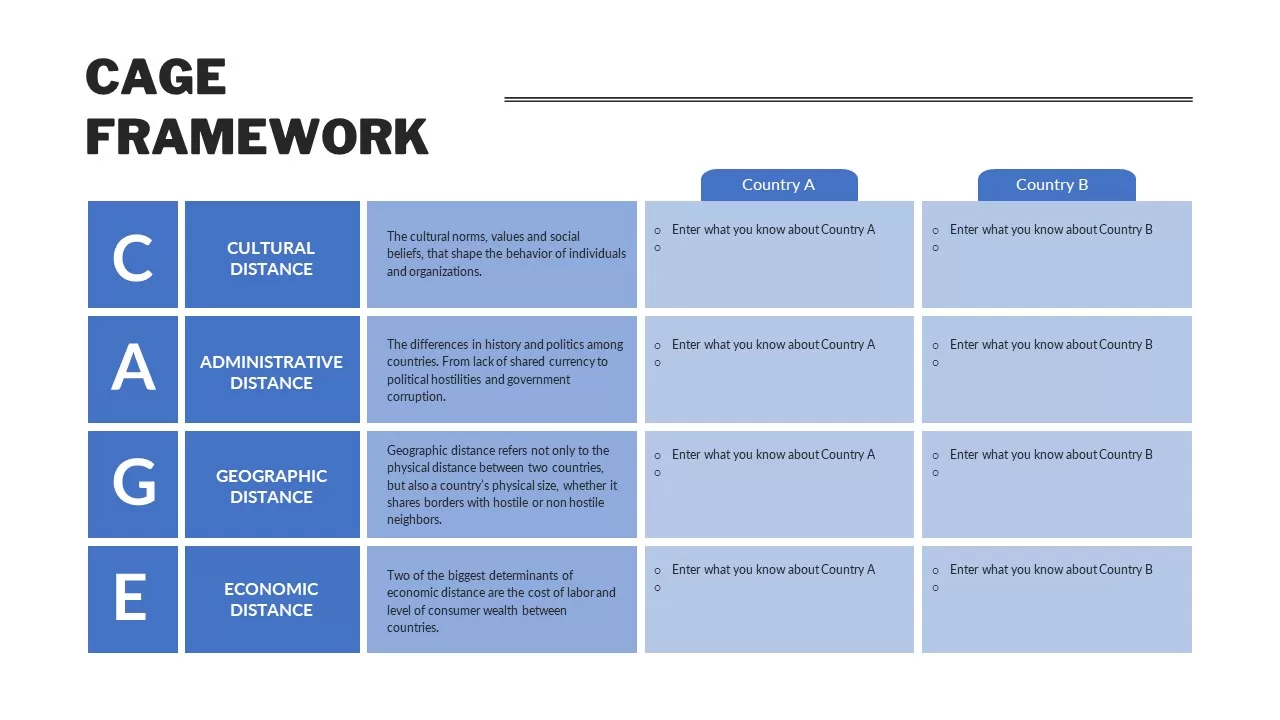
CAGE Distance Analysis Framework Template for PowerPoint & Google Slides
Competitor Analysis
Comprehensive Risk Impact Analysis Template for PowerPoint & Google Slides
Risk Management
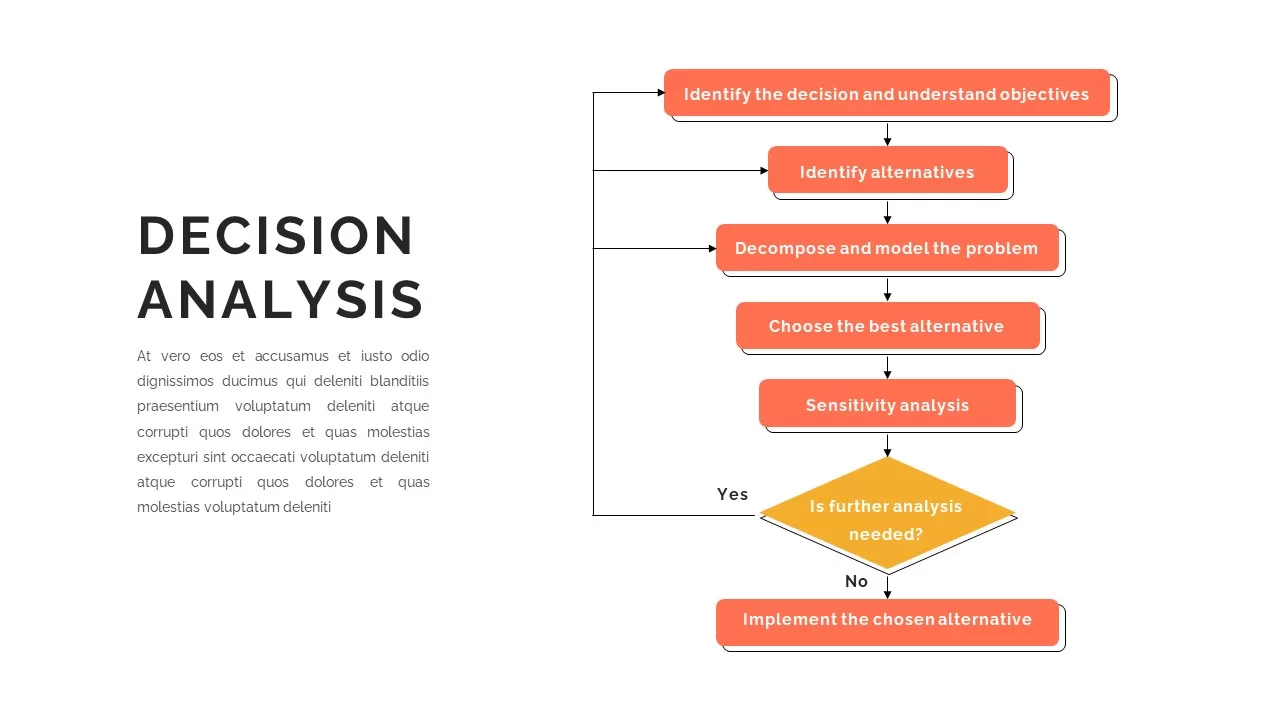
Decision Analysis Process Flowchart Template for PowerPoint & Google Slides
Flow Charts
SWOT Analysis Framework template for PowerPoint & Google Slides
SWOT
SWOT Analysis Quadrant template for PowerPoint & Google Slides
Business Strategy
Break-Even Analysis Infographic Template for PowerPoint & Google Slides
Revenue

Free SWOT Analysis Overview template for PowerPoint & Google Slides
SWOT
Free
SWOT Analysis template for PowerPoint & Google Slides
SWOT
SWOT Analysis template for PowerPoint & Google Slides
SWOT
Heat Map Analysis Template for PowerPoint & Google Slides
Risk Management
Checkmate Slide for Competitor Analysis Template for PowerPoint & Google Slides
Competitor Analysis
Cost Benefit Analysis Comparison Template for PowerPoint & Google Slides
Comparison
Six-Step Business Analysis Diagram template for PowerPoint & Google Slides
Circular
Vendor Analysis Criteria and Scoring template for PowerPoint & Google Slides
Business
Social Media Analysis Metrics Slide Deck Template for PowerPoint & Google Slides
Digital Marketing
Risk Pyramid Hierarchy Analysis Template for PowerPoint & Google Slides
Pyramid
Free Competitor Analysis Matrix Template for PowerPoint & Google Slides
Competitor Analysis
Free
Quarterly Network Volume Analysis Template for PowerPoint & Google Slides
Business Report
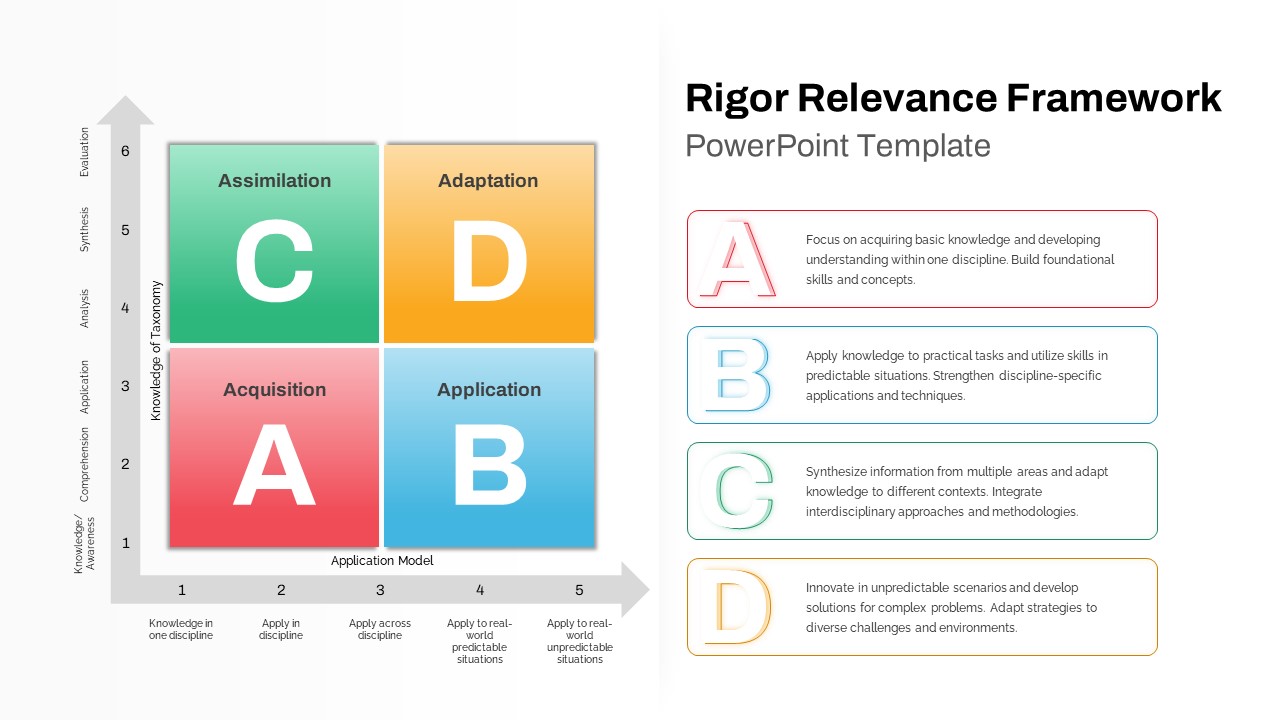
Rigor Relevance Framework Analysis Template for PowerPoint & Google Slides
Comparison
Bottleneck Process Analysis Diagram Template for PowerPoint & Google Slides
Process
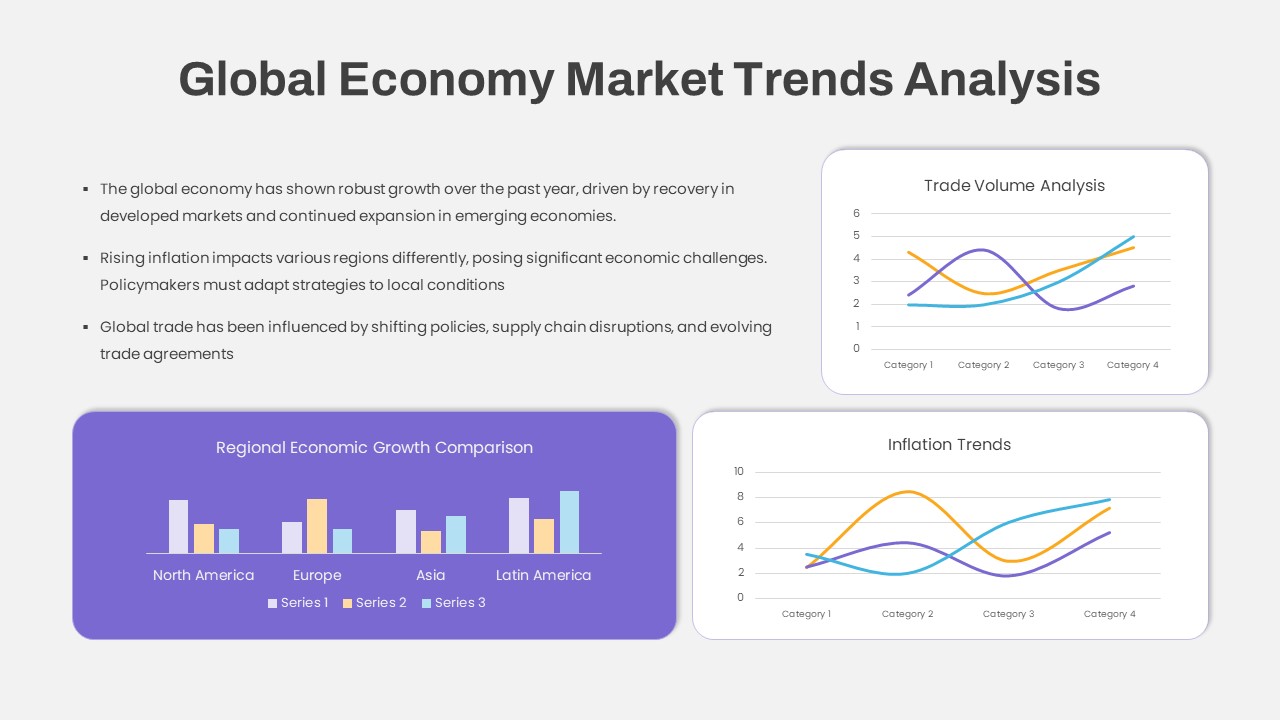
Global Economy Market Trends Analysis Template for PowerPoint & Google Slides
Comparison Chart
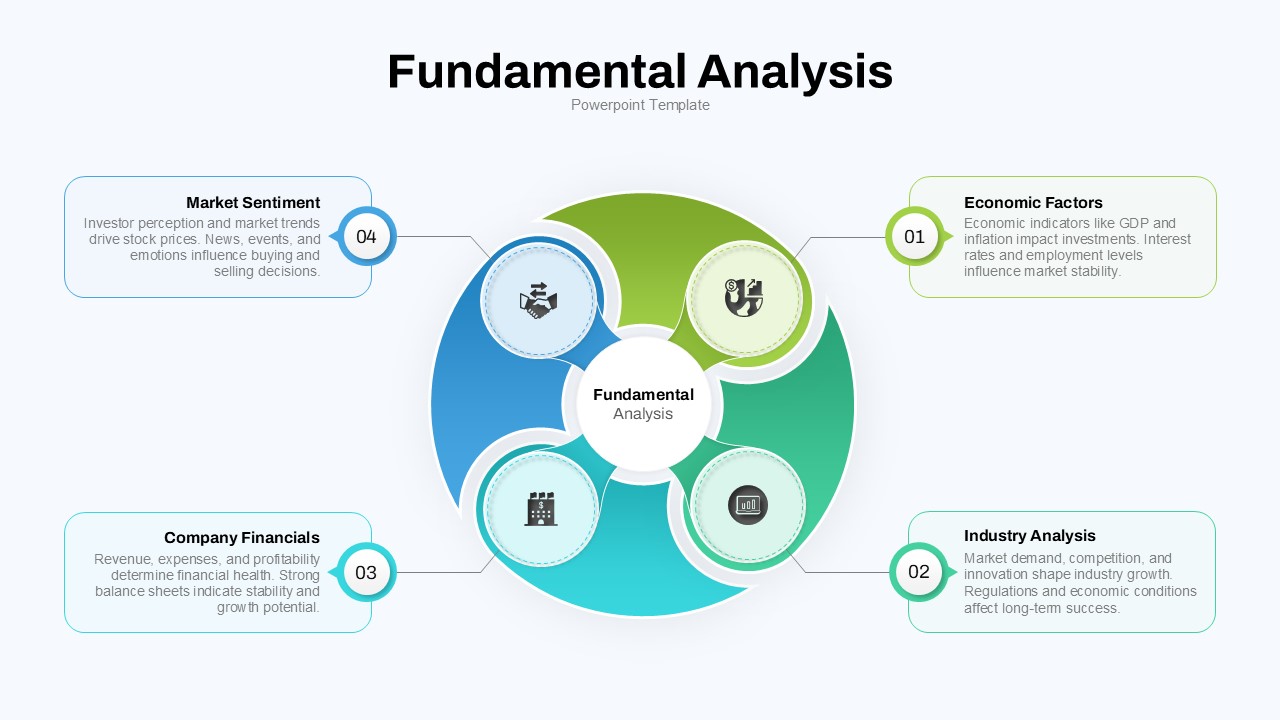
Fundamental Analysis Circular Diagram Template for PowerPoint & Google Slides
Circular
Cultural Web Analysis Circular Diagram Template for PowerPoint & Google Slides
Circular
Marketing SWOT Analysis Slide Template for PowerPoint & Google Slides
SWOT
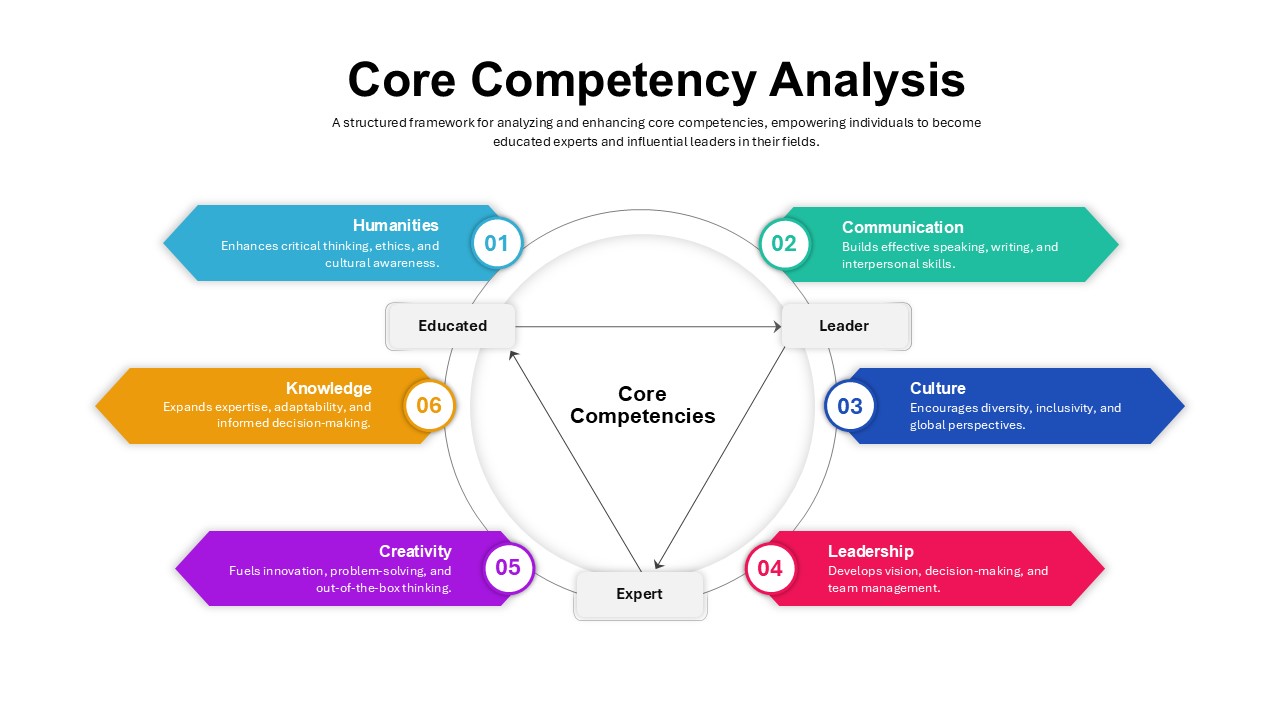
Core Competency Analysis Circular Template for PowerPoint & Google Slides
Circular
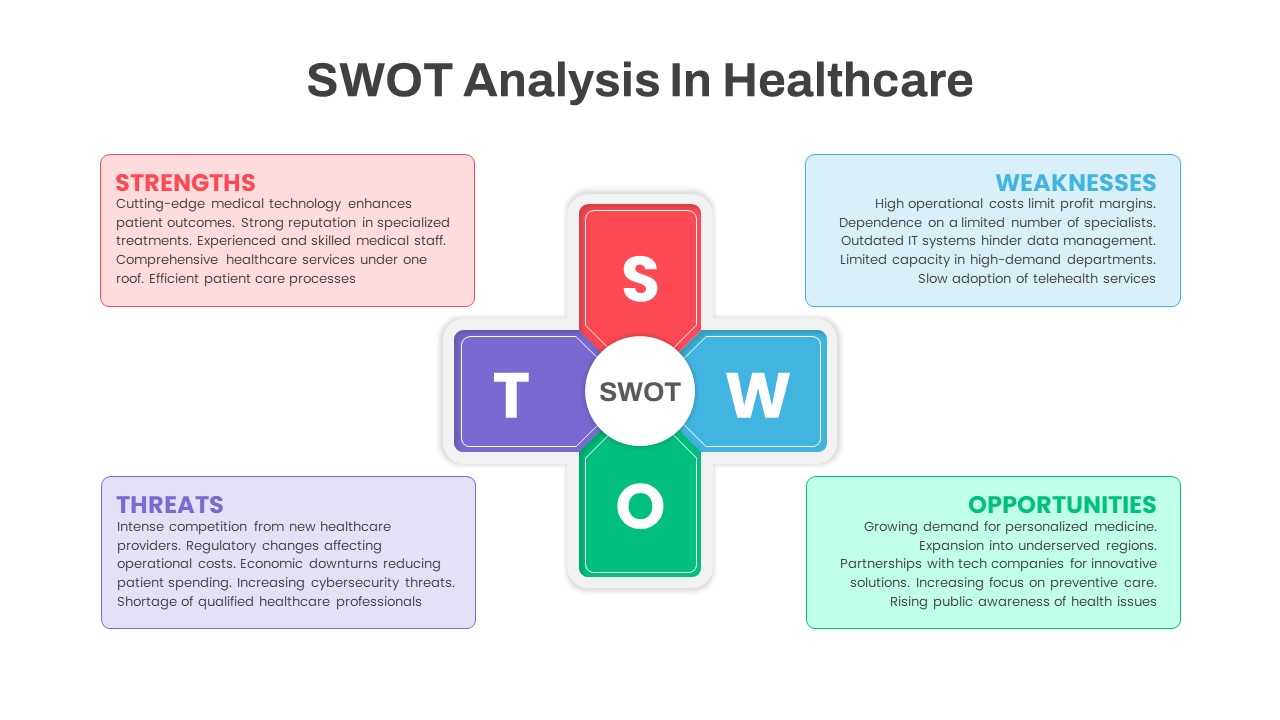
SWOT Analysis in Healthcare template for PowerPoint & Google Slides
SWOT
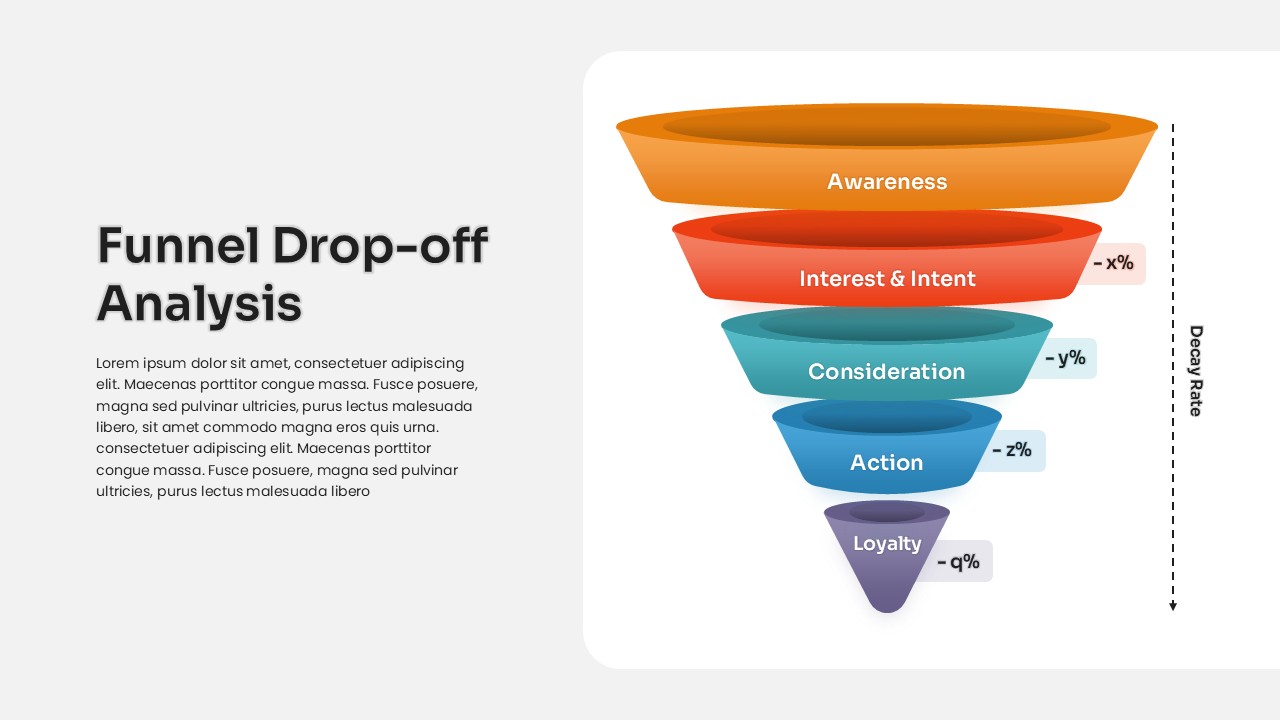
Funnel Drop-off Analysis template for PowerPoint & Google Slides
Business
Category Analysis Comparison Infographic Template for PowerPoint & Google Slides
Comparison
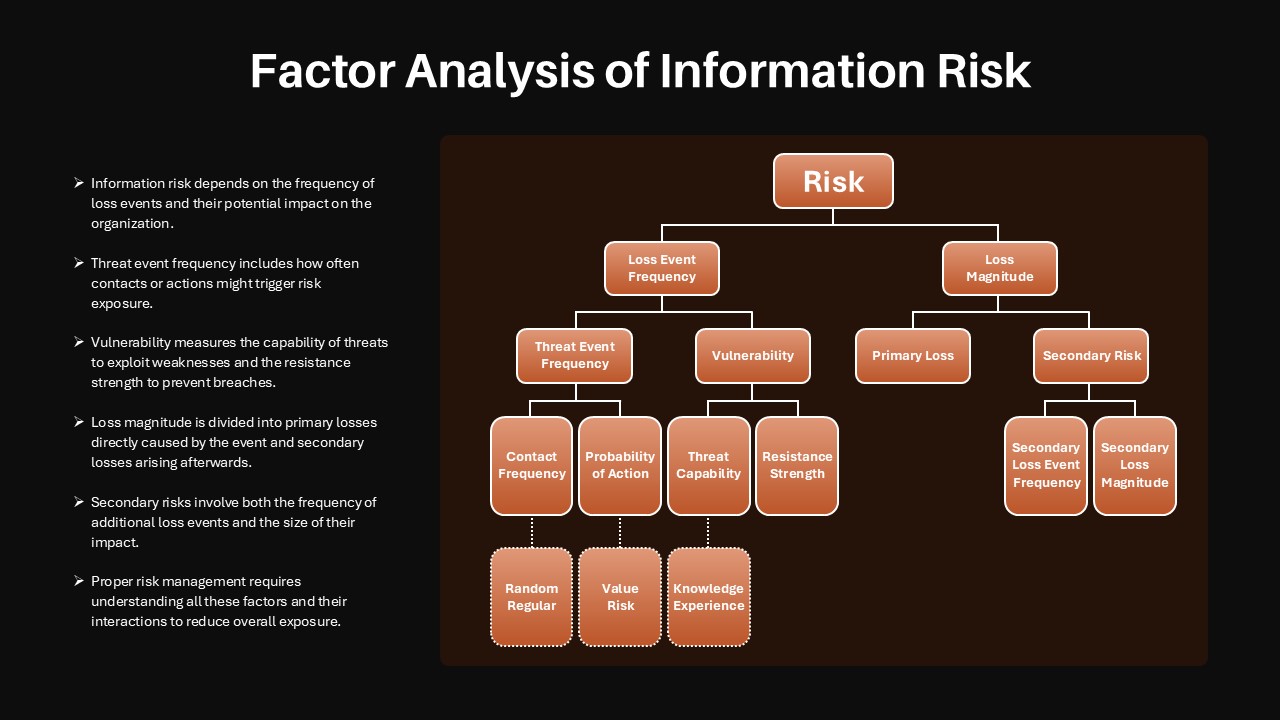
Factor Analysis of Information Risk Template for PowerPoint & Google Slides
Risk Management
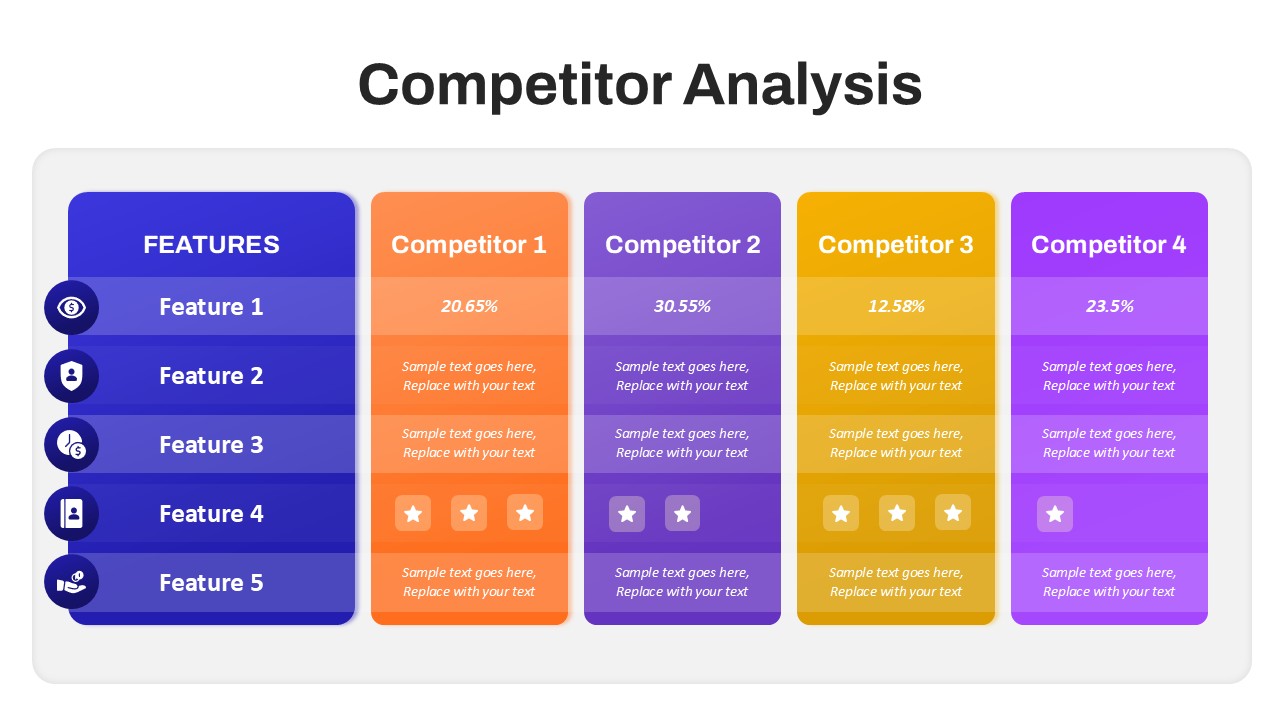
Competitor Analysis Overview template for PowerPoint & Google Slides
Competitor Analysis
Trapezoid SWOT Analysis Template for PowerPoint & Google Slides
SWOT
3D SWOT Analysis Template for PowerPoint & Google Slides
SWOT
Orange SWOT Analysis Infographic Template for PowerPoint & Google Slides
SWOT
Customer Needs Analysis Template for PowerPoint & Google Slides
Customer Experience
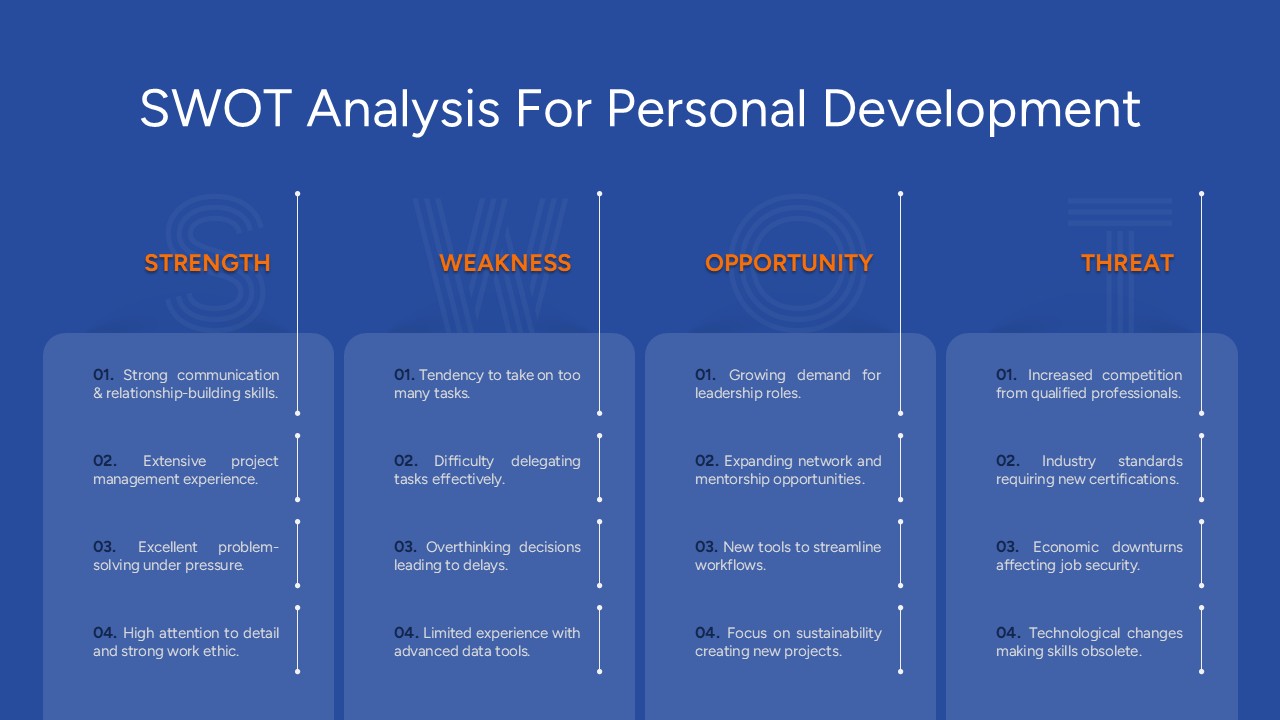
Free SWOT Analysis for Personal Development Template for PowerPoint & Google Slides
SWOT
Free