KPI Dashboard Overview template for PowerPoint & Google Slides


Description
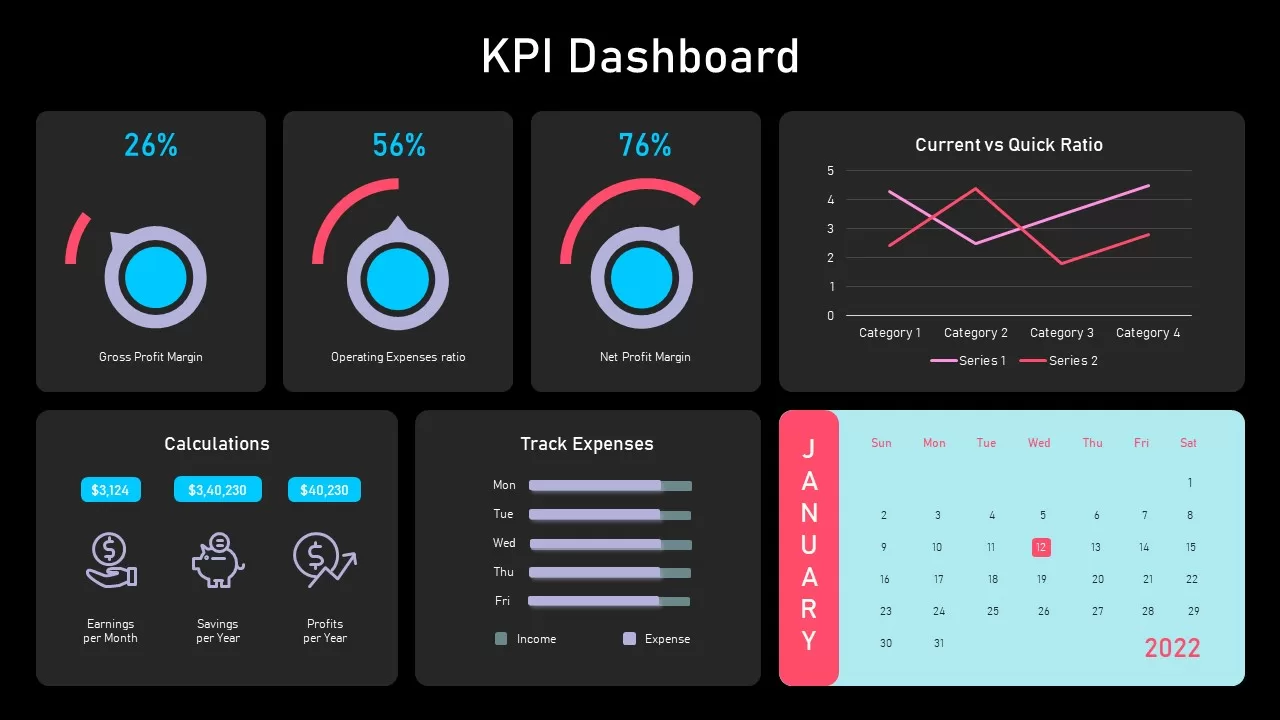
This KPI Dashboard slide provides a detailed and visually engaging overview of key financial metrics and performance indicators, tailored for effective business analysis and reporting. It includes several visually distinct sections: a set of circular progress indicators for gross profit margin, operating expenses ratio, and net profit margin, allowing stakeholders to quickly gauge financial health. The accompanying graph compares current versus quick ratios, offering clear insight into liquidity and financial stability over time. A section dedicated to monthly expense tracking helps monitor income and expenses on a weekly basis, ensuring all financial activities are accounted for.
The lower section features calculations for earnings per month, savings per year, and profits per year, offering a concise snapshot of financial performance. Additionally, a simple calendar for January 2022 is included to provide a timeframe context. The design uses a clean and modern layout with light pastel colors and contrasting elements, ensuring easy readability and professional appeal. Fully editable elements enable quick customization, making this dashboard ideal for both corporate and small business use.
This template is optimized for PowerPoint and Google Slides, offering a high level of flexibility for presentations. Whether used for monthly reviews, annual reports, or strategic financial discussions, this KPI Dashboard allows you to present data in an easy-to-understand and engaging manner.
Who is it for
This KPI Dashboard is perfect for financial analysts, business owners, project managers, and entrepreneurs who need to present key performance indicators and financial health data in a visually compelling format. It’s also ideal for executives who require a high-level overview of business performance or for team leaders conducting regular performance reviews.
Other Uses
Apart from financial reports, this slide can be repurposed for tracking project progress, sales performance, or budget monitoring. Use it in client presentations, team meetings, or as a part of an ongoing performance management process. The versatile design can be adjusted for various industry needs, including marketing, sales, and operations analysis.
Login to download this file

Item ID
SB02754
Related Templates

KPI Dashboard Data Overview Slide Template for PowerPoint & Google Slides
Bar/Column
Free KPI Dashboard PowerPoint Template for PowerPoint & Google Slides
Charts
Free

Efficiency KPI Dashboard Metaphor Template for PowerPoint & Google Slides
Infographics
Sales Growth Dashboard: KPI Gauge & Line Template for PowerPoint & Google Slides
Revenue
Performance KPI Dashboard Slide Template for PowerPoint & Google Slides
Business Report
KPI Dashboard template for PowerPoint & Google Slides
Business Report
KPI Dashboard Data Visualization Template for PowerPoint & Google Slides
Bar/Column
Customer Satisfaction KPI Dashboard Template for PowerPoint & Google Slides
Customer Experience
Michigan County Map with KPI Dashboard Template for PowerPoint & Google Slides
World Maps
DevOps KPI Dashboard Performance Metrics Template for PowerPoint & Google Slides
Software Development
Purchasing KPI Metrics Dashboard Template for PowerPoint & Google Slides
Business Report
Procurement KPI Dashboard & Metrics Template for PowerPoint & Google Slides
Business Report
4DX Scoreboard KPI Gauge Dashboard Template for PowerPoint & Google Slides
Business Strategy
Patient-Satisfaction KPI Dashboard for PowerPoint & Google Slides
Business
Banking Financial Overview Dashboard Template for PowerPoint & Google Slides
Finance
Account Overview Dashboard template for PowerPoint & Google Slides
Business
Asia Map with KPI Metrics and Legend Template for PowerPoint & Google Slides
World Maps

Application Revenue Line Chart KPI Template for PowerPoint & Google Slides
Revenue
Professional Team Collage & KPI Slide Template for PowerPoint & Google Slides
Business
Circular Image Gallery & KPI Metrics Template for PowerPoint & Google Slides
Pie/Donut
Statistics Infographic & KPI Bar Chart Template for PowerPoint & Google Slides
Bar/Column
Monthly Recurring Revenue KPI Bar Chart Template for PowerPoint & Google Slides
Bar/Column
Free Balanced Scorecard Quadrant KPI Layout Template for PowerPoint & Google Slides
Employee Performance
Free
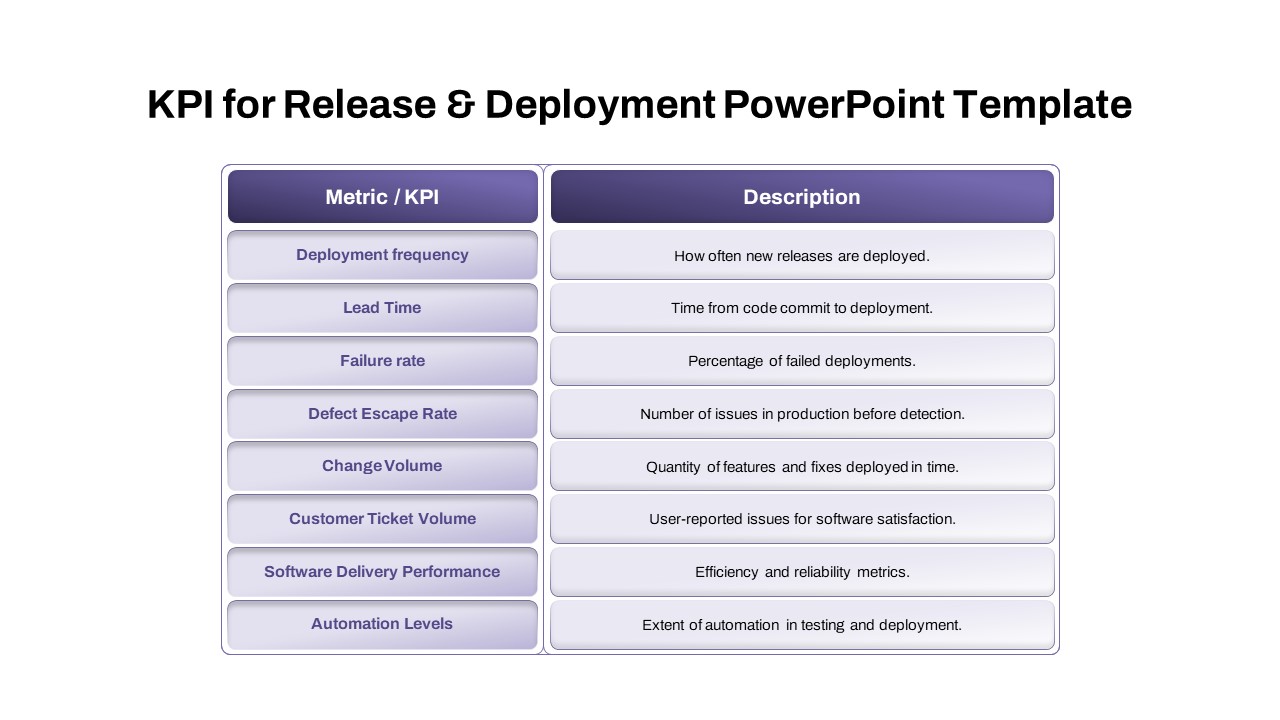
Comprehensive Release & Deployment KPI Template for PowerPoint & Google Slides
Software Development
Three Segment Donut Chart KPI Infographic Template for PowerPoint & Google Slides
Pie/Donut
Year in Review KPI Highlights Slide for PowerPoint & Google Slides
Business Report
E-commerce Analytics Dashboard Template for PowerPoint & Google Slides
Bar/Column

Dynamic Data Dashboard Infographic Template for PowerPoint & Google Slides
Bar/Column
Product Usage Analytics Dashboard Chart Template for PowerPoint & Google Slides
Bar/Column
Data Analytics Dashboard Design template for PowerPoint & Google Slides
Bar/Column
Business Dashboard Analytics & KPIs Template for PowerPoint & Google Slides
Bar/Column

Professional Team Efficiency Dashboard Template for PowerPoint & Google Slides
Business Report
Project Management Dashboard Template for PowerPoint & Google Slides
Project
Website Performance Dashboard template for PowerPoint & Google Slides
Charts
Sales Performance Dashboard template for PowerPoint & Google Slides
Business Report
Immigration Data Dashboard Template for PowerPoint & Google Slides
Bar/Column
Employee Skill Analysis Dashboard Template for PowerPoint & Google Slides
Employee Performance
Social Media Performance Dashboard Template for PowerPoint & Google Slides
Bar/Column

Net Promoter Score Dashboard Template for PowerPoint & Google Slides
Customer Experience
Modern Project Status Report Dashboard Template for PowerPoint & Google Slides
Project Status
Bull and Bear Stock Market Dashboard Template for PowerPoint & Google Slides
Infographics
Professional Nurse Infographic Dashboard Template for PowerPoint & Google Slides
Nursing
Interactive Benchmarking Gauge Dashboard Template for PowerPoint & Google Slides
Pie/Donut
Heat Map Risk Matrix Dashboard Template for PowerPoint & Google Slides
Comparison Chart
Project Status Dashboard Table Template for PowerPoint & Google Slides
Project Status
Project Status Dashboard with Metrics Template for PowerPoint & Google Slides
Project Status
Colorful Project Status Dashboard Template for PowerPoint & Google Slides
Project Status
Weekly Update Schedule Dashboard Template for PowerPoint & Google Slides
Agenda
Project Status Dashboard Template for PowerPoint & Google Slides
Project Status
Weekly Status Report Dashboard Template for PowerPoint & Google Slides
HR
Free Metro UI Dashboard Infographic Template for PowerPoint & Google Slides
Business Report
Free
Website Performance Monitoring Dashboard Template for PowerPoint & Google Slides
Business Report
One Pager Project Status Dashboard Template for PowerPoint & Google Slides
Project Status
One Pager Annual Report Dashboard Template for PowerPoint & Google Slides
Business Report
Social Media Analytics Dashboard Template for PowerPoint & Google Slides
Digital Marketing
Social Media Statistics 2023 Dashboard Template for PowerPoint & Google Slides
Comparison
Mastodon Metrics Infographic Dashboard Template for PowerPoint & Google Slides
Business Report
Soccer Match Stats Dashboard Slide Template for PowerPoint & Google Slides
Graphics
Employee Satisfaction Survey Dashboard Template for PowerPoint & Google Slides
Employee Performance
Weekly Project Status Dashboard Template for PowerPoint & Google Slides
Project Status
Freight Logistics Dashboard Infographic Template for PowerPoint & Google Slides
Comparison Chart
Free Quarterly Business Review Dashboard Template for PowerPoint & Google Slides
Business
Free
Cost Cutting Savings Dashboard Template for PowerPoint & Google Slides
Pie/Donut
Macroeconomic Indicators Dashboard Template for PowerPoint & Google Slides
PEST
Free Monthly Report PowerPoint Template for PowerPoint & Google Slides
Business Report
Free
Quarterly Financial Summary Dashboard Template for PowerPoint & Google Slides
Business Report
Quarterly Business Review Dashboard Template for PowerPoint & Google Slides
Pitch Deck
Monthly Business Review Dashboard Deck Template for PowerPoint & Google Slides
Business Report
Project Progress Dashboard Pie Charts Template for PowerPoint & Google Slides
Project
Monthly Sales Performance Dashboard Template for PowerPoint & Google Slides
Charts
HR Report Dashboard Template for PowerPoint & Google Slides
Employee Performance
Budget Forecast Dashboard & Donut Charts Template for PowerPoint & Google Slides
Pie/Donut
Risk Level Gauge Comparison Dashboard Template for PowerPoint & Google Slides
Comparison
Inventory Management Dashboard Template for PowerPoint & Google Slides
Process
Digital Marketing KPIs Dashboard Dark Template for PowerPoint & Google Slides
Business Report
Employee Performance Metrics Dashboard Template for PowerPoint & Google Slides
Employee Performance
Turnover Analysis Dashboard Template for PowerPoint & Google Slides
Employee Performance
Project Tracking Dashboard Table Template for PowerPoint & Google Slides
Project Status
Action Items Management Dashboard Table Template for PowerPoint & Google Slides
Project Status
Electronic Health Records Dashboard template for PowerPoint & Google Slides
Health
Customer Interview Insights Dashboard Template for PowerPoint & Google Slides
Customer Experience
Project Status Dashboard Report Template for PowerPoint & Google Slides
Project Status
Project Status Update Dashboard Table Template for PowerPoint & Google Slides
Project Status
Cohort Analysis Retention Dashboard Template for PowerPoint & Google Slides
Comparison Chart
Project Status Dashboard Template for PowerPoint & Google Slides
Project Status
Dashboard Project Status Template for PowerPoint & Google Slides
Project Status
Project Status Template Dashboard with Gauge for PowerPoint & Google Slides
Project Status
Task Completion Rate Dashboard Template for PowerPoint & Google Slides
Business
Project Status Dashboard with RAG Legend Template for PowerPoint & Google Slides
Project Status
End of Year Review Dashboard Template for PowerPoint & Google Slides
Business Report
Construction Project Dashboard Template for PowerPoint & Google Slides
Project
Employee Headcount Dashboard Report Template for PowerPoint & Google Slides
Employee Performance
Dashboard Templates for PowerPoint & Google Slides
Bar/Column
Free Infographic Statistics Dashboard Slide for PowerPoint & Google Slides
Bar/Column
Free
Engineering Maintenance Dashboard Slide for PowerPoint & Google Slides
Software Development
Incident Tracking Dashboard for PowerPoint & Google Slides
Business Plan
MVP Product Roadmap Delivery Dashboard for PowerPoint & Google Slides
Roadmap
Free Data Analytics Dashboard Template for PowerPoint
Charts
Free
Free TikTok Marketing Analytics Overview Template for PowerPoint & Google Slides
Company Profile
Free
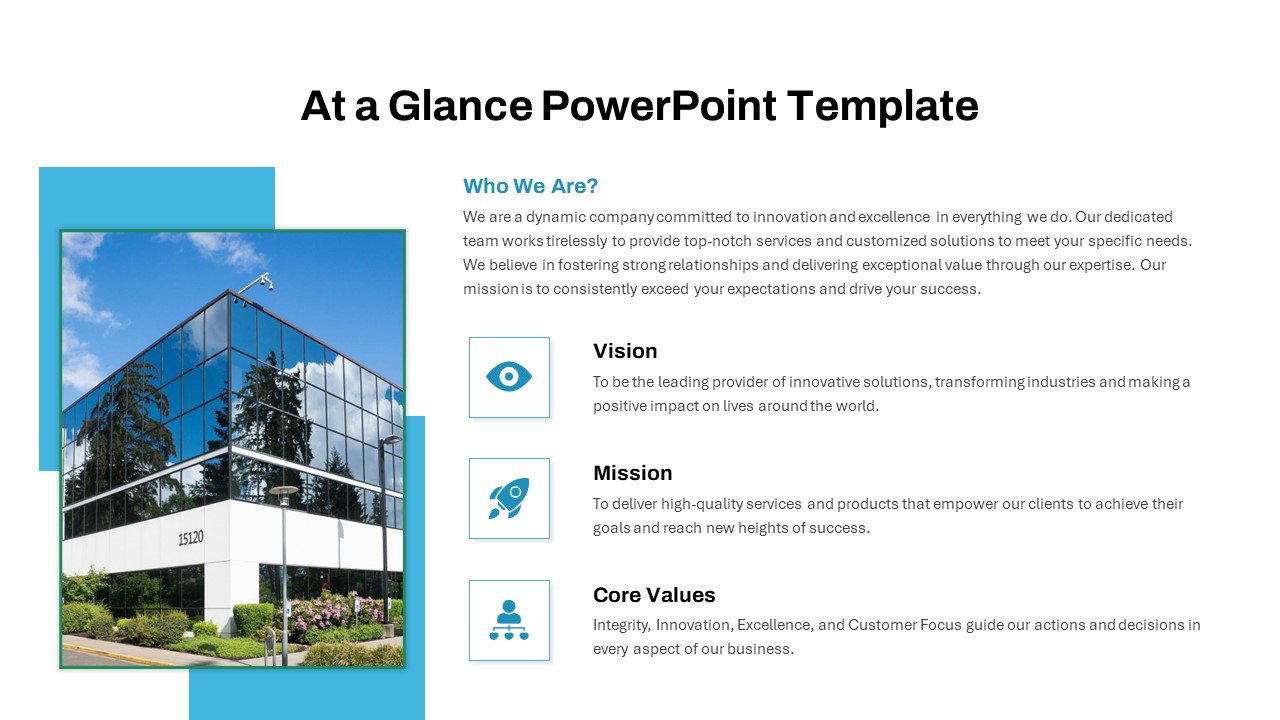
At a Glance Company Profile Overview Template for PowerPoint & Google Slides
Company Profile