Cost Summary Table Template for PowerPoint & Google Slides
Description
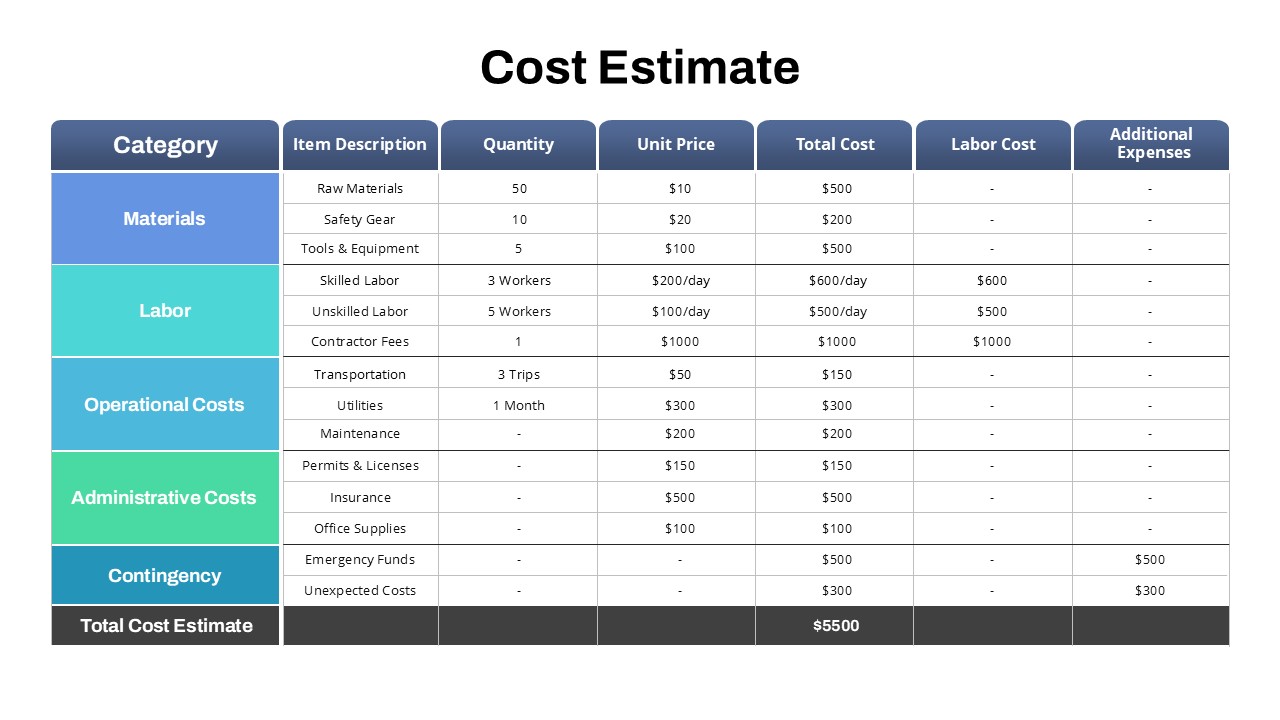
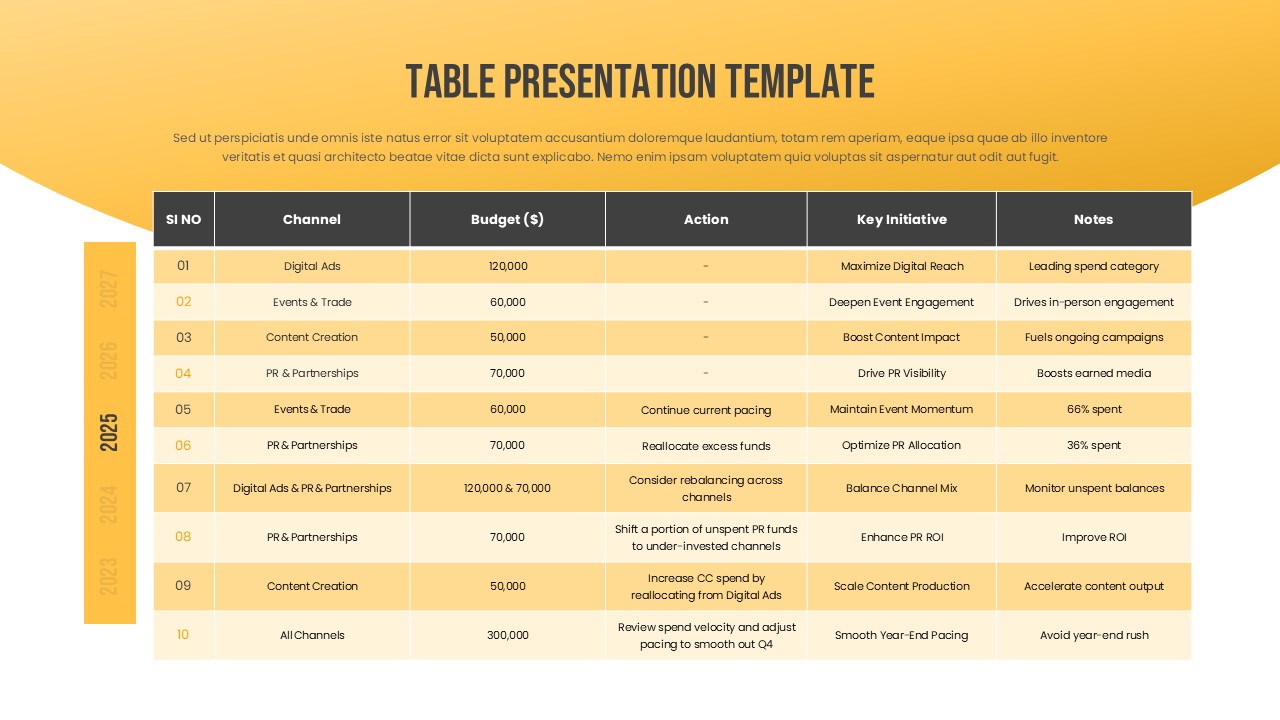
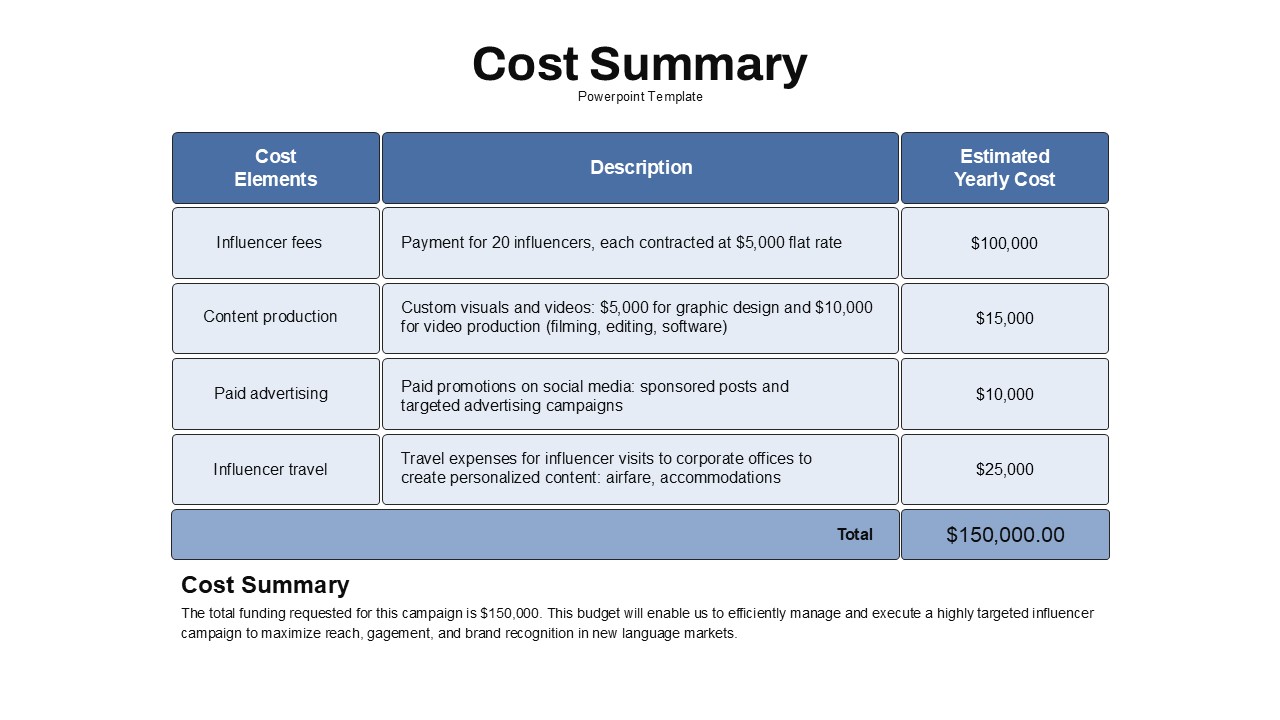
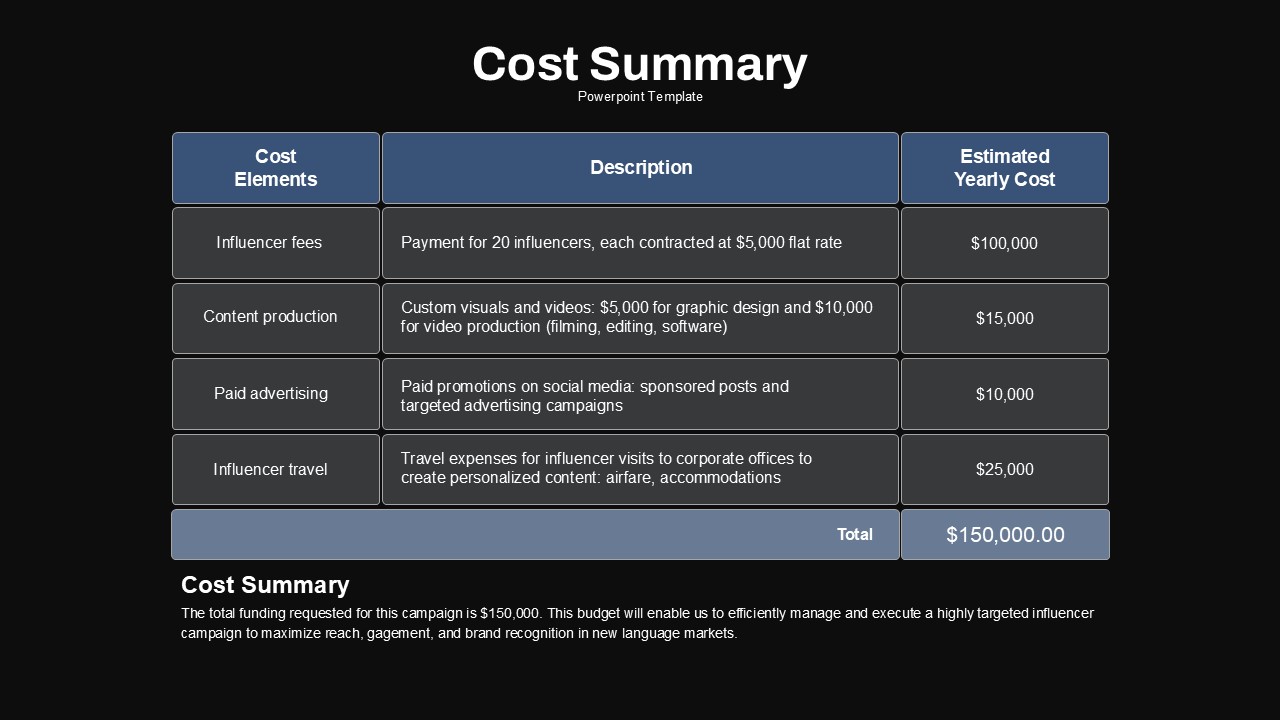
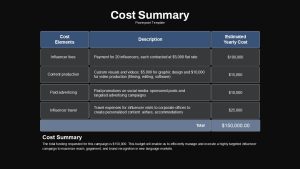
Use this cost summary slide to present a clear, professional budget breakdown for influencer campaigns or project proposals. The three-column table features cost elements, detailed descriptions, and estimated yearly costs, culminating in a total row for quick reference. A bold blue header row contrasts with light-blue cells, crisp borders, and minimalist typography to ensure your financial data takes center stage.
Built on fully editable master slides in PowerPoint and Google Slides, every table component—from headers and cells to the total row—is unlocked for seamless customization. Apply your brand palette across header fills and cell accents in seconds with theme color settings. Swap placeholder labels and cost values or adjust the number of rows and columns to suit diverse budgeting scenarios. Vector shapes and locked aspect ratios guarantee pixel-perfect alignment and sharp visuals, whether you’re presenting on screen, exporting to PDF, or printing high-resolution handouts.
Preconfigured animations (PowerPoint only) offer subtle fade-in or wipe effects for table rows, guiding audience attention during presentations. Alternative slide variants let you switch header styles, introduce icon placeholders next to cost items, or toggle between light and dark backgrounds for maximum readability. Seamlessly integrate this slide into larger decks with preserved master layouts for global updates and real-time collaboration via shared Google Slides links.
Who is it for
Financial analysts, marketing managers, and project sponsors will find this cost summary table invaluable for presenting budget requests, campaign funding proposals, or expense audits. Consultants, business development teams, and C-level executives can leverage its clear layout to communicate financial plans and secure stakeholder approval.
Other Uses
Beyond cost summaries, repurpose this template to compare revenue forecasts, outline resource allocations, or display quarterly financial metrics. Adapt the table structure to present ROI calculations, vendor cost comparisons, or departmental budget overviews for board meetings, training sessions, or strategic workshops.
Login to download this file

Item ID
SB04876
Related Templates

Project Detailed Cost Estimate Table Template for PowerPoint & Google Slides
Project
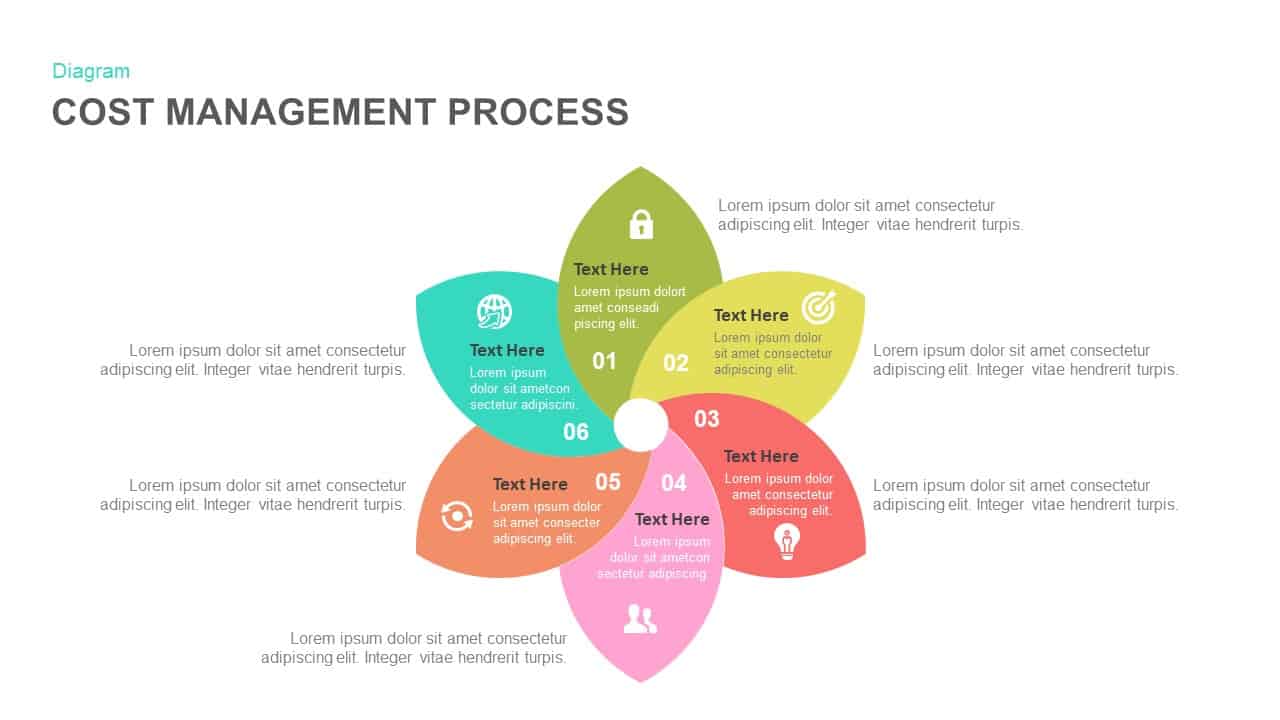
Cost Management Process template for PowerPoint & Google Slides
Process
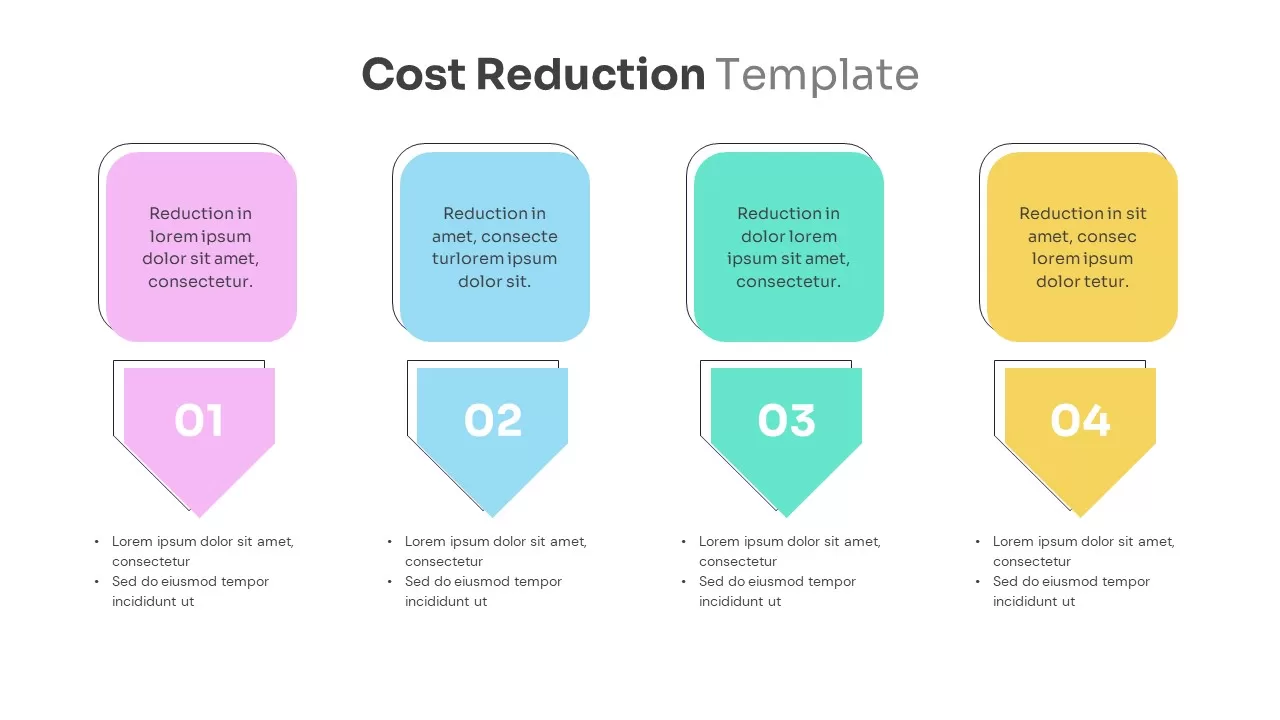
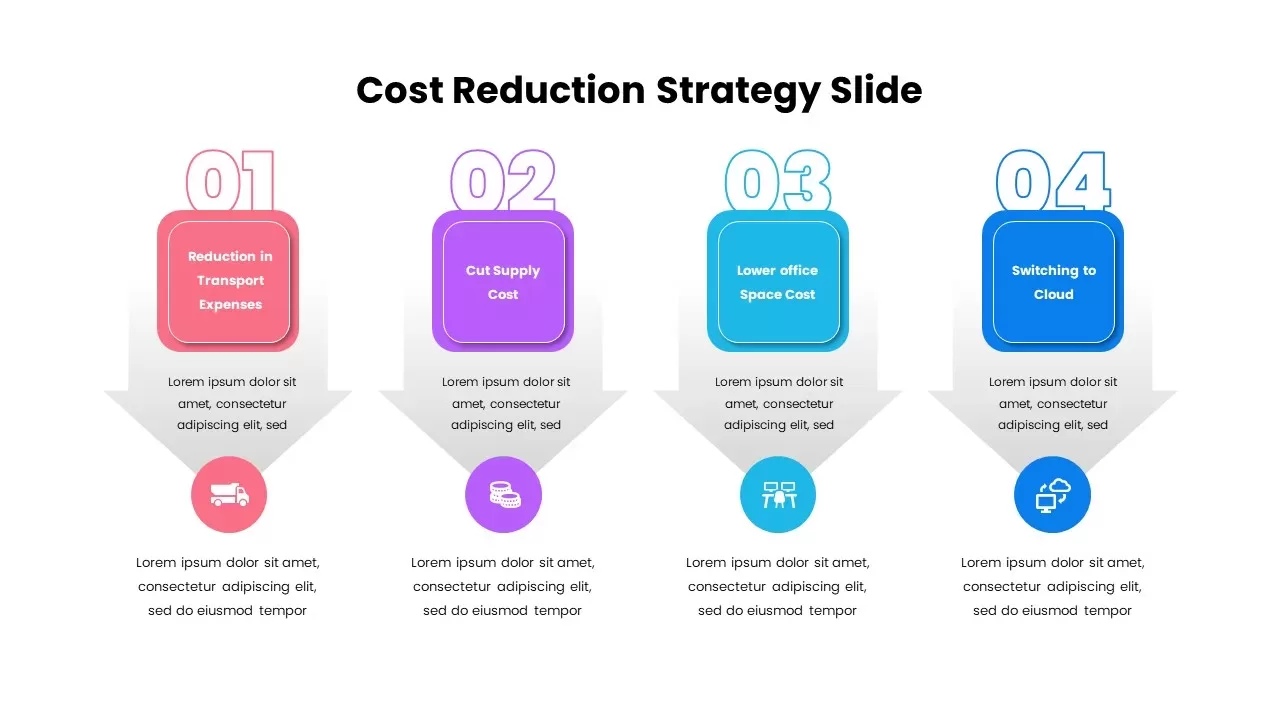
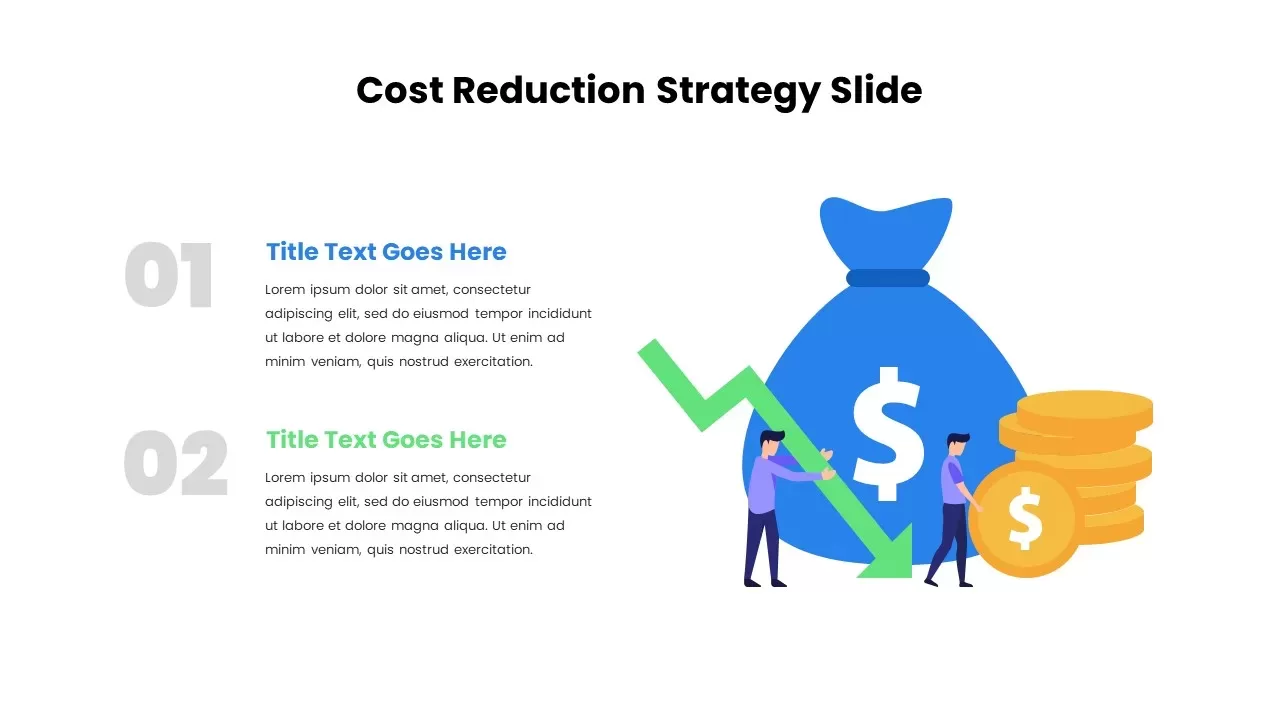
Cost Reduction Strategy template for PowerPoint & Google Slides
Business Strategy
Dual-Color Cost vs Benefit Analysis Template for PowerPoint & Google Slides
Comparison
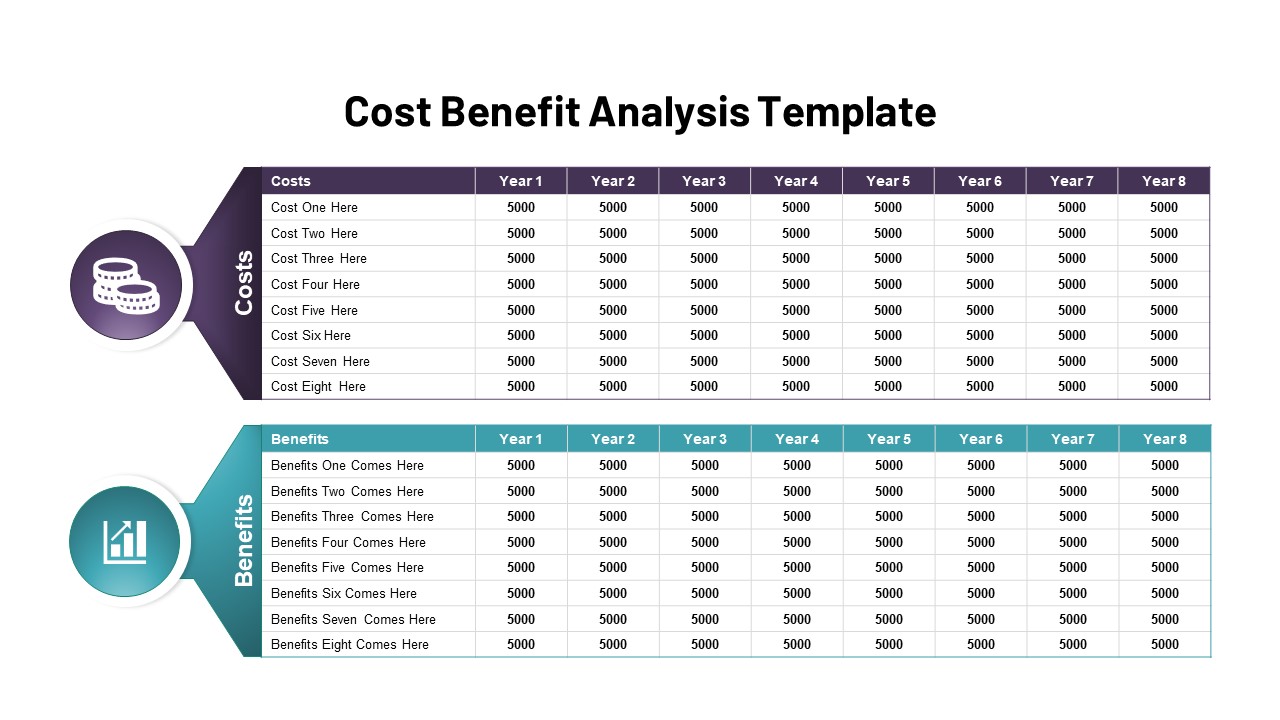
Cost Benefit Analysis Comparison Template for PowerPoint & Google Slides
Comparison
Four-Step Cost Reduction Strategy Template for PowerPoint & Google Slides
Process
Cost Reduction Strategy Donut Chart Template for PowerPoint & Google Slides
Pie/Donut
Cost Reduction Infographic Template for PowerPoint & Google Slides
Process
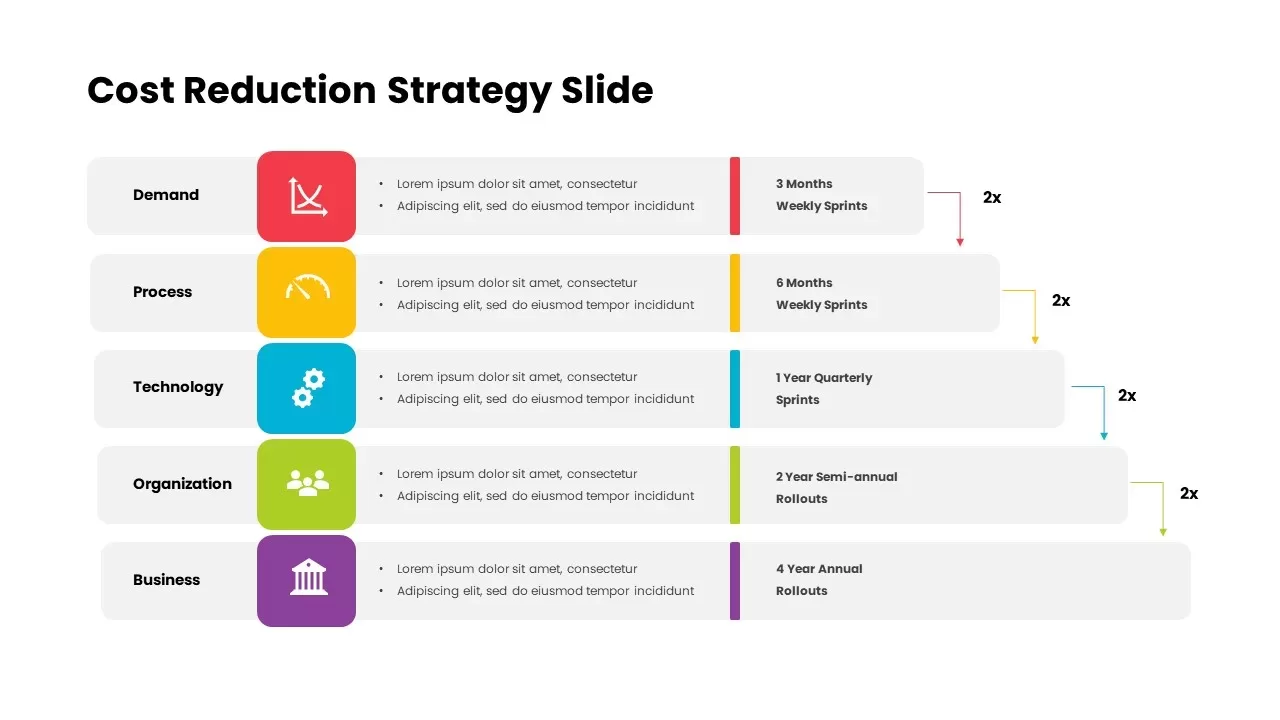
Cost Reduction Strategy Roadmap Template for PowerPoint & Google Slides
Business Strategy
Interactive Multi-Use Cost Comparison Template for PowerPoint & Google Slides
Comparison
Cost Cutting Savings Dashboard Template for PowerPoint & Google Slides
Pie/Donut
Sunk Cost Fallacy Dragging Anchor Slide Template for PowerPoint & Google Slides
Infographics
Cost-Volume-Profit Analysis Diagram Template for PowerPoint & Google Slides
Finance
Economies of Scale Cost Curve Comparison Template for PowerPoint & Google Slides
Comparison Chart
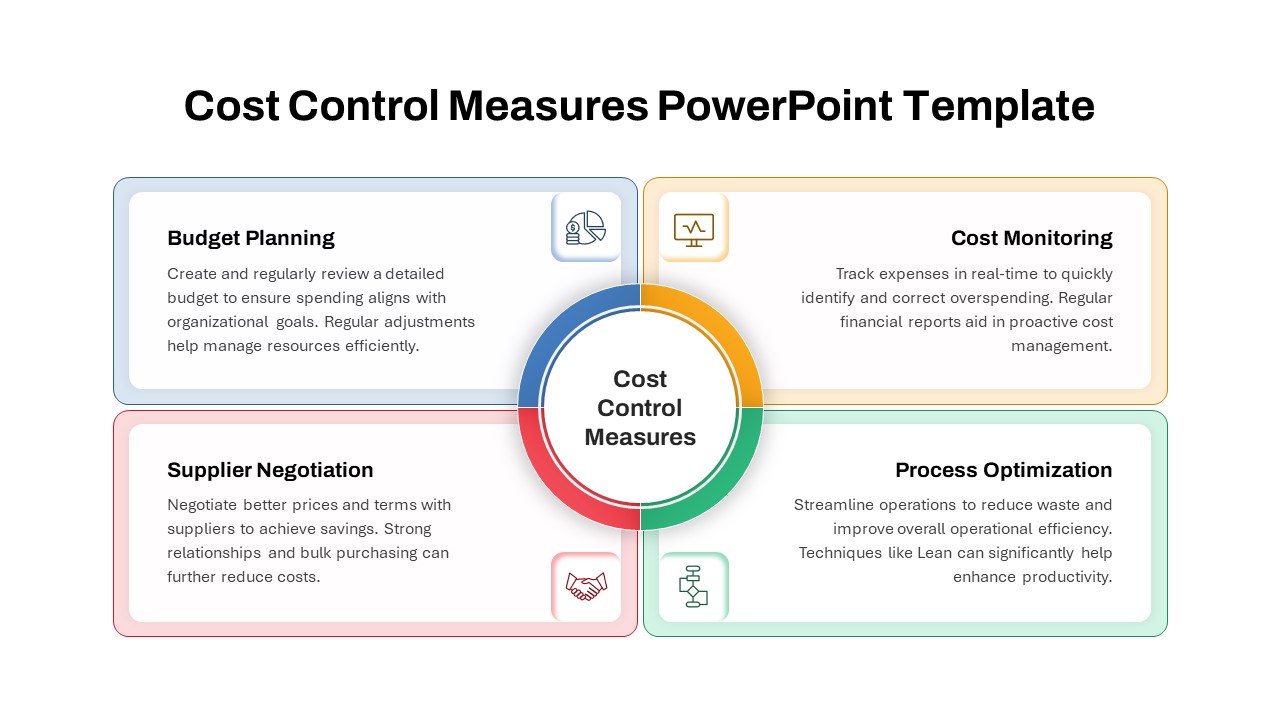
Cost Control Measures Infographic Template for PowerPoint & Google Slides
Circular
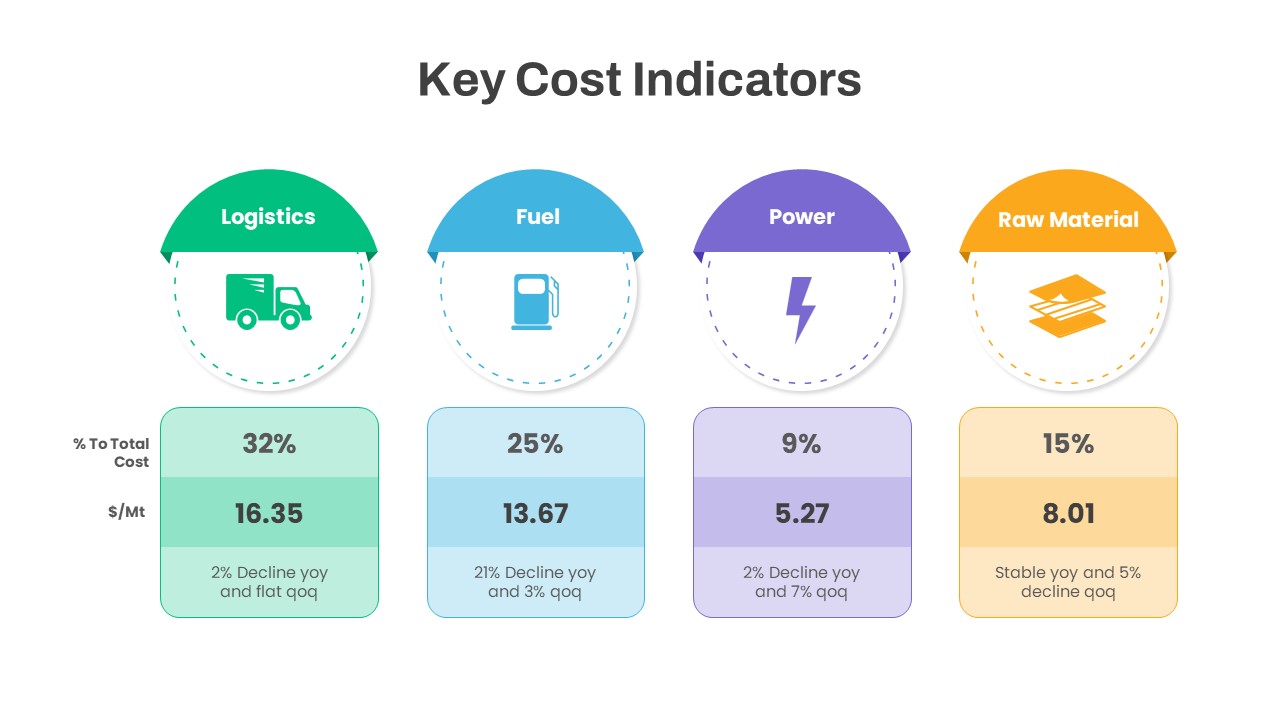
Key Cost Indicators Infographic Template for PowerPoint & Google Slides
Finance
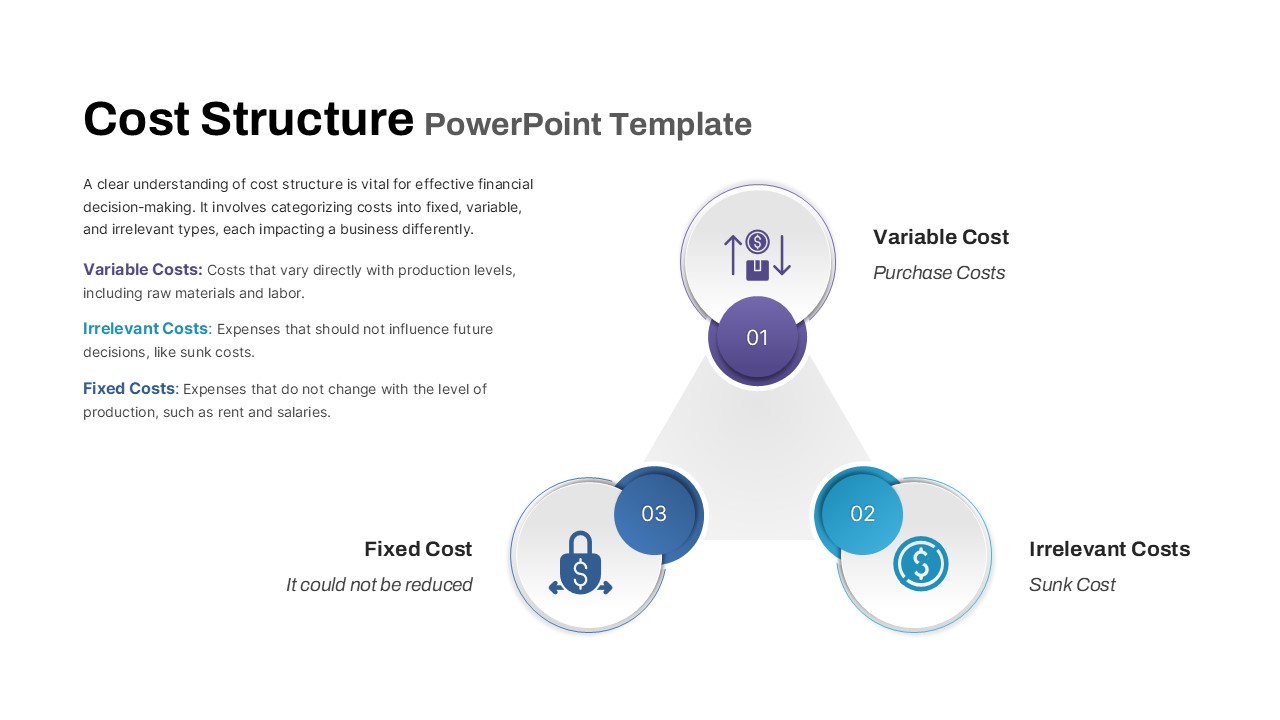
Cost Structure Triangle Diagram Template for PowerPoint & Google Slides
Finance
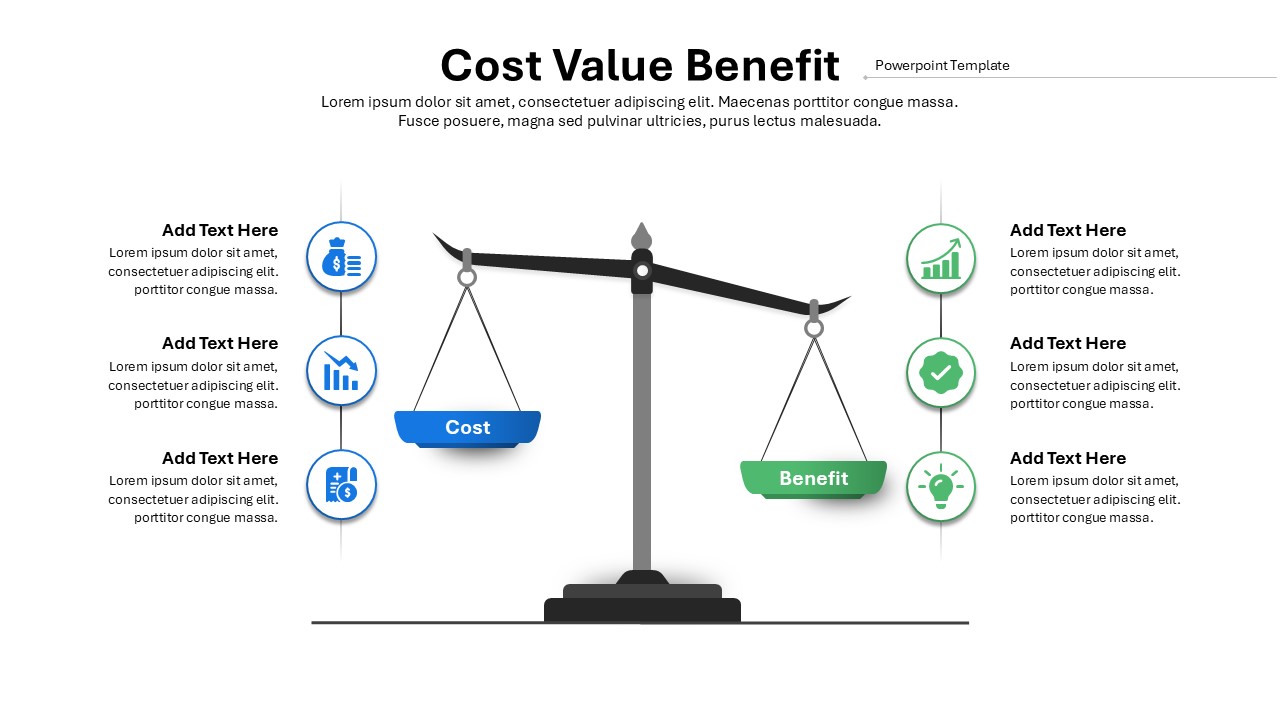
Cost vs Benefit template for PowerPoint & Google Slides
Charts
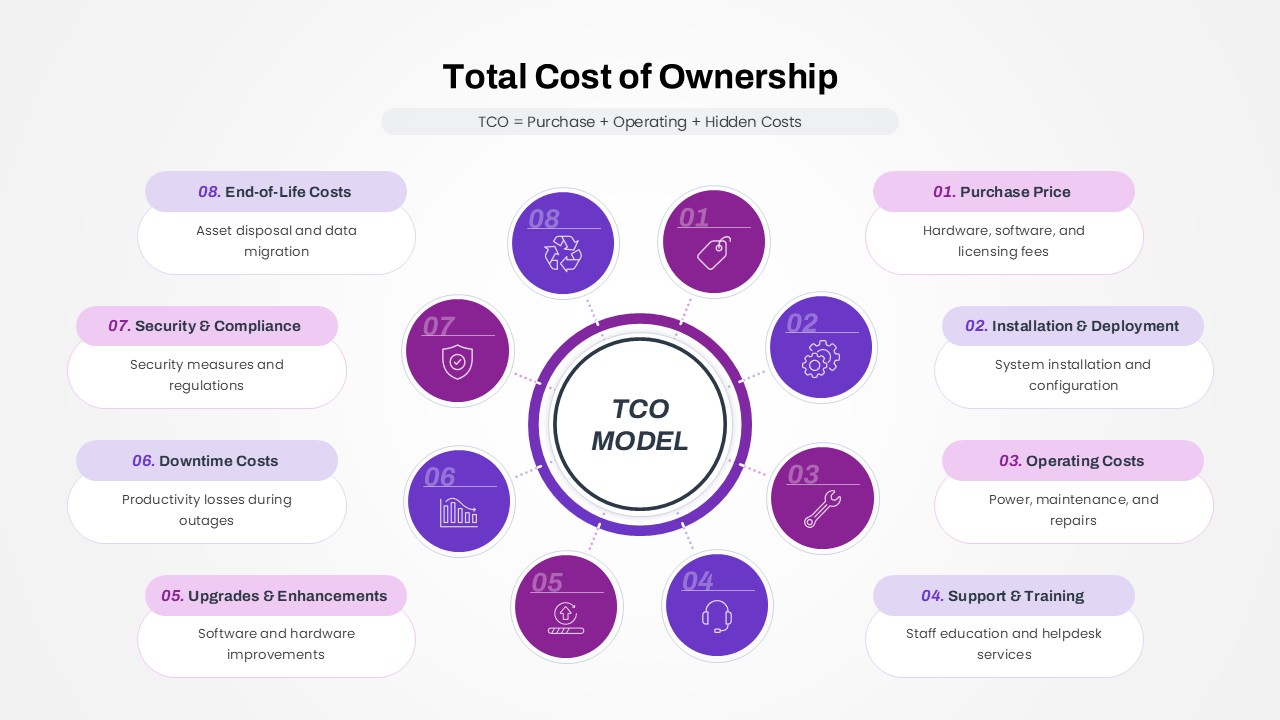
Total Cost of Ownership (TCO) Model template for PowerPoint & Google Slides
Business
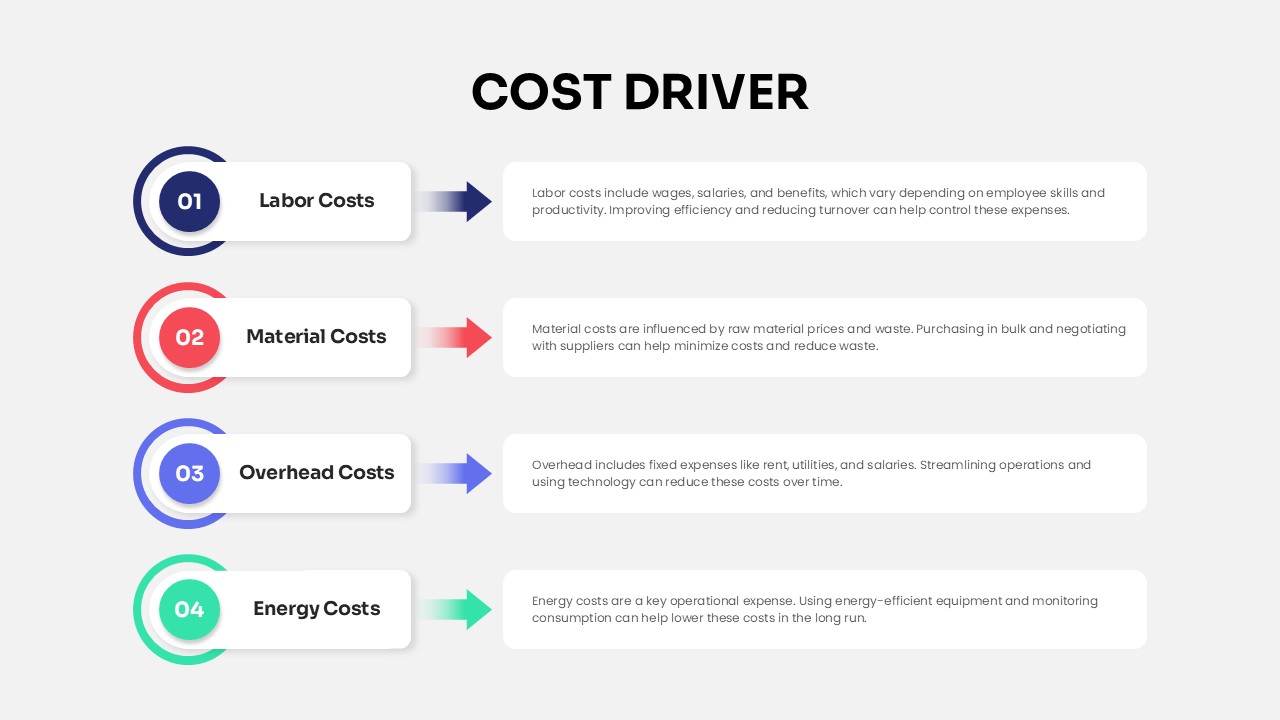
Cost Driver Infographic Slide Pack Template for PowerPoint & Google Slides
Process
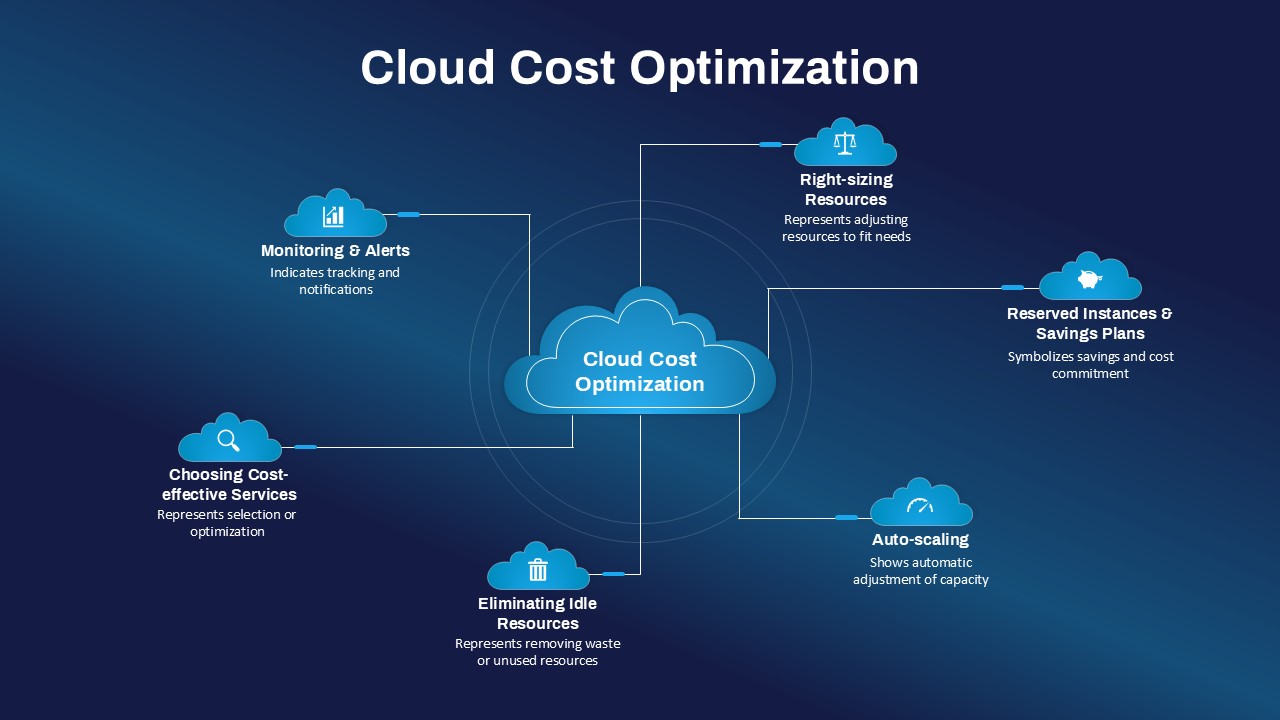
Cloud Cost Optimization Hub-and-Spoke Template for PowerPoint & Google Slides
Cloud Computing
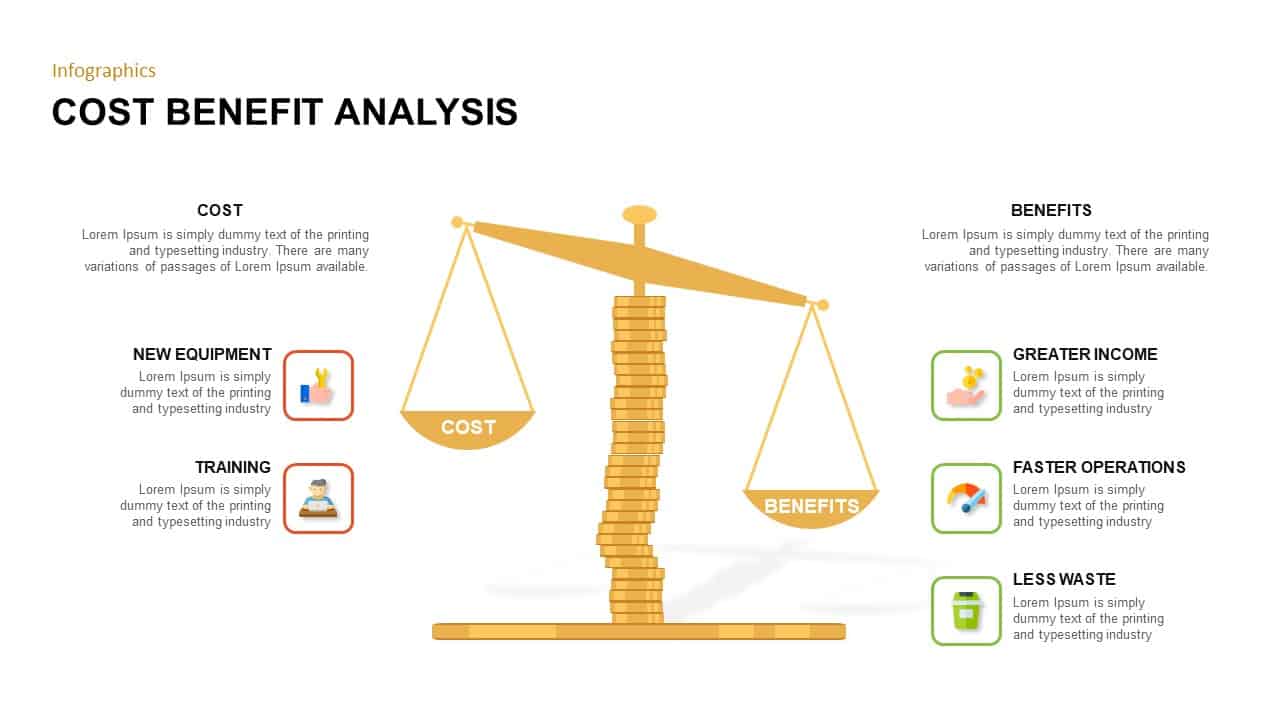
Cost Benefit Analysis infographic for PowerPoint & Google Slides
Comparison
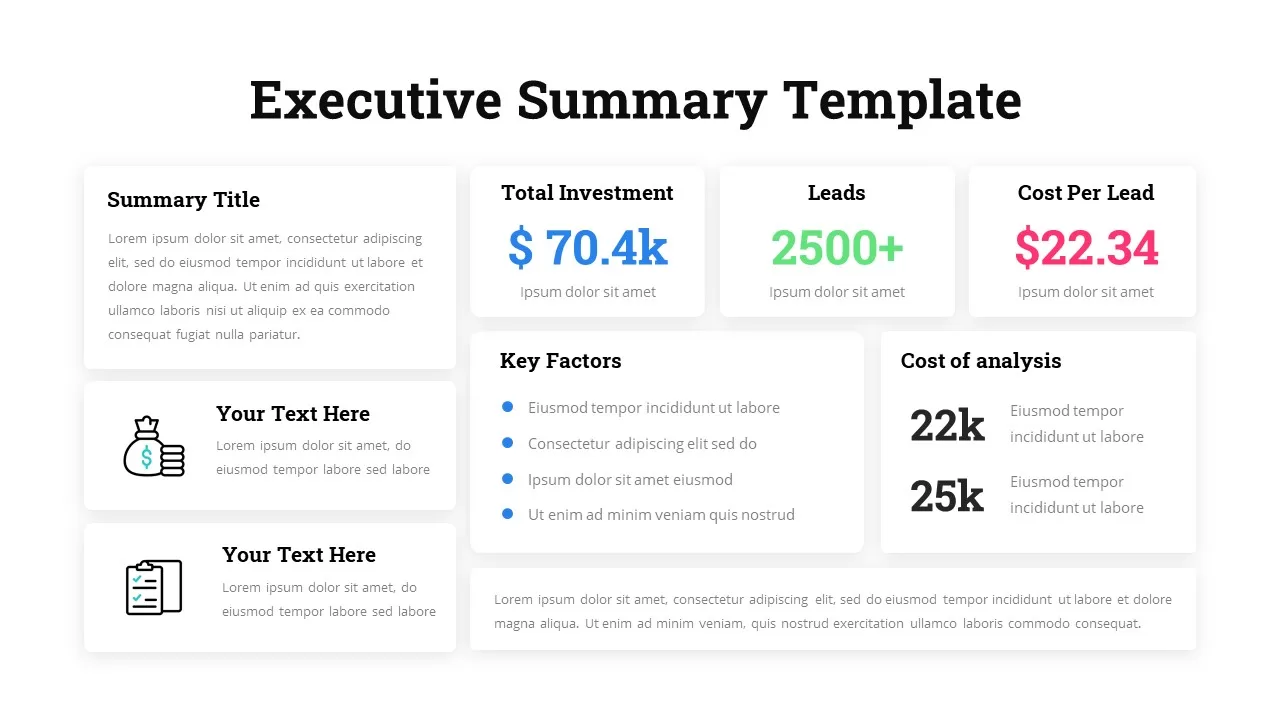
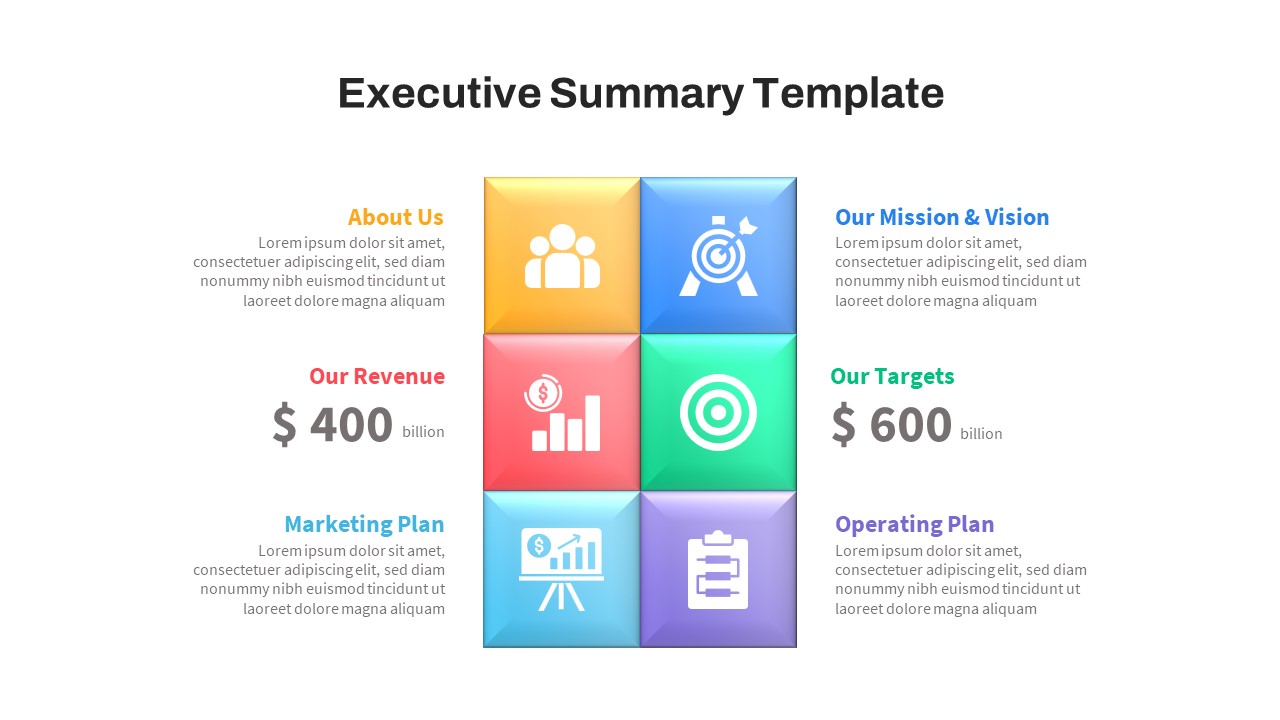
Executive Summary template for PowerPoint & Google Slides
Business
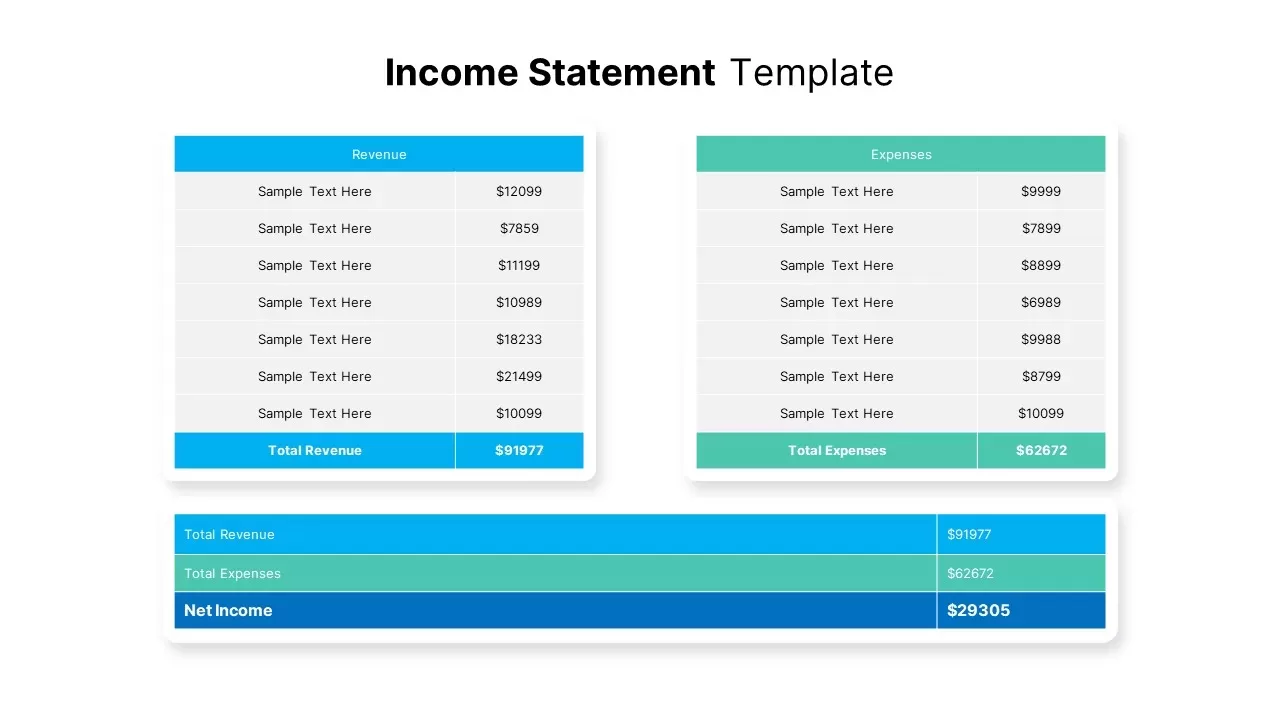
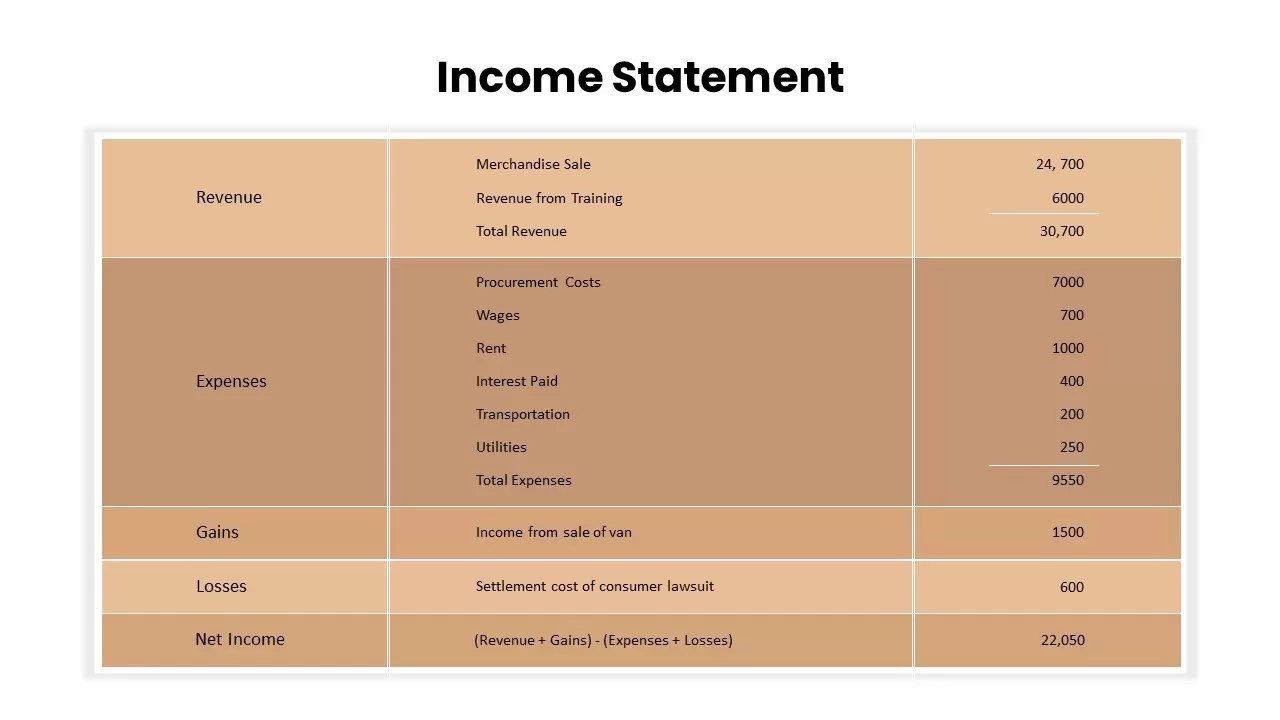
Income Statement Financial Summary Template for PowerPoint & Google Slides
Business Report
Free Executive Summary Template for PowerPoint & Google Slides
Business
Free
Quarterly Financial Summary Dashboard Template for PowerPoint & Google Slides
Business Report
Startup Executive Summary Template for PowerPoint & Google Slides
Business Report
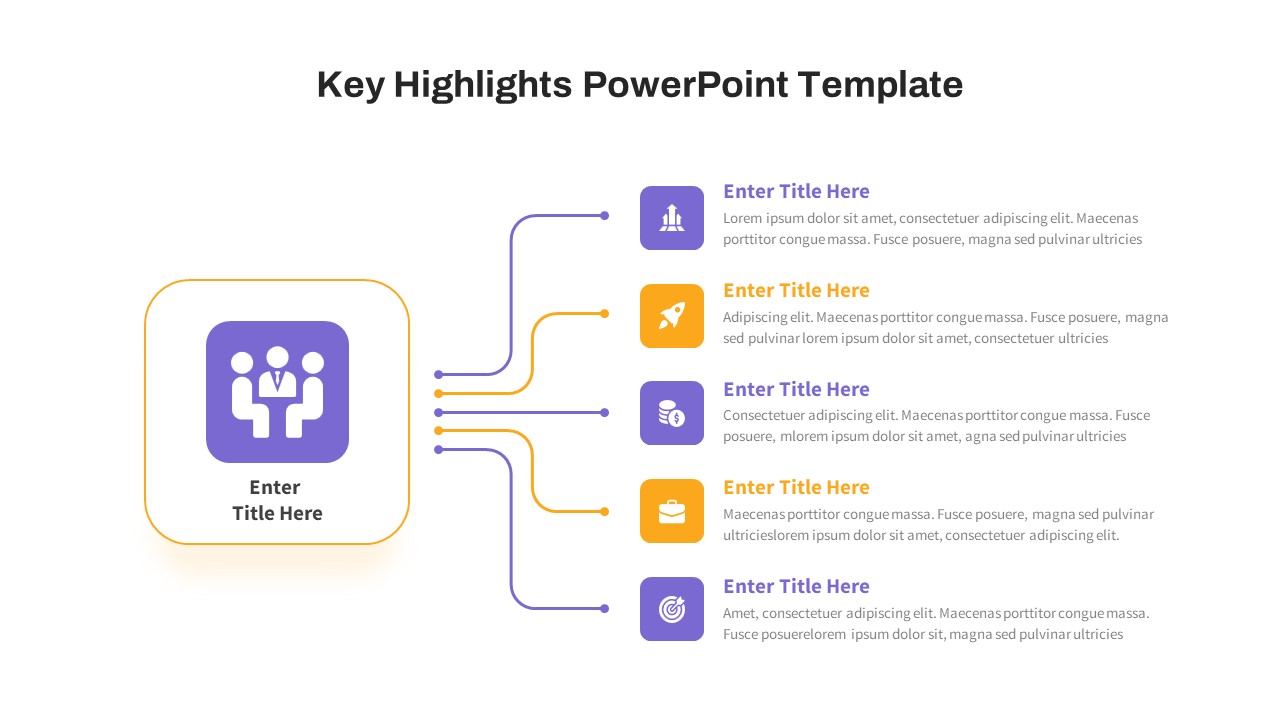
Free Key Highlights Business Summary Slide for PowerPoint & Google Slides
Accomplishment
Free
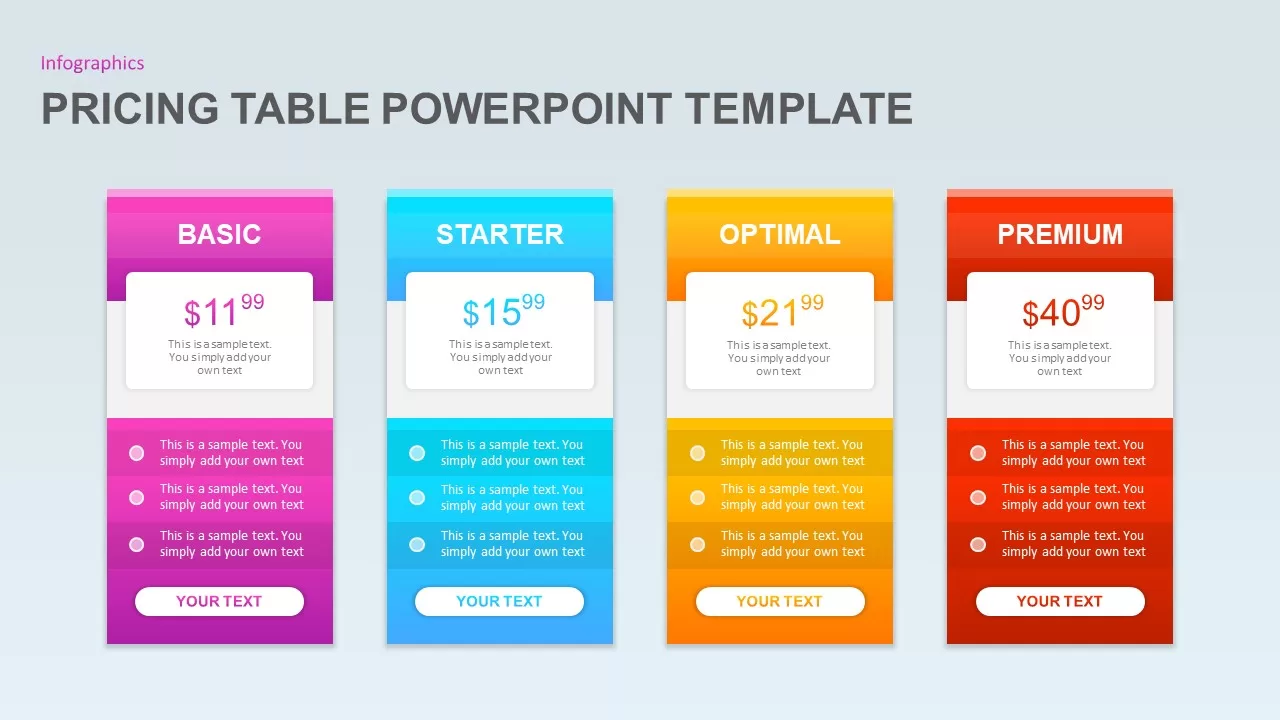
Pricing Table PowerPoint Template for PowerPoint & Google Slides
Infographics
Simple Comparison Table Template for PowerPoint & Google Slides
Comparison
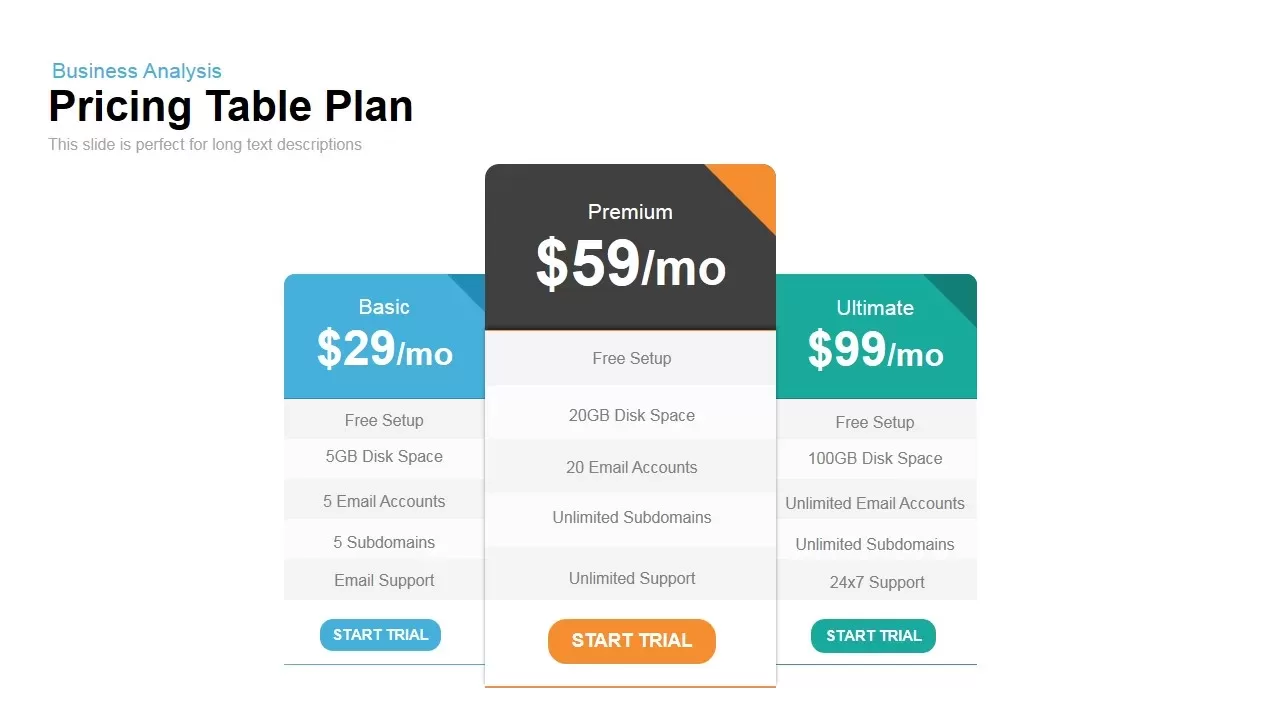
Three-Tier Pricing Table Slide Template for PowerPoint & Google Slides
Comparison
Four-Tier Pricing Comparison Table Template for PowerPoint & Google Slides
Comparison
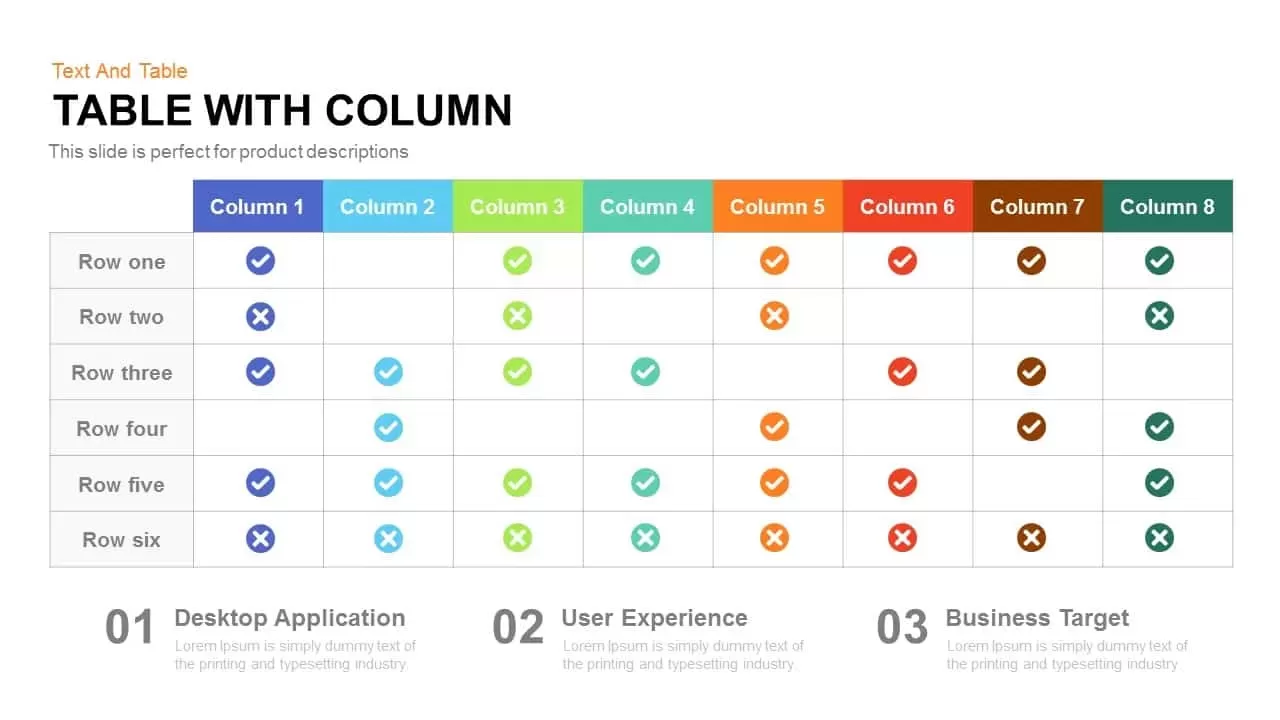
Table with Columns template for PowerPoint & Google Slides
Comparison Chart
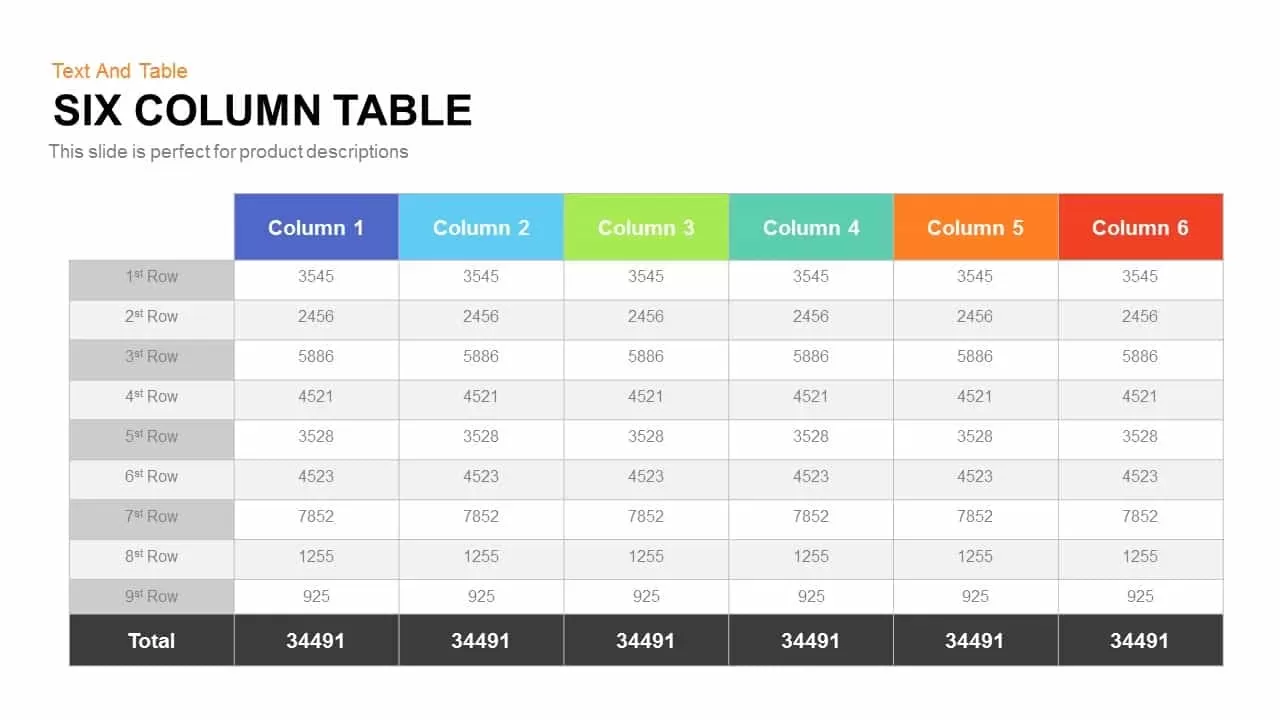
Six Column Table template for PowerPoint & Google Slides
Table
Four-Plan Pricing Table Comparison Template for PowerPoint & Google Slides
Comparison
Dynamic Multicolor Comparison Table Template for PowerPoint & Google Slides
Comparison
Puzzle-Style SWOT Analysis Table Diagram Template for PowerPoint & Google Slides
SWOT

Comparison Pricing Table Infographic Template for PowerPoint & Google Slides
Comparison Chart
PESTLE Analysis Table Layout Diagram Template for PowerPoint & Google Slides
PEST
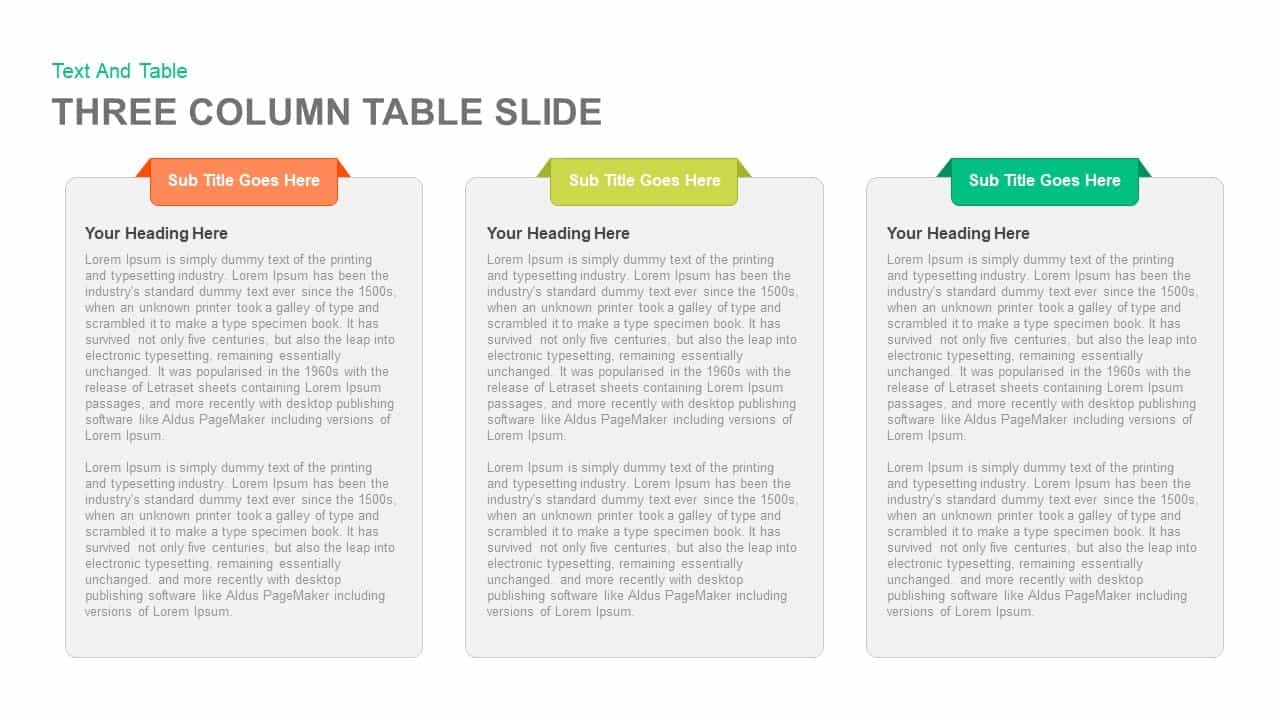
Clean Three-Four Column Table Slide Template for PowerPoint & Google Slides
Business Report
Five-Option Text Boxes Table Comparison Template for PowerPoint & Google Slides
Business Report
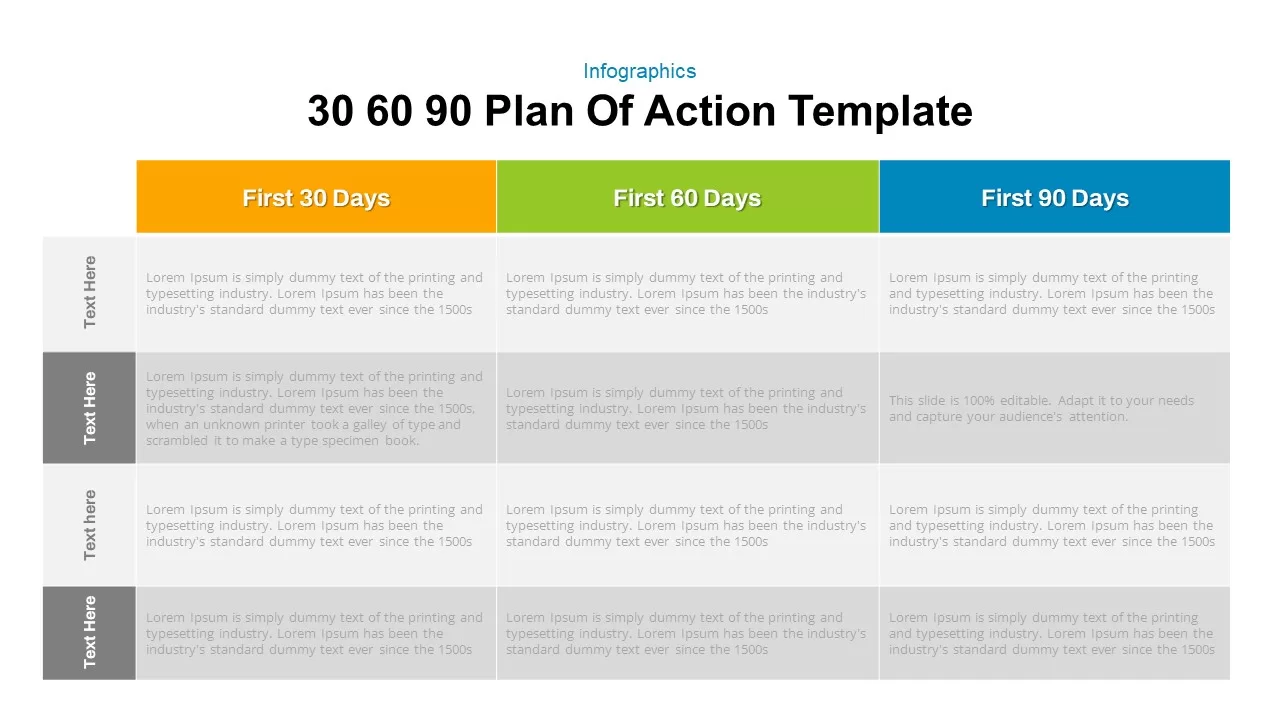
30 60 90 Day Plan Matrix Table Template for PowerPoint & Google Slides
Timeline
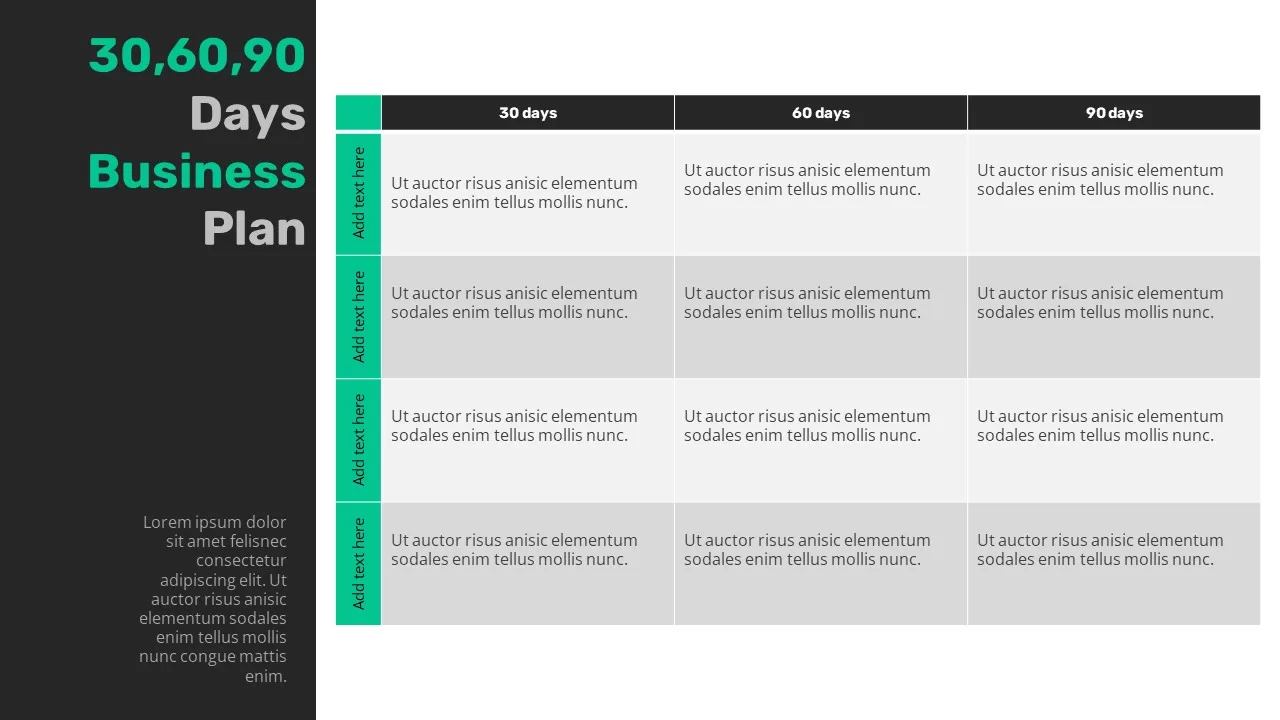
30-60-90 Business Plan Table Template for PowerPoint & Google Slides
Timeline
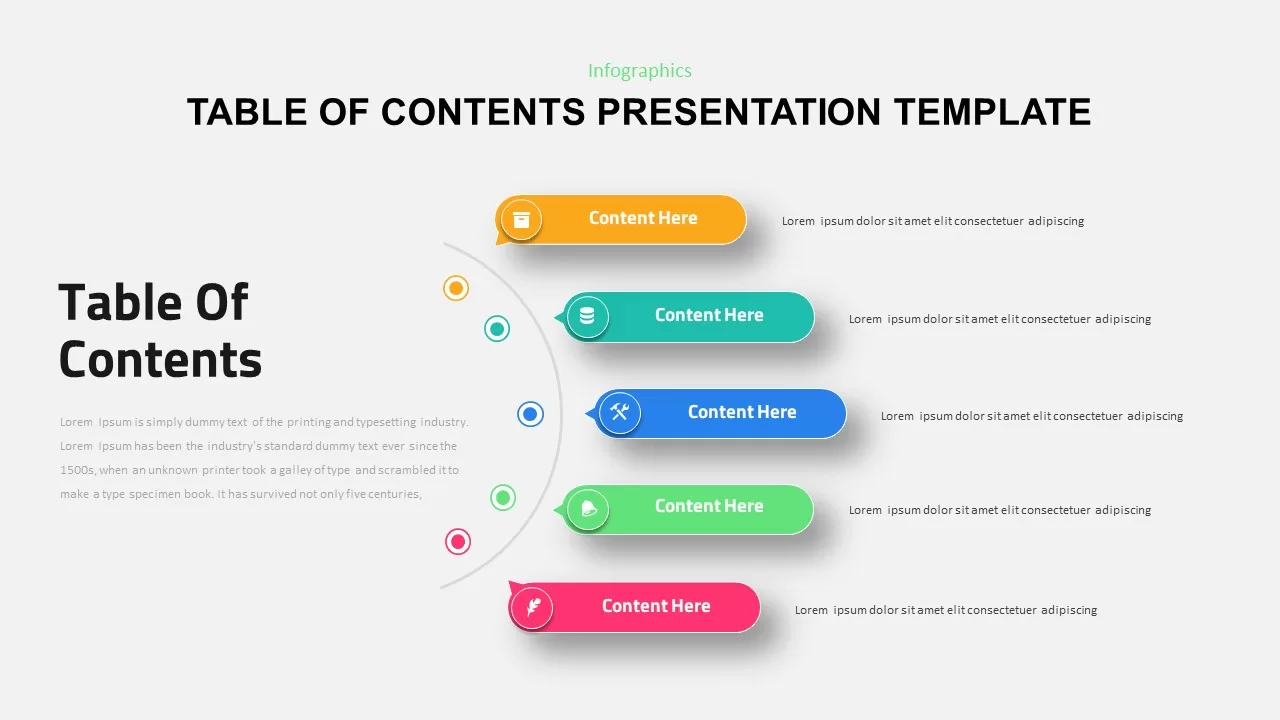
Table of Contents Presentation template for PowerPoint & Google Slides
Agenda
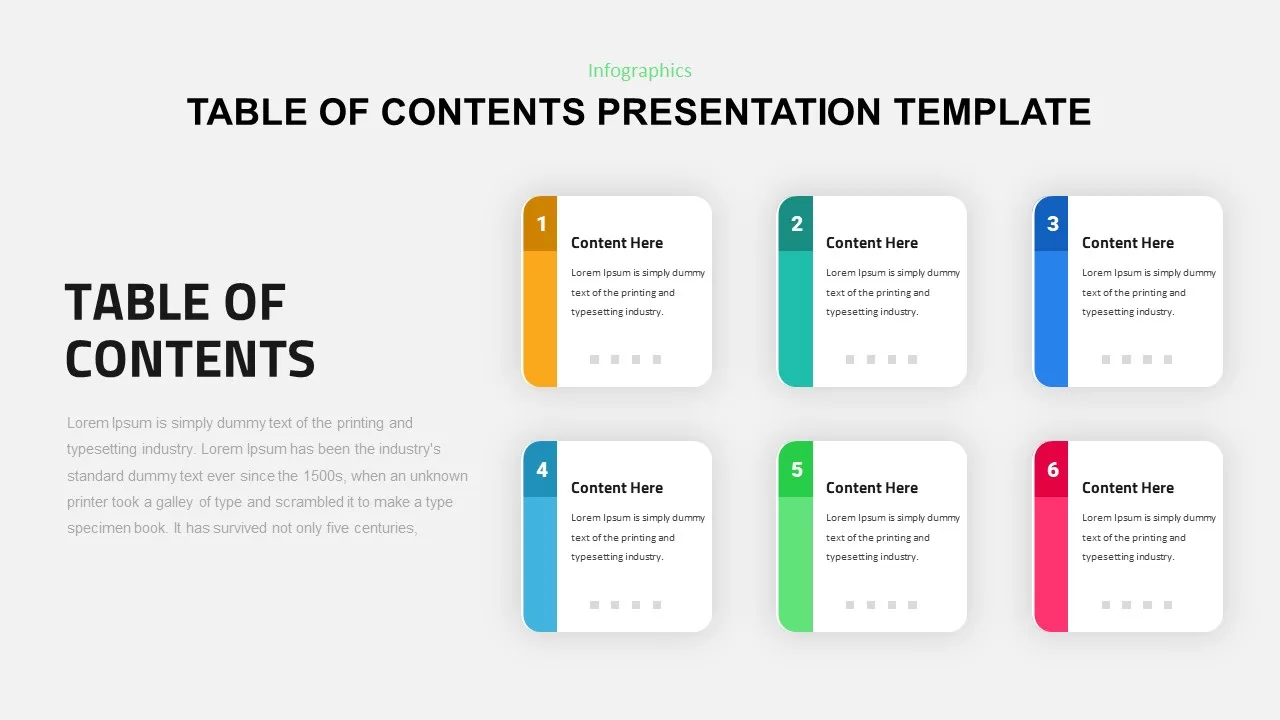
Six-Step Color-Coded Table of Contents Template for PowerPoint & Google Slides
Agenda
Table of Contents Infographic Slide template for PowerPoint & Google Slides
Agenda
Six-Step Table of Contents Infographic Template for PowerPoint & Google Slides
Agenda
Eight-Step Colorful Table of Contents Template for PowerPoint & Google Slides
Infographics
Four-Part Table of Contents Infographic Template for PowerPoint & Google Slides
Agenda
Five-Step Table of Contents Presentation Template for PowerPoint & Google Slides
Agenda
Four-Step Numbered Table of Contents Template for PowerPoint & Google Slides
Agenda
Four-Step Table of Contents Presentation Template for PowerPoint & Google Slides
Agenda
Chevron Table of Contents Presentation Template for PowerPoint & Google Slides
Agenda
Four-Step Agenda Table of Contents Template for PowerPoint & Google Slides
Agenda
Modern Four-Step Table of Contents Template for PowerPoint & Google Slides
Agenda
Four-Step Strategic Table of Contents Template for PowerPoint & Google Slides
Agenda
Table of Contents Infographics template for PowerPoint & Google Slides
Company Profile
Income Statement Overview Table Template for PowerPoint & Google Slides
Finance
Project Status Dashboard Table Template for PowerPoint & Google Slides
Project Status
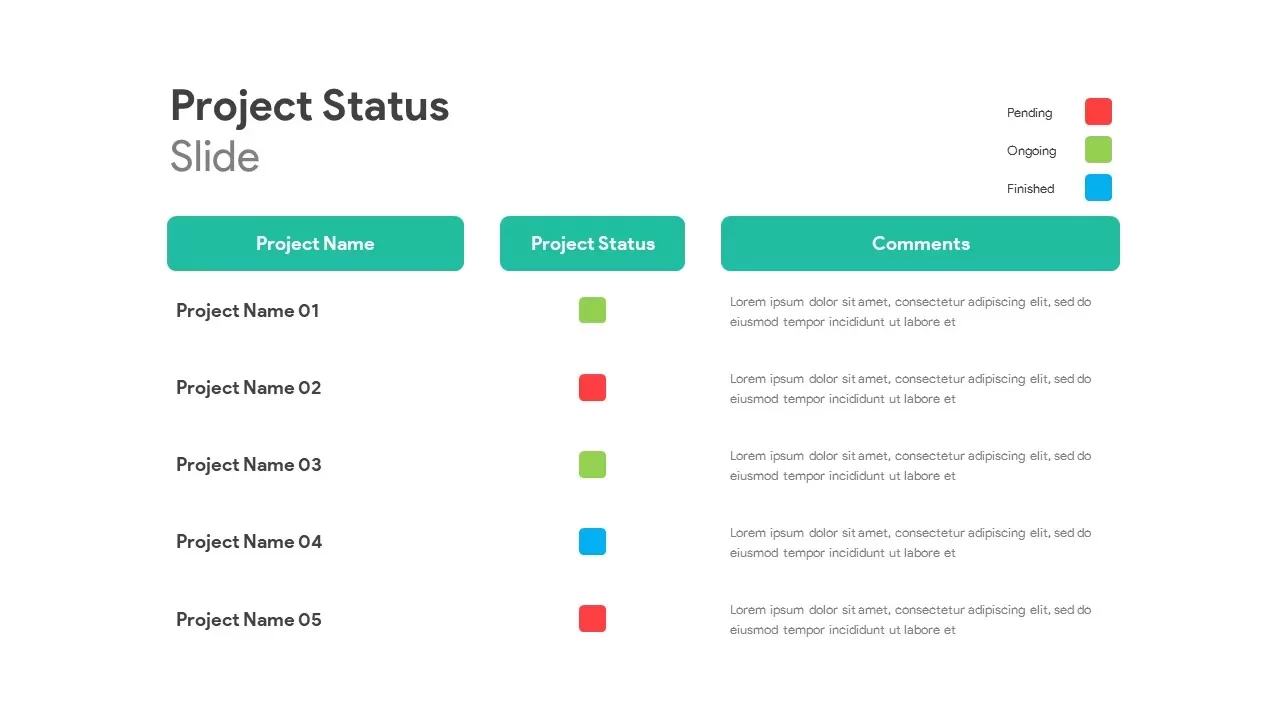
Project Status Table Template for PowerPoint & Google Slides
Project Status
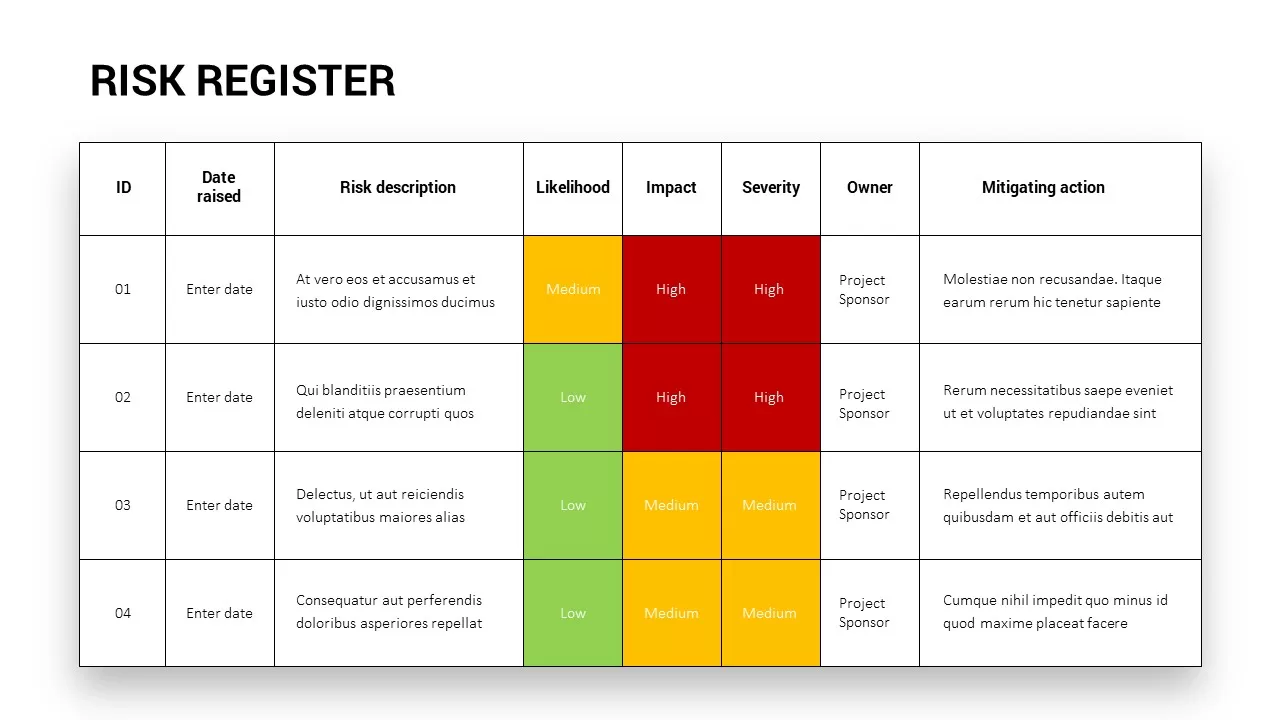
Comprehensive Risk Register Table Template for PowerPoint & Google Slides
Risk Management
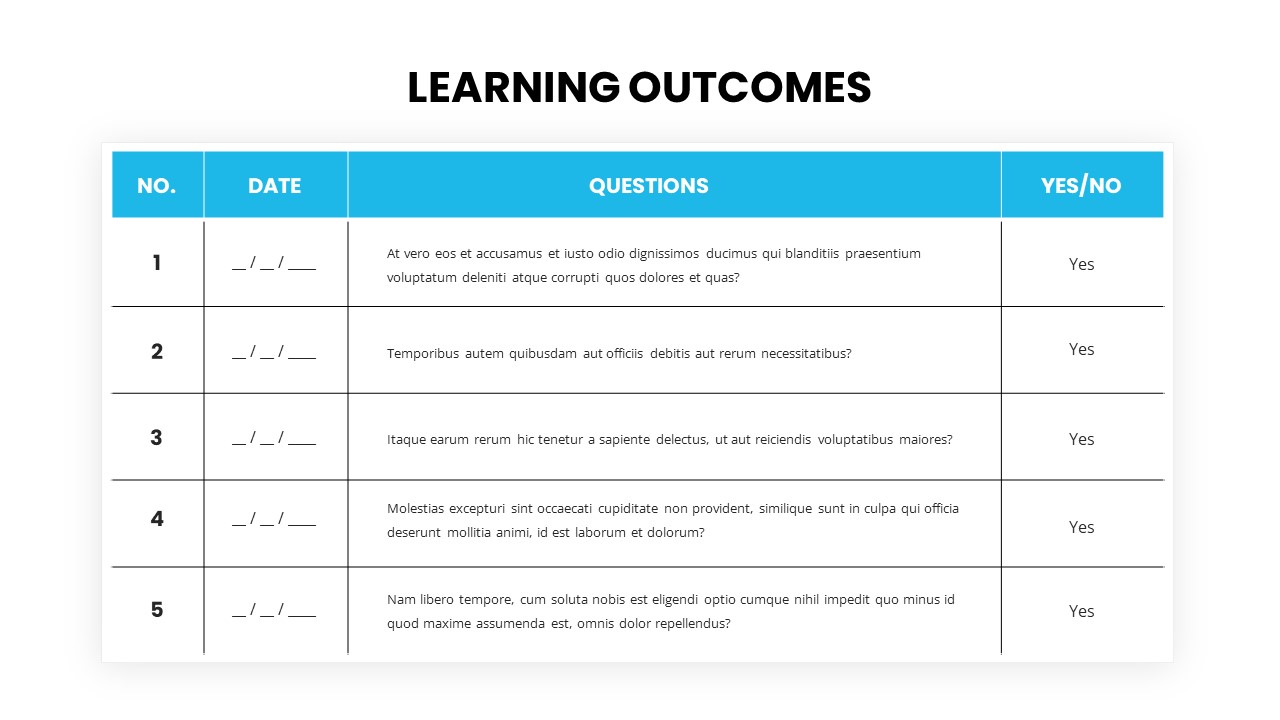
Learning Outcomes table template for PowerPoint & Google Slides
Charts
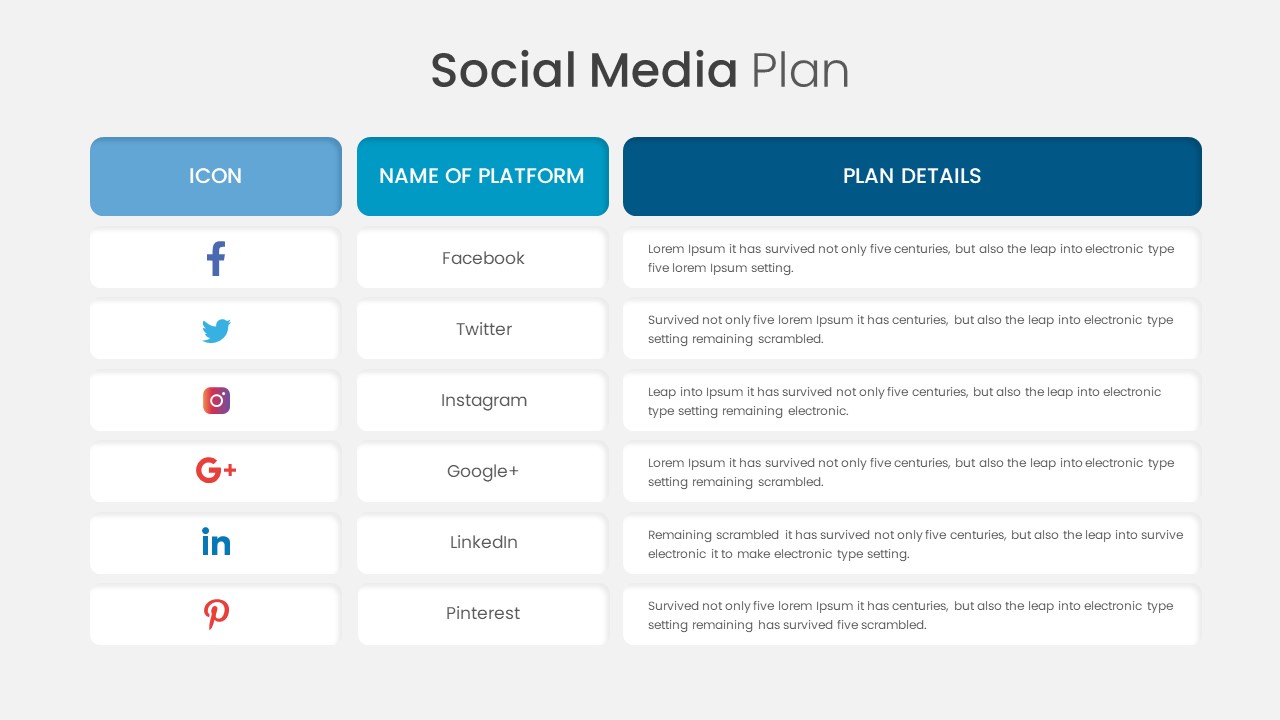
Social Media Plan Table Slide Deck Template for PowerPoint & Google Slides
Process
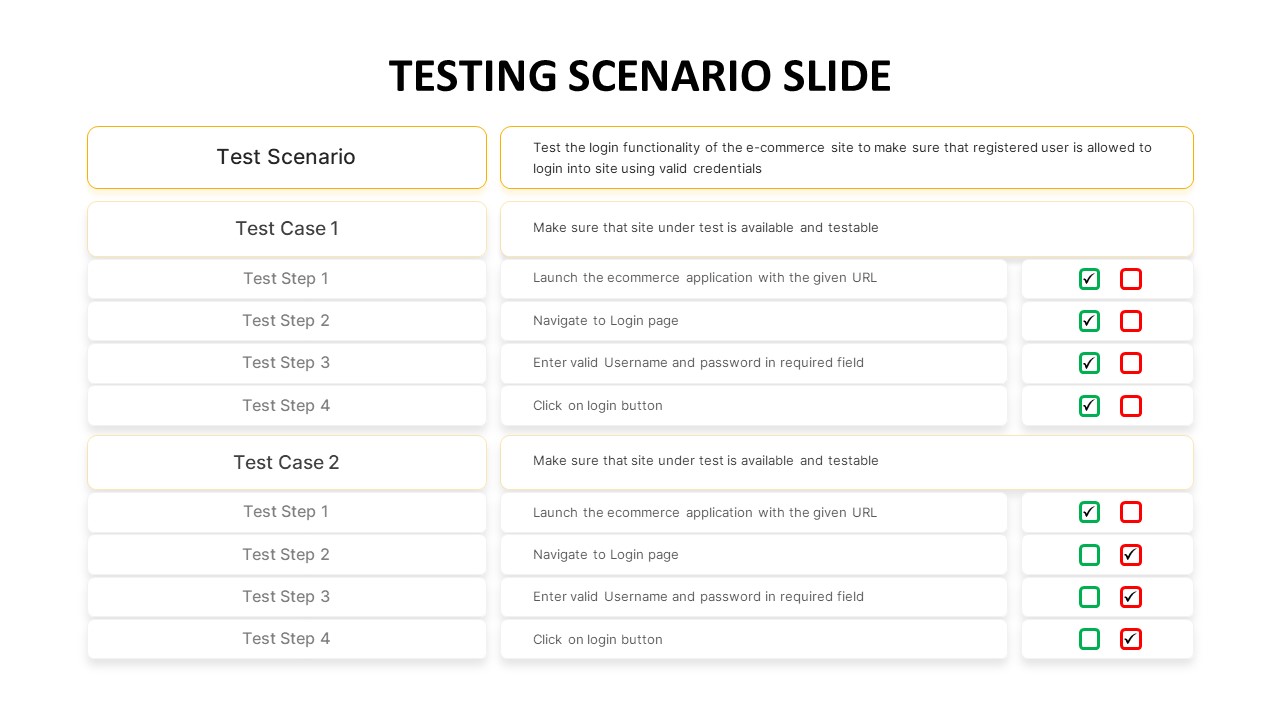
Testing Scenario Table Template for PowerPoint & Google Slides
Business Requirements
Comprehensive Resource Planning Table Template for PowerPoint & Google Slides
Project
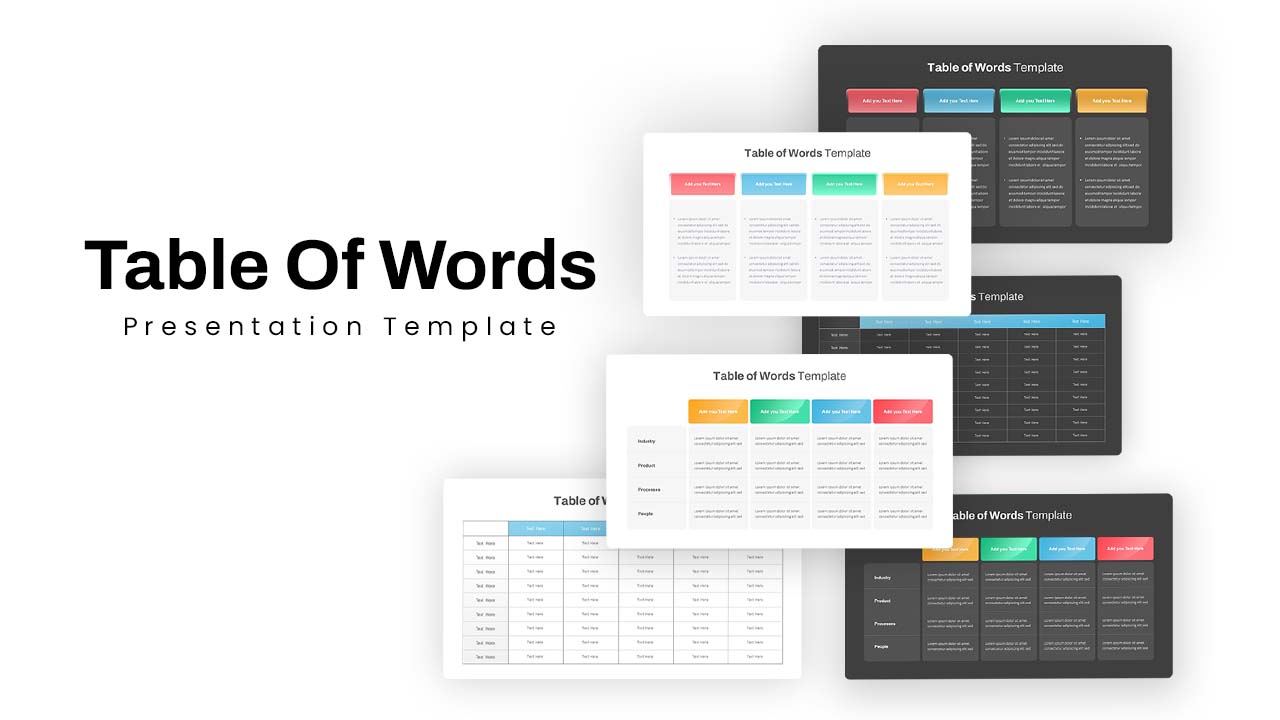
Versatile Table of Words Layout Template for PowerPoint & Google Slides
Table
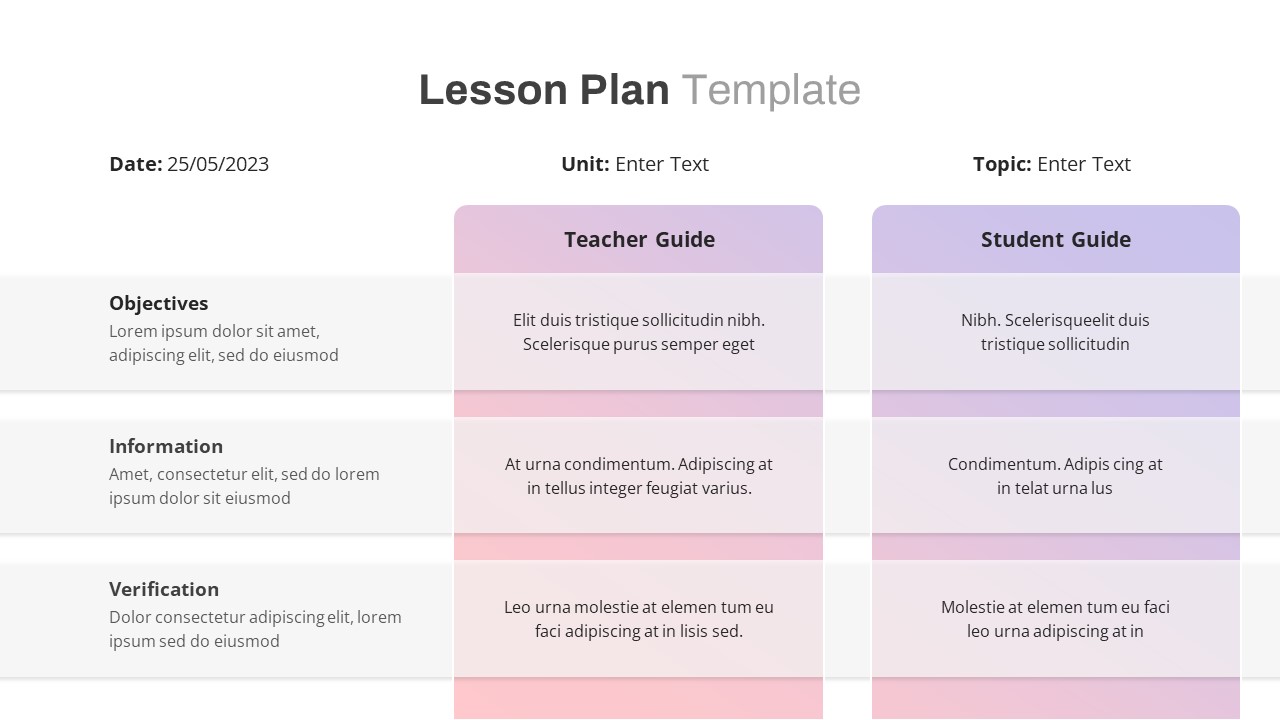
Free Lesson Plan Table Slide Template for PowerPoint & Google Slides
Agenda
Free
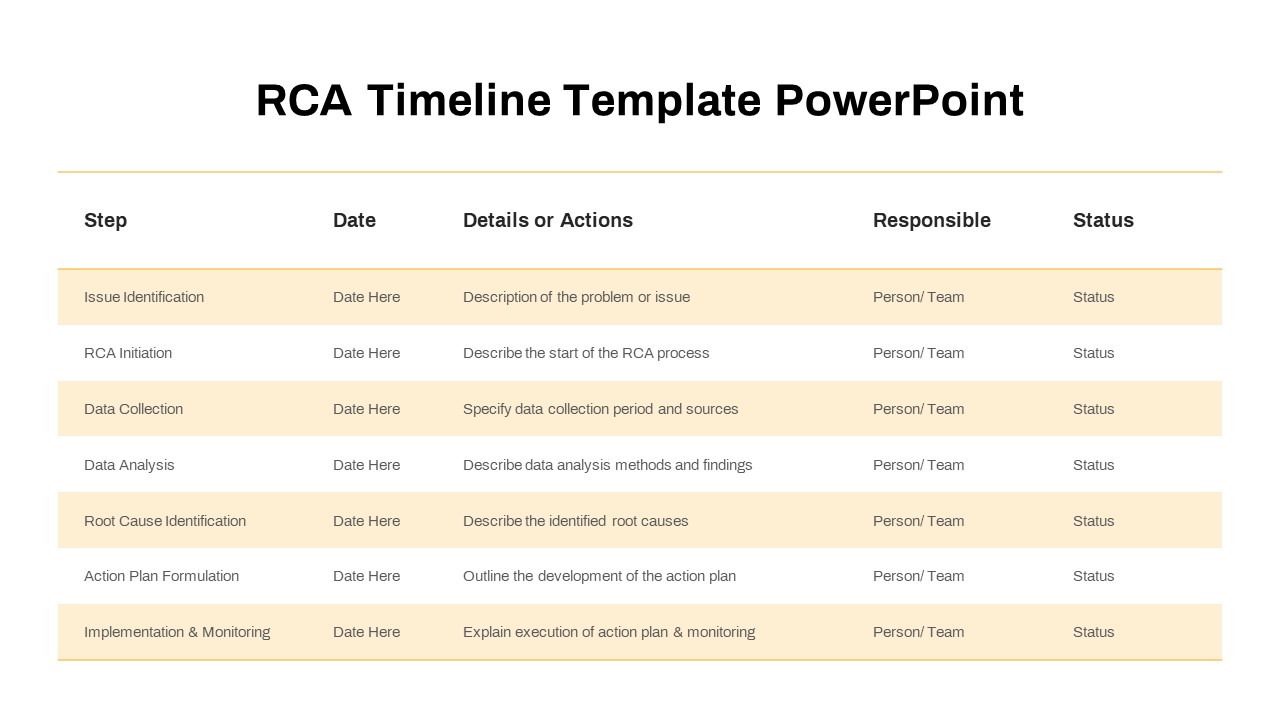
RCA Process Timeline Table Slide Template for PowerPoint & Google Slides
Timeline
Free Minimal Multi-Color Table of Contents Template for PowerPoint & Google Slides
Agenda
Free
Free Versatile Table Collection Template for PowerPoint & Google Slides
Pitch Deck
Free
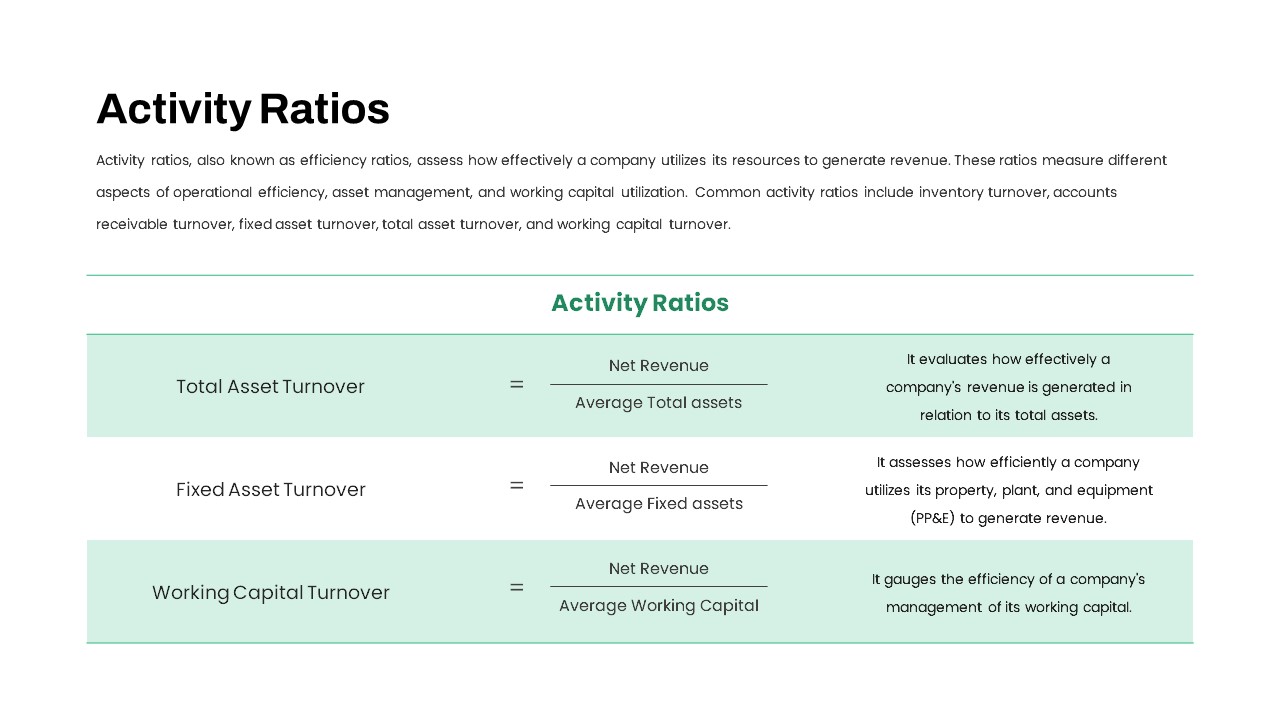
Activity Ratios Formula Table Slide Template for PowerPoint & Google Slides
Comparison Chart
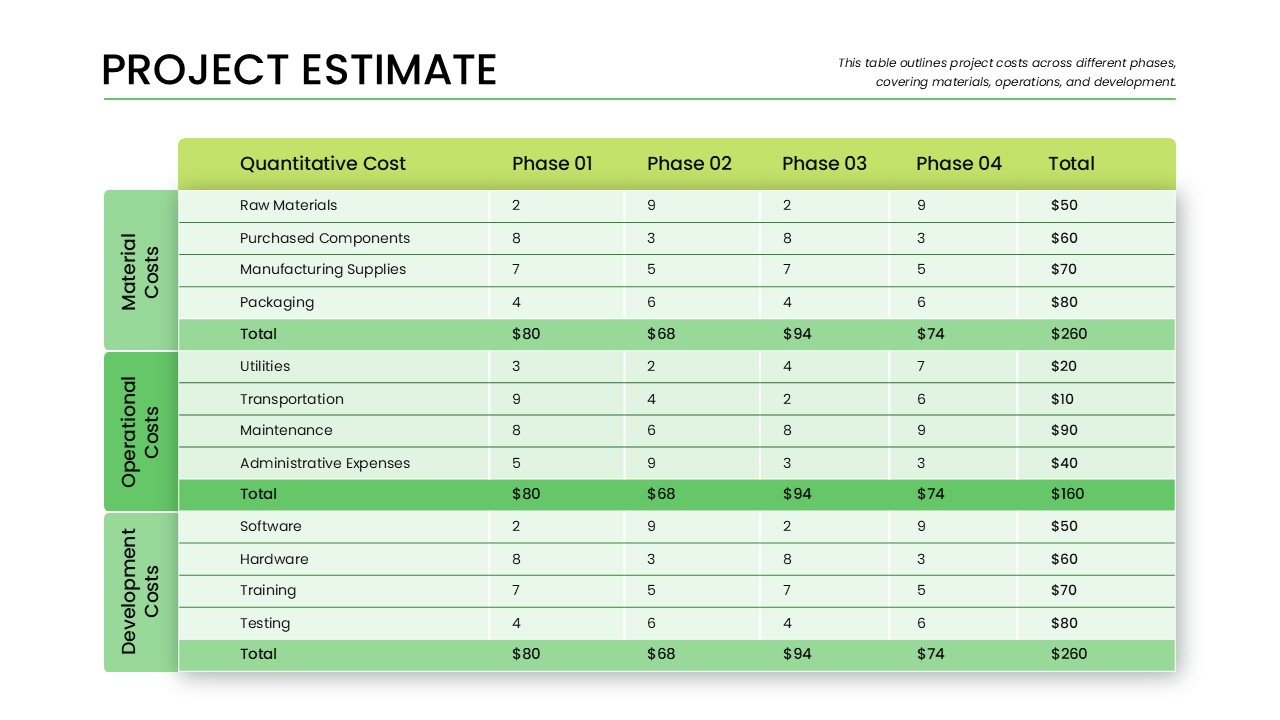
Phase-Wise Project Estimate Table Template for PowerPoint & Google Slides
Business Report
Professional Table of Organization Chart Template for PowerPoint & Google Slides
Org Chart
Two-Option Bar Chart Comparison Table Template for PowerPoint & Google Slides
Comparison
Progression Track Milestone Table Template for PowerPoint & Google Slides
Project Status
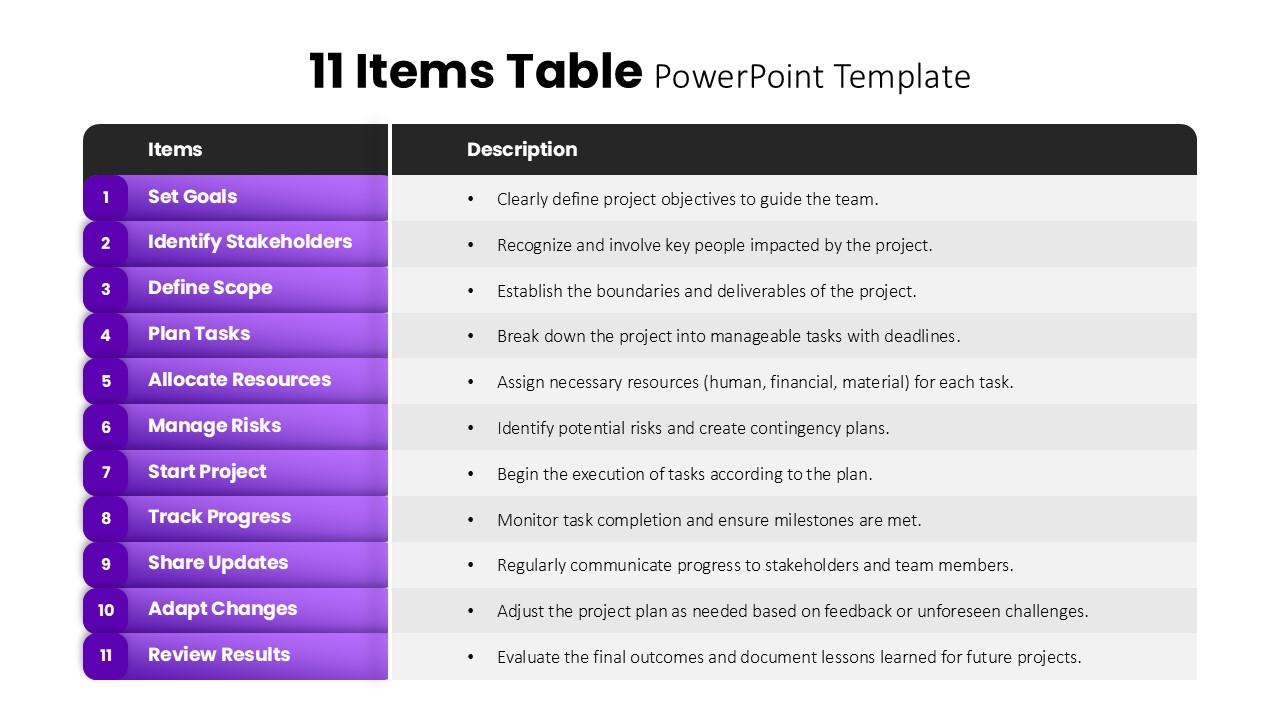
11 Items Table Project Planning Steps template for PowerPoint & Google Slides
Business
Product Feature Comparison Table Template for PowerPoint & Google Slides
Comparison Chart
Sales Growth Comparison Chart & Table Template for PowerPoint & Google Slides
Bar/Column
Project Tracking Dashboard Table Template for PowerPoint & Google Slides
Project Status
Action Items Management Dashboard Table Template for PowerPoint & Google Slides
Project Status
Comprehensive Action Tracker Table Template for PowerPoint & Google Slides
Business
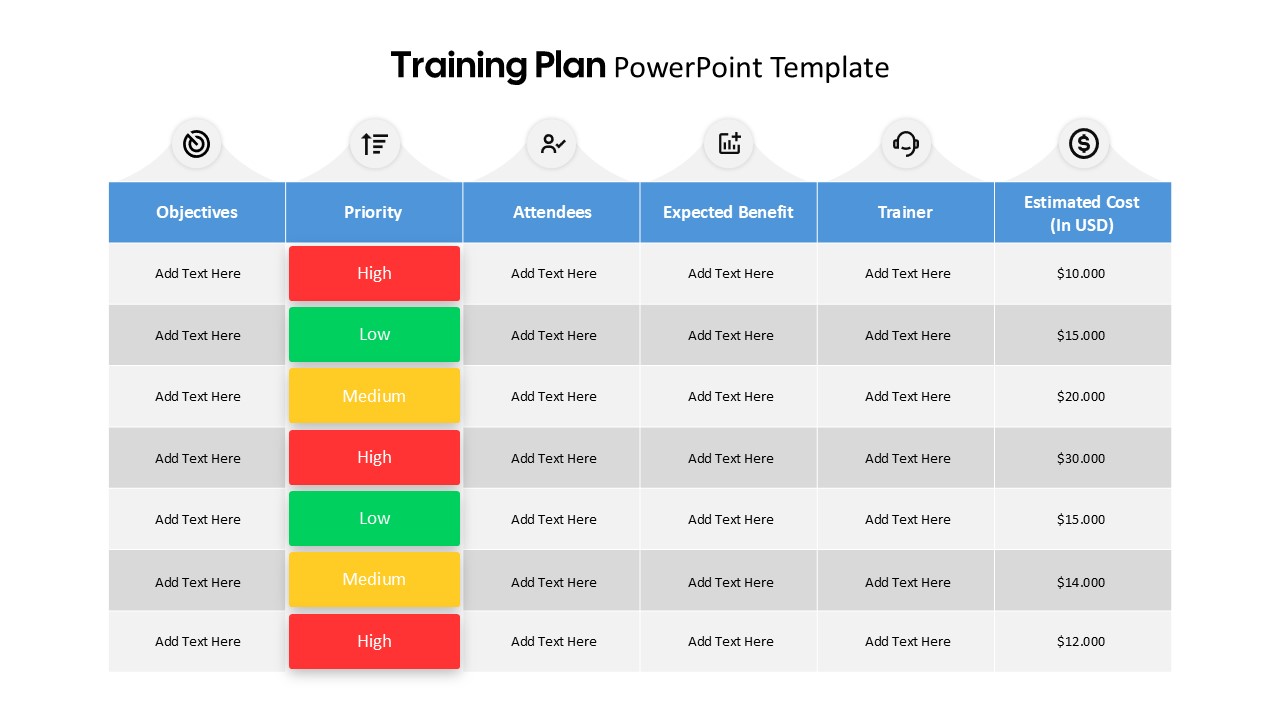
Training Plan Table Layout Template for PowerPoint & Google Slides
Employee Performance
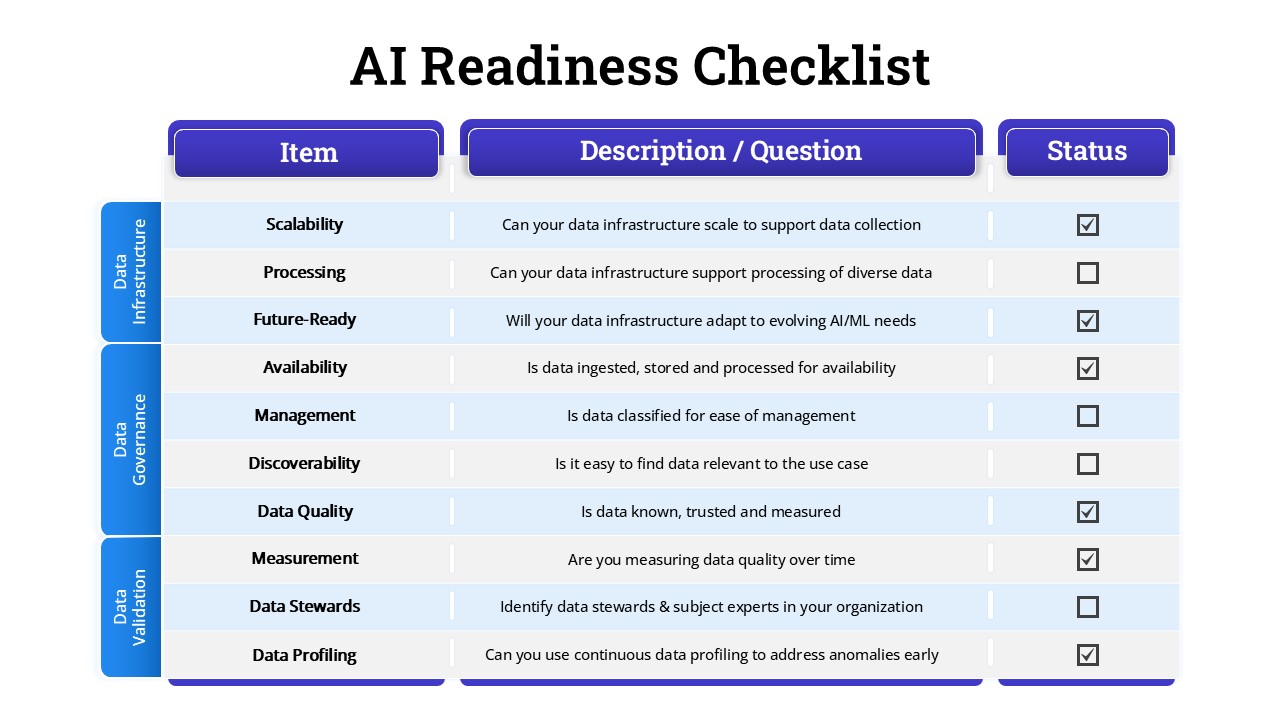
AI Readiness Checklist Table Slide Template for PowerPoint & Google Slides
Process
Business Data Table Template for PowerPoint & Google Slides
Table
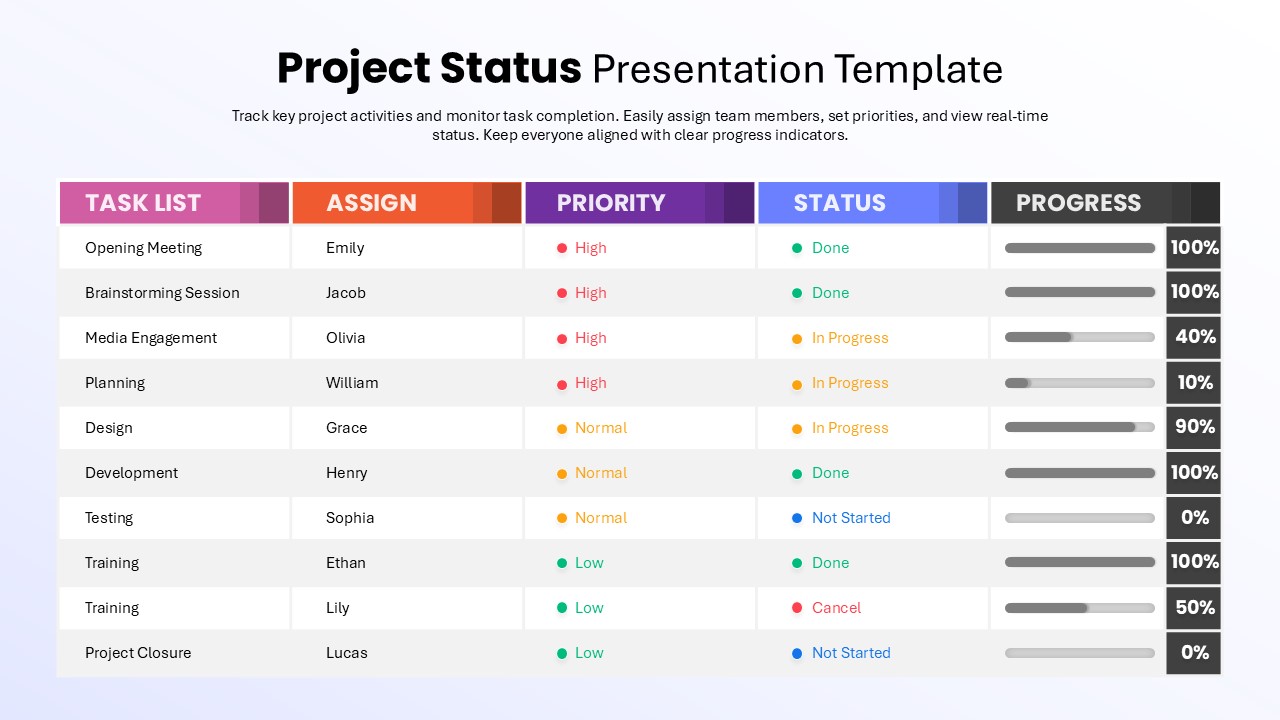
Dynamic Project Status Tracking Table Template for PowerPoint & Google Slides
Project Status
Multi-Column Table Presentation Template for PowerPoint & Google Slides
Table
Comparison Table Presentation Template for PowerPoint & Google Slides
Table
Marketing Budget Table Template for PowerPoint & Google Slides
Business
Project Status Update Dashboard Table Template for PowerPoint & Google Slides
Project Status
Six-Row Multi-Column Table Presentation Template for PowerPoint & Google Slides
Table
Colorful Comparison Table Presentation Template for PowerPoint & Google Slides
Table
Colorful Four-Column Table Layout Template for PowerPoint & Google Slides
Table
Colorful Business Data Comparison Table Template for PowerPoint & Google Slides
Table
Five Column Comparison Table Layout Template for PowerPoint & Google Slides
Comparison
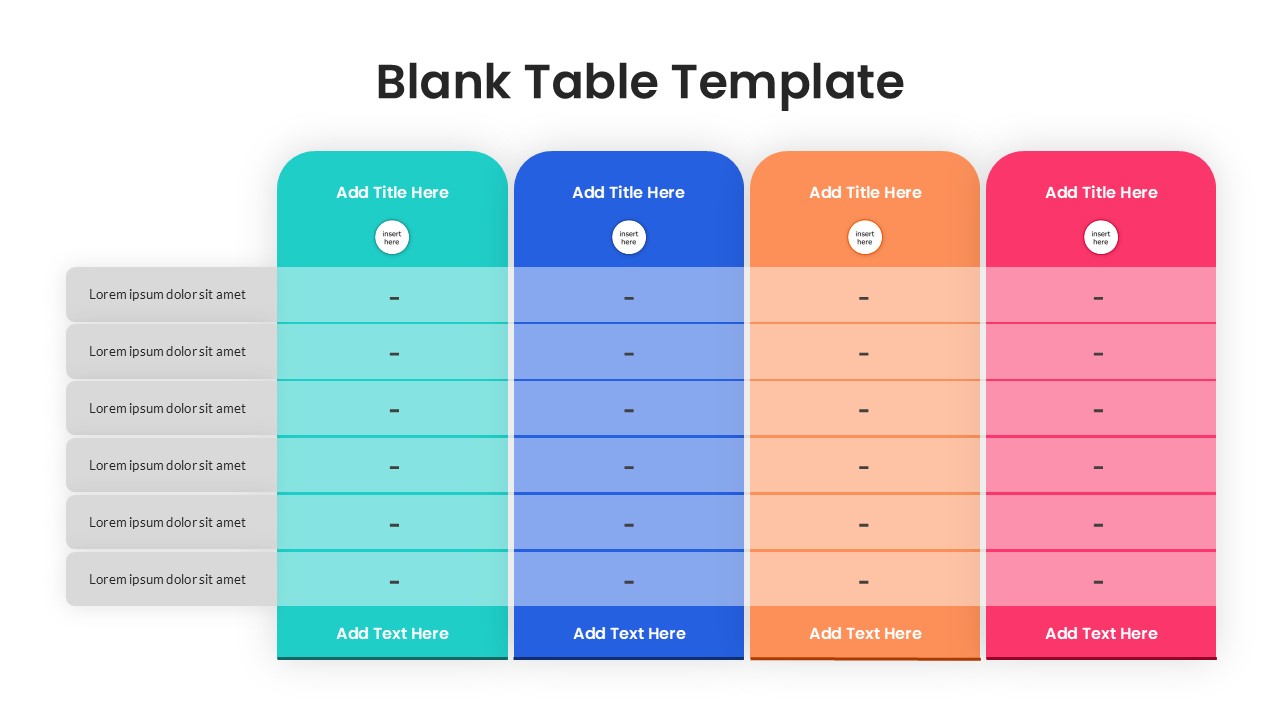
Blank Table Template for PowerPoint & Google Slides
Table
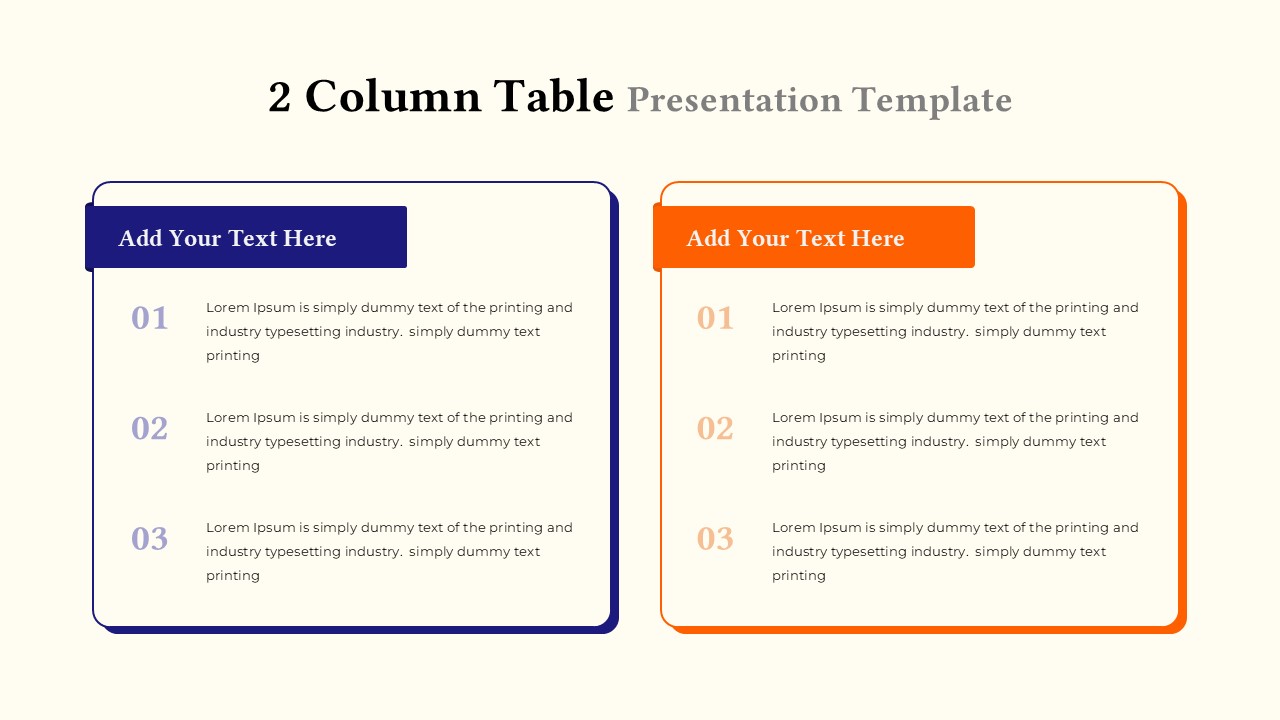
Two-Column Table Presentation Template for PowerPoint & Google Slides
Table
Six Column Data Table Template for PowerPoint & Google Slides
Table
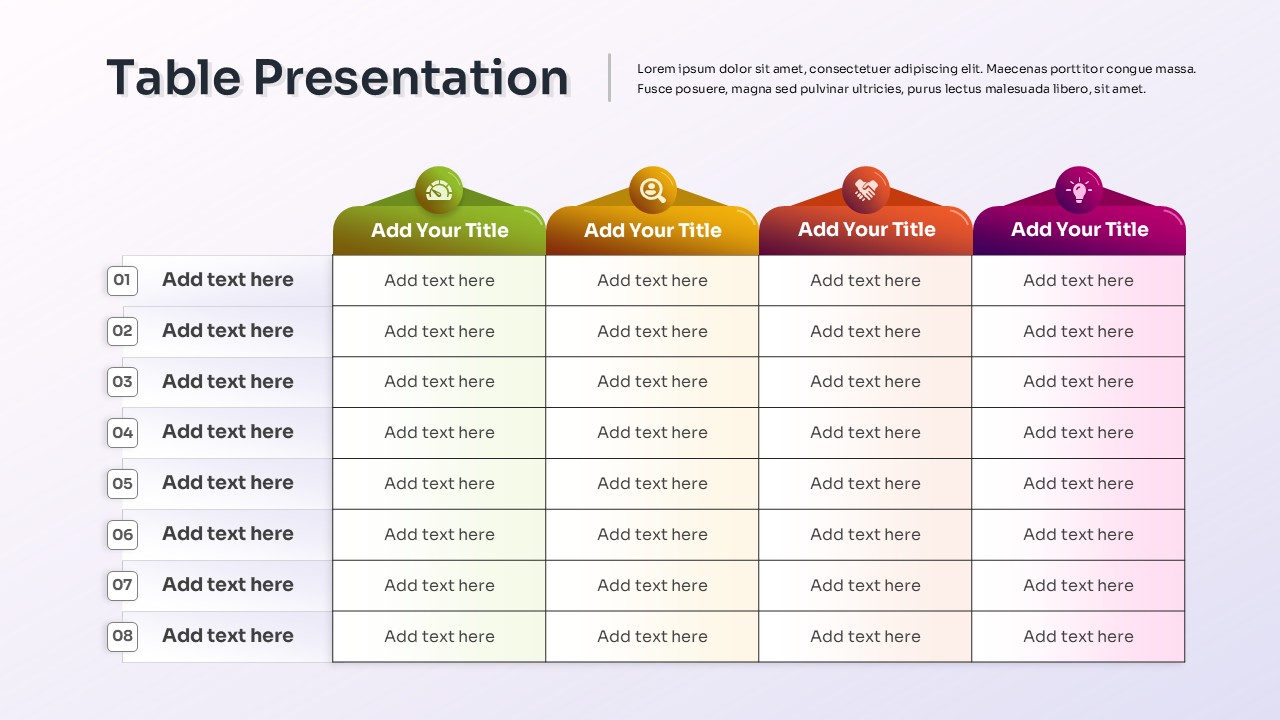
Colorful Table Presentation Template for PowerPoint & Google Slides
Table
Pros and Cons Comparison Table Template for PowerPoint & Google Slides
Comparison Chart
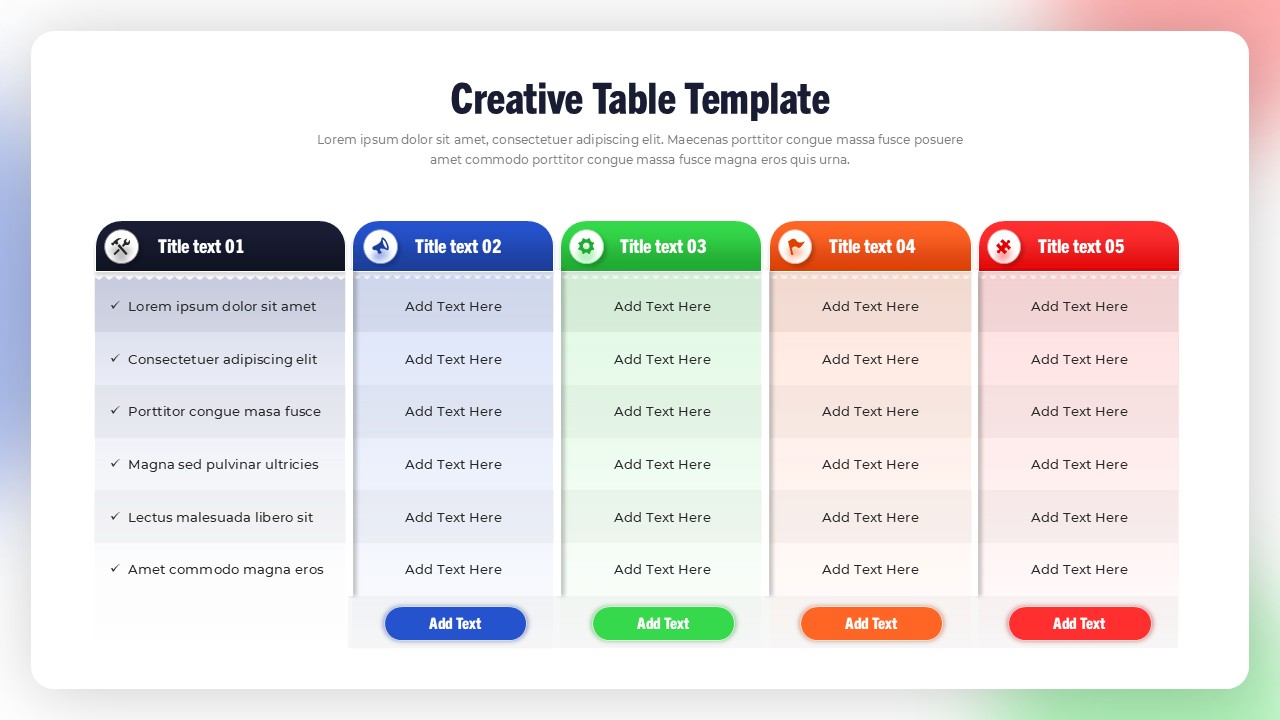
Creative Table Template for PowerPoint & Google Slides
Table