Modern Image-Based Organizational Chart Template for PowerPoint & Google Slides


Description
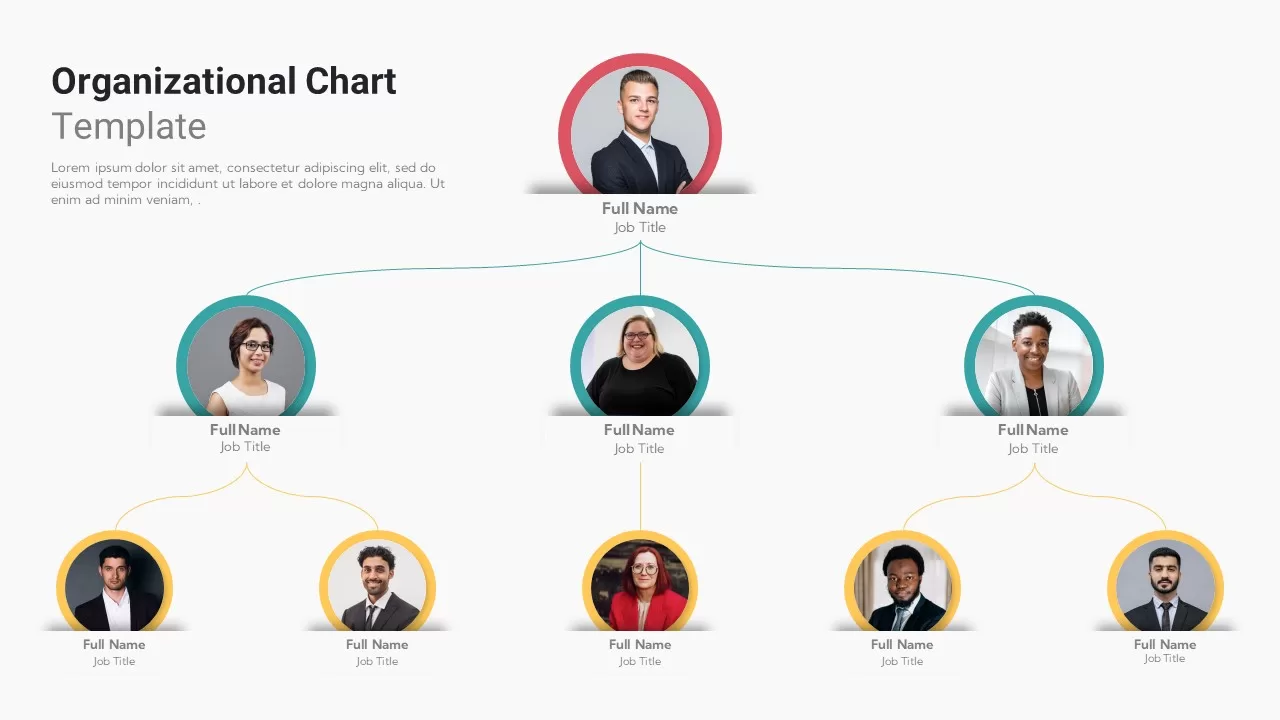
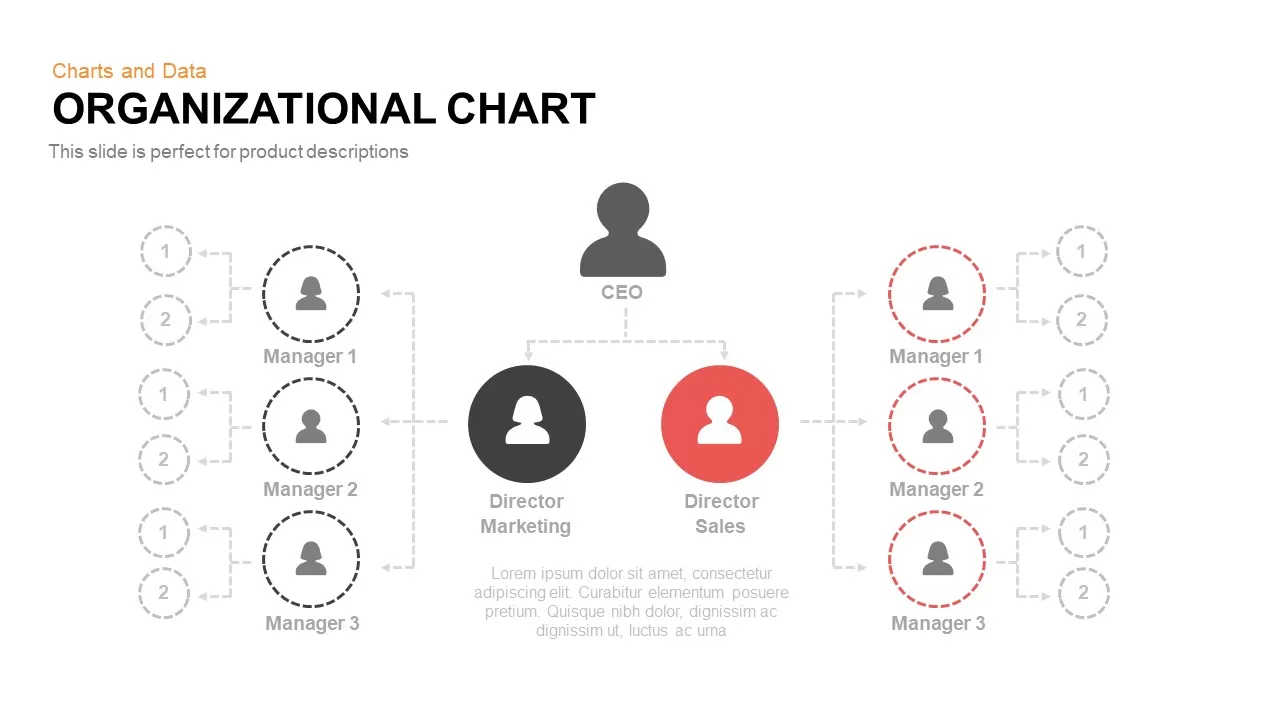
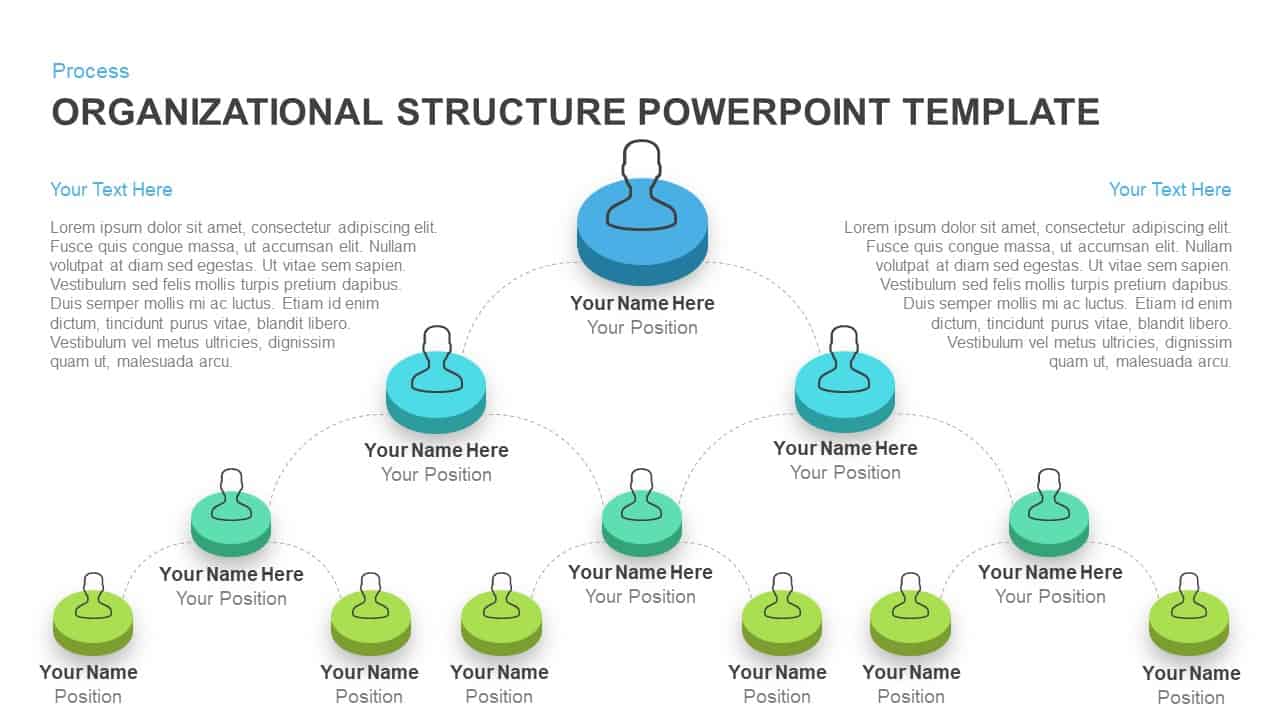
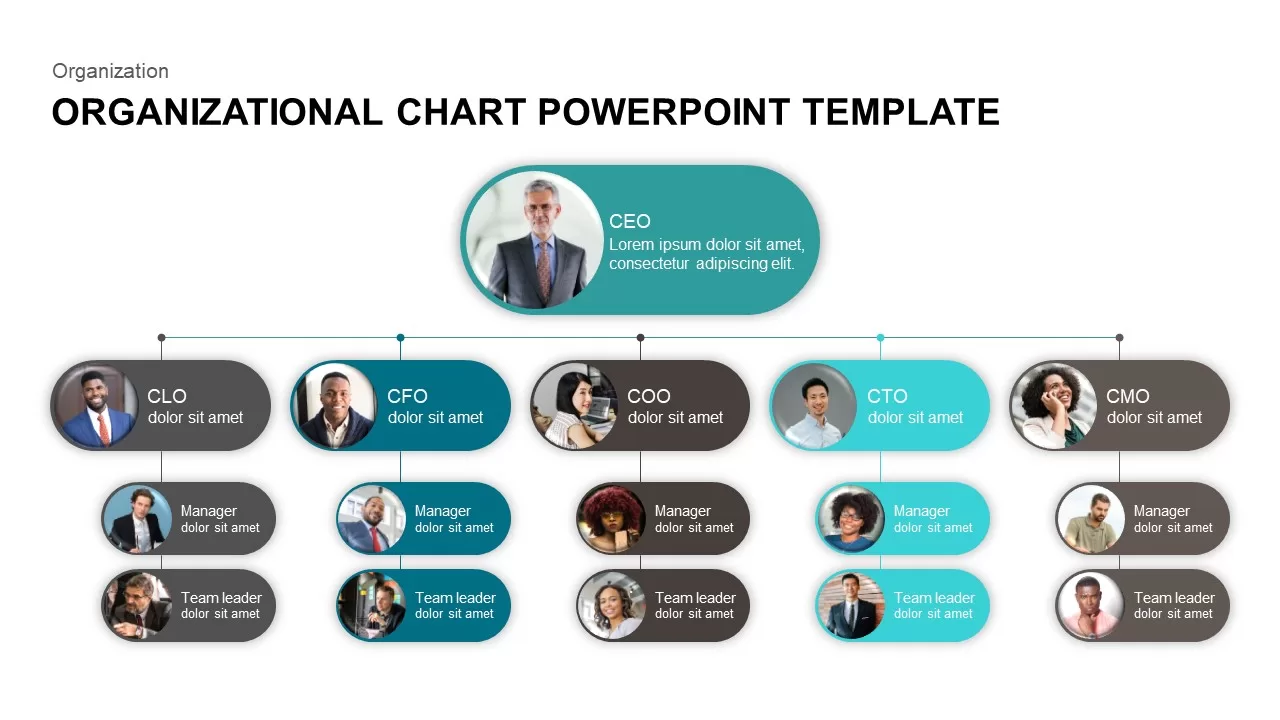
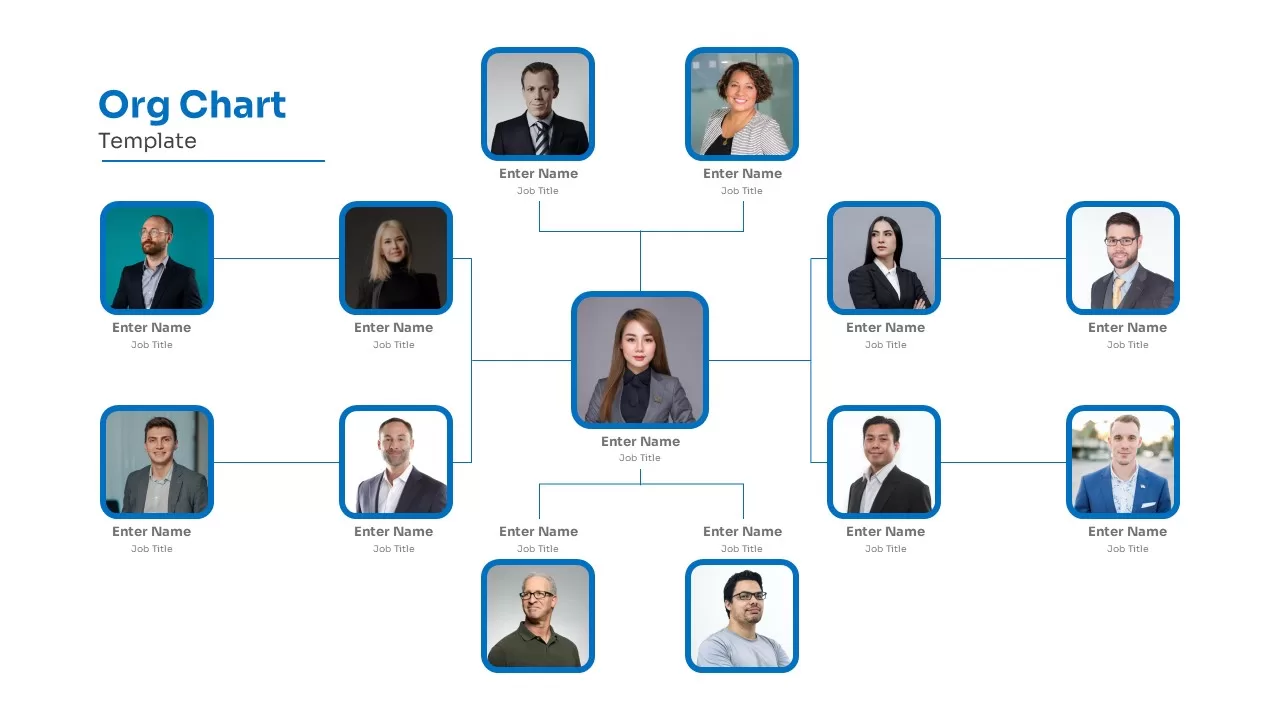
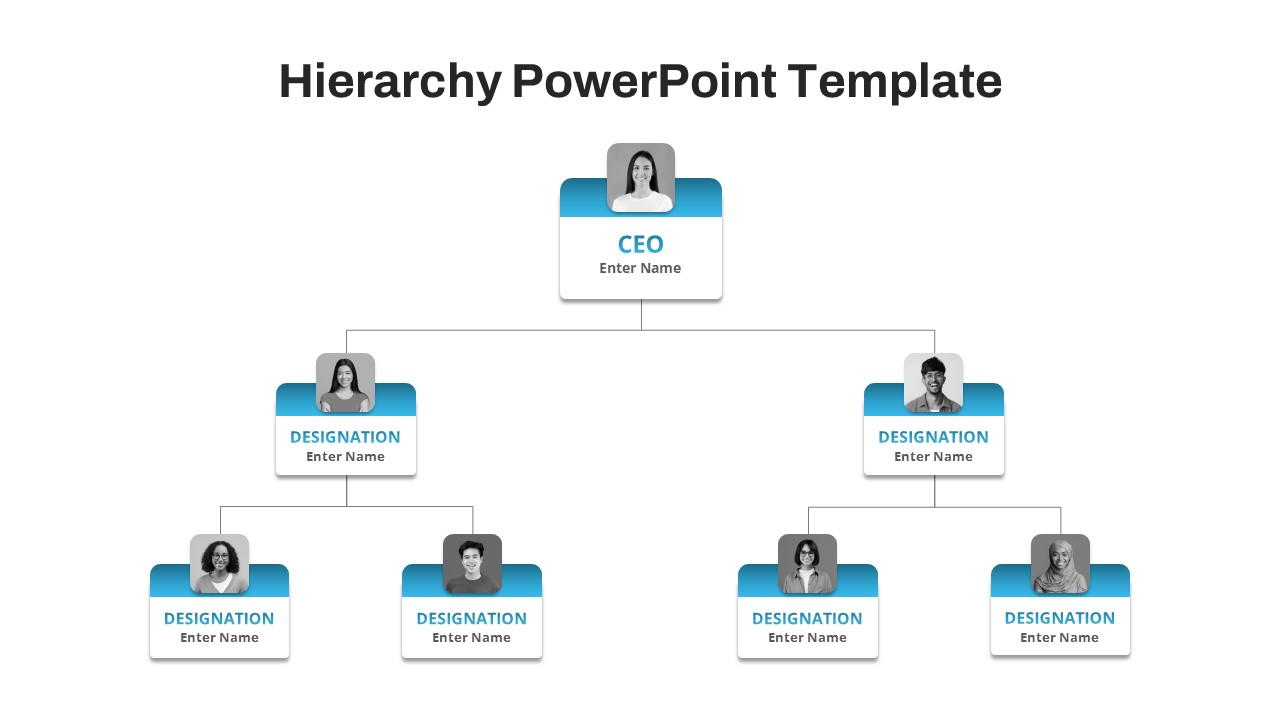
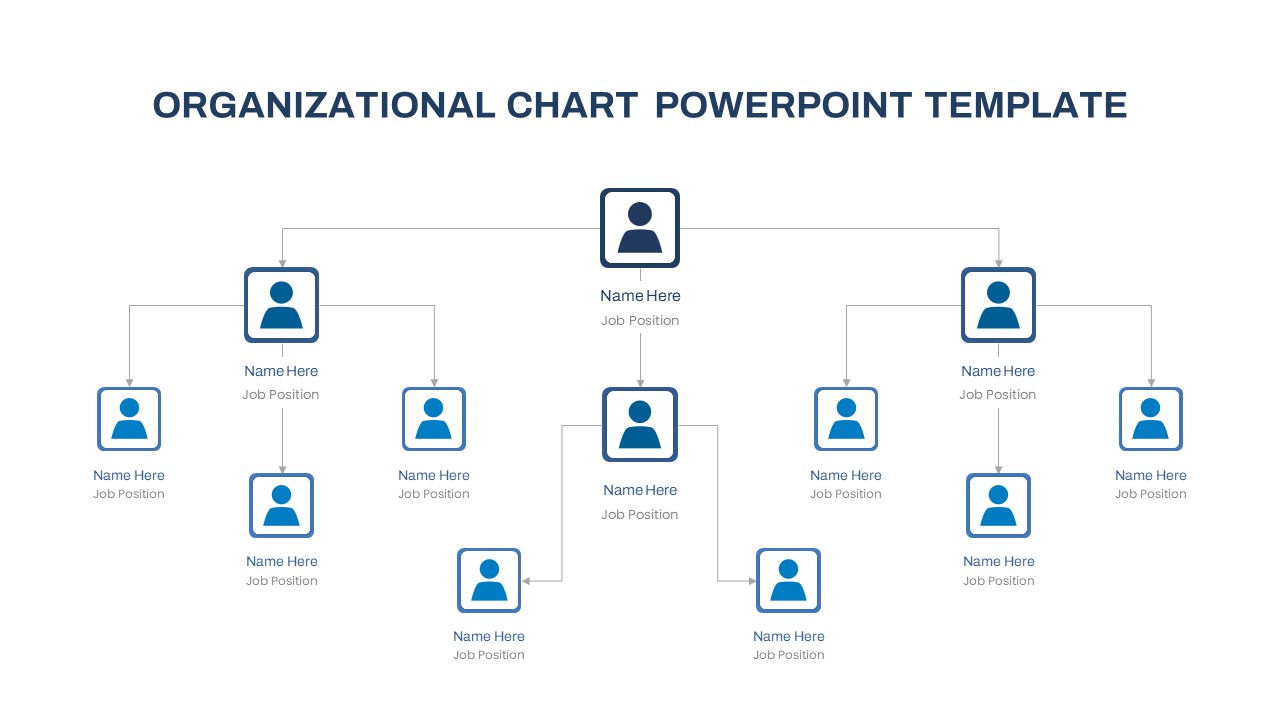
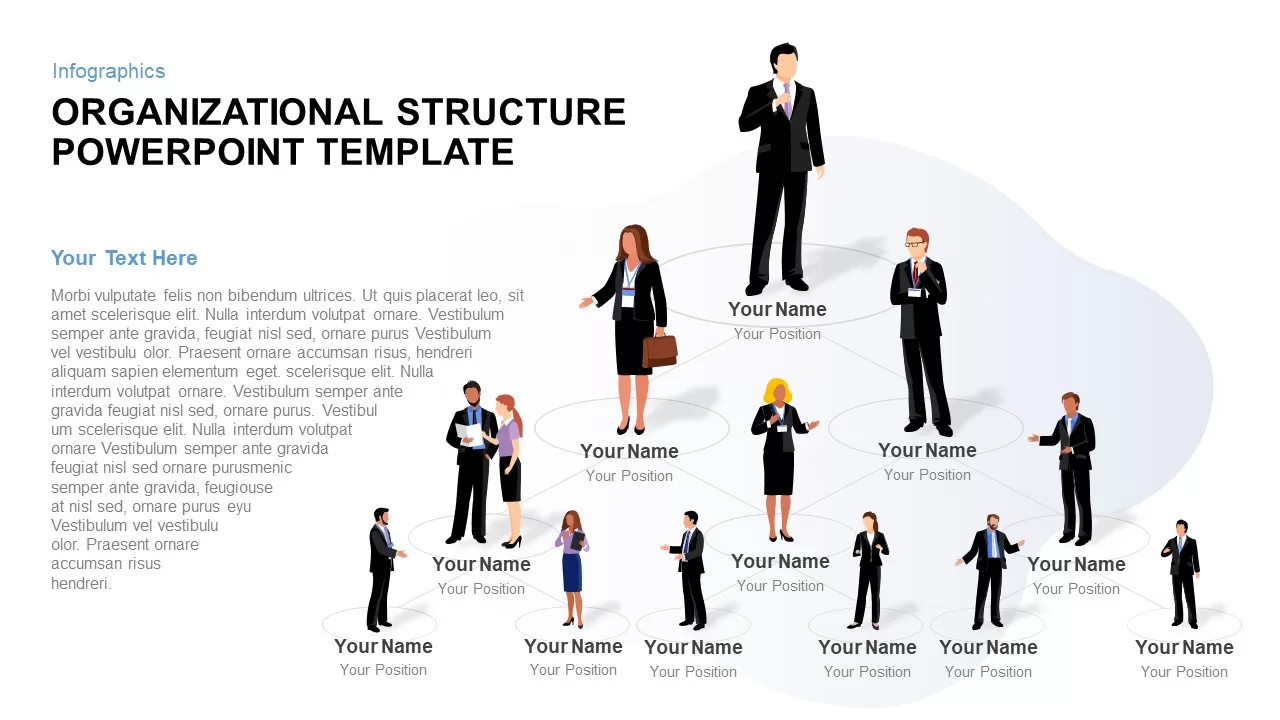
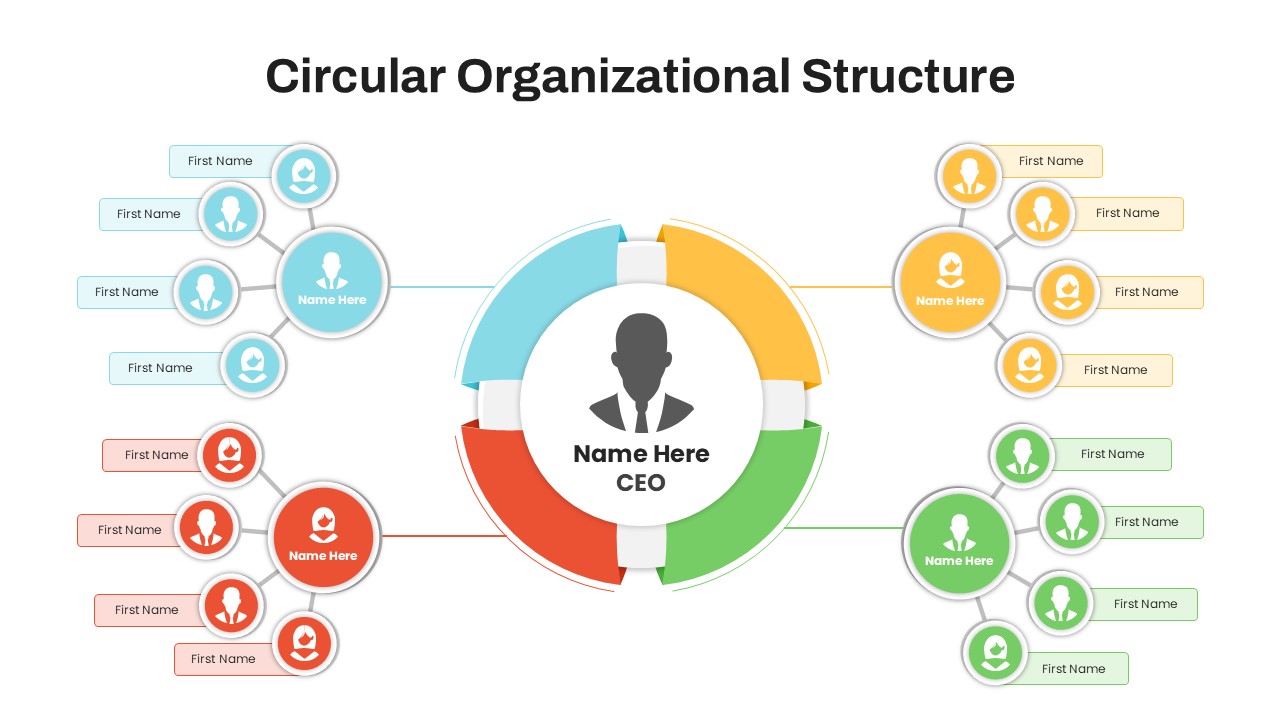
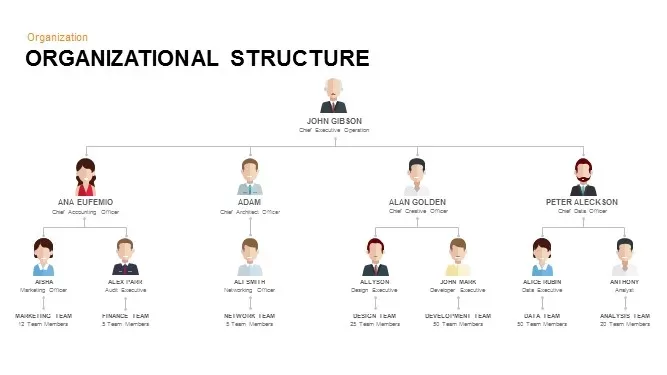
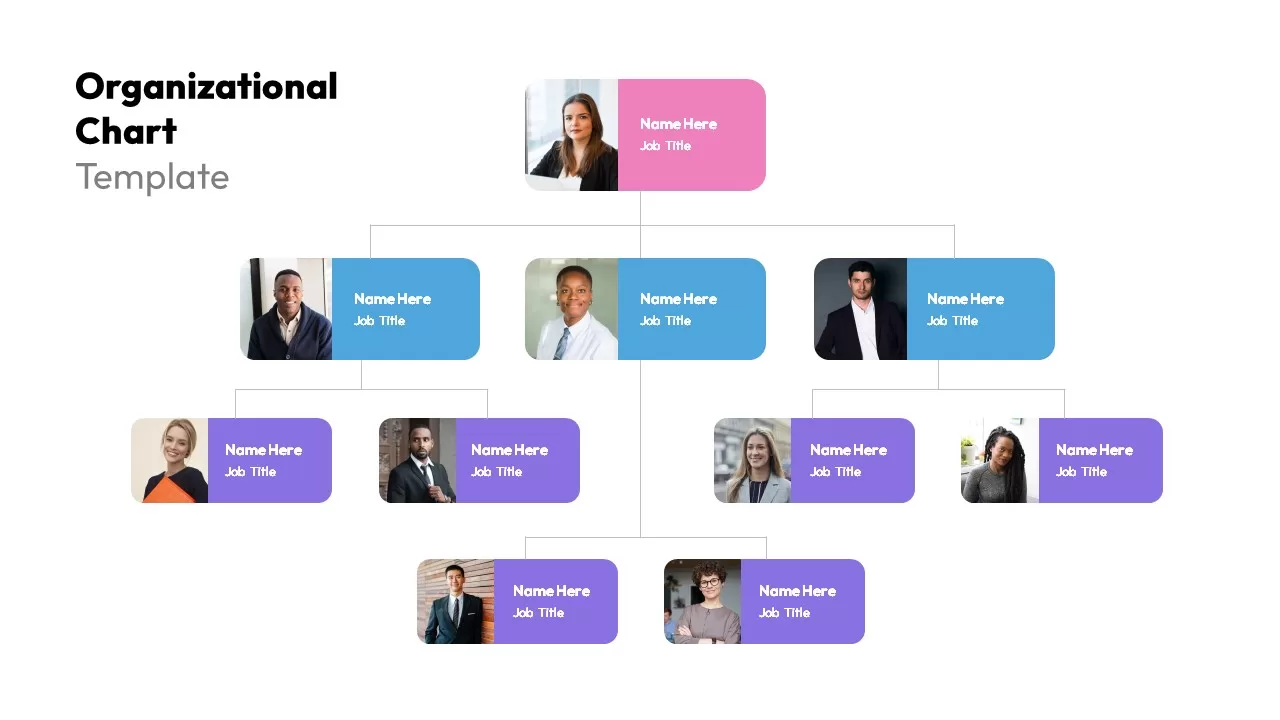
Enhance your corporate presentations with this modern image-based organizational chart slide, designed to showcase hierarchical structures with clarity and visual appeal. Each position is represented by a rounded-corner rectangle combining a profile image and title area, color-coded into three tiers—executive (pink), management (blue), and staff (purple)—to facilitate quick identification of roles and reporting lines. Clean connector lines maintain a logical flow from the CEO through department heads to team members, ensuring your audience can effortlessly follow complex structures at a glance. The slide’s generous white space, crisp typography, and subtle drop shadows contribute to a professional, polished aesthetic that complements any brand style.
Built on fully editable master slides, every element—from image placeholders and text fields to shape colors and connector styles—can be customized in seconds without disrupting layout integrity. Adjust profile photos by dragging and dropping, revise job titles with inline editing, or reassign team members by repositioning shapes. Whether you need to highlight new leadership appointments, reorganize departments, or present team growth milestones, this chart adapts seamlessly to evolving organizational changes. Predefined color swatches and consistent typographic hierarchy ensure your revisions remain cohesive across the entire deck. If you’re exploring other ways to visualize reporting relationships, browse our full collection of organizational chart templates.
Optimized for both PowerPoint and Google Slides, this slide automatically scales across screen resolutions and preserves formatting across platforms, eliminating version control issues. Leverage built-in animations to animate the chart’s tiers, drawing attention to key roles or department expansions. A versatile asset for boardroom briefings, investor updates, or HR onboarding sessions, this organizational chart empowers you to communicate your company’s structure with maximum impact and minimal effort. The organizational chart template also follows a similar editable structure, optimized for clean hierarchical visuals.
Who is it for
Senior executives, HR leaders, and department heads will find this organizational chart ideal for presenting team structures, reporting relationships, and leadership hierarchies. Corporate consultants and business analysts can leverage this slide to illustrate company reorganizations or merger impacts. Additionally, startup founders and project managers can employ it to map evolving team compositions during growth phases.
Other Uses
Beyond corporate reporting, repurpose this slide for academic department maps, volunteer group structures, or event planning committees. Use the editable layout to depict mentorship programs, product development teams, or cross-functional working groups. The image-based format also supports stakeholder mapping, NGO board overviews, or any scenario requiring clear visualization of roles and connections. For more departmental specificity, the organisational chart departments template offers an ideal starting point for showcasing units by function or team.
Login to download this file

Item ID
SB02526
Related Templates

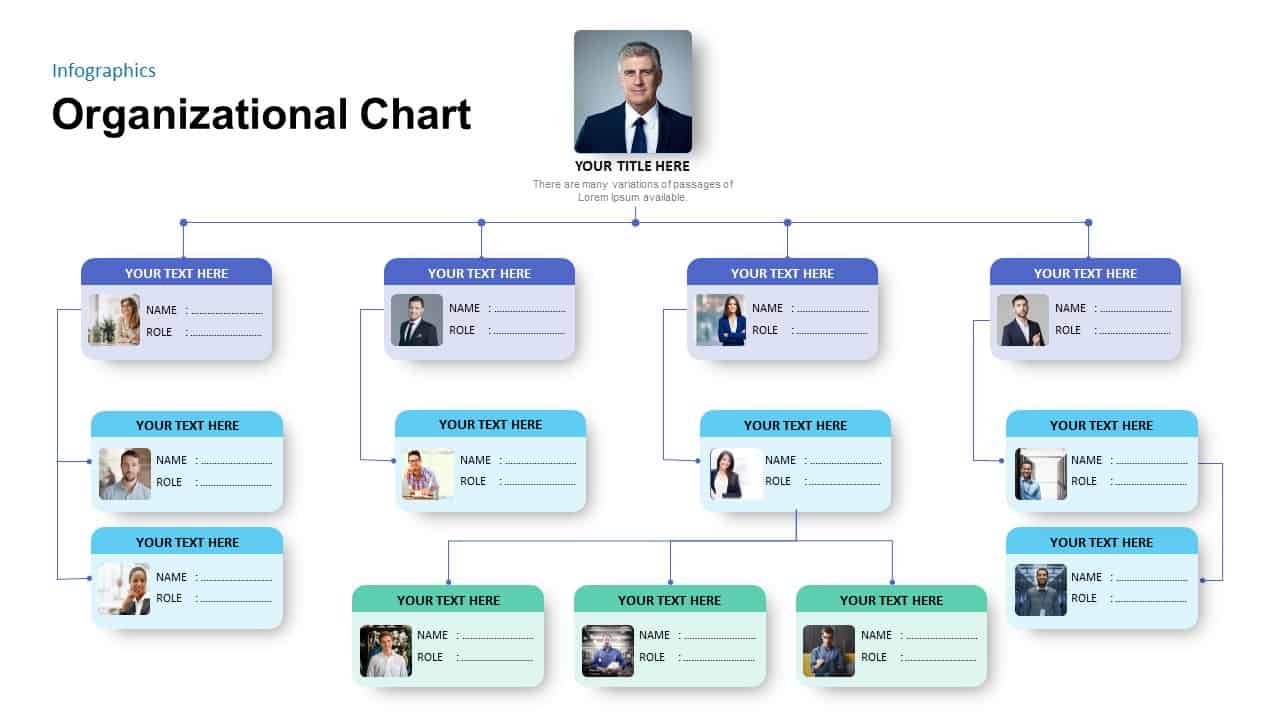
Modern Photo-Based Organizational Chart Template for PowerPoint & Google Slides
Org Chart
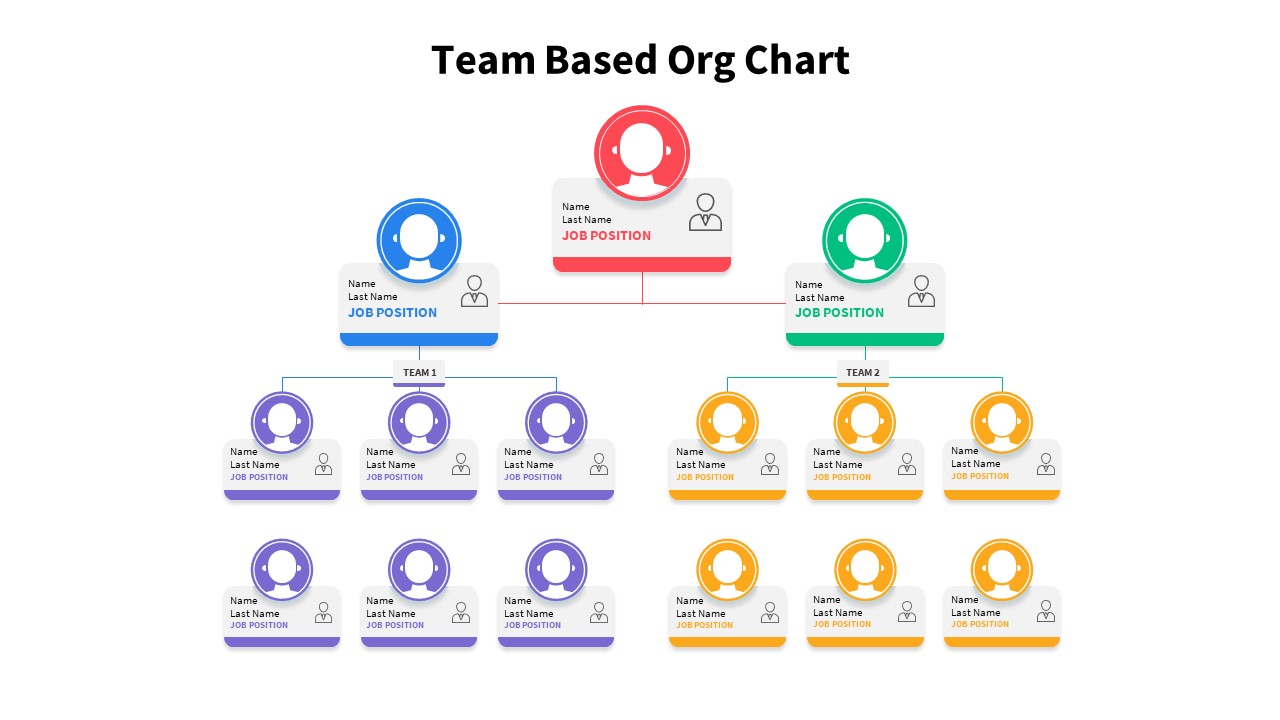
Team-Based Organizational Chart Template for PowerPoint & Google Slides
Org Chart
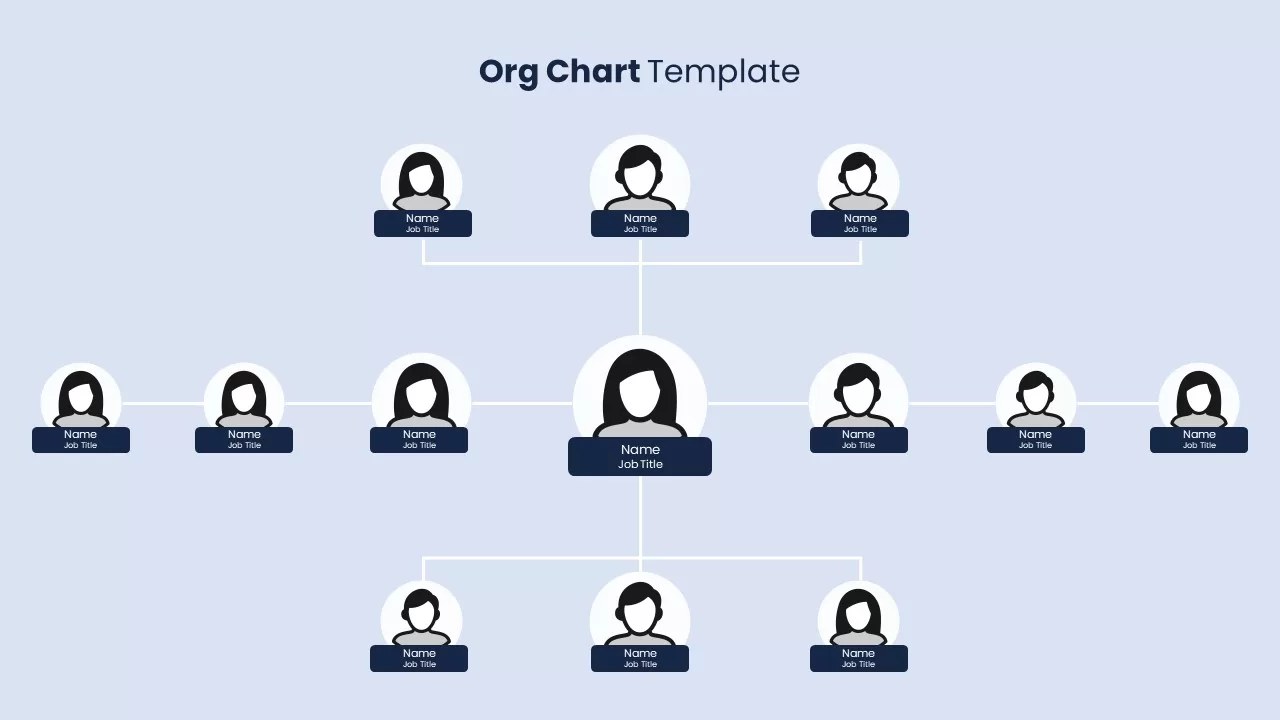
Modern Organizational Chart Hierarchy Template for PowerPoint & Google Slides
Org Chart
Modern Organizational Hierarchy Diagram Template for PowerPoint & Google Slides
Org Chart
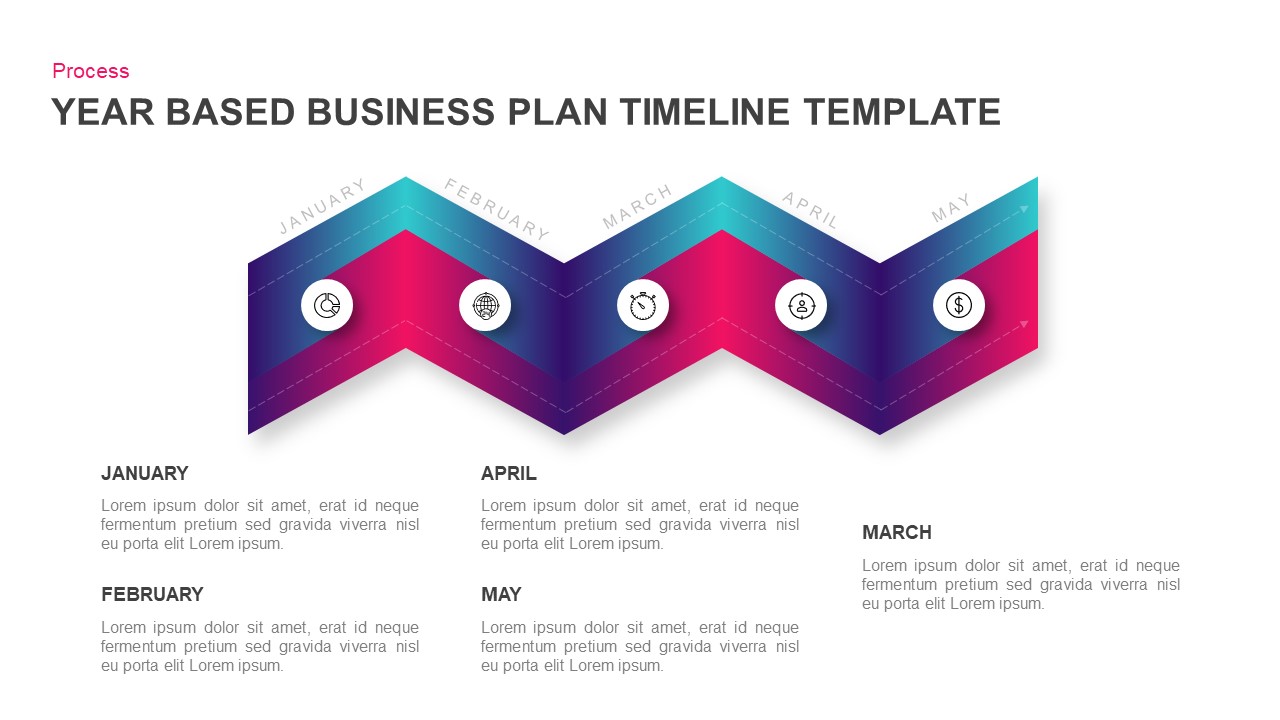
Year-Based Business Plan Zigzag Timeline Template for PowerPoint & Google Slides
Business Plan
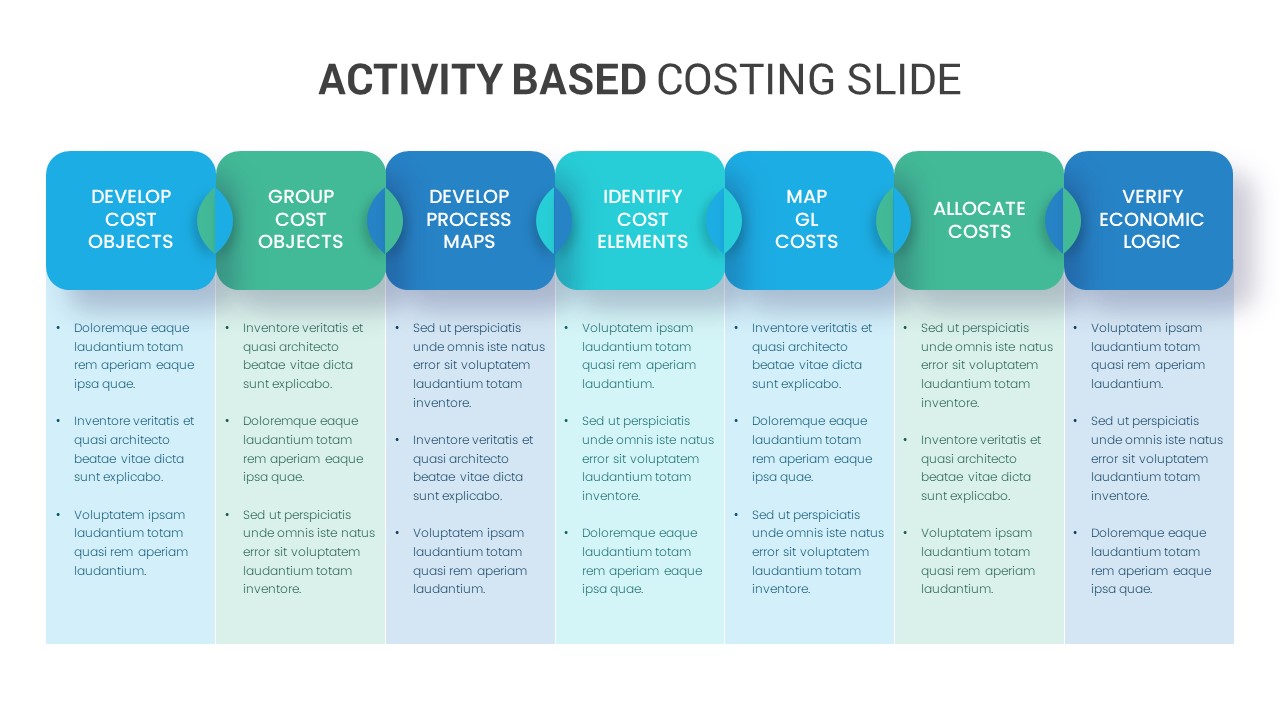
Activity Based Costing Process Diagram Template for PowerPoint & Google Slides
Process
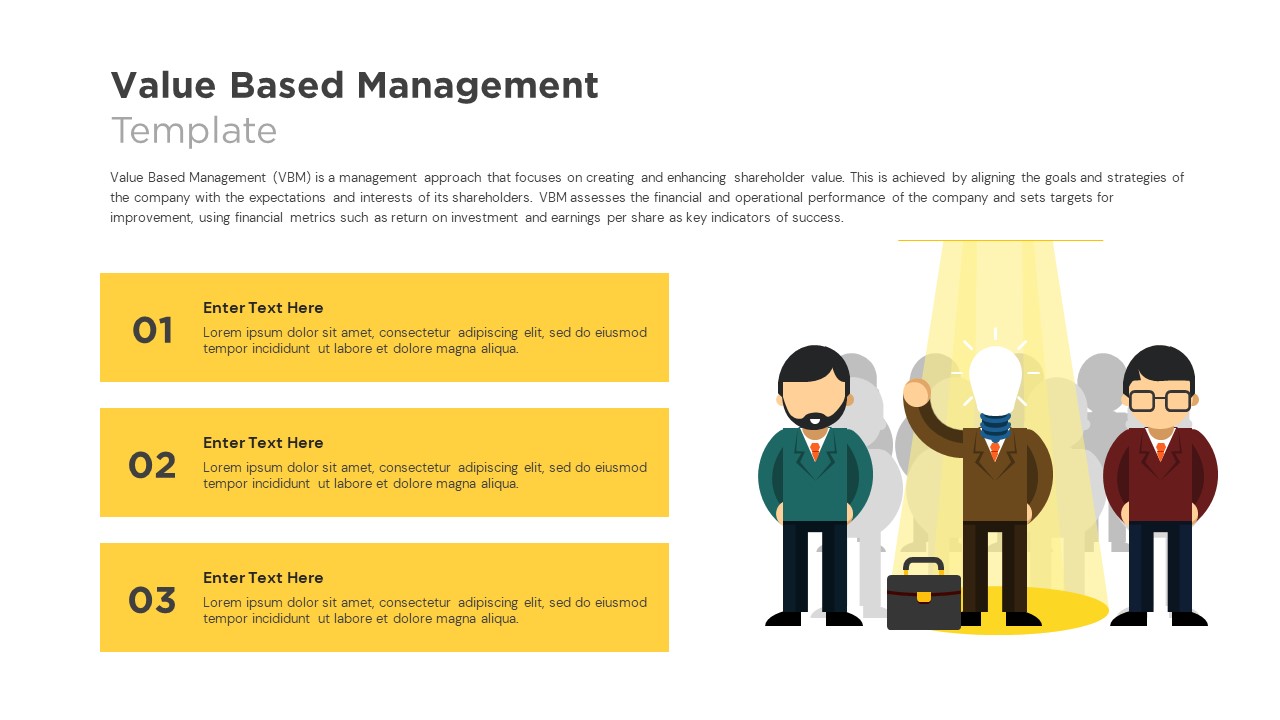
Value Based Management Step-by-Step Template for PowerPoint & Google Slides
Business Strategy
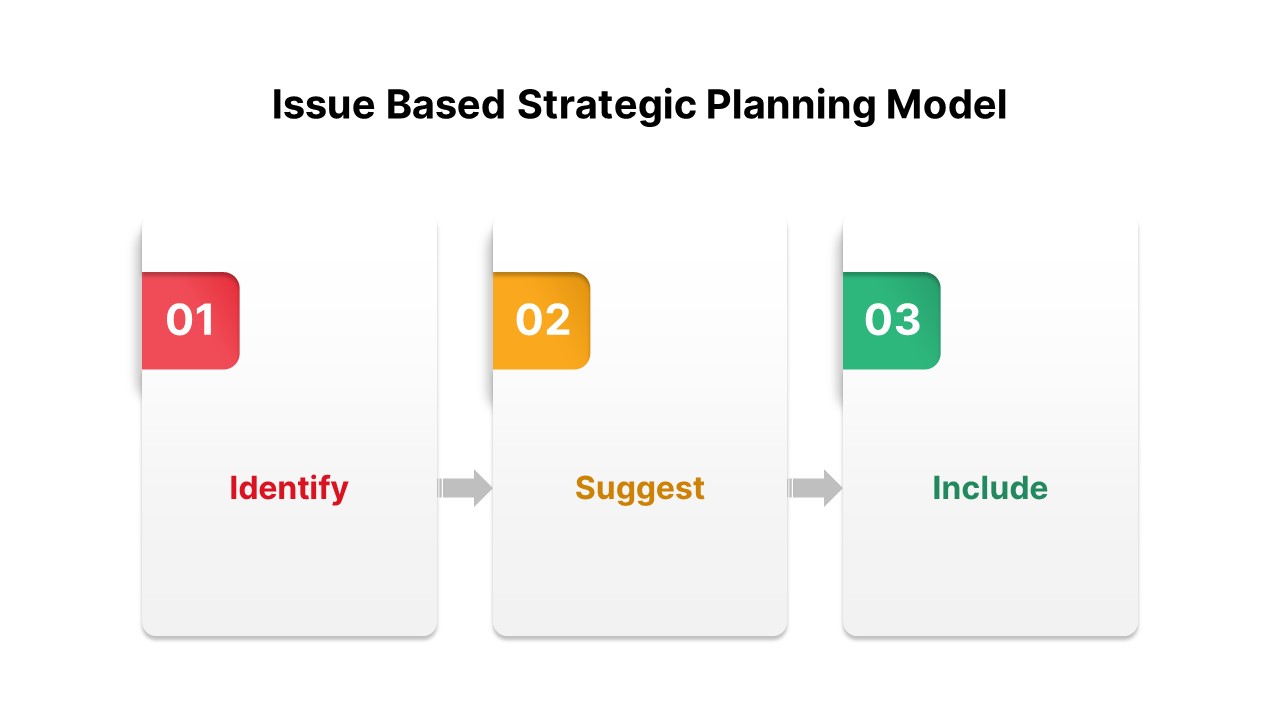
Issue-Based Strategic Planning Model Template for PowerPoint & Google Slides
Business Strategy
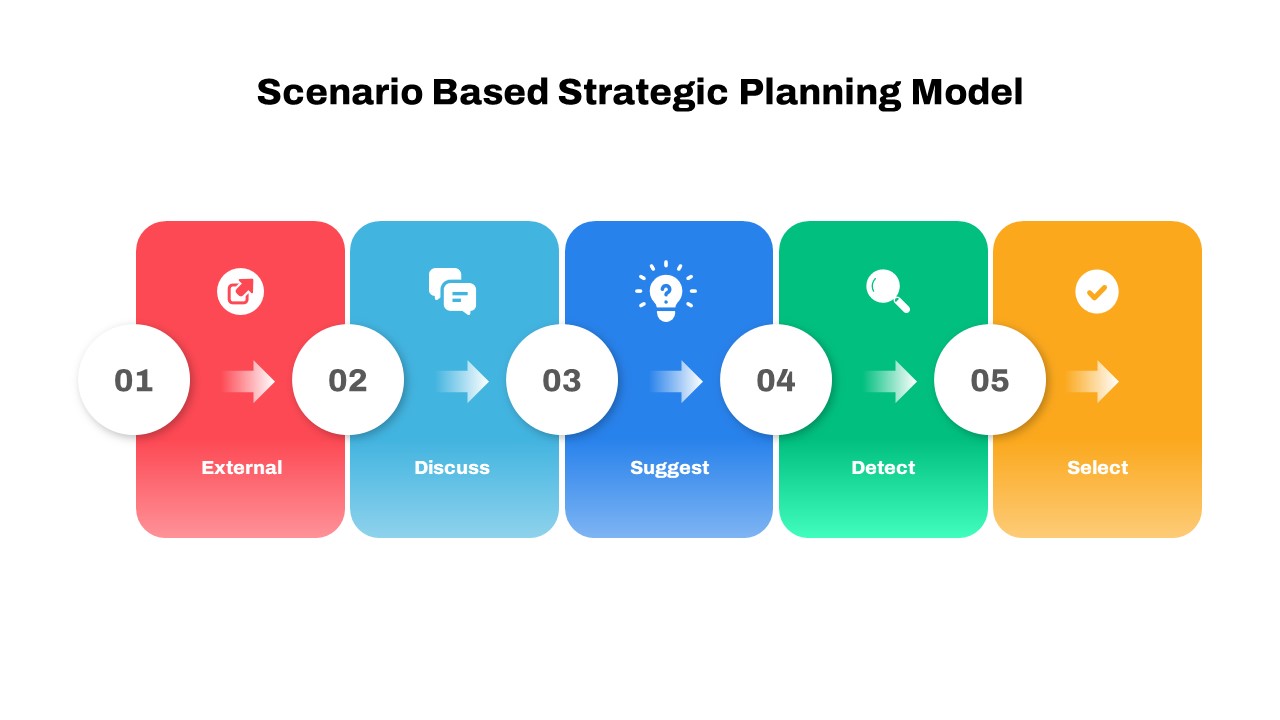
Scenario-Based Strategic Plan Model Template for PowerPoint & Google Slides
Business Plan
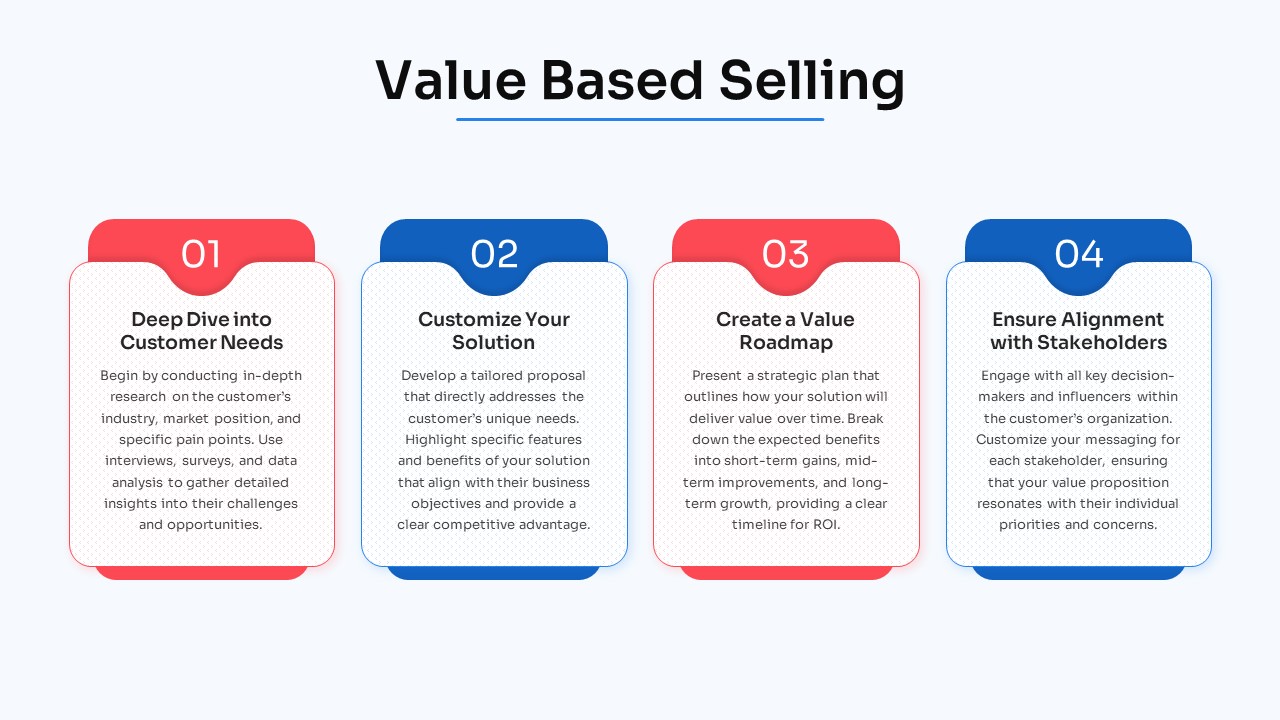
Free Four-Step Value-Based Selling Process Template for PowerPoint & Google Slides
Process
Free
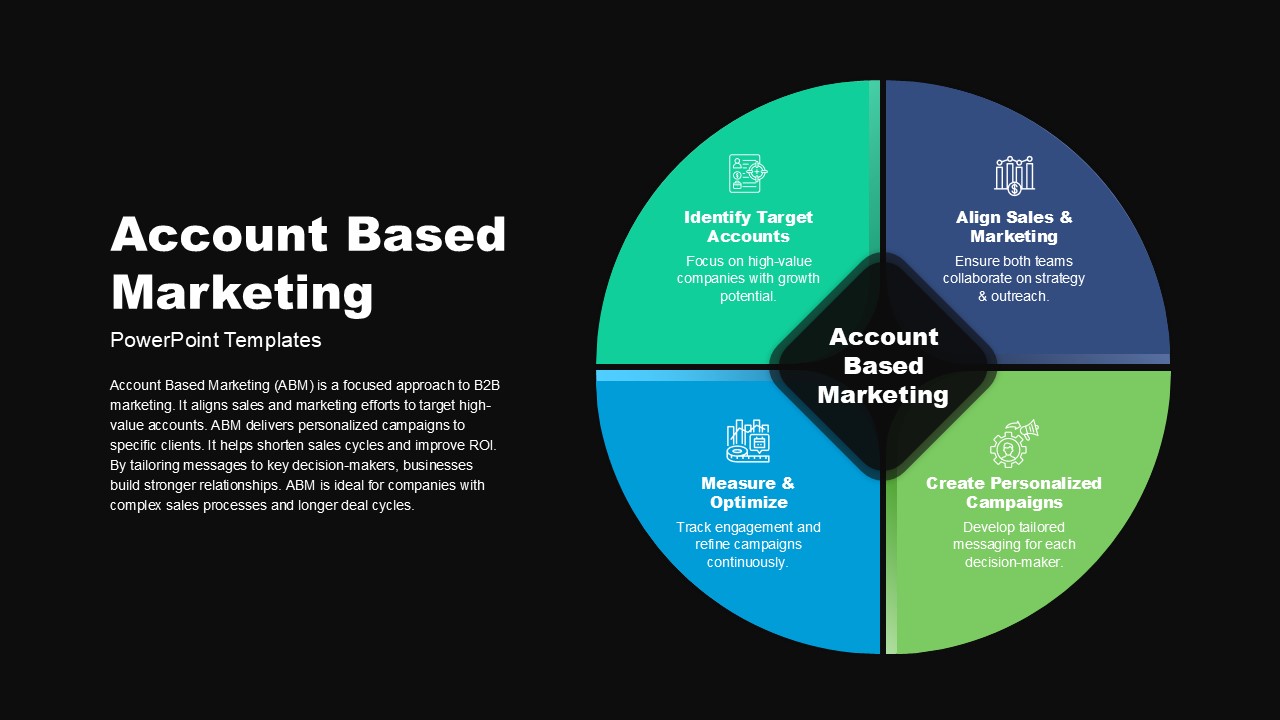
Account Based Marketing Circular Infographic Template for PowerPoint & Google Slides
Marketing
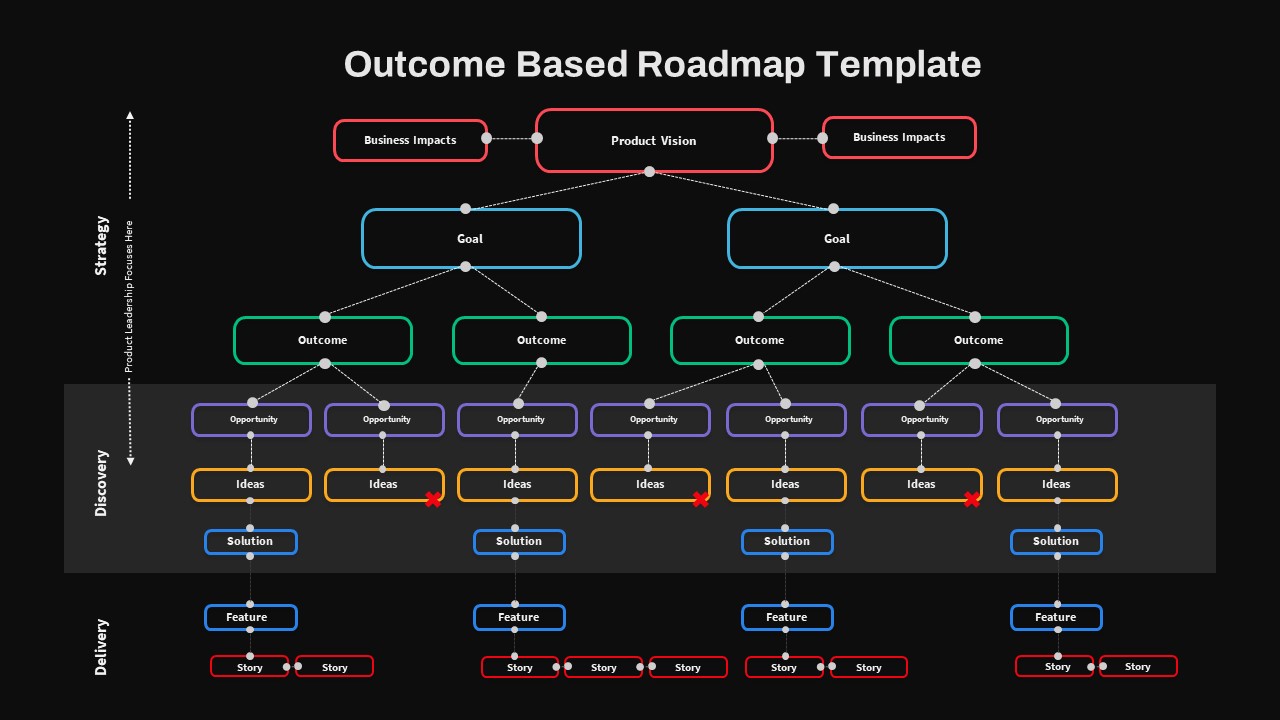
Outcome-Based Roadmap Hierarchy Template for PowerPoint & Google Slides
Roadmap
Simple Organizational Chart Infographic Template for PowerPoint & Google Slides
Org Chart
Organizational Chart Template for PowerPoint & Google Slides
Org Chart
Organizational People Percentage Chart template for PowerPoint & Google Slides
Org Chart
Organizational Structure Org Chart Template for PowerPoint & Google Slides
Org Chart
Organizational Chart Structure template for PowerPoint & Google Slides
Org Chart
Isometric Organizational Structure Chart Template for PowerPoint & Google Slides
Org Chart
Corporate Organizational Chart Hierarchy Template for PowerPoint & Google Slides
Org Chart
Organizational Structure Hierarchy Chart Template for PowerPoint & Google Slides
Org Chart
Creative Organizational Chart Template for PowerPoint & Google Slides
Org Chart
Professional Organizational Chart Diagram Template for PowerPoint & Google Slides
Org Chart
Organizational Chart Overview template for PowerPoint & Google Slides
Org Chart
Organizational Chart Structure template for PowerPoint & Google Slides
Business Plan
Organizational Chart Template for PowerPoint & Google Slides
Our Team
Organizational Chart template for PowerPoint & Google Slides
Org Chart
Organizational Chart template for PowerPoint & Google Slides
Org Chart
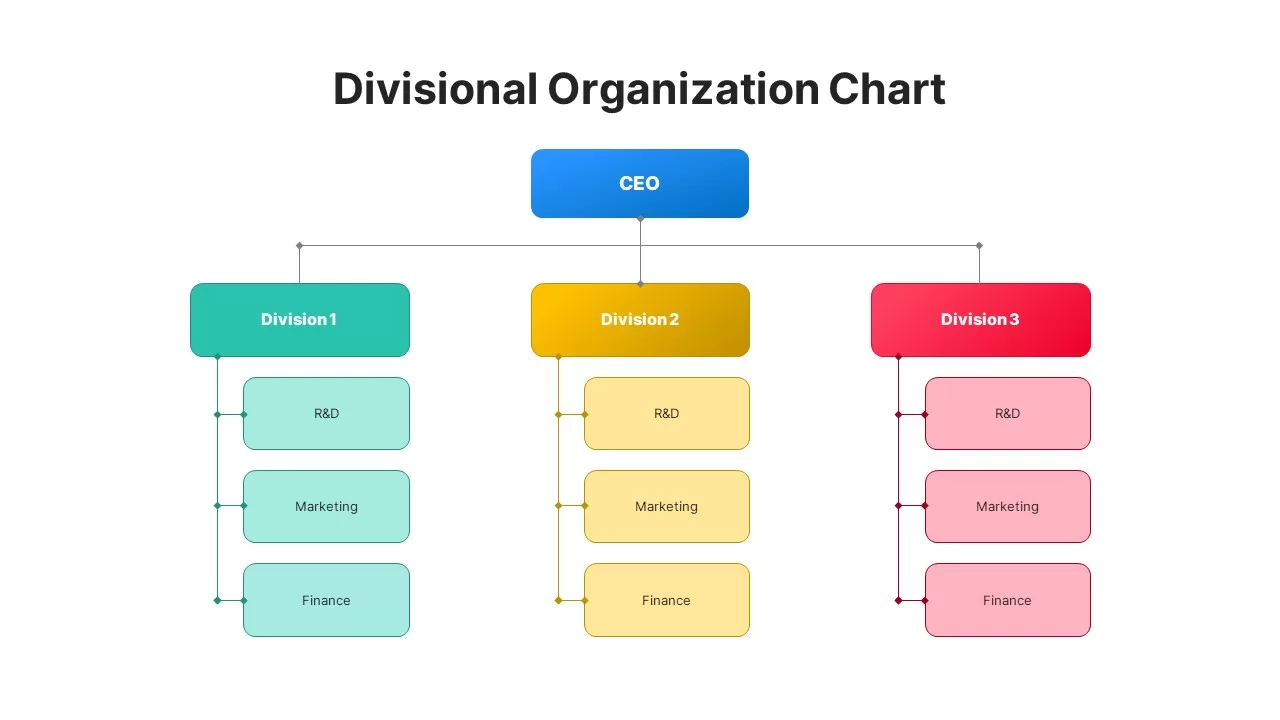
Divisional Organizational Chart Diagram Template for PowerPoint & Google Slides
Org Chart
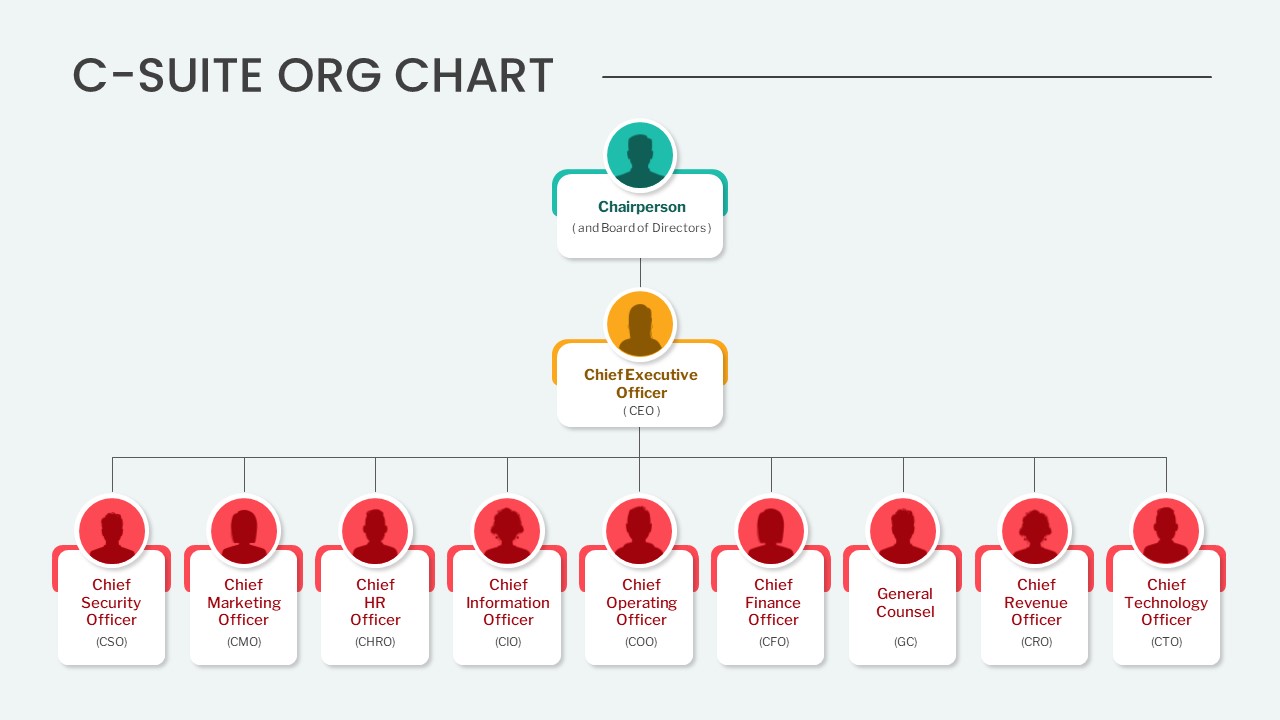
Editable C-Suite Organizational Chart Template for PowerPoint & Google Slides
Org Chart
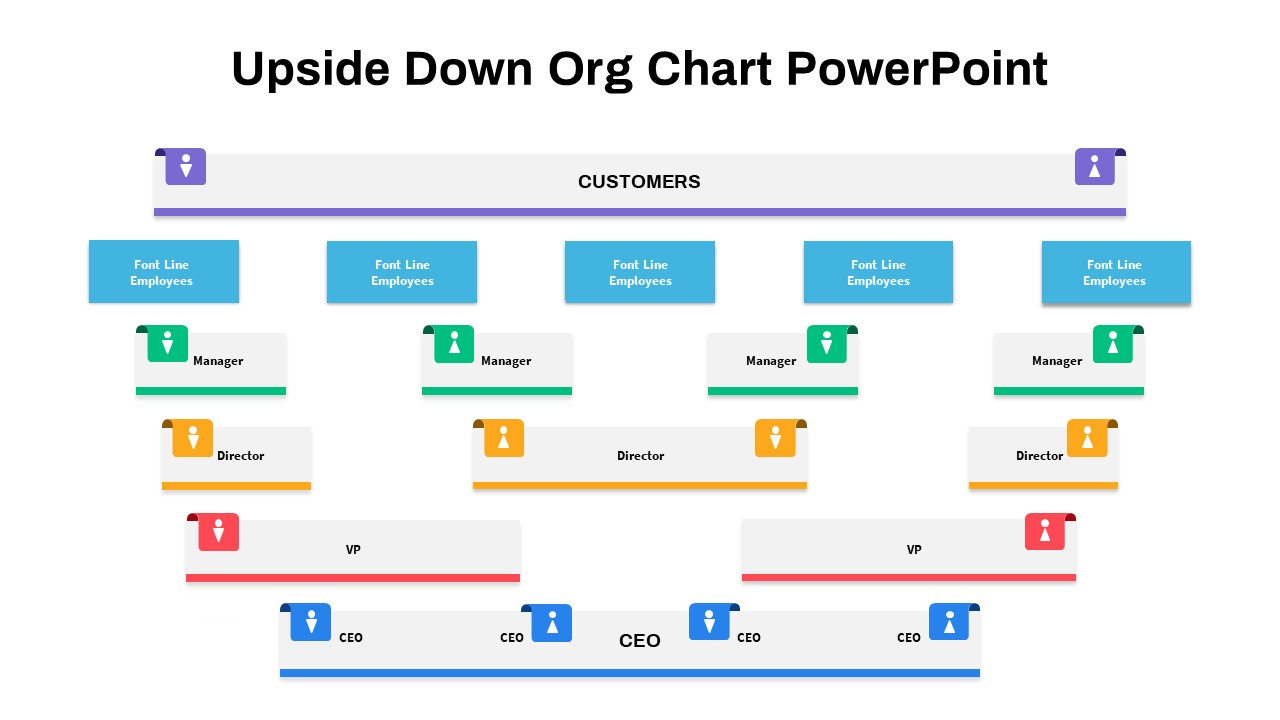
Upside-Down Organizational Chart Diagram Template for PowerPoint & Google Slides
Org Chart
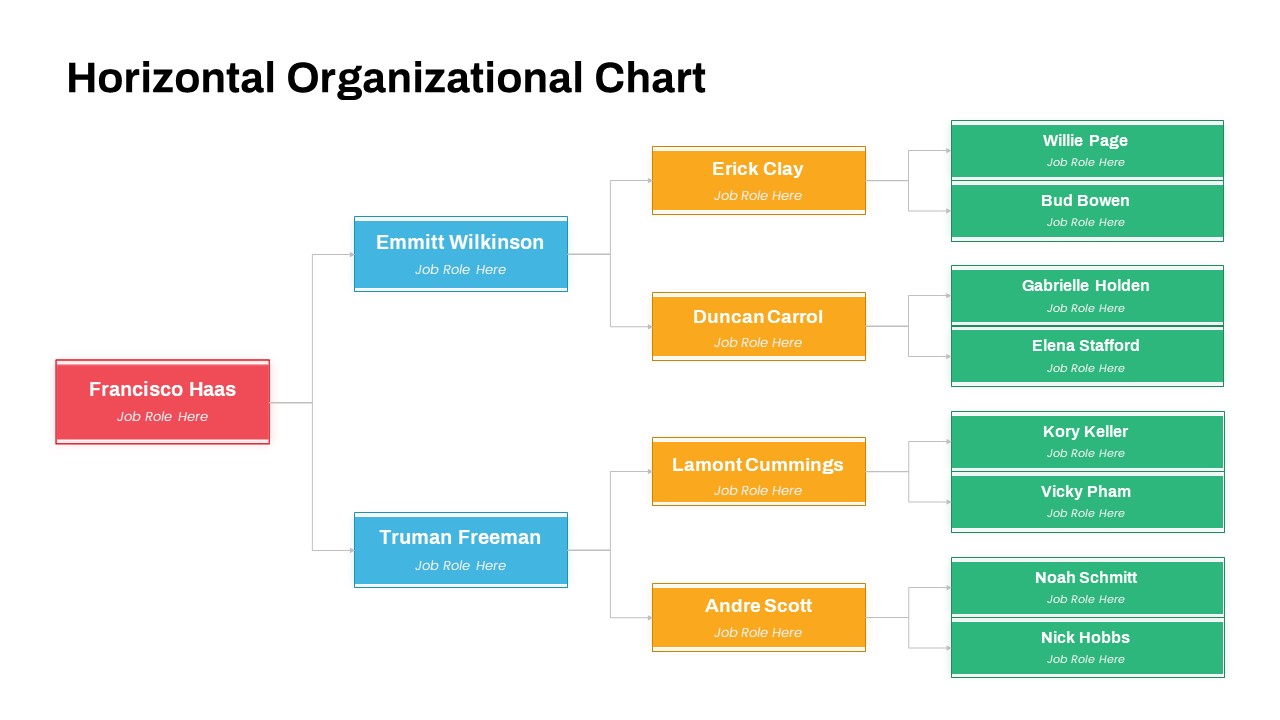
Horizontal Organizational Chart Template for PowerPoint & Google Slides
Org Chart
Free Corporate Hierarchy Organizational Chart Template for PowerPoint & Google Slides
Org Chart
Free
Horizontal Organizational Chart Template for PowerPoint & Google Slides
Org Chart

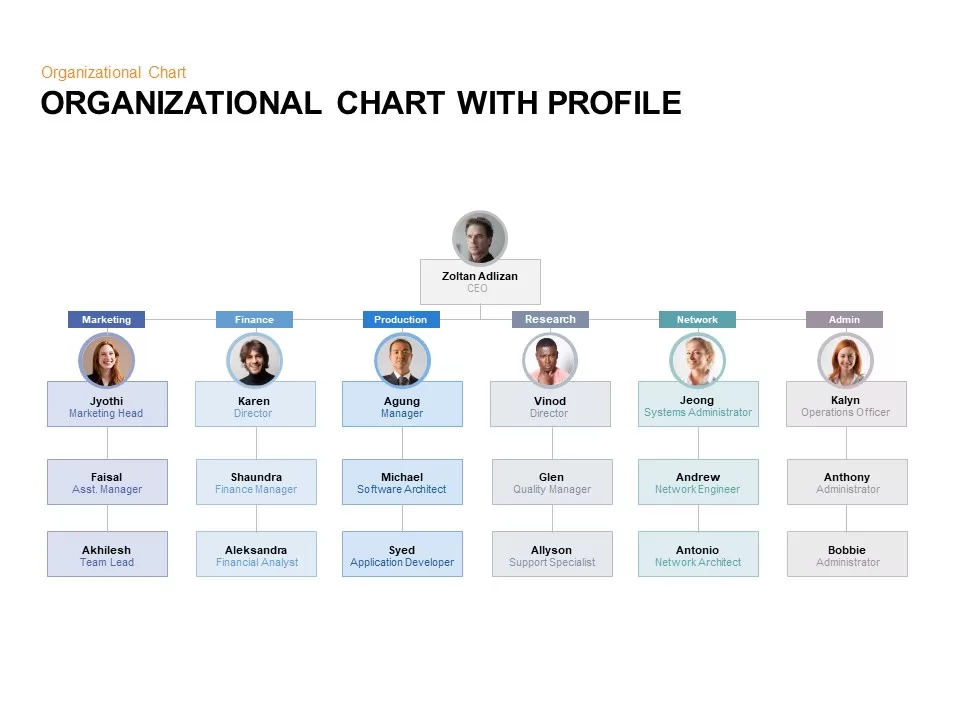
Organizational Chart with Profile for PowerPoint & Google Slides
Org Chart
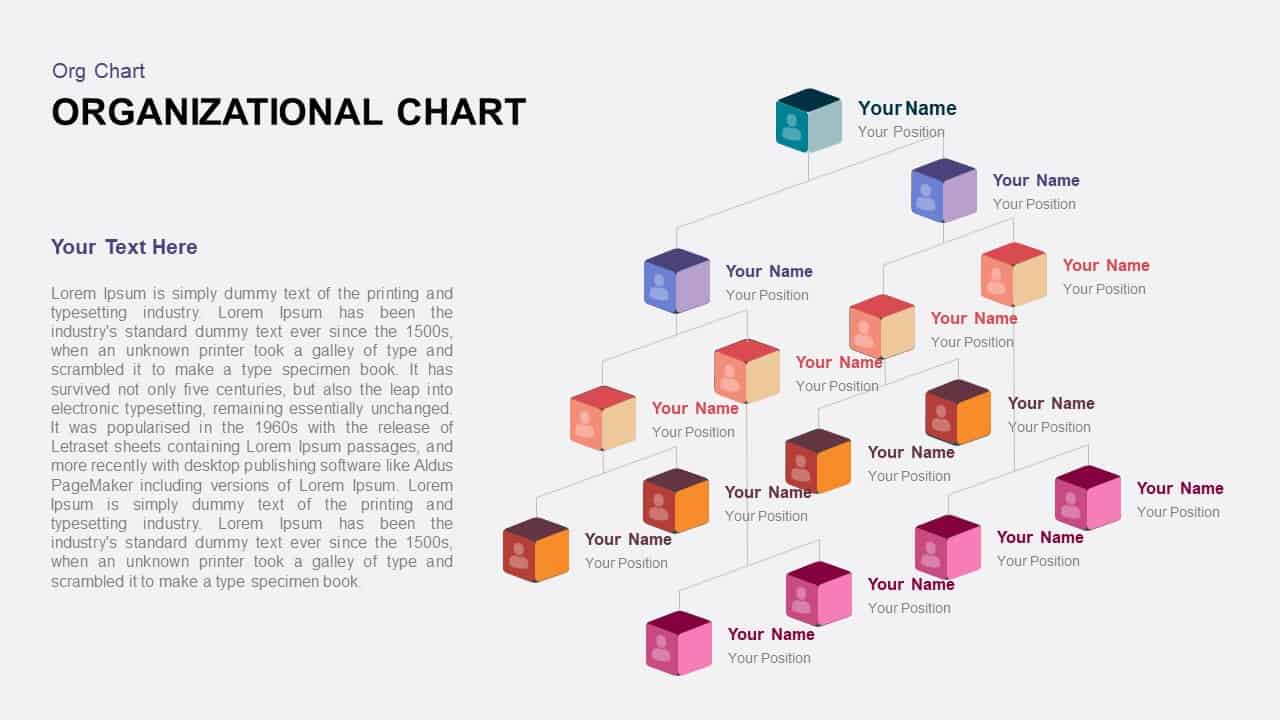
3D Color Block Organizational Chart Slide for PowerPoint & Google Slides
Org Chart
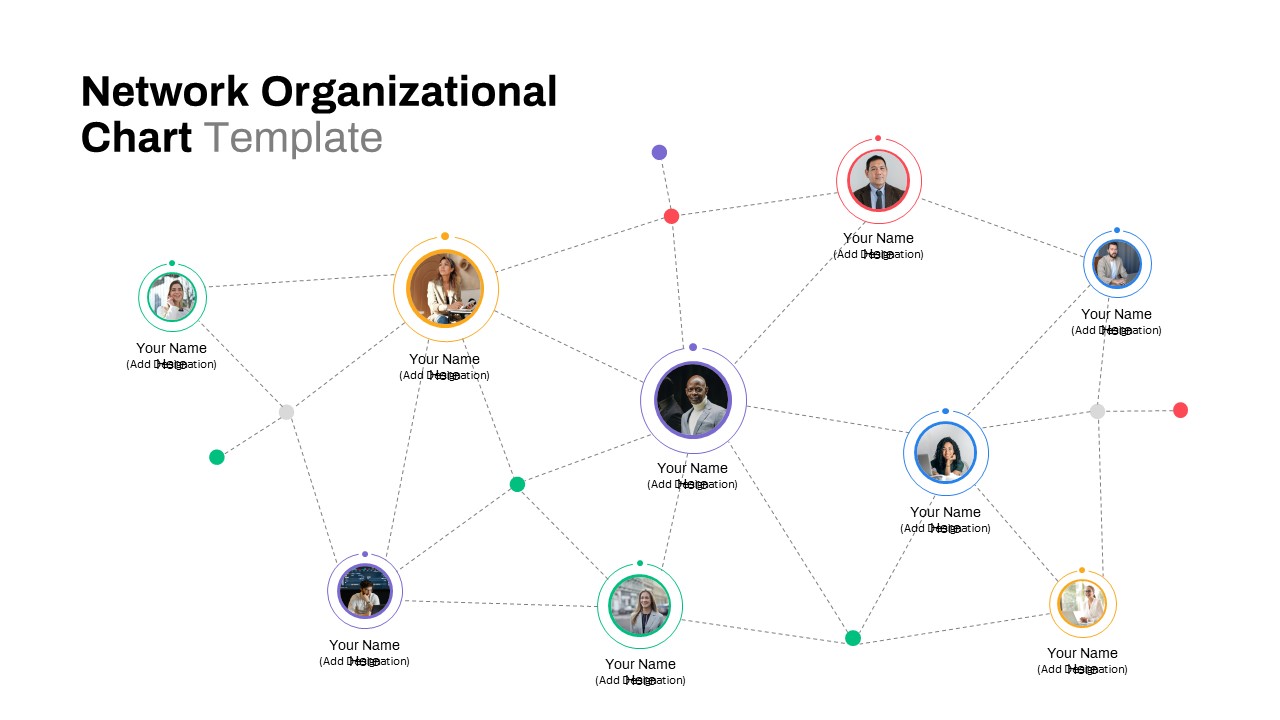
Network Organizational Chart for PowerPoint & Google Slides
Business
Free Organizational Chart for PowerPoint & Google Slides
Business
Free

Modern Ten-Block Section Title Chart template for PowerPoint & Google Slides
Comparison
Modern Colorful Circular Org Chart Template for PowerPoint & Google Slides
Org Chart
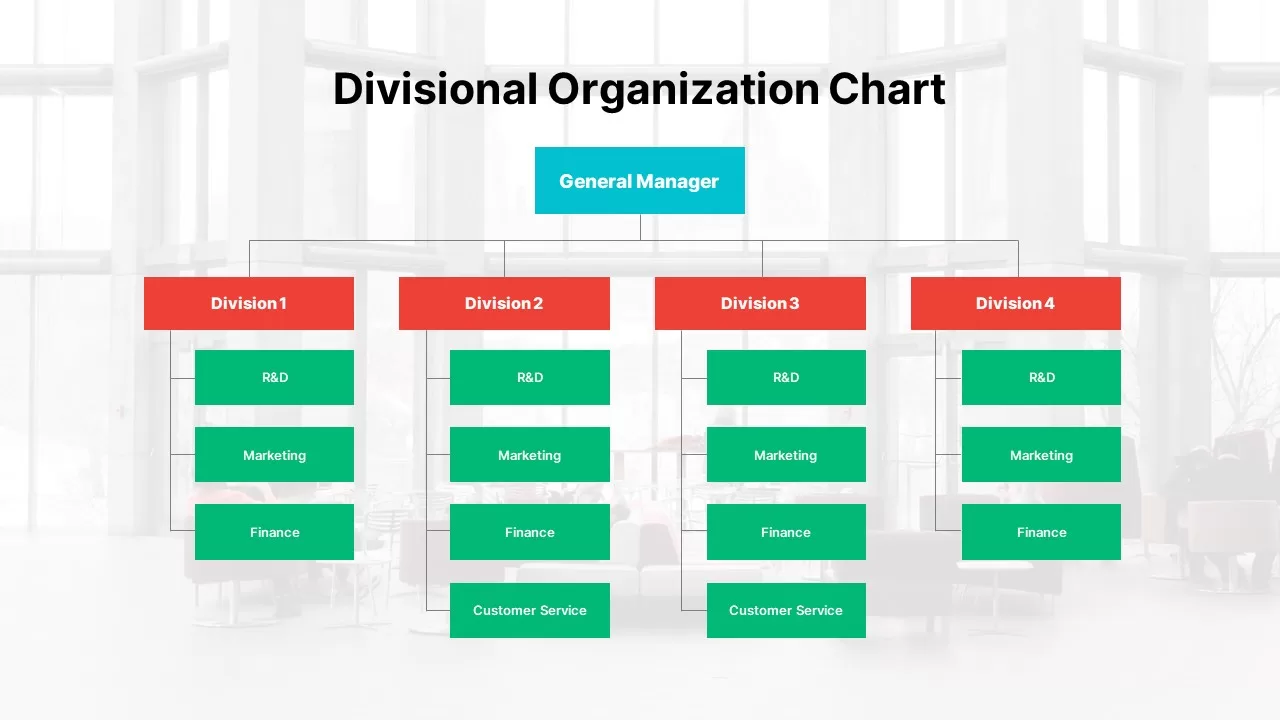
Modern Divisional Organization Chart Template for PowerPoint & Google Slides
Org Chart
Modern Multi-Color Polar Chart Diagram Template for PowerPoint & Google Slides
Charts

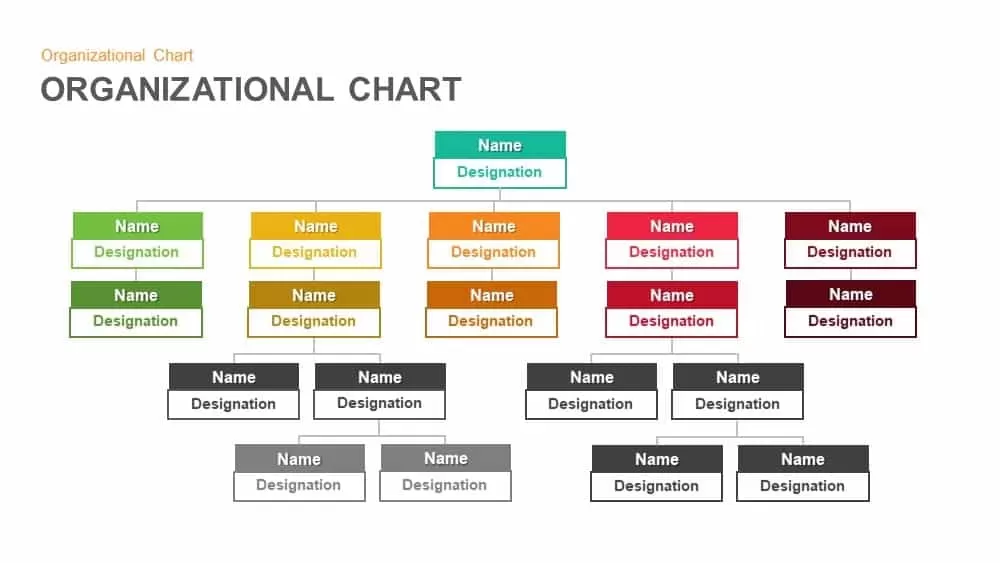
Organizational Chart Hierarchy Templates for PowerPoint and Keynote
Org Chart

Free Modern Gradient Wave Welcome Slides Template for PowerPoint & Google Slides
Free
Free
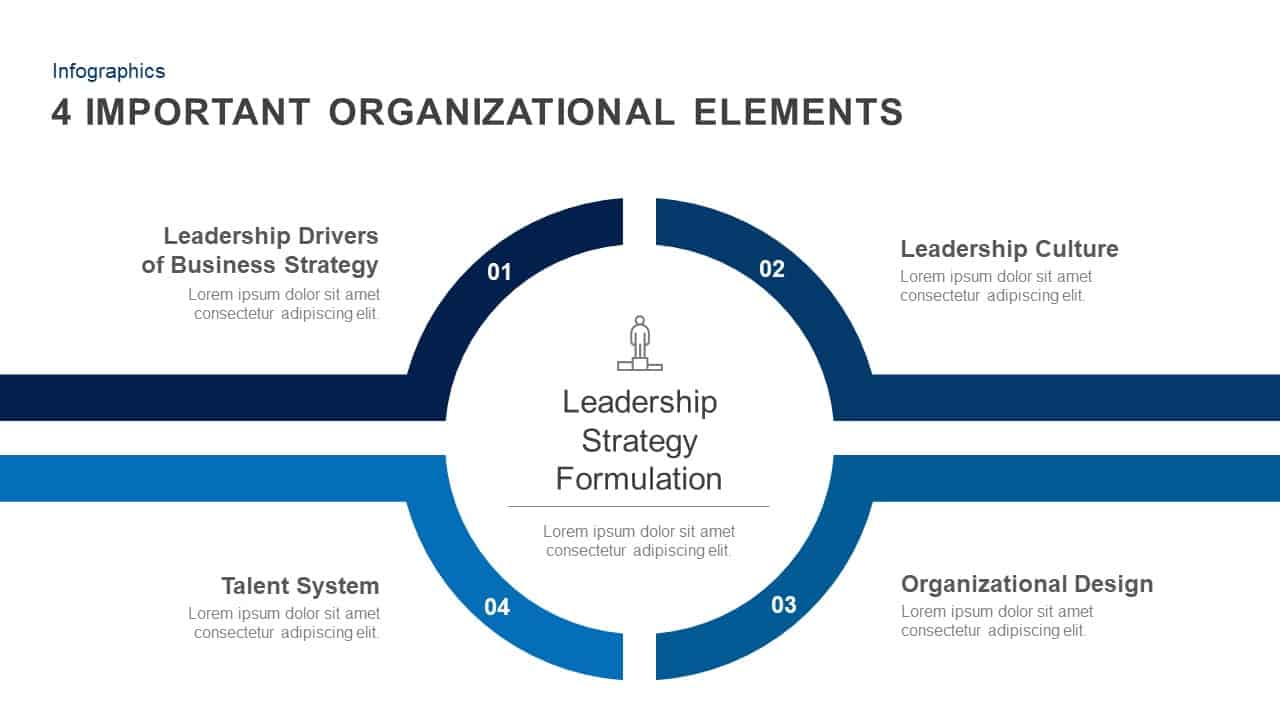
4 Important Organizational Elements template for PowerPoint & Google Slides
Infographics
Hierarchical Organizational Structure Template for PowerPoint & Google Slides
Org Chart
Organizational Structure Diagram Template for PowerPoint & Google Slides
Org Chart
Circular Organizational Structure Layout Template for PowerPoint & Google Slides
Org Chart
Organizational Maturity Model Diagram Template for PowerPoint & Google Slides
Process
Mintzberg Organizational Model Gradient Template for PowerPoint & Google Slides
Business
Circular Organizational Structure Template for PowerPoint & Google Slides
Org Chart
Organizational Congruence Model Diagram Template for PowerPoint & Google Slides
Process
Organizational Behavior Hexagon Diagram Template for PowerPoint & Google Slides
Circular
Organizational Culture Framework Diagram Template for PowerPoint & Google Slides
Arrow
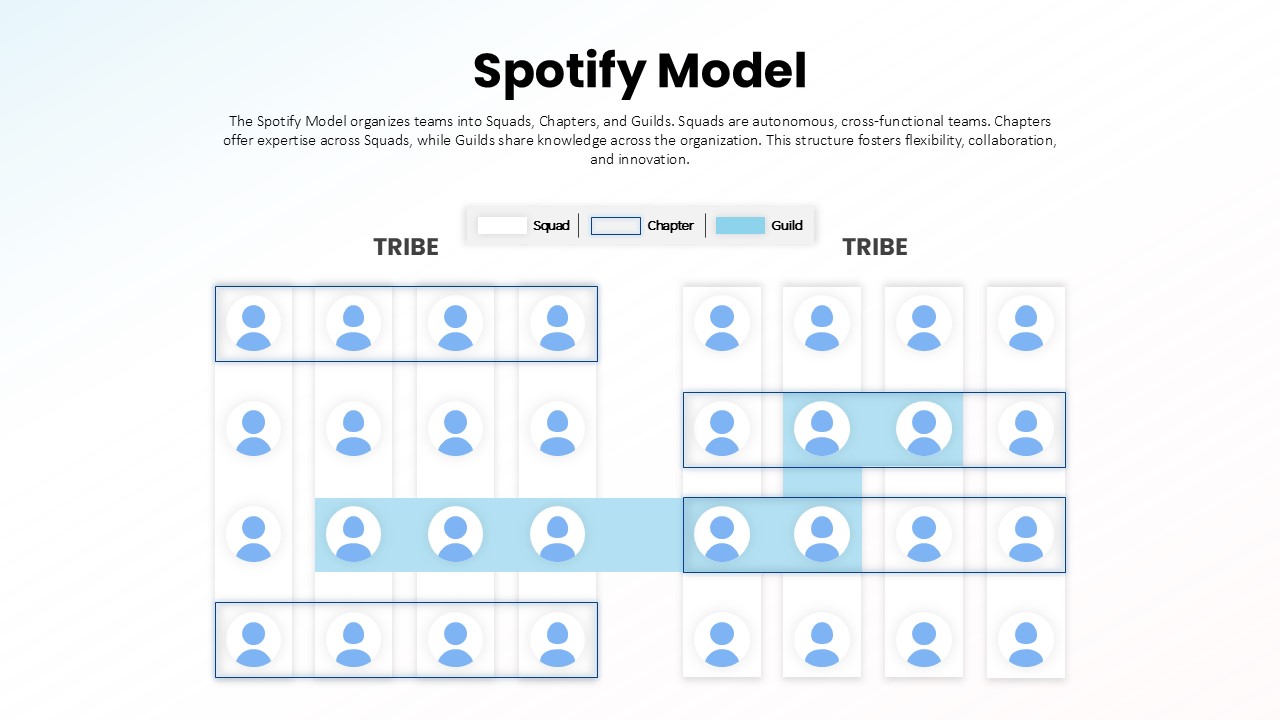
Spotify Model Organizational Structure template for PowerPoint & Google Slides
Business Strategy
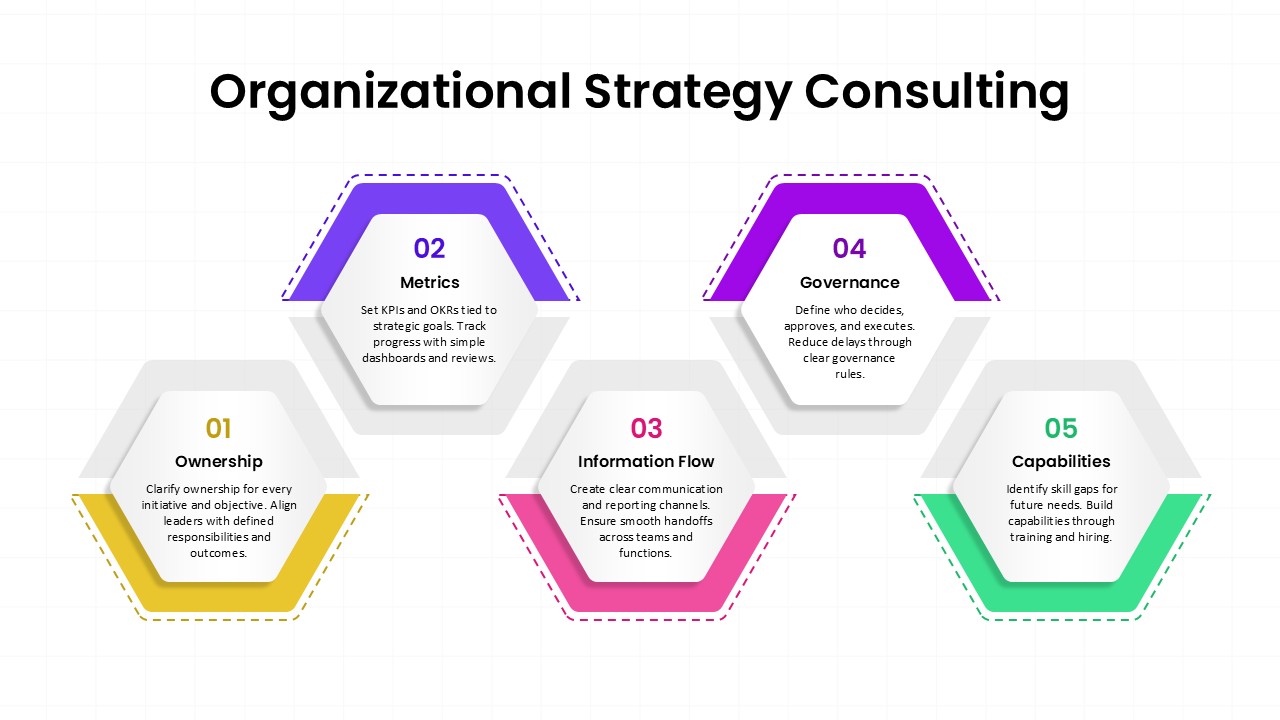
Organizational Strategy Consulting Framework Template for PowerPoint & Google Slides
Consulting

Organizational Structure Diagram for PowerPoint & Google Slides
Org Chart

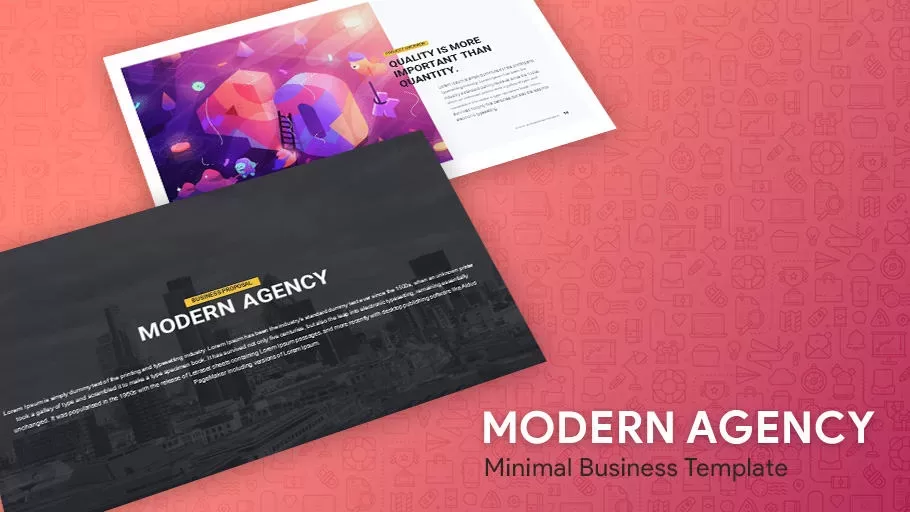
Modern Business Agency PowerPoint Template for PowerPoint & Google Slides
Company Profile
Modern Step Growth Infographics Template for PowerPoint & Google Slides
Process

Modern 9-Section Circle Infographics Template for PowerPoint & Google Slides
Circular
Modern Orange Business Plan Design Theme Template for PowerPoint & Google Slides
Company Profile
Modern Bubble Timeline Infographic Template for PowerPoint & Google Slides
Timeline
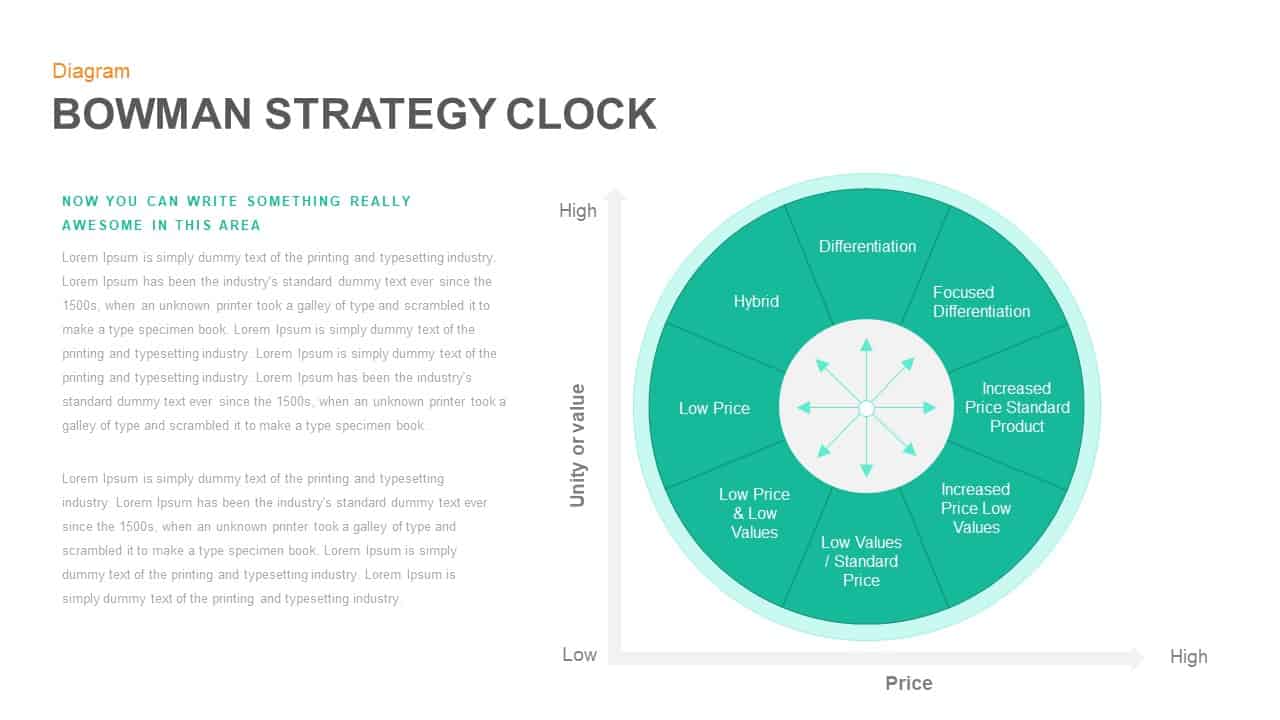
Modern Bowman Strategy Clock Diagram Slide Template for PowerPoint & Google Slides
Competitor Analysis
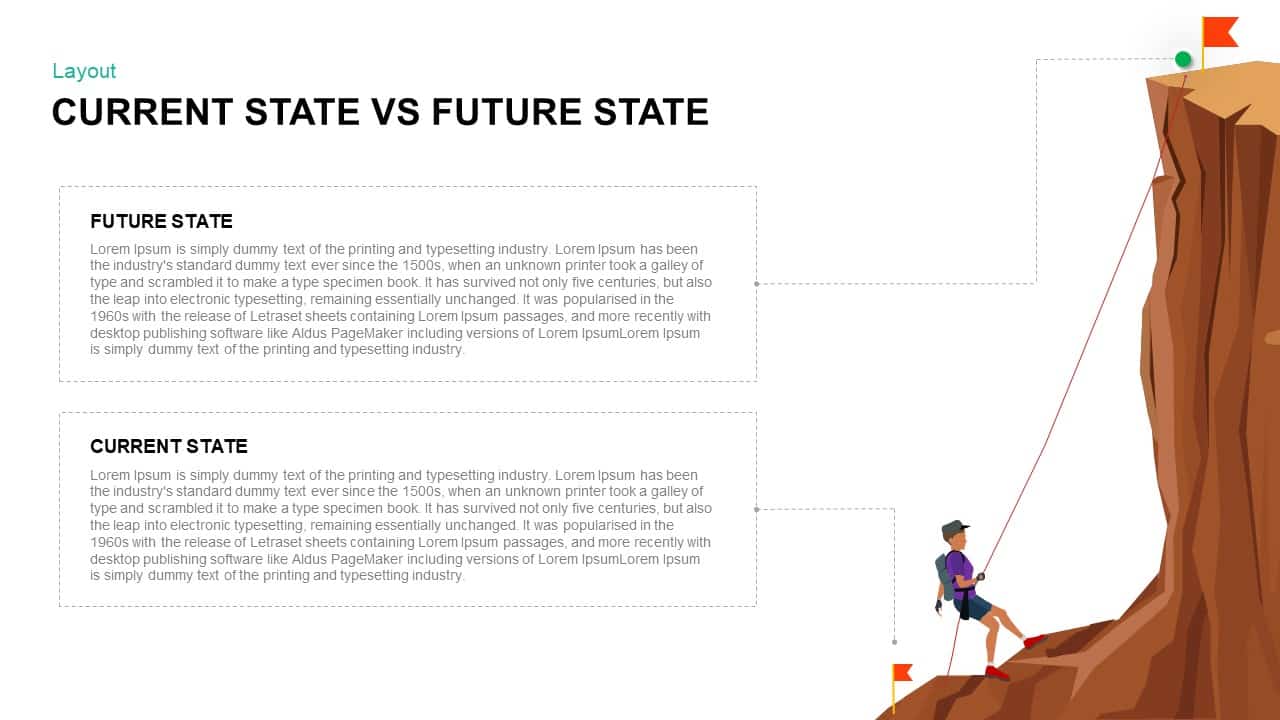
Modern Current vs Future State Template for PowerPoint & Google Slides
Comparison
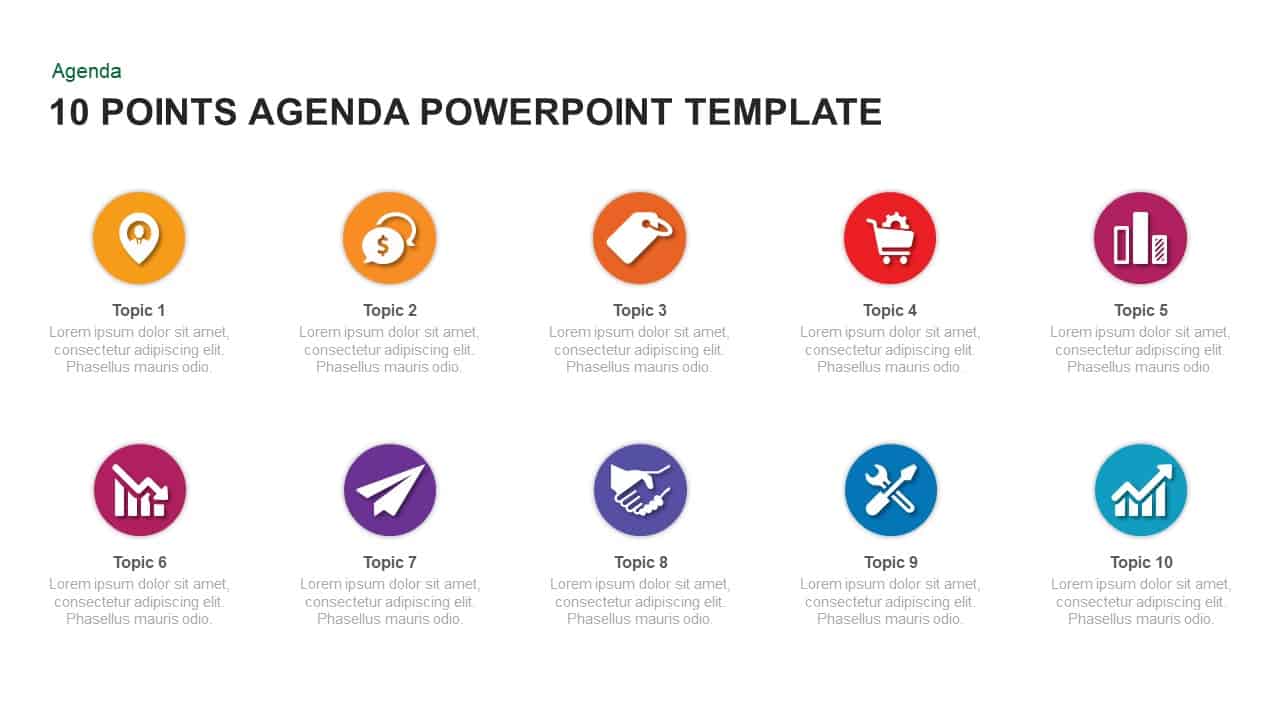
Modern 10-Point Agenda Infographic Template for PowerPoint & Google Slides
Agenda

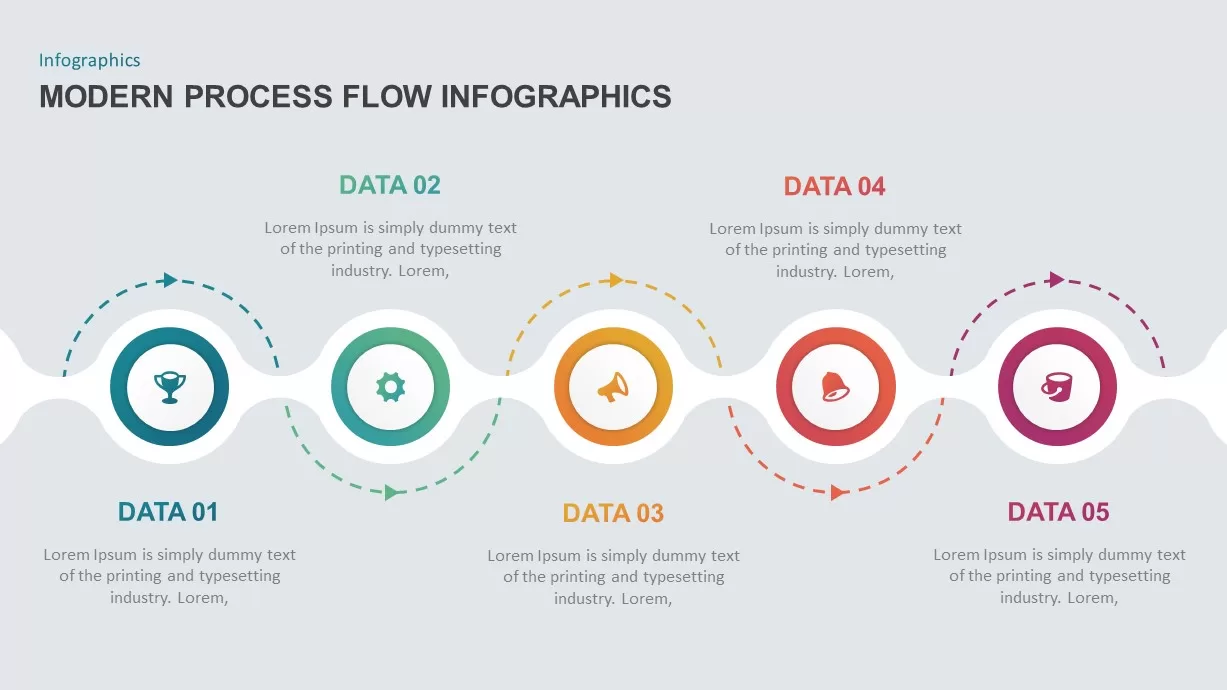
Modern 5-Step Process Flow Infographic Template for PowerPoint & Google Slides
Process
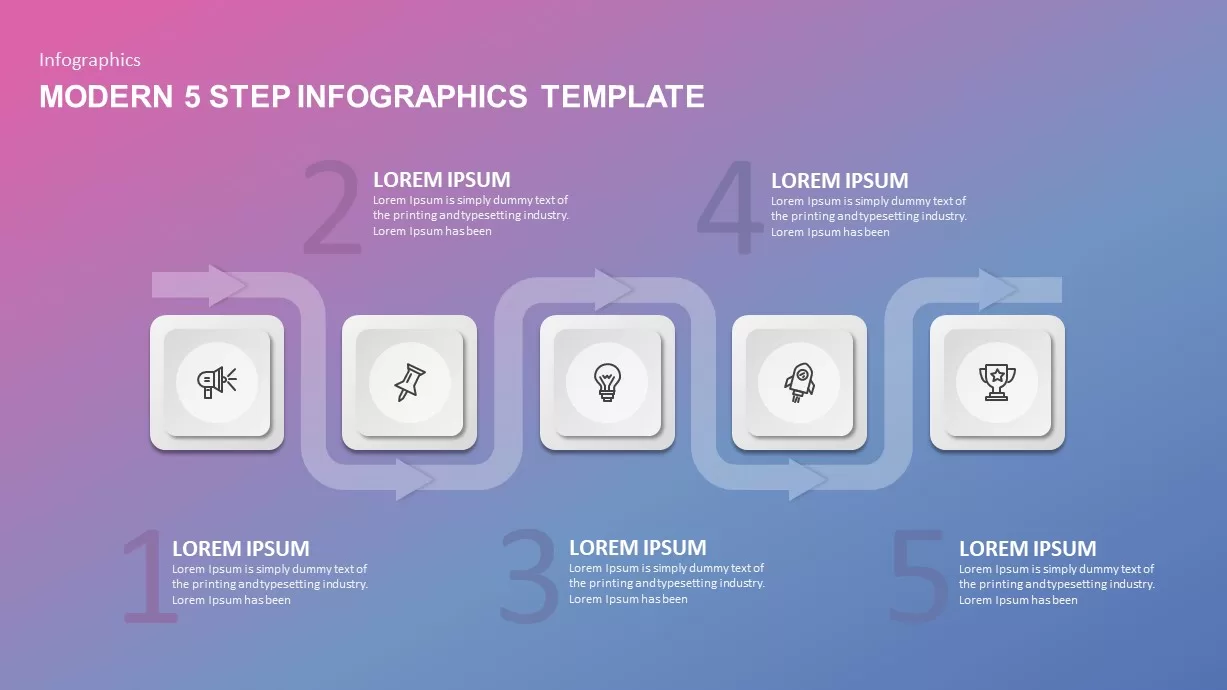
Modern 5-Step Flow Infographics Template for PowerPoint & Google Slides
Process
Modern Digital Marketing Strategy Template for PowerPoint & Google Slides
Pitch Deck
Modern Cycle Process Template for PowerPoint & Google Slides
Business Proposal
Modern Circular OODA Loop Infographic Template for PowerPoint & Google Slides
Circular
Modern Video Game Pitch Deck Template for PowerPoint & Google Slides
Pitch Deck
Modern LIFO Template for PowerPoint & Google Slides
Accounting
Modern Infographic Process template for PowerPoint & Google Slides
Infographics
Modern Four-Step Agenda Slide Layout Template for PowerPoint & Google Slides
Agenda
Modern Green Timeline Infographic Template for PowerPoint & Google Slides
Timeline
Modern Project Status Report Dashboard Template for PowerPoint & Google Slides
Project Status
Modern Ribbon Six-Step Agenda Slide Template for PowerPoint & Google Slides
Agenda
Modern Technology Solutions Overview template for PowerPoint & Google Slides
Information Technology
Free Modern Four-Step Agenda Infographic Template for PowerPoint & Google Slides
Agenda
Free
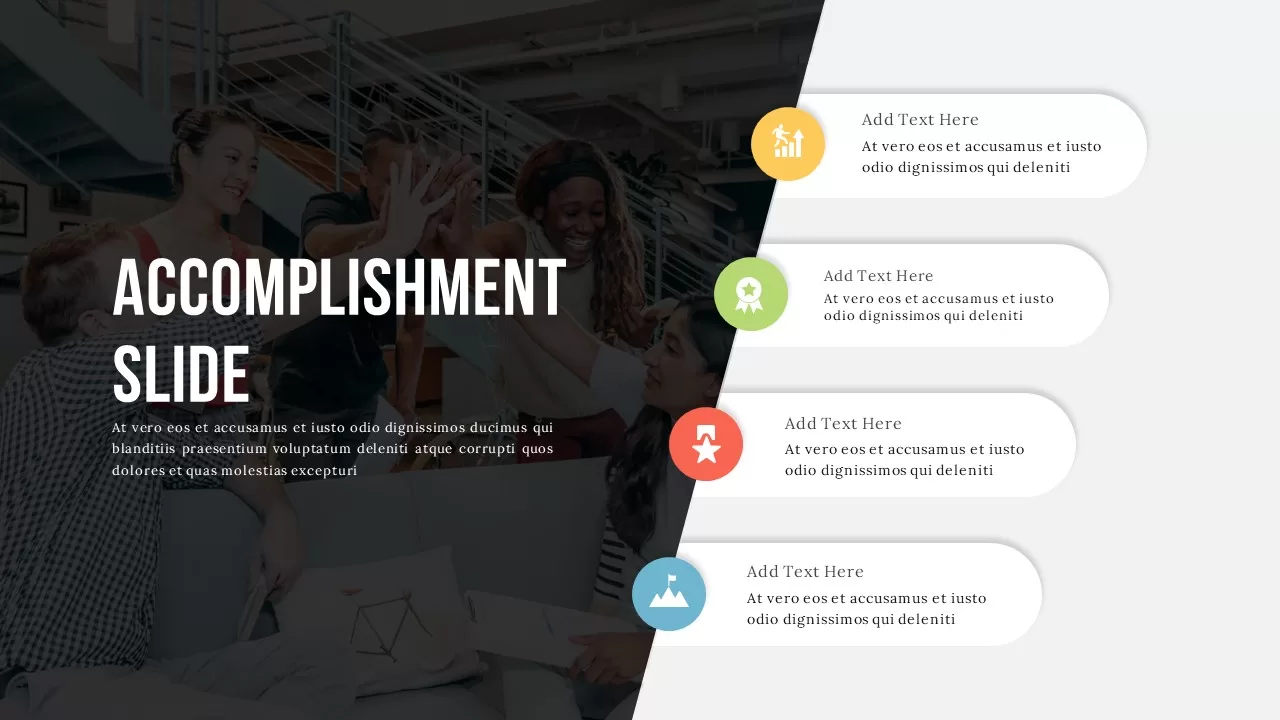
Modern Accomplishment Slide with Icons Template for PowerPoint & Google Slides
Business
Modern Company Profile About Us Slide Template for PowerPoint & Google Slides
Company Profile
Modern Mosaic Photo Grid Layout Template for PowerPoint & Google Slides
Graphics

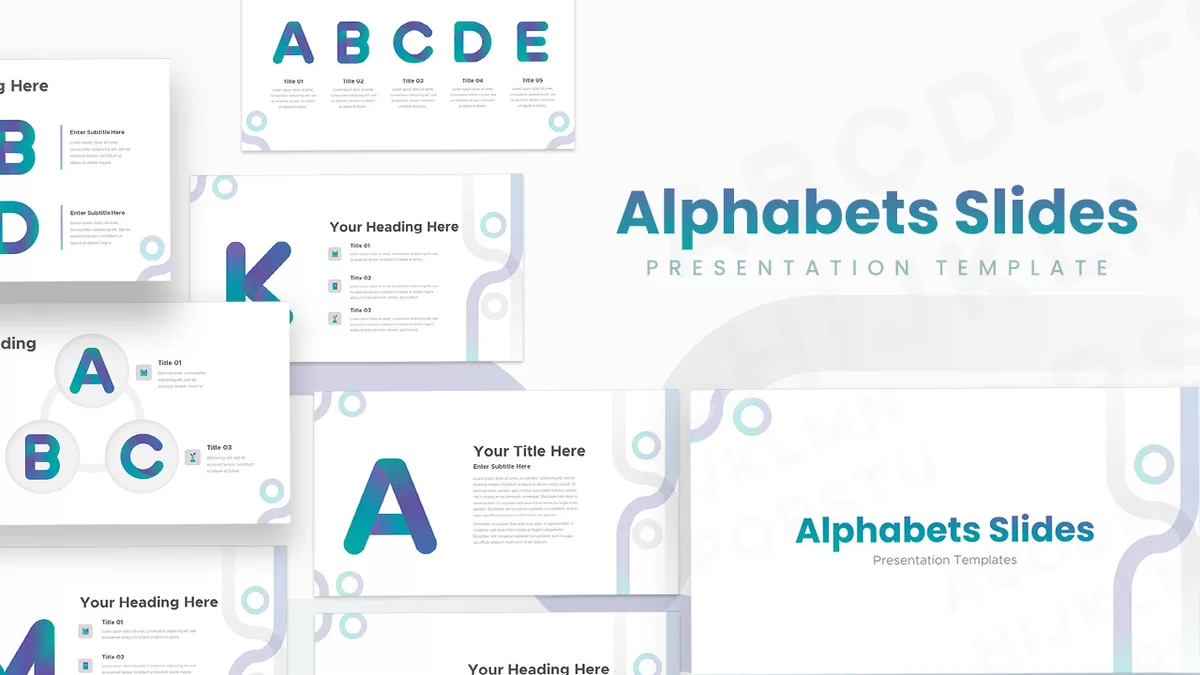
Modern Alphabet Letter Slide Deck Template for PowerPoint & Google Slides
Decks
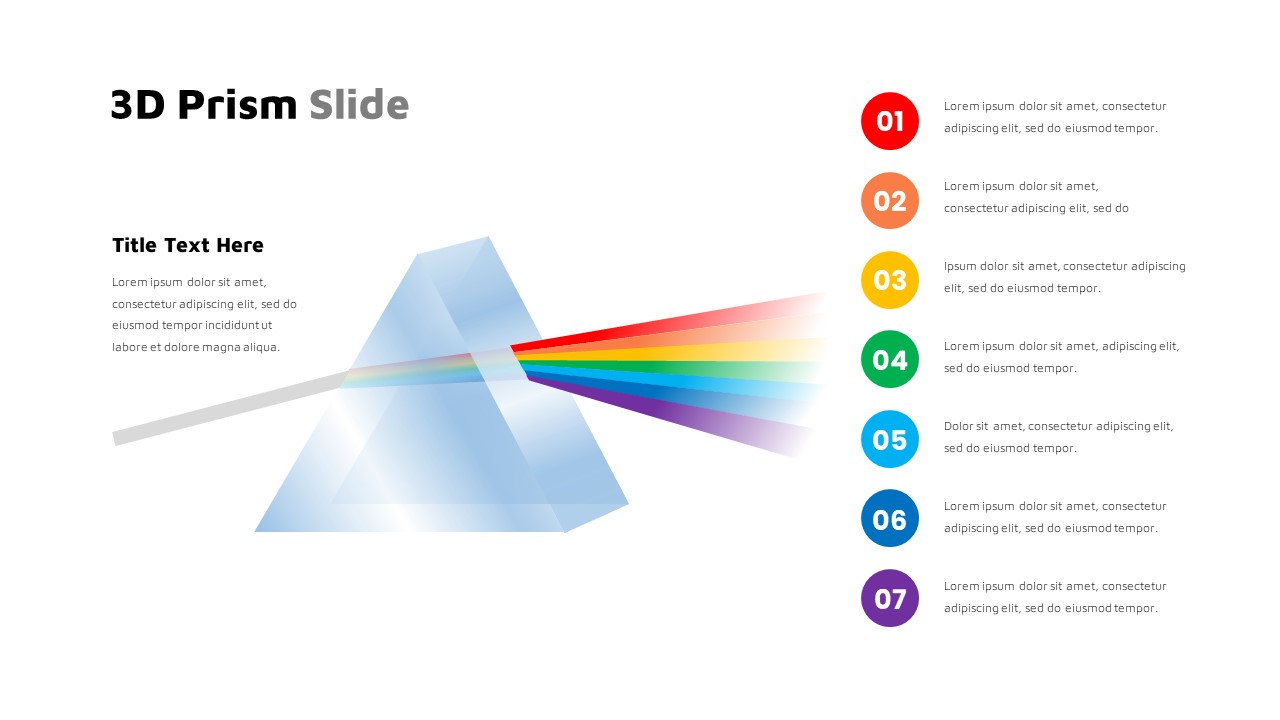
Modern Seven-Step 3D Prism Diagram Template for PowerPoint & Google Slides
Process
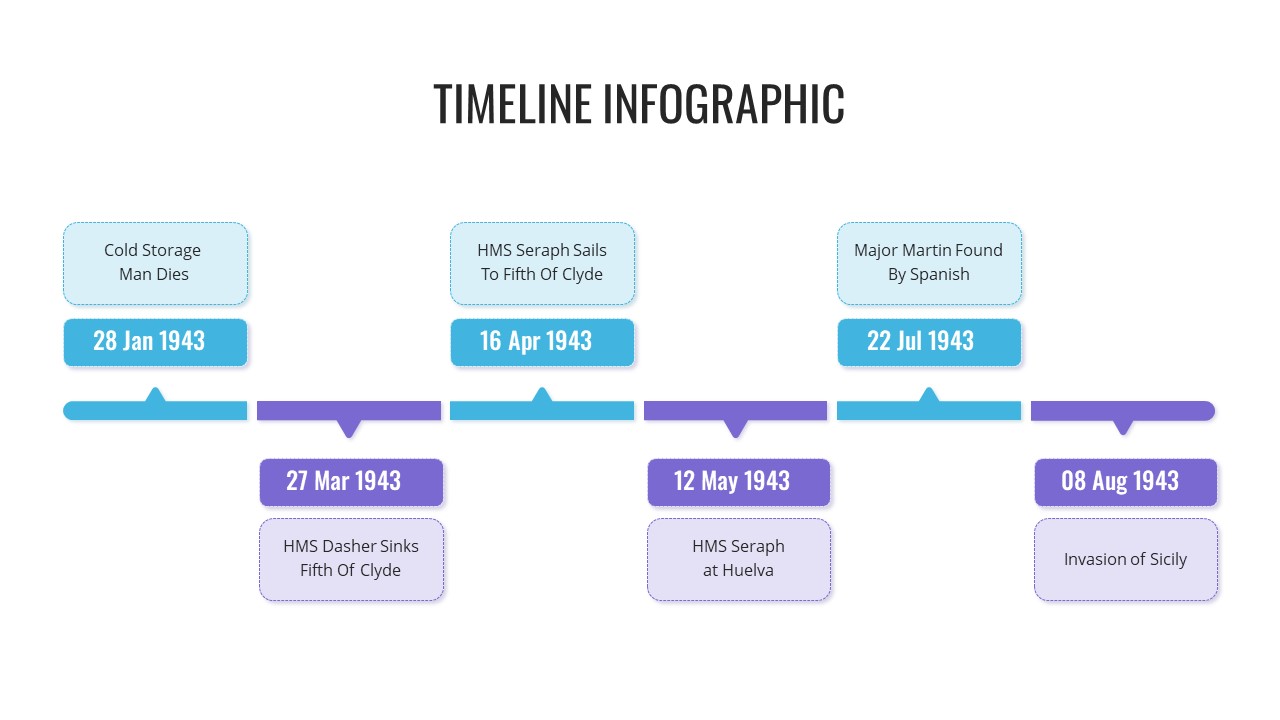
Modern Six-Point Timeline Infographic Template for PowerPoint & Google Slides
Timeline
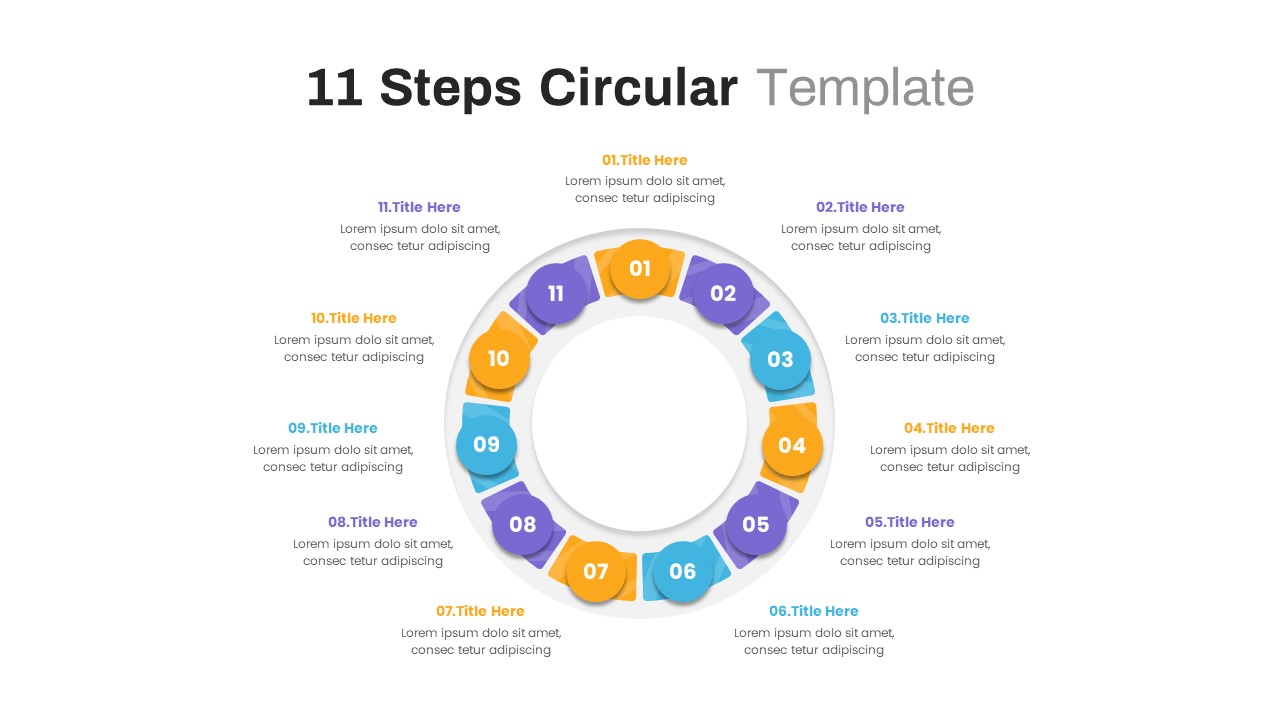
Modern 11-Step Circular Timeline Template for PowerPoint & Google Slides
Timeline
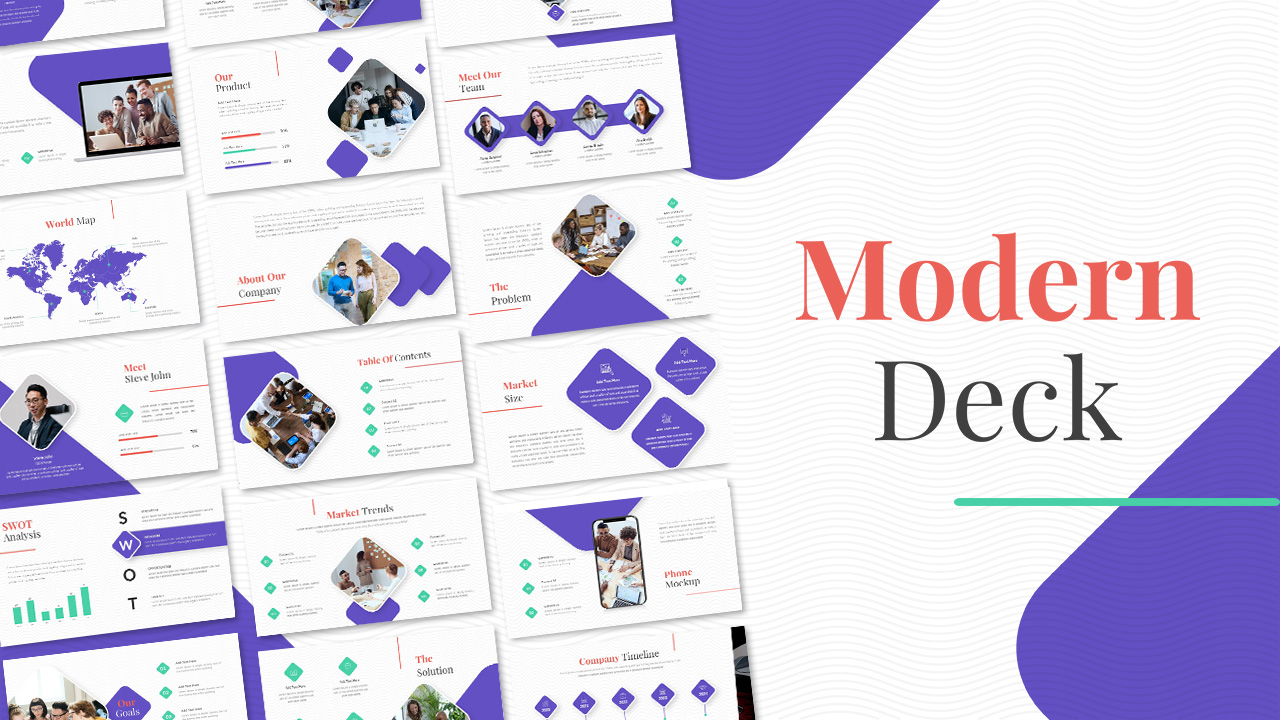
Free Modern Multipurpose Pitch Deck Template for PowerPoint & Google Slides
Pitch Deck
Free
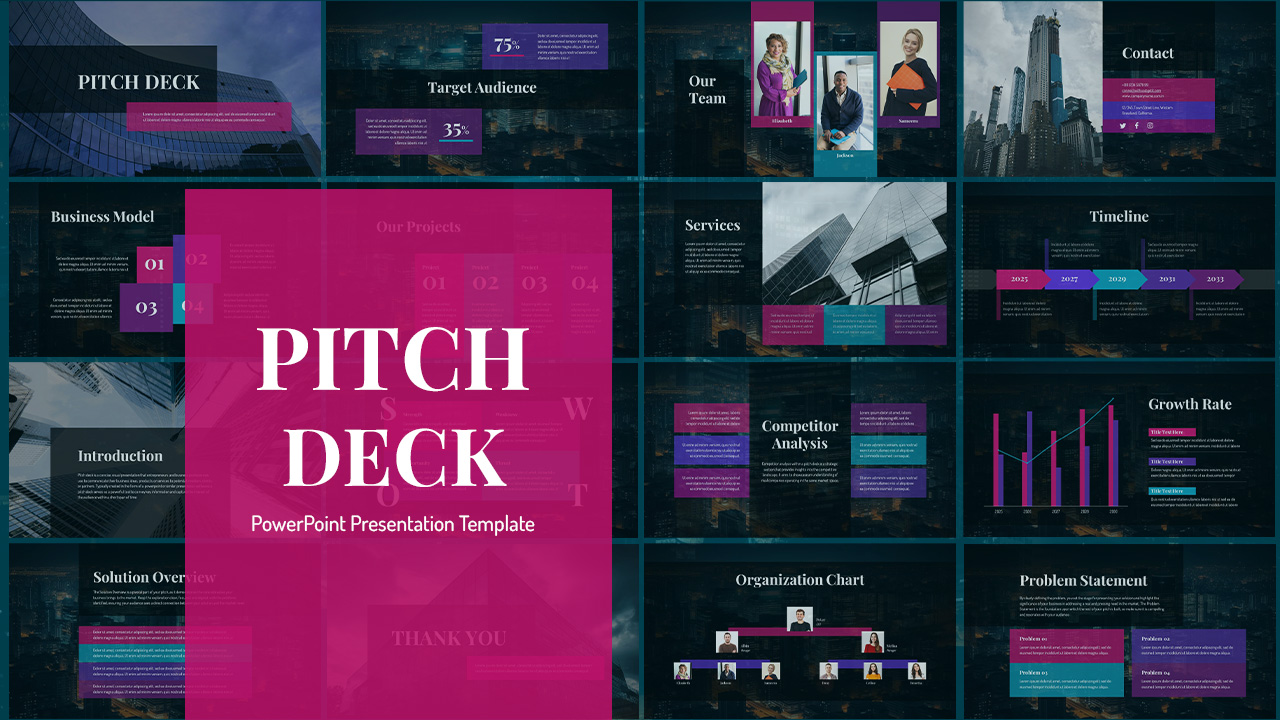
Free Modern Dark Pitch Deck Presentation Template for PowerPoint & Google Slides
Pitch Deck
Free
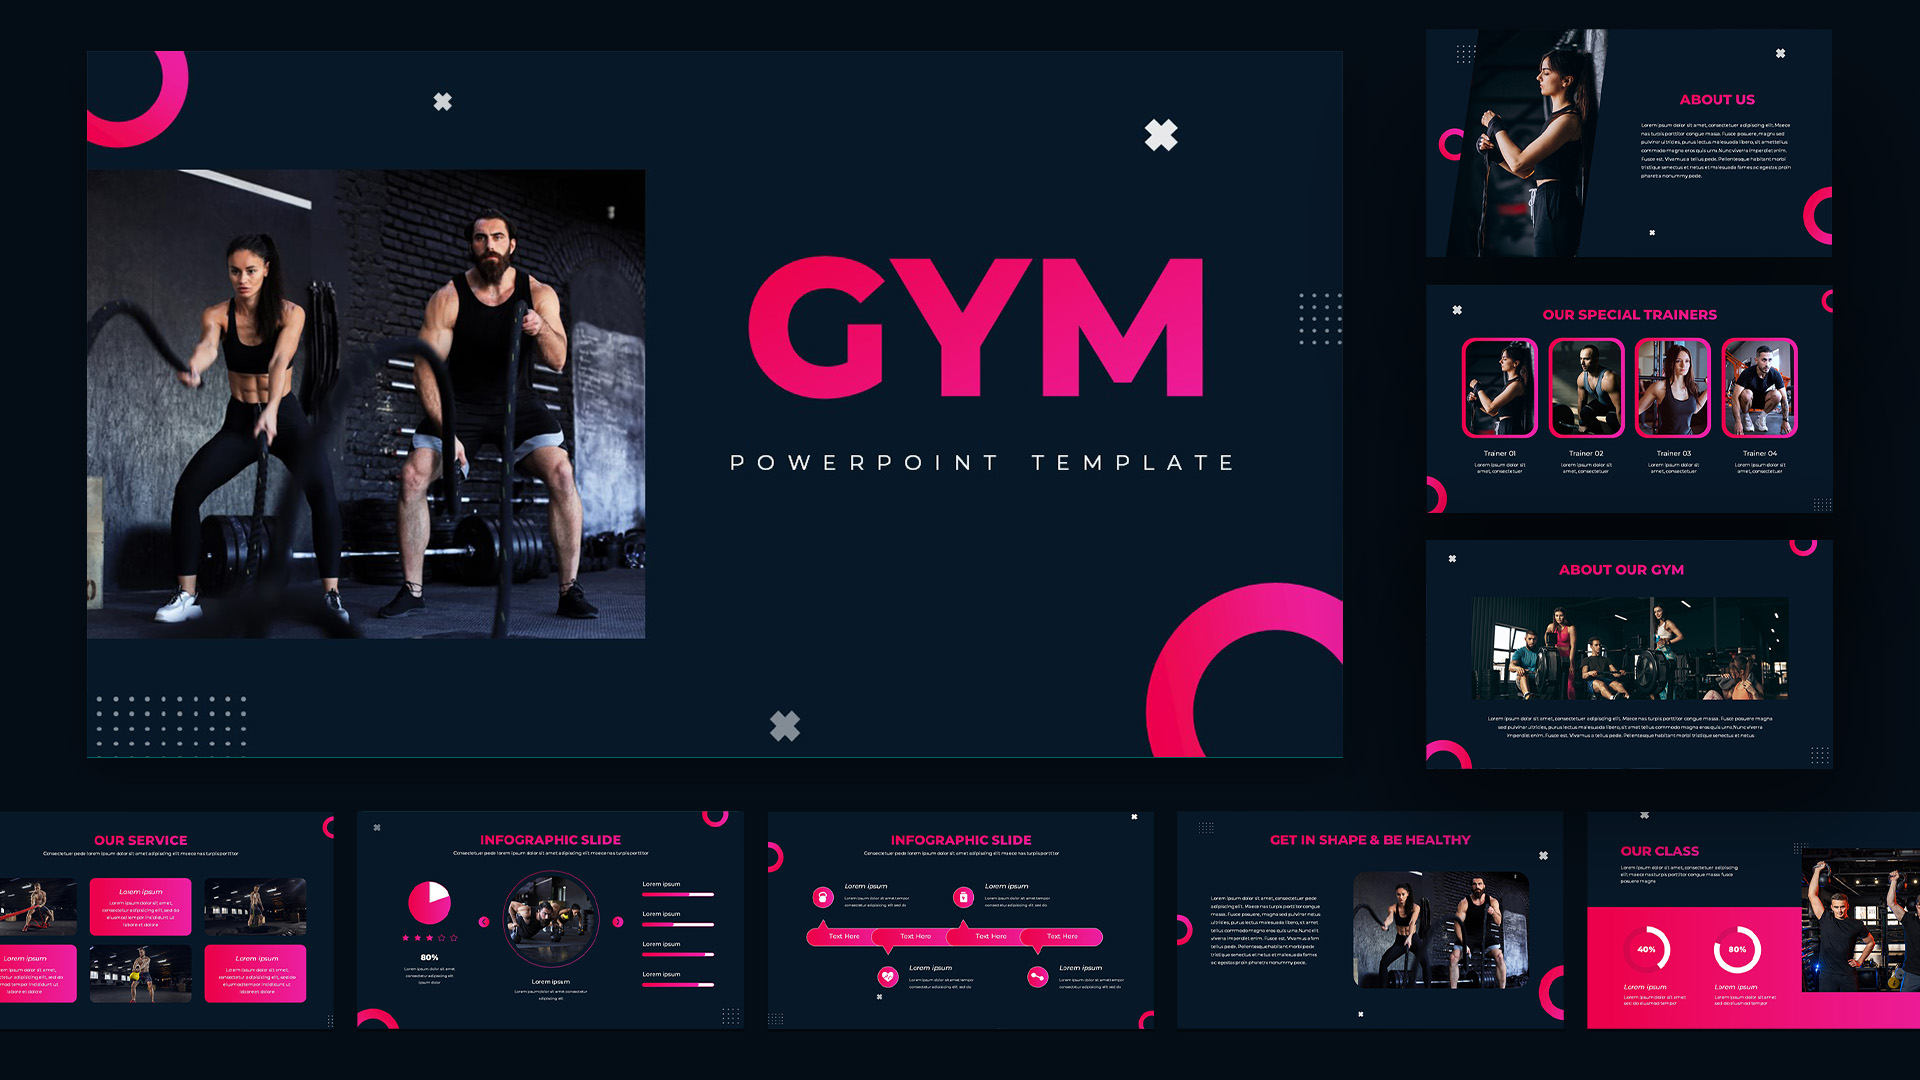
Modern Dark Gym & Fitness Presentation Template for PowerPoint & Google Slides
Pitch Deck
Modern Food Theme Presentation Template for PowerPoint & Google Slides
Pitch Deck
Free Modern Dunder Mifflin Pitch Deck Template for PowerPoint & Google Slides
Pitch Deck
Free
Modern Tier List Template for PowerPoint & Google Slides
Comparison
Modern Custom Eight-Branch Mind Map Template for PowerPoint & Google Slides
Mind Maps
Modern Professional Medical Service Template for PowerPoint & Google Slides
Health
Modern Business Snapshot Overview Template for PowerPoint & Google Slides
Business Report
Modern Business Journey Roadmap Template for PowerPoint & Google Slides
Roadmap
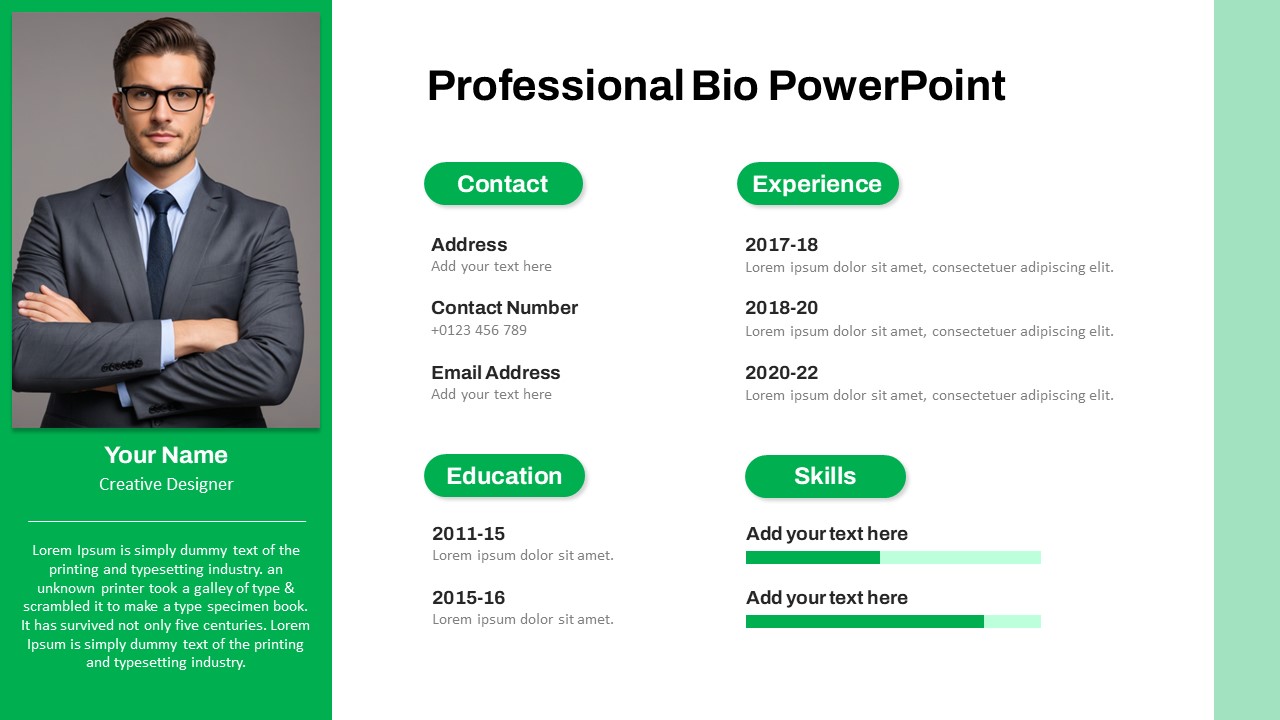
Modern Professional Bio Resume Slide Template for PowerPoint & Google Slides
Recruitment
Modern Team Profile Template for PowerPoint & Google Slides
Our Team
Modern Blue Our Team Introduction Template for PowerPoint & Google Slides
Business
Modern Team Introduction Template for PowerPoint & Google Slides
Our Team
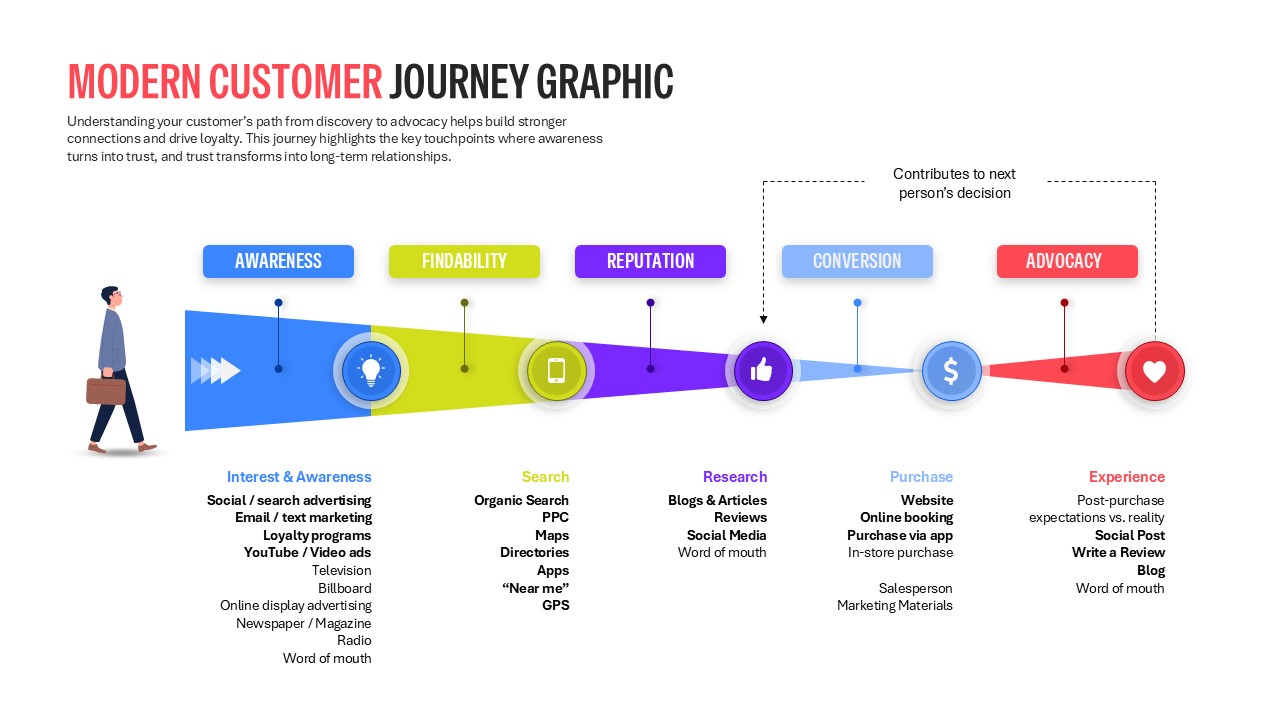
Modern Customer Journey Graphic Funnel Template for PowerPoint & Google Slides
Customer Journey