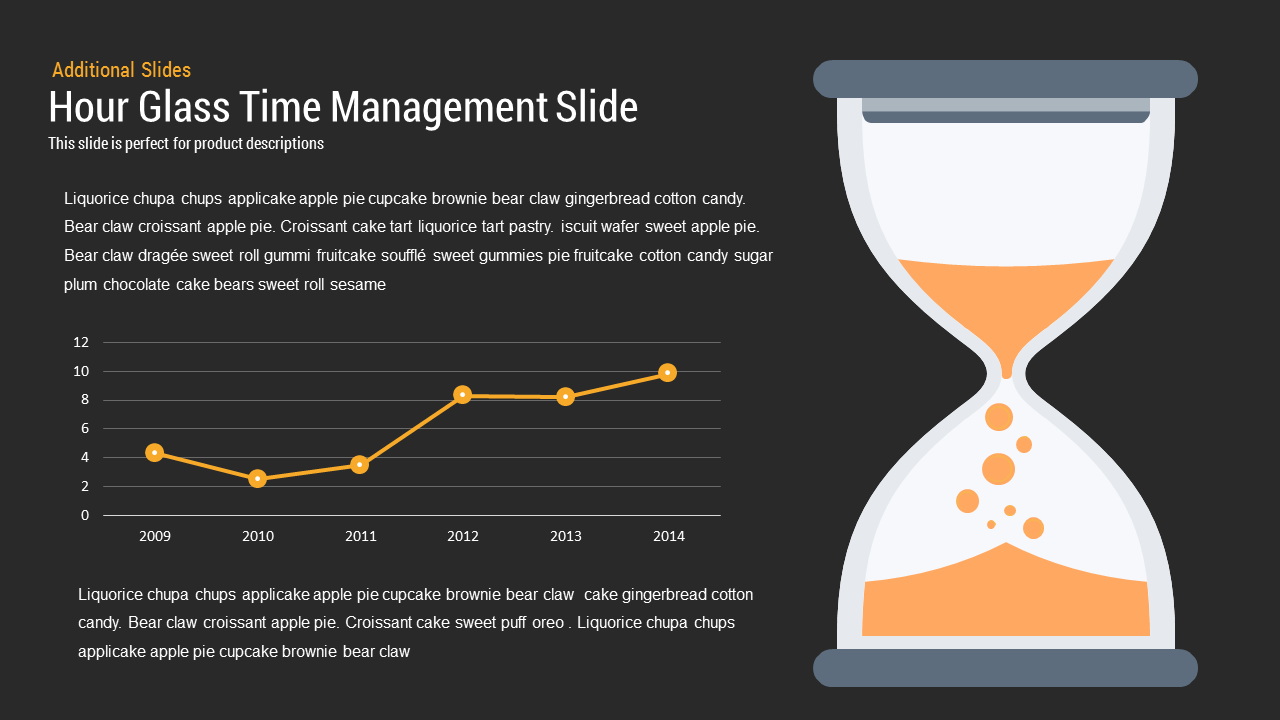
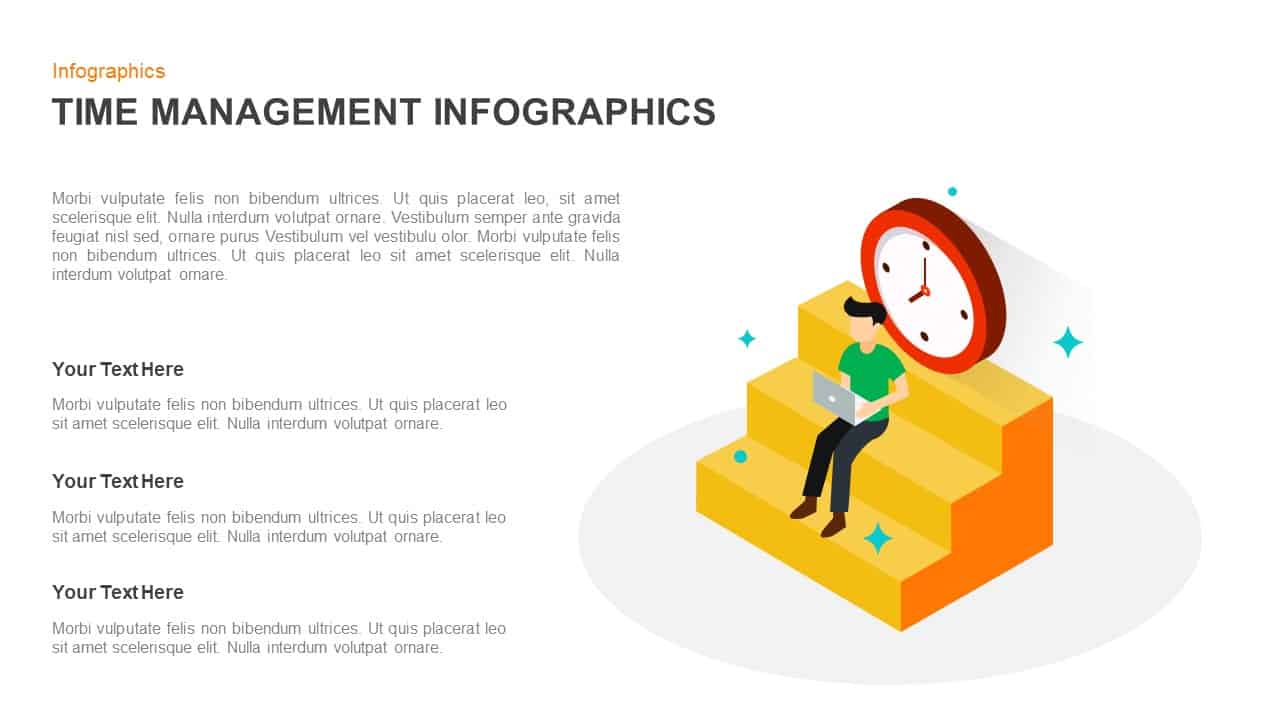
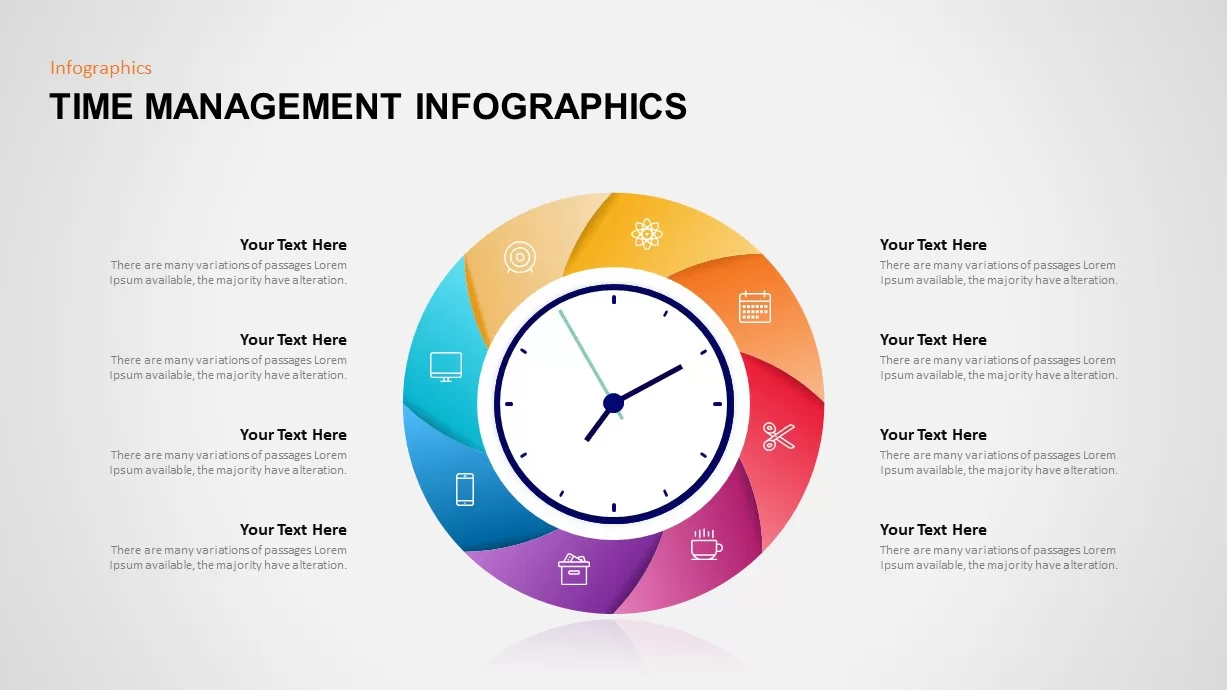
Time Management Hourglass Infographic Template for PowerPoint & Google Slides
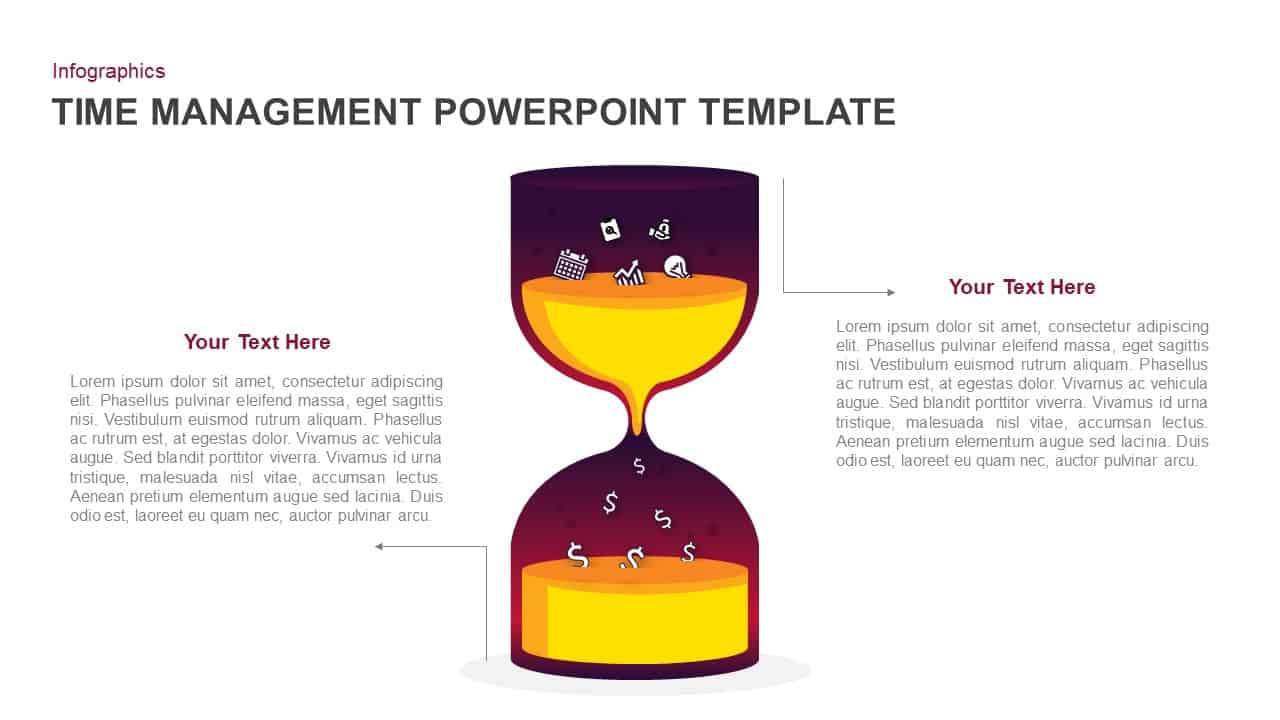
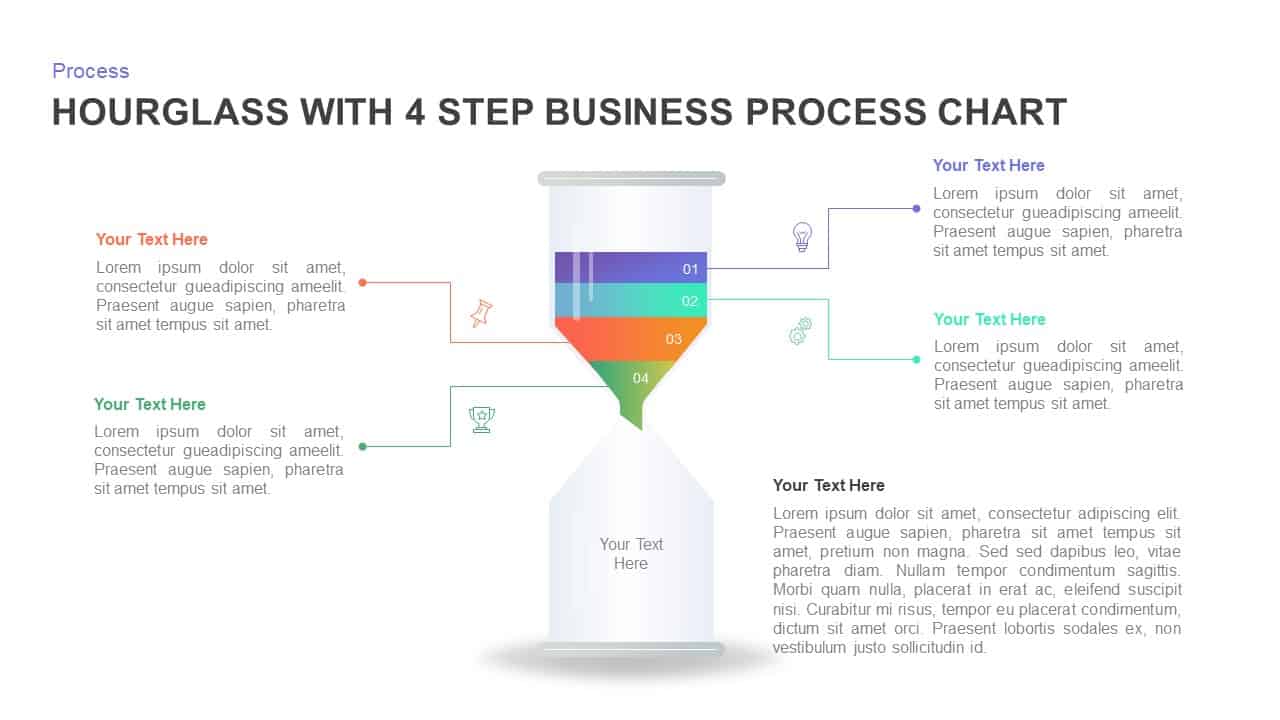
Visualize the conversion of time into value with this striking hourglass infographic slide. A large, two-chambered hourglass dominates the center, its upper half filled with icons representing tasks—calendar, chart, alert, and clipboard—flowing as golden “sand” into the lower chamber, where dollar signs collect to symbolize productivity and ROI. Editable text callouts on both sides allow you to elaborate on each phase: task initiation and outcome realization. The white background and neutral gray body text ensure clarity, while the bold magenta and gold gradient of the hourglass draws focus to your time-to-value narrative.
Built entirely on master slides with fully editable vector elements, you can swap task icons, adjust gradient colors to match your brand palette, resize the hourglass, and update text placeholders in seconds—preserving perfect alignment across both PowerPoint and Google Slides. Preconfigured entrance animations let each chamber and callout appear sequentially, guiding your audience through the story of time investment and return. Whether you’re illustrating project timelines, resource allocation, or efficiency metrics, this template turns abstract time-management concepts into an engaging visual story that drives alignment and action.
Who is it for
Project managers, operations leaders, and financial analysts will leverage this slide to map time-investment strategies, benchmark efficiency gains, and showcase time-to-value metrics. Consultants, trainers, and C-suite executives can use its clear metaphor to align stakeholders on productivity goals and performance outcomes.
Other Uses
Repurpose this layout for process-to-profit analyses, training-to-certification journeys, or idea-to-execution pipelines by swapping icons and labels. Its versatile design adapts seamlessly to any time-based narrative or conversion model.
Login to download this file

Item ID
SB01199
Related Templates

Hourglass Time Mgmt template for PowerPoint & Google Slides
Infographics
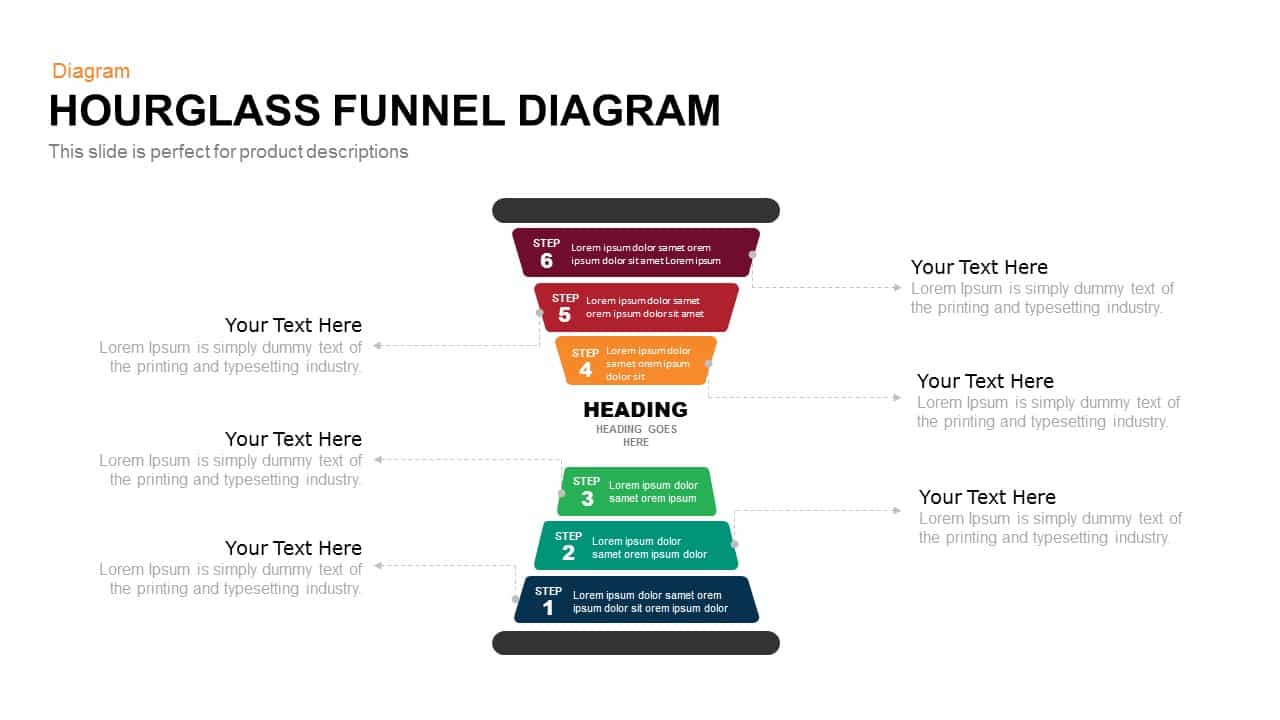
Hourglass Funnel Diagram Process Template for PowerPoint & Google Slides
Funnel

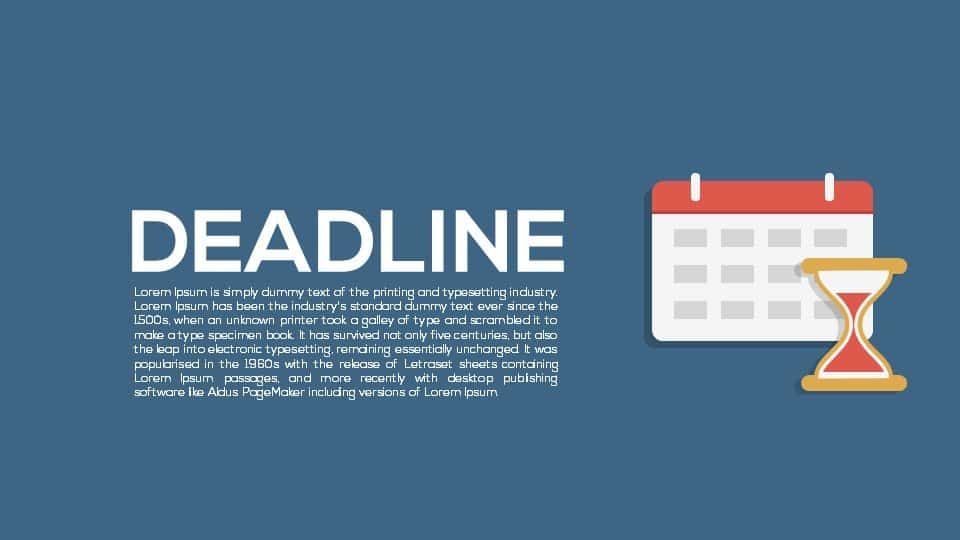
Deadline Metaphor Timeline & Hourglass Template for PowerPoint & Google Slides
Project
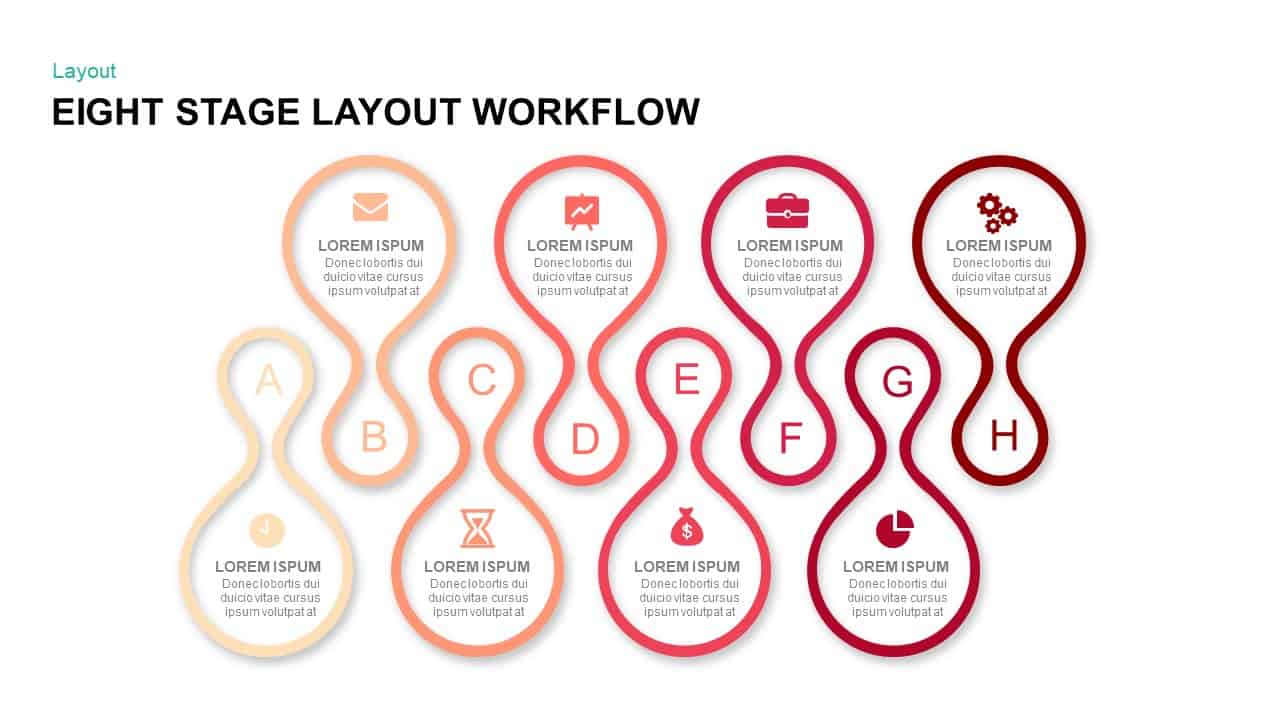
Eight Stage Hourglass Workflow Diagram Template for PowerPoint & Google Slides
Process
Four-Step Hourglass Business Process Template for PowerPoint & Google Slides
Process
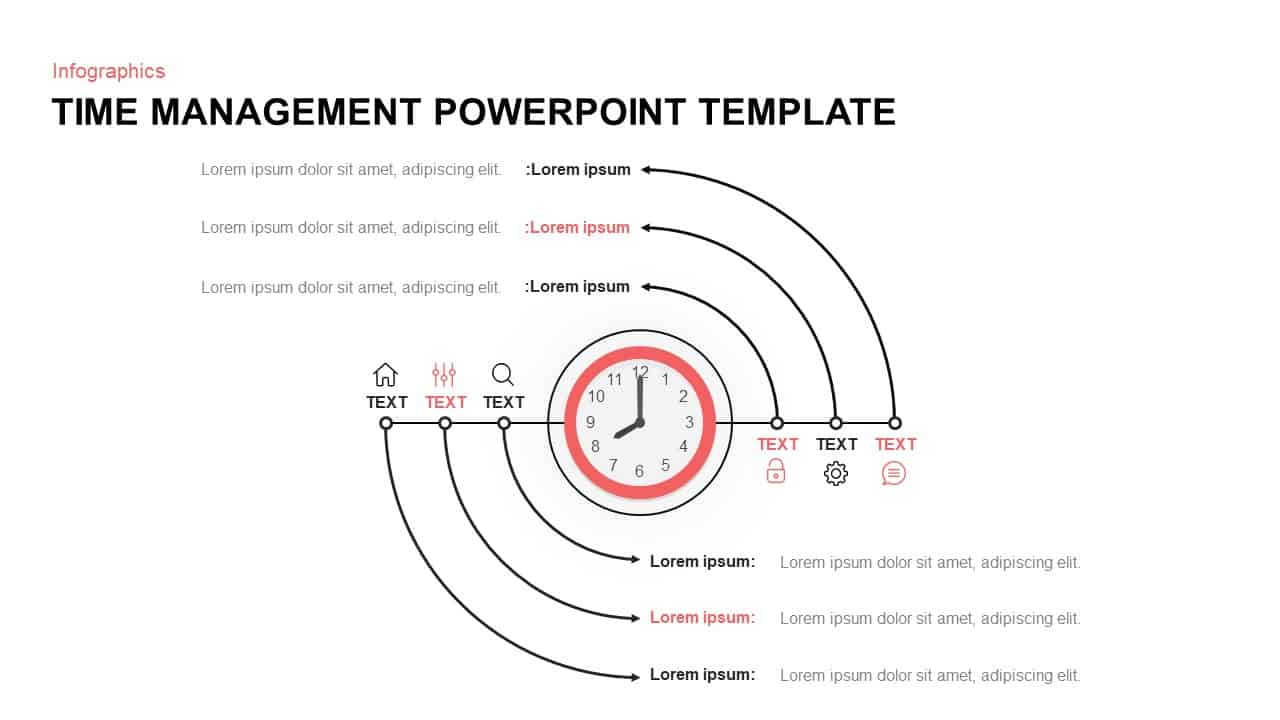
Time Management Clock Infographic Template for PowerPoint & Google Slides
Circular
Semicircle Time Management Infographic Template for PowerPoint & Google Slides
Business Strategy
Time Management Stopwatch Infographic Template for PowerPoint & Google Slides
Process
Isometric Time Management Infographic Template for PowerPoint & Google Slides
Process

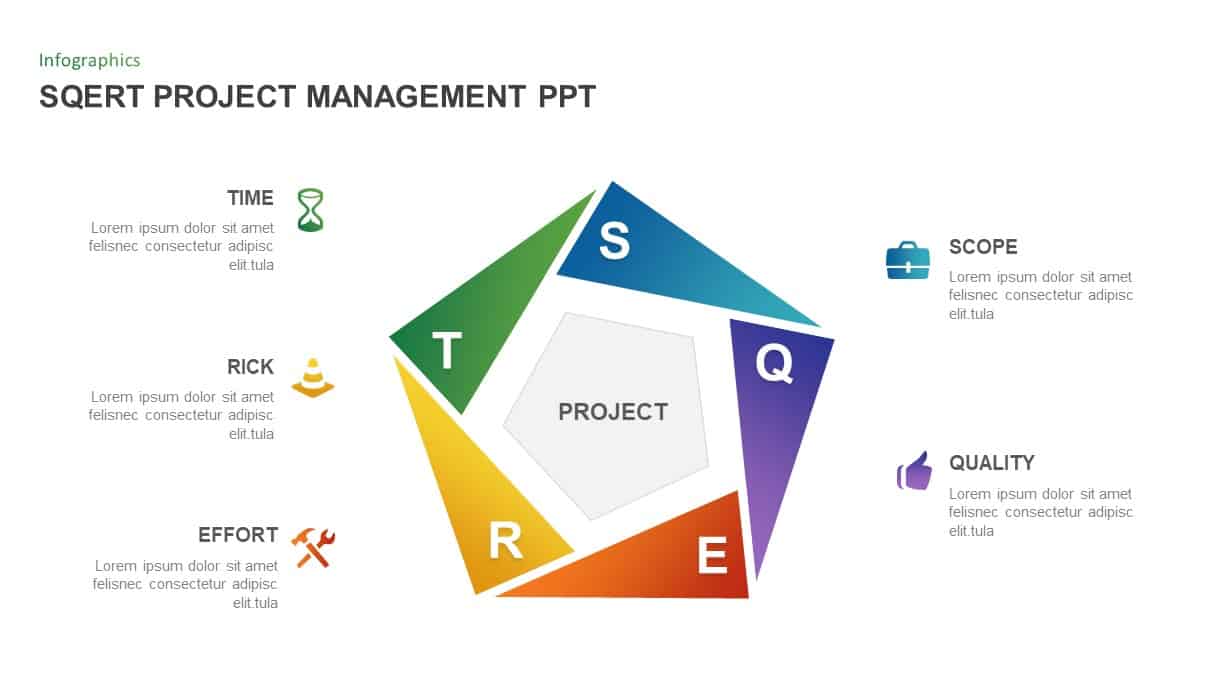
SQERT Project Management Infographic Template for PowerPoint & Google Slides
Process
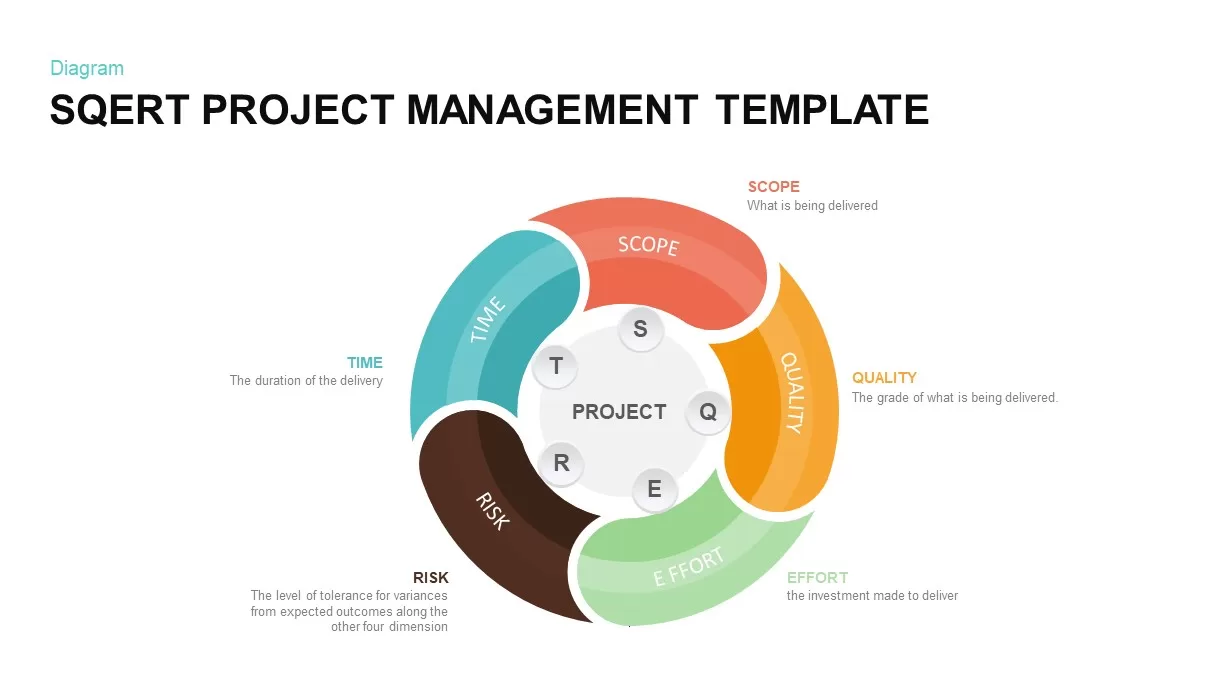
SQERT Project Management Infographic Template for PowerPoint & Google Slides
Process
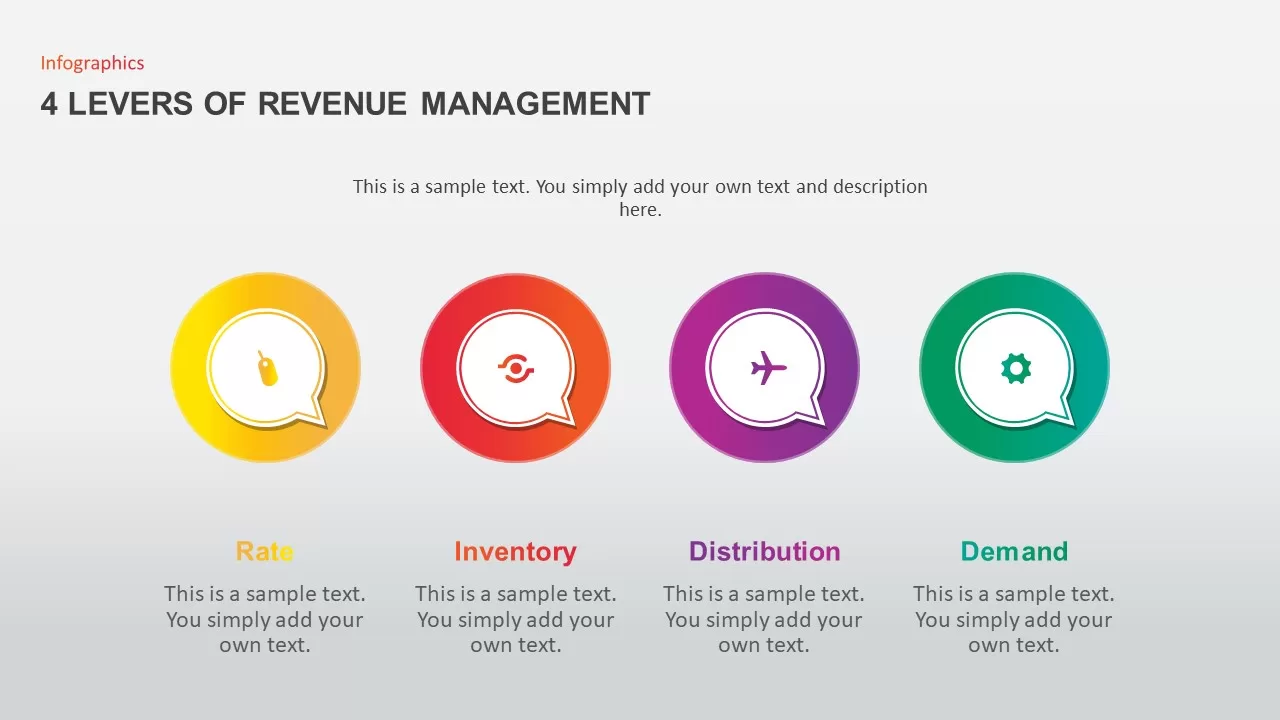
4 Levers of Revenue Management Infographic Template for PowerPoint & Google Slides
Infographics

Change Management Infographic Deck Template for PowerPoint & Google Slides
Business Strategy
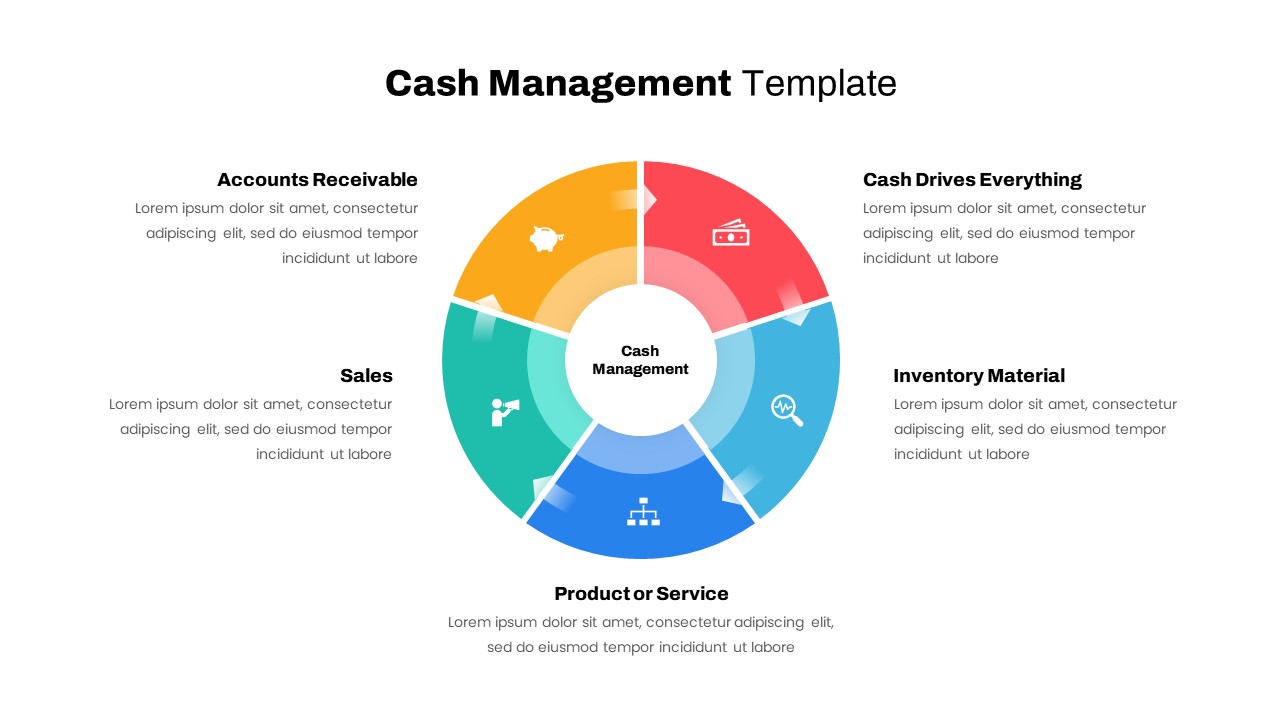
Cash Management Infographic Diagram Template for PowerPoint & Google Slides
Circular
Risk Management Mind Map Radial Diagram template for PowerPoint & Google Slides
Mind Maps
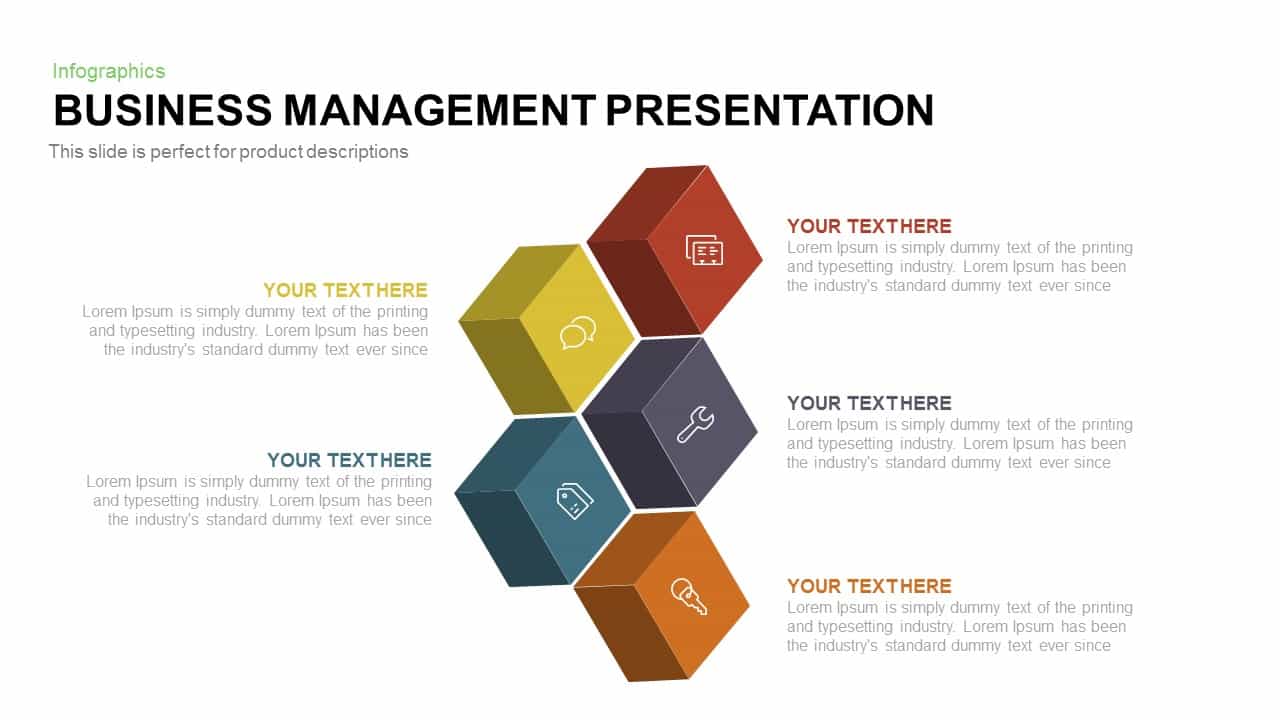
Business Management Hexagon Diagram Template for PowerPoint & Google Slides
Comparison

Project Management Dashboard Template for PowerPoint & Google Slides
Project
Risk Management Presentation Template for PowerPoint and Google Slides
Decks
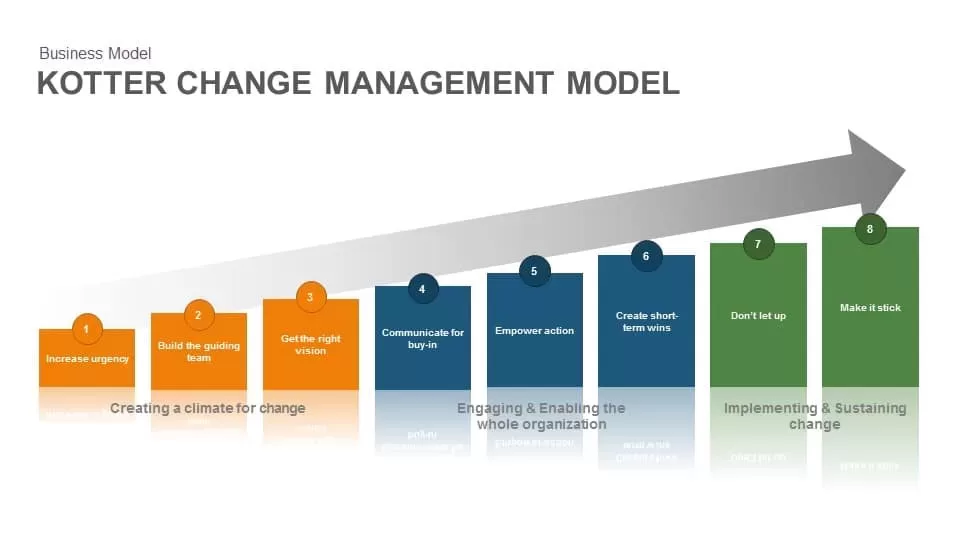
Kotter Change Management Model template for PowerPoint & Google Slides
Business Strategy
Marketing Risk Management Gear Diagram Template for PowerPoint & Google Slides
Risk Management
Logistics and Supply Chain Management Template for PowerPoint & Google Slides
Process
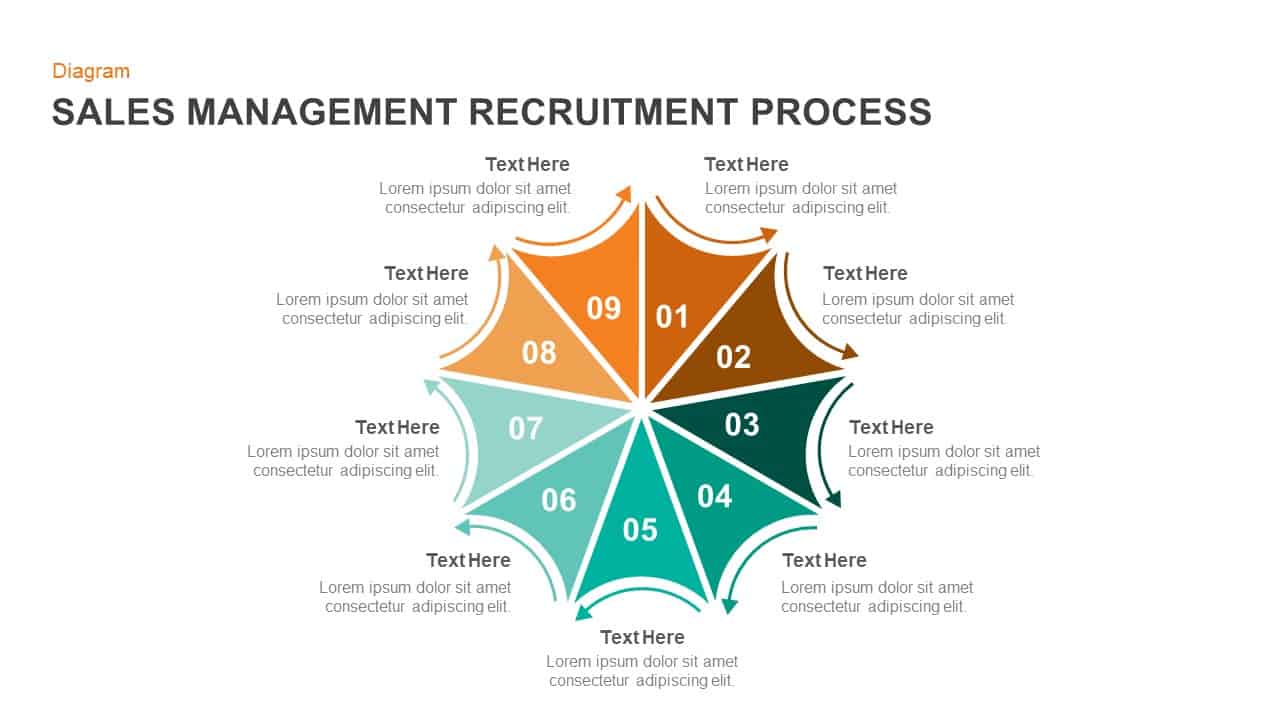
Sales Management Recruitment Process template for PowerPoint & Google Slides
Process
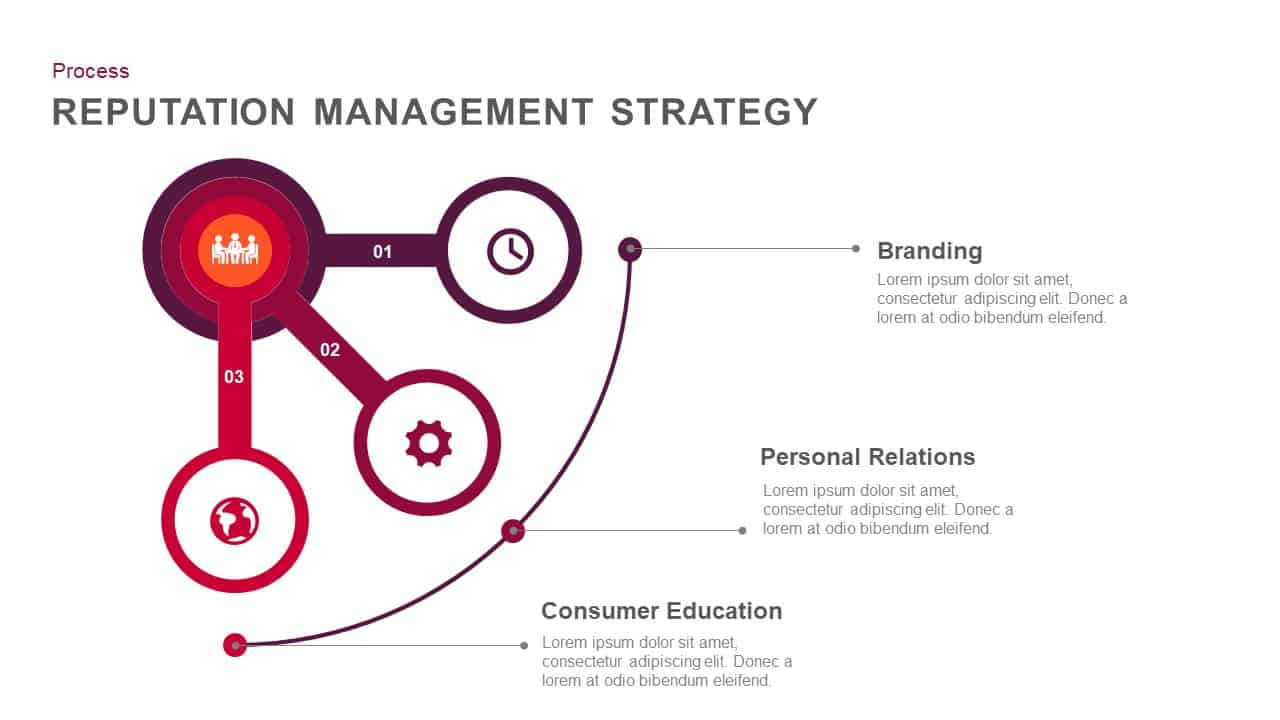
Reputation Management Strategy template for PowerPoint & Google Slides
Business Strategy

Human Resource Management template for PowerPoint & Google Slides
HR
Cost Management Process template for PowerPoint & Google Slides
Process
Approaches to Management Development template for PowerPoint & Google Slides
Infographics
Time Management template for PowerPoint & Google Slides
Business Strategy
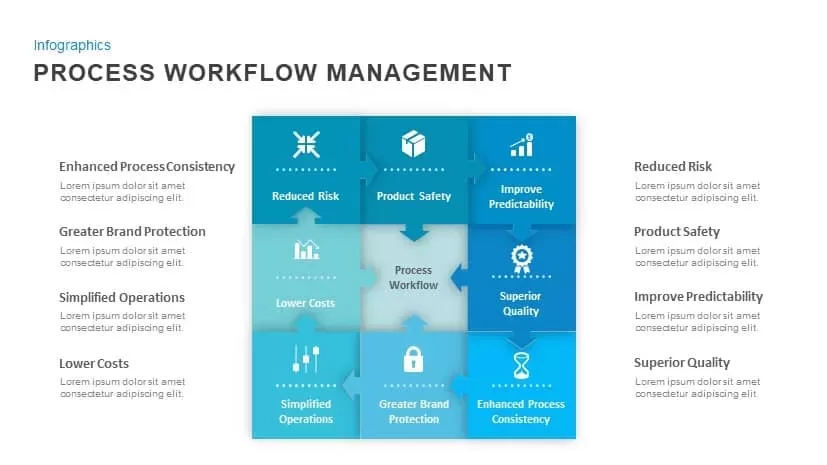
Process Workflow Management template for PowerPoint & Google Slides
Process
Supply Chain Management Logistics Cover Template for PowerPoint & Google Slides
Pitch Deck
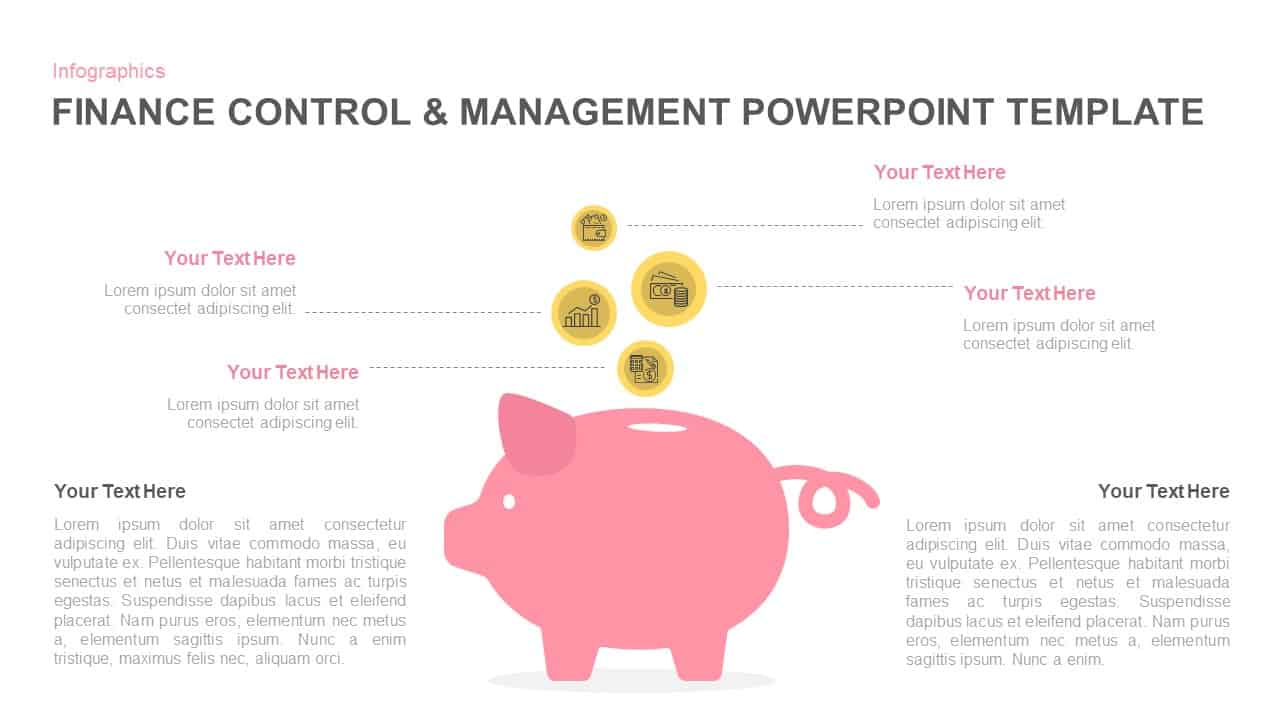
Finance Control & Management Piggy Bank Template for PowerPoint & Google Slides
Finance
Data Management and Analytics Diagram Template for PowerPoint & Google Slides
Circular
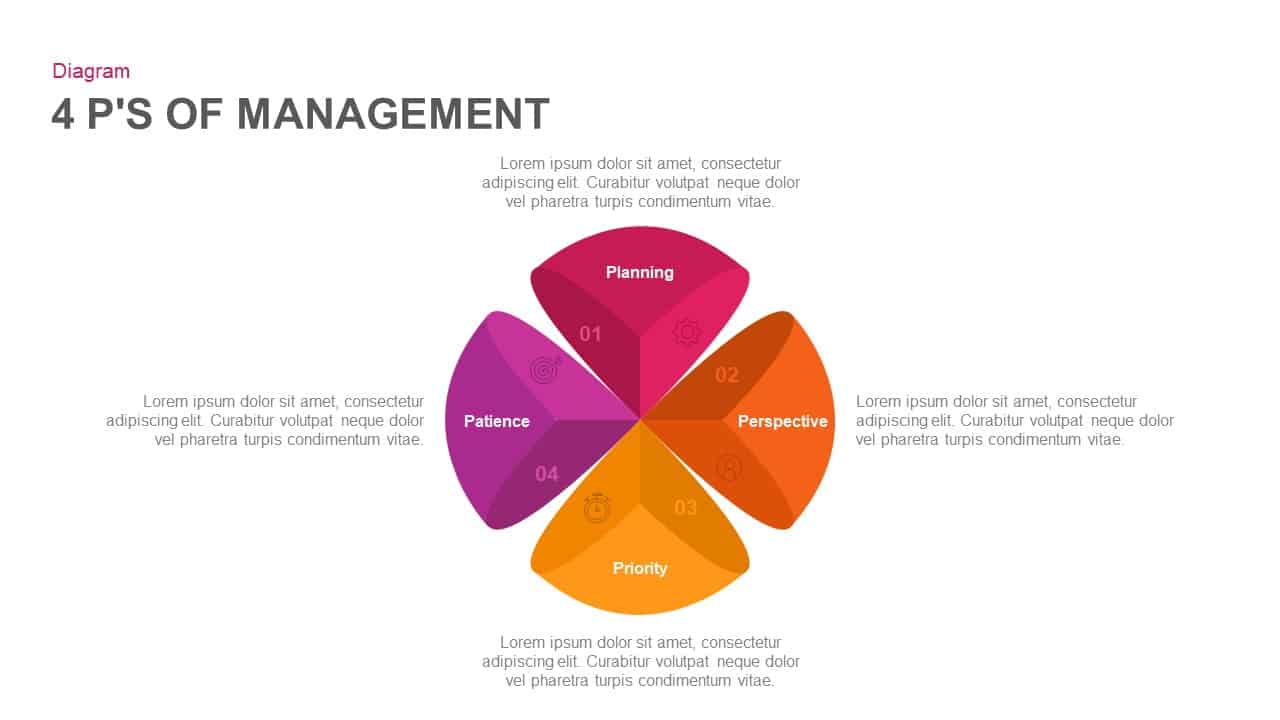
4 Ps of Management Circular Diagram Template for PowerPoint & Google Slides
Circular
Hub and Spoke Time Management Process Template for PowerPoint & Google Slides
Process
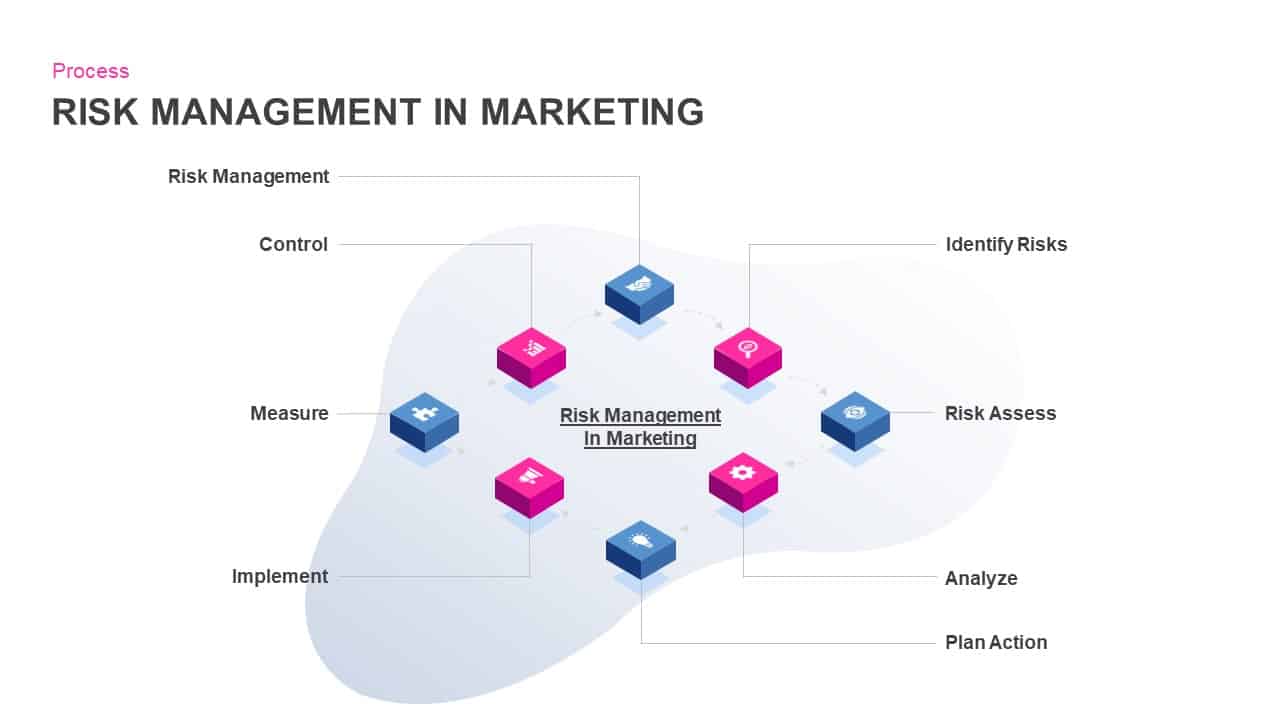
Risk Management in Marketing Process Template for PowerPoint & Google Slides
Risk Management
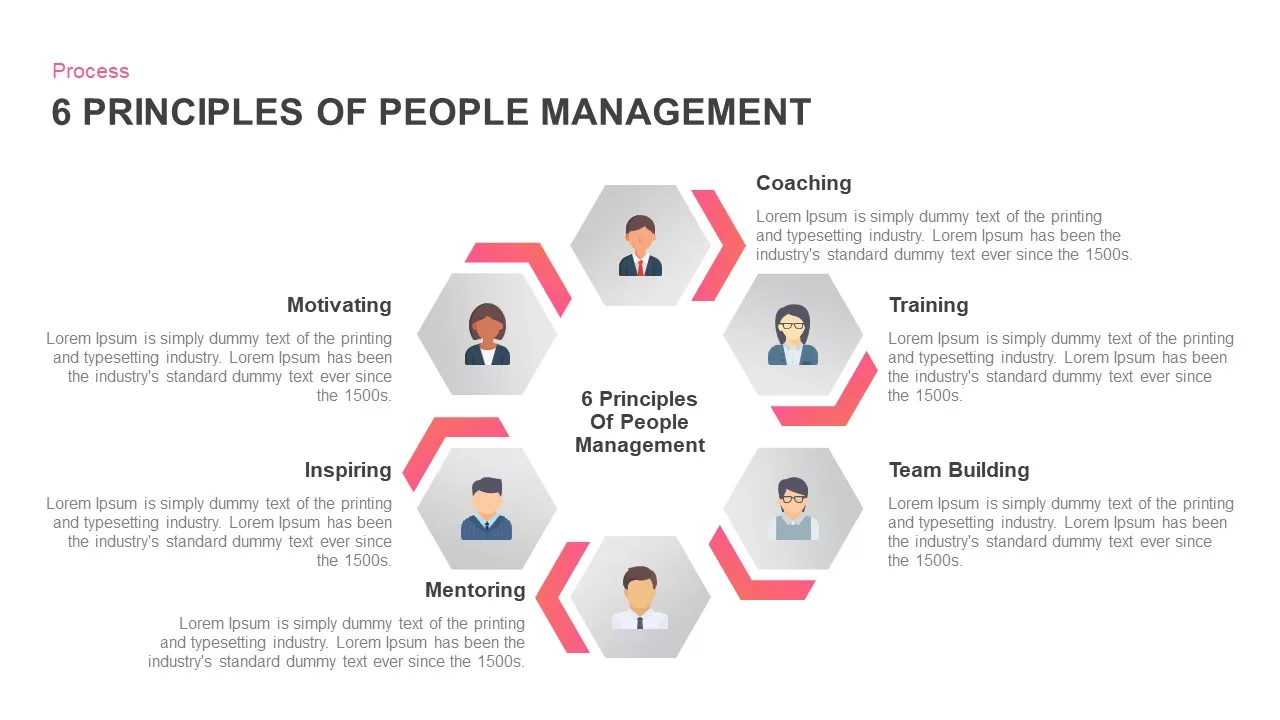
Six Principles of People Management Template for PowerPoint & Google Slides
HR
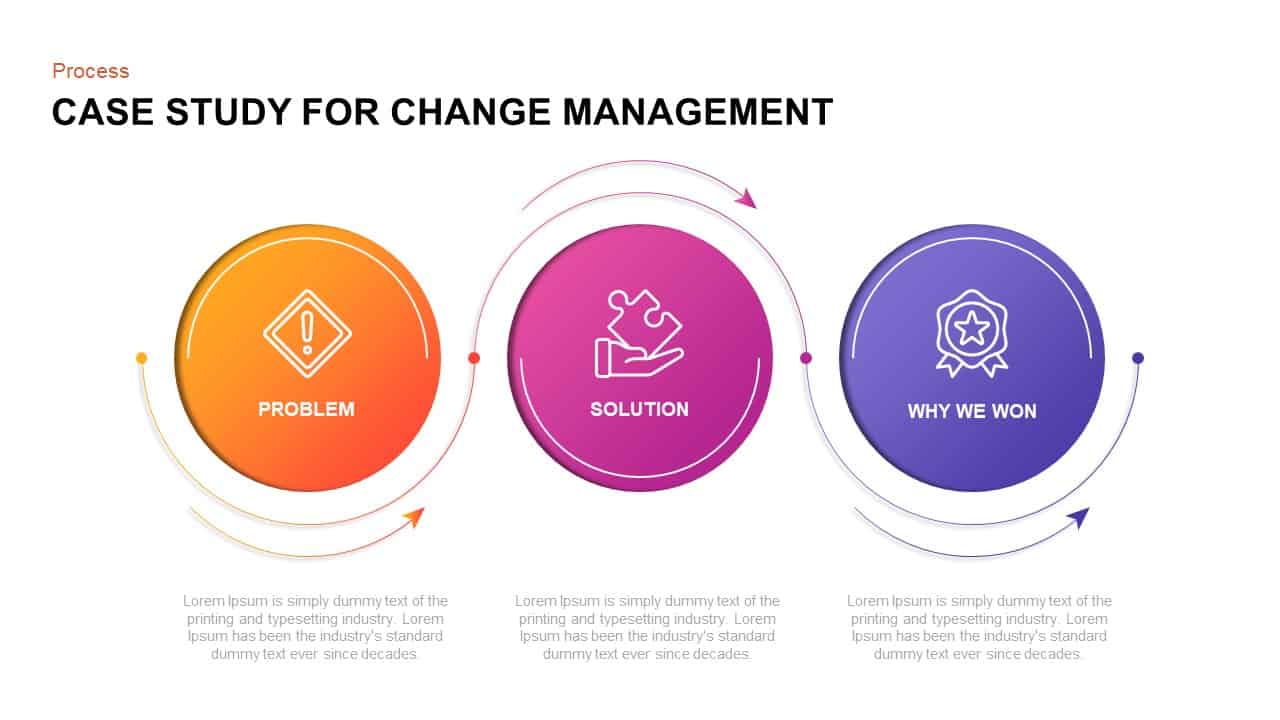
Case Study for Change Management Process Template for PowerPoint & Google Slides
Process
Revenue Management Business Strategy Template for PowerPoint & Google Slides
Revenue
Performance Review Progress Management Template for PowerPoint & Google Slides
Process
Business Process Management Flow Diagram Template for PowerPoint & Google Slides
Process
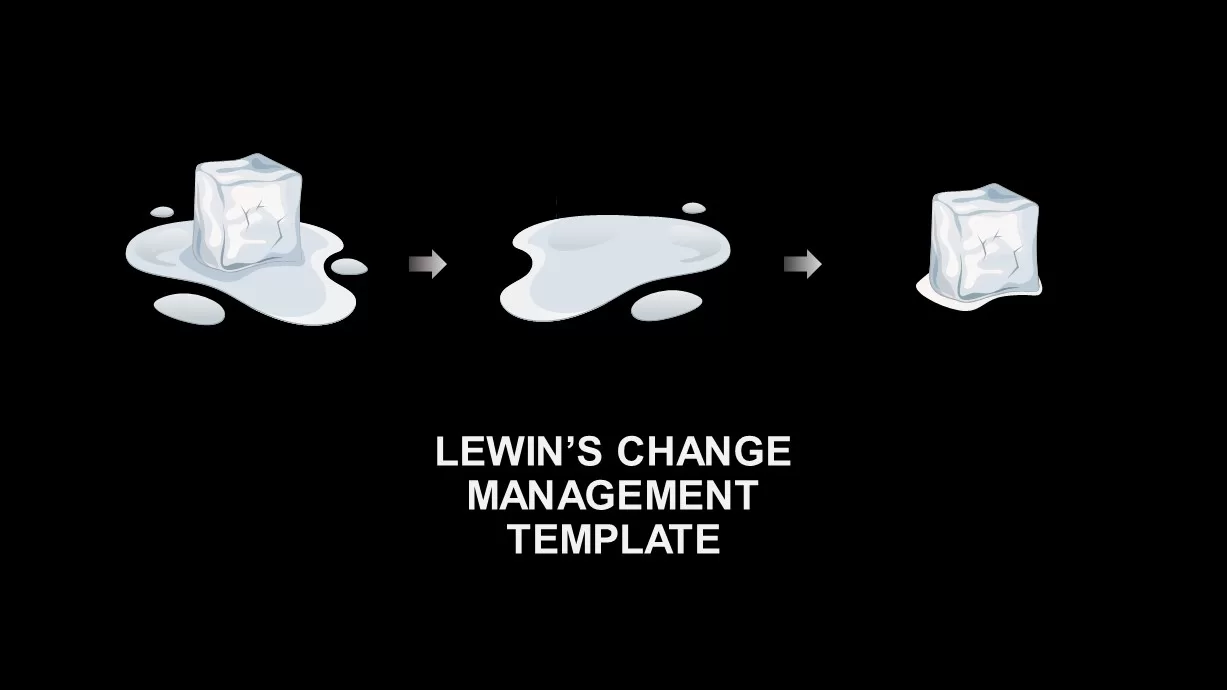
Lewin’s Change Management Diagram Template for PowerPoint & Google Slides
Process
Time Management Infographics Template for PowerPoint & Google Slides
Process
Enterprise Risk Management Cycle Diagram Template for PowerPoint & Google Slides
Process
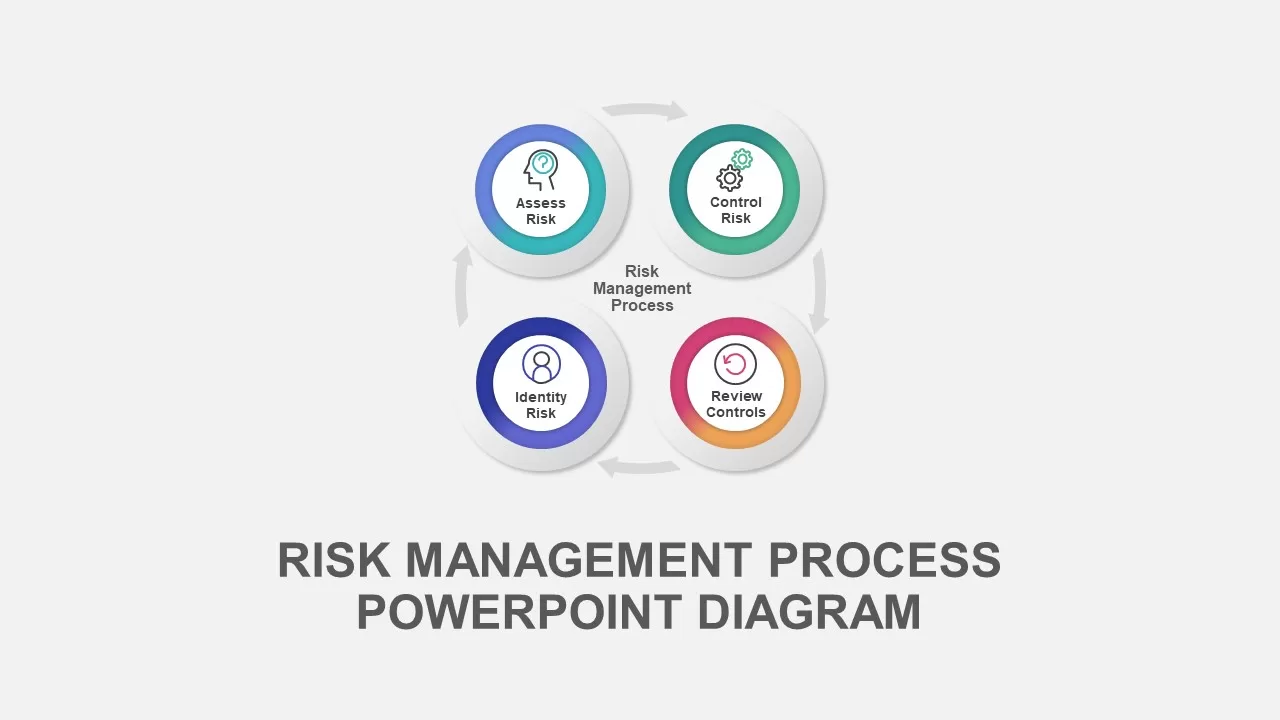
Risk Management Process Diagram Template for PowerPoint & Google Slides
Risk Management
Quality Management System Circular Diagram template for PowerPoint & Google Slides
Process
Fayol’s Five Functions of Management Template for PowerPoint & Google Slides
Business
Project Timeline Management template for PowerPoint & Google Slides
Infographics
Asset Management Overview template for PowerPoint & Google Slides
Business
Corporate Performance Management Template for PowerPoint & Google Slides
Pitch Deck
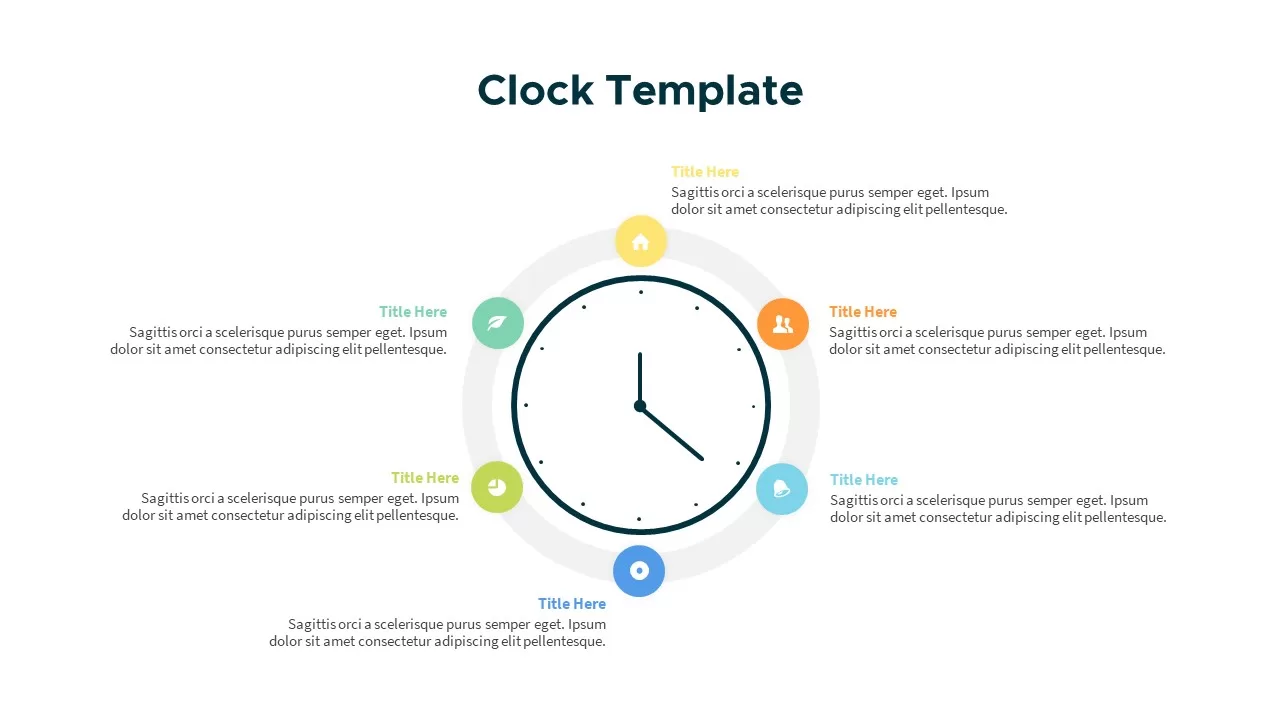
Clock Diagram for Time Management Template for PowerPoint & Google Slides
Circular
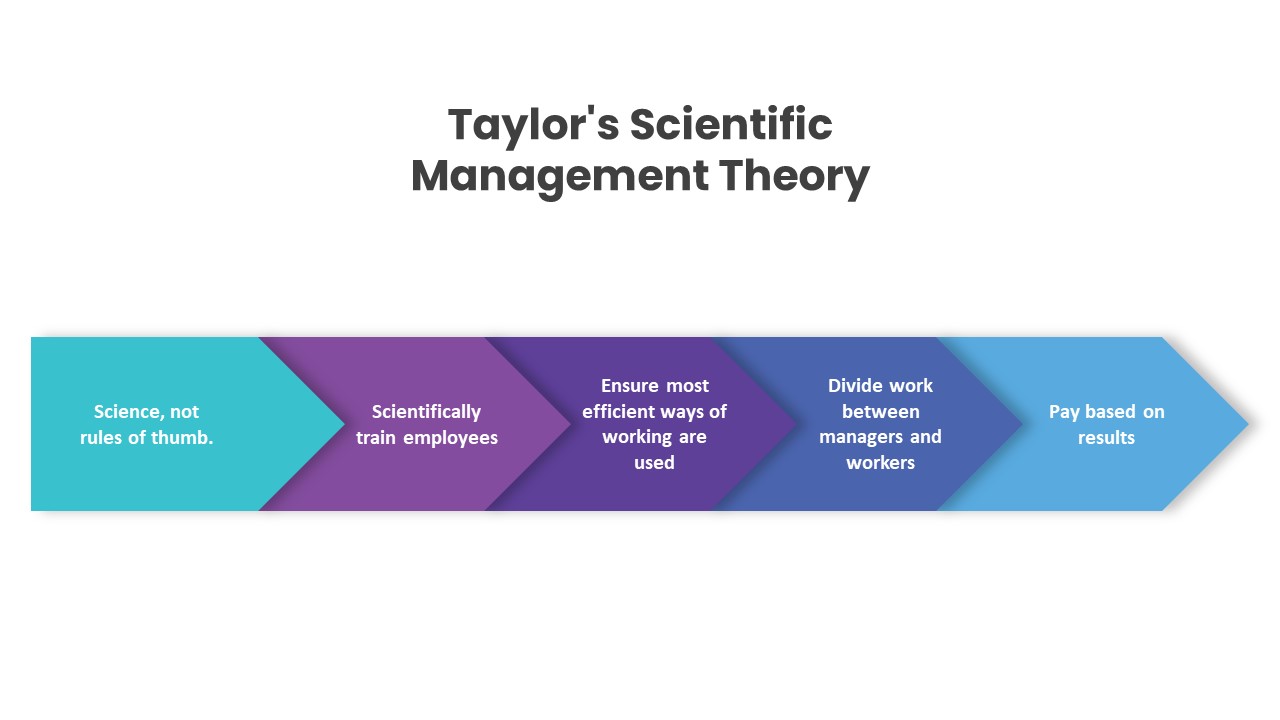
Taylor’s Scientific Management Theory Template for PowerPoint & Google Slides
Process
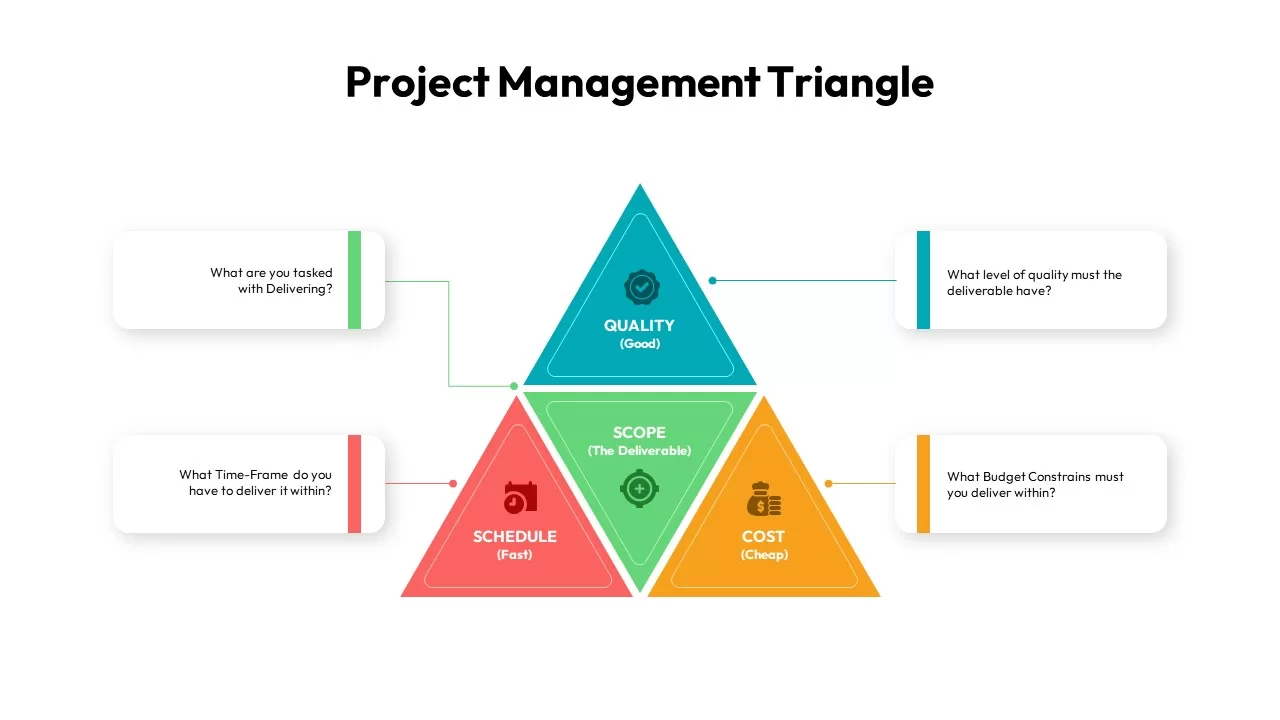
Project Management Triangle Diagram Template for PowerPoint & Google Slides
Project
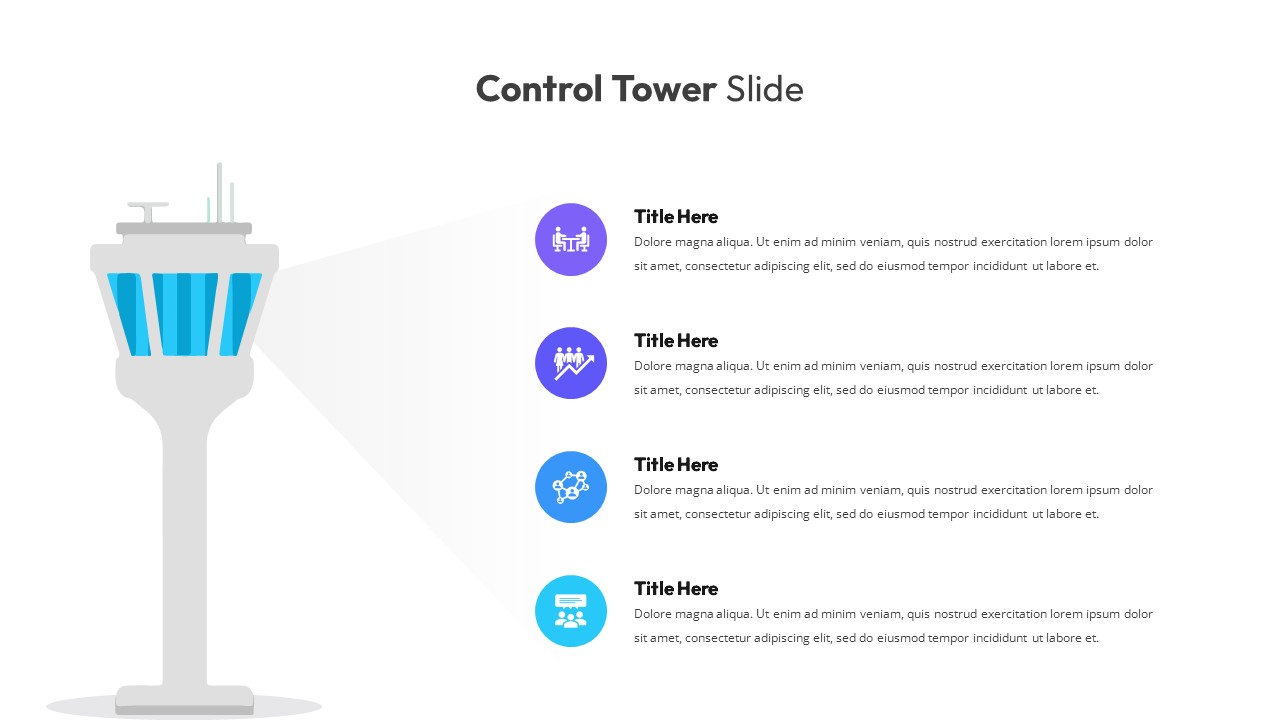
Control Tower Management template for PowerPoint & Google Slides
Infographics
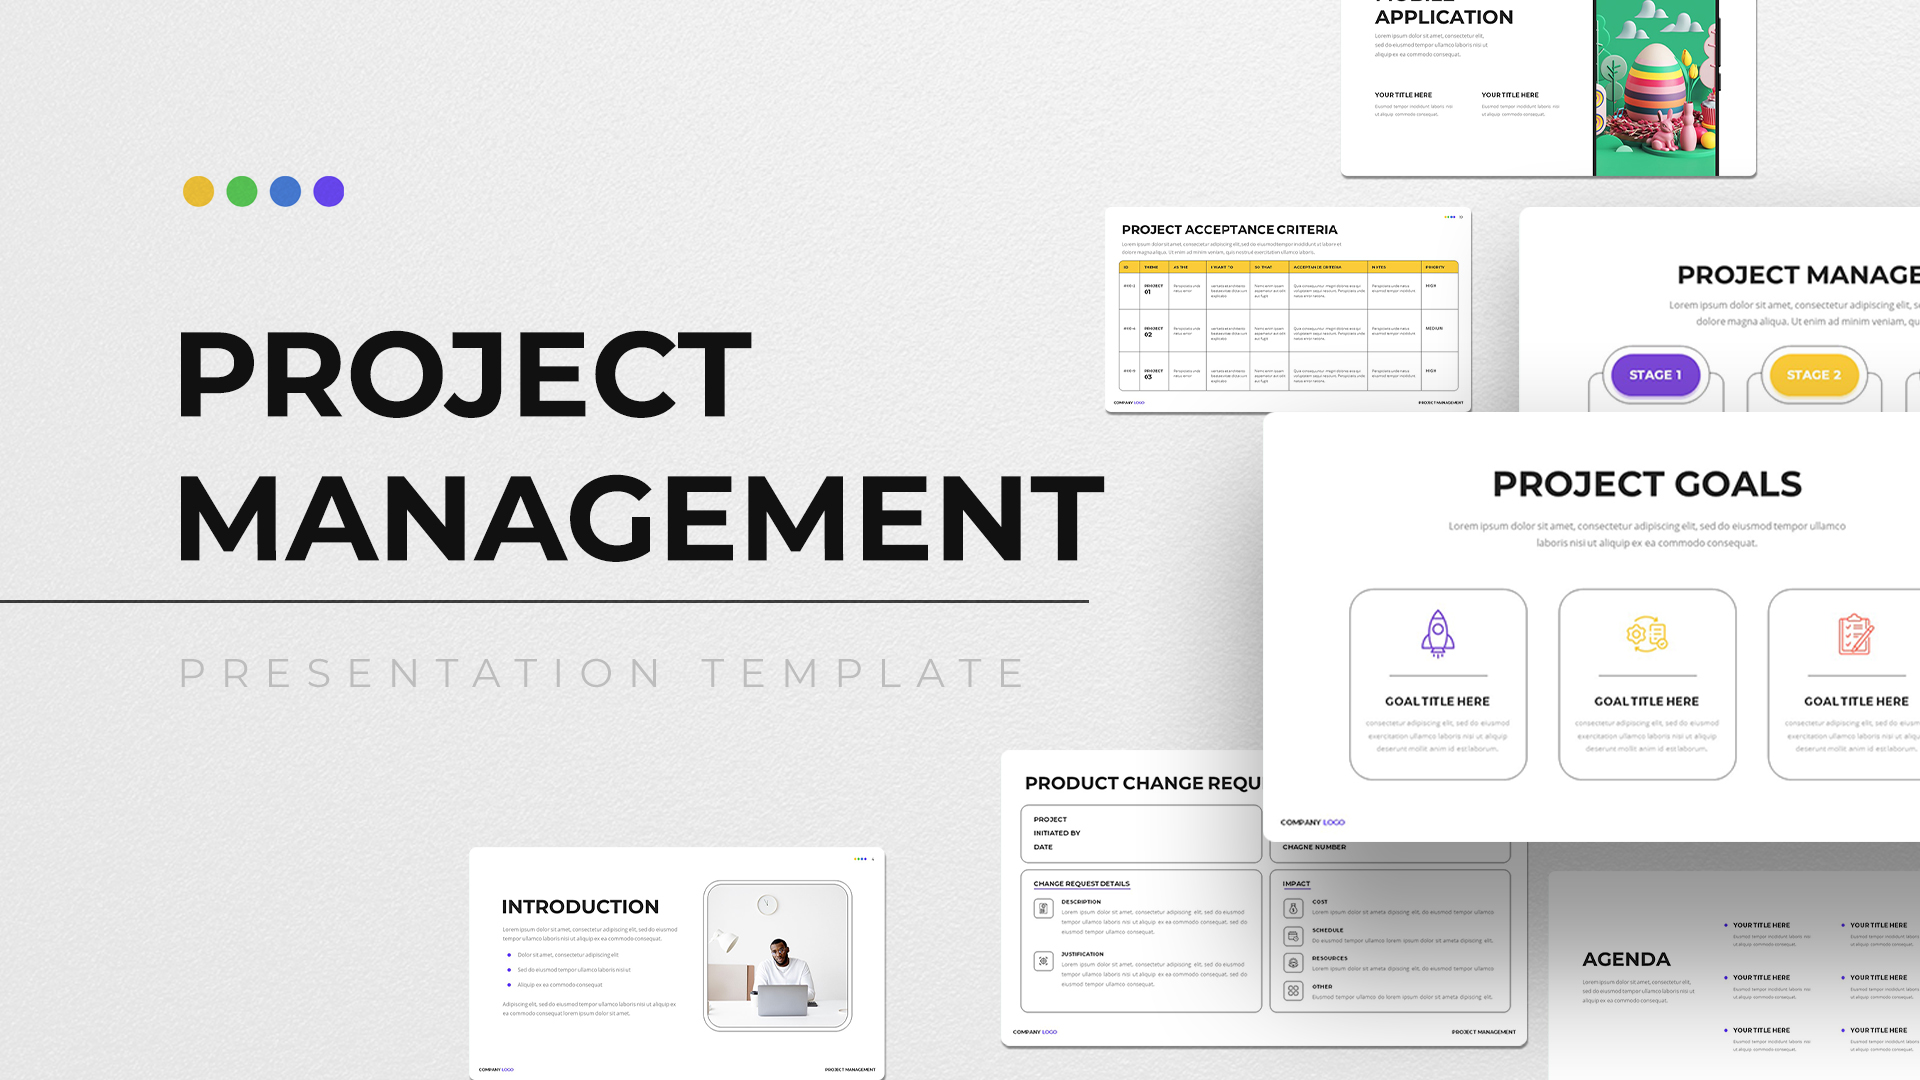
Project Management Deck template for PowerPoint & Google Slides
Project
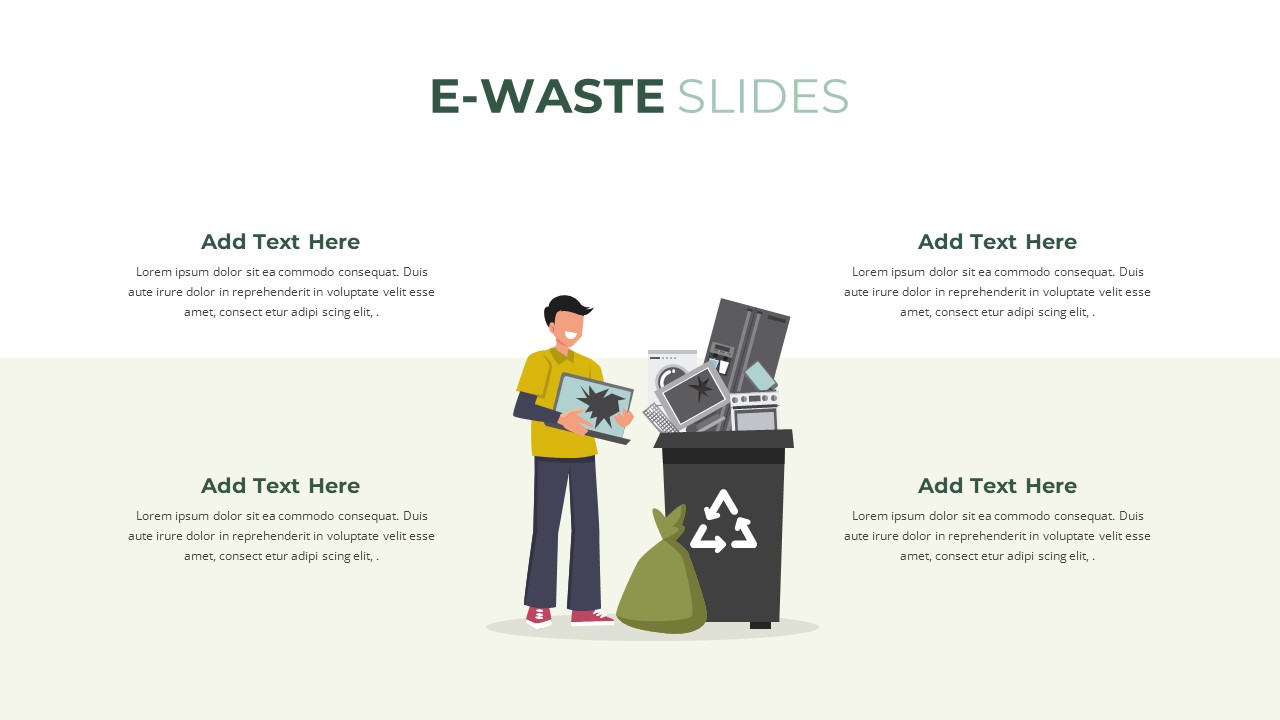
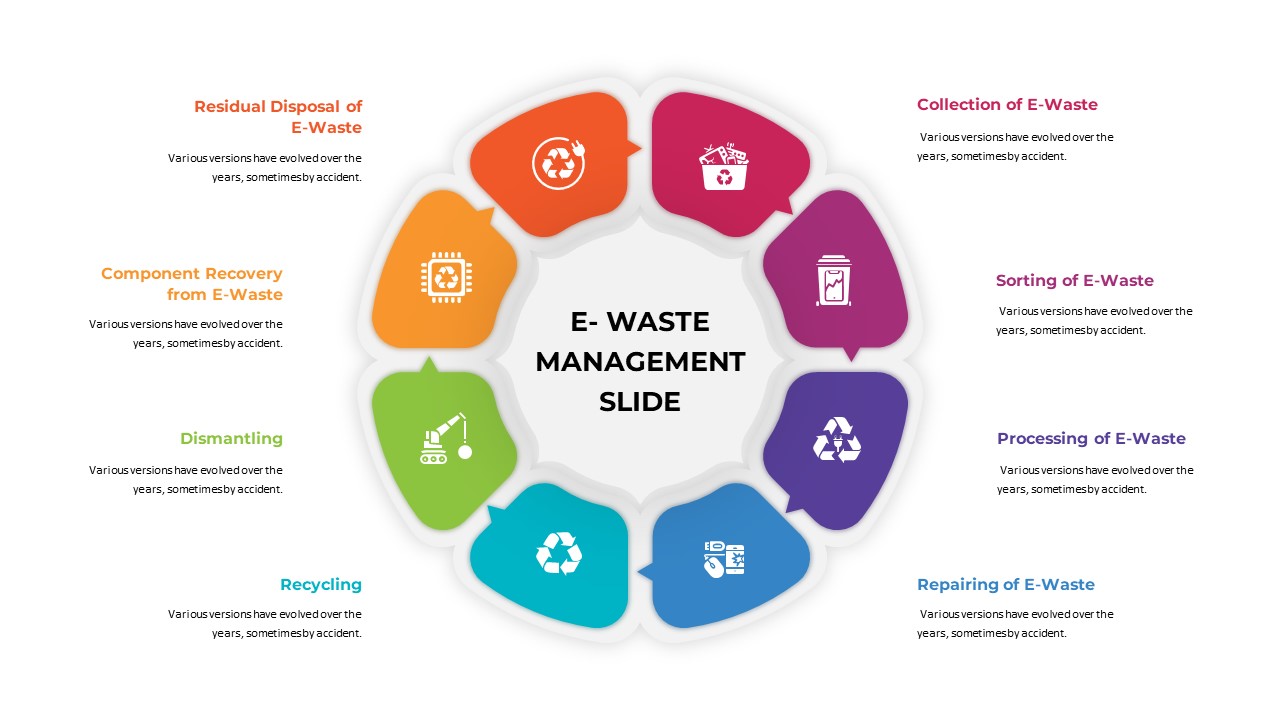
E-Waste Management Slide Template for PowerPoint & Google Slides
Infographics
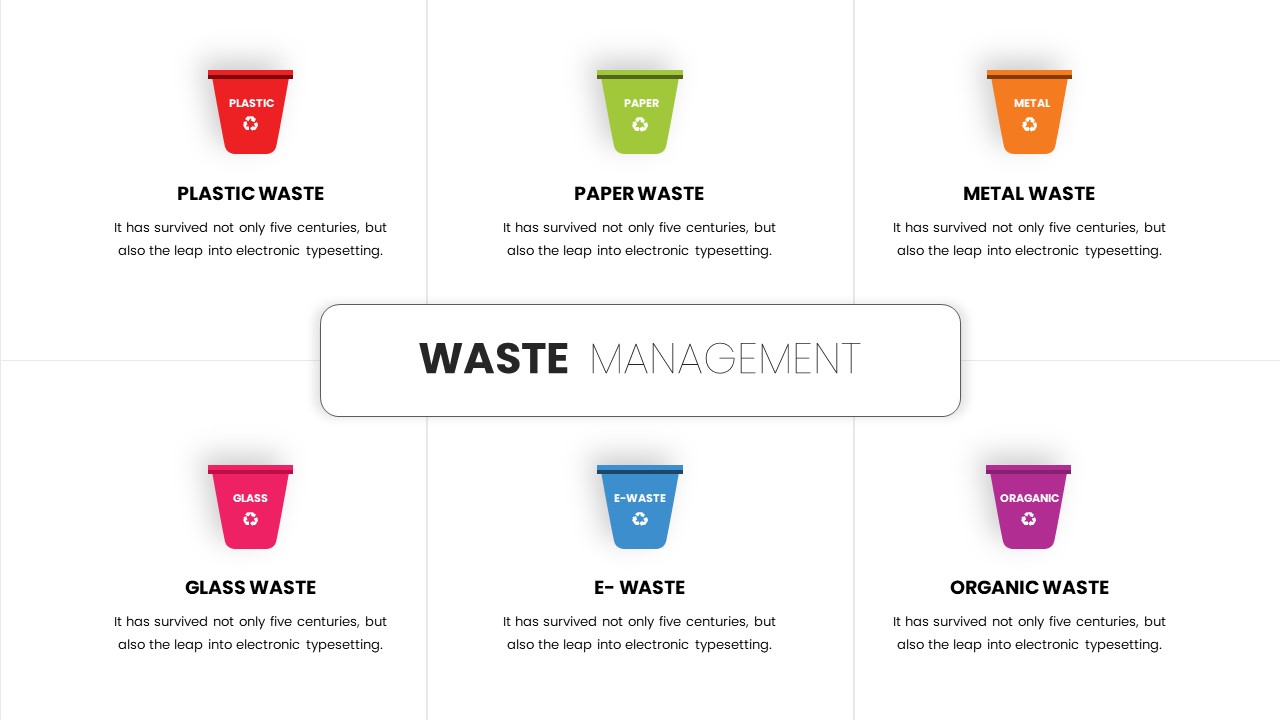
Six-Category Waste Management Overview Template for PowerPoint & Google Slides
Comparison
E-Waste Management Diagram Template for PowerPoint & Google Slides
Infographics
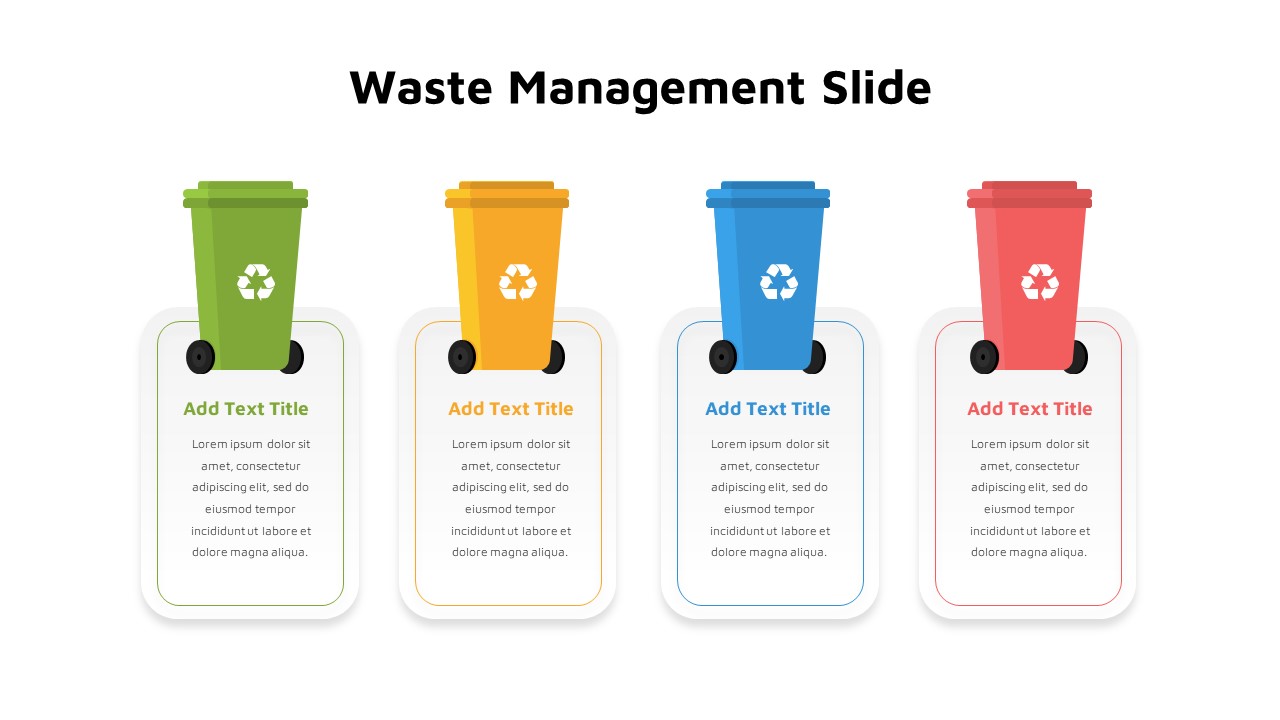
Color-Coded Waste Management Bins Template for PowerPoint & Google Slides
Comparison
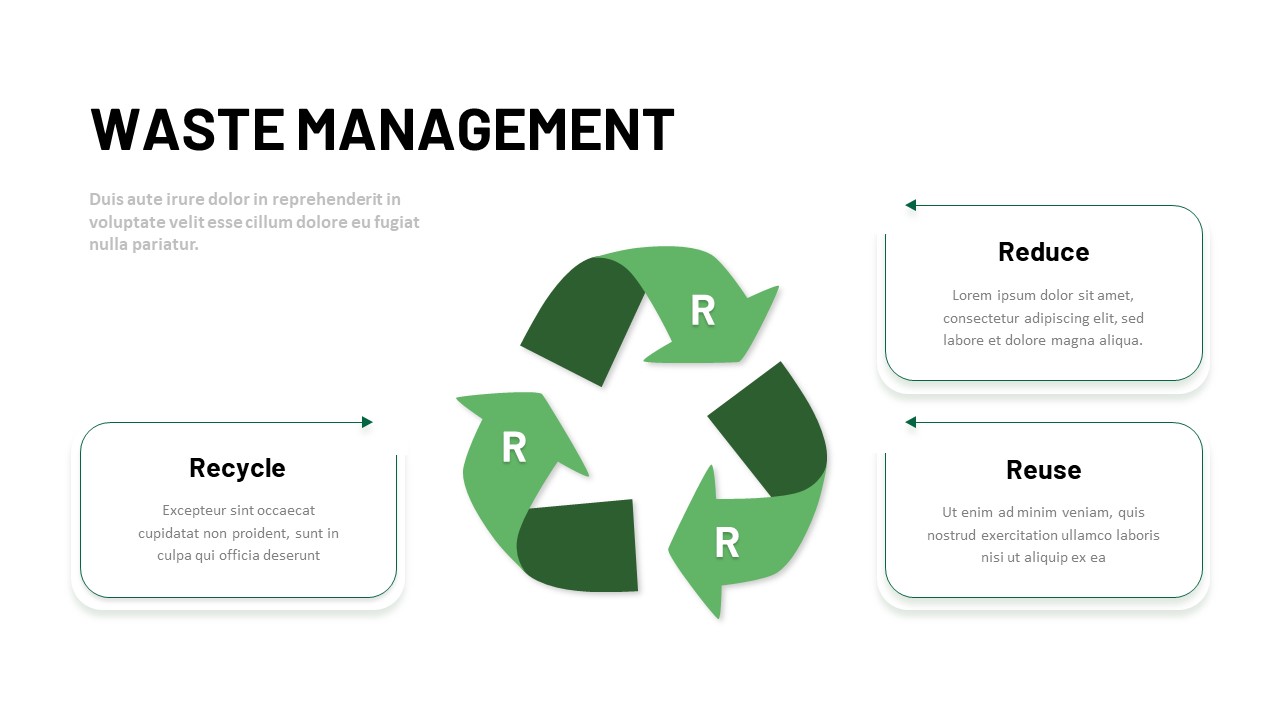
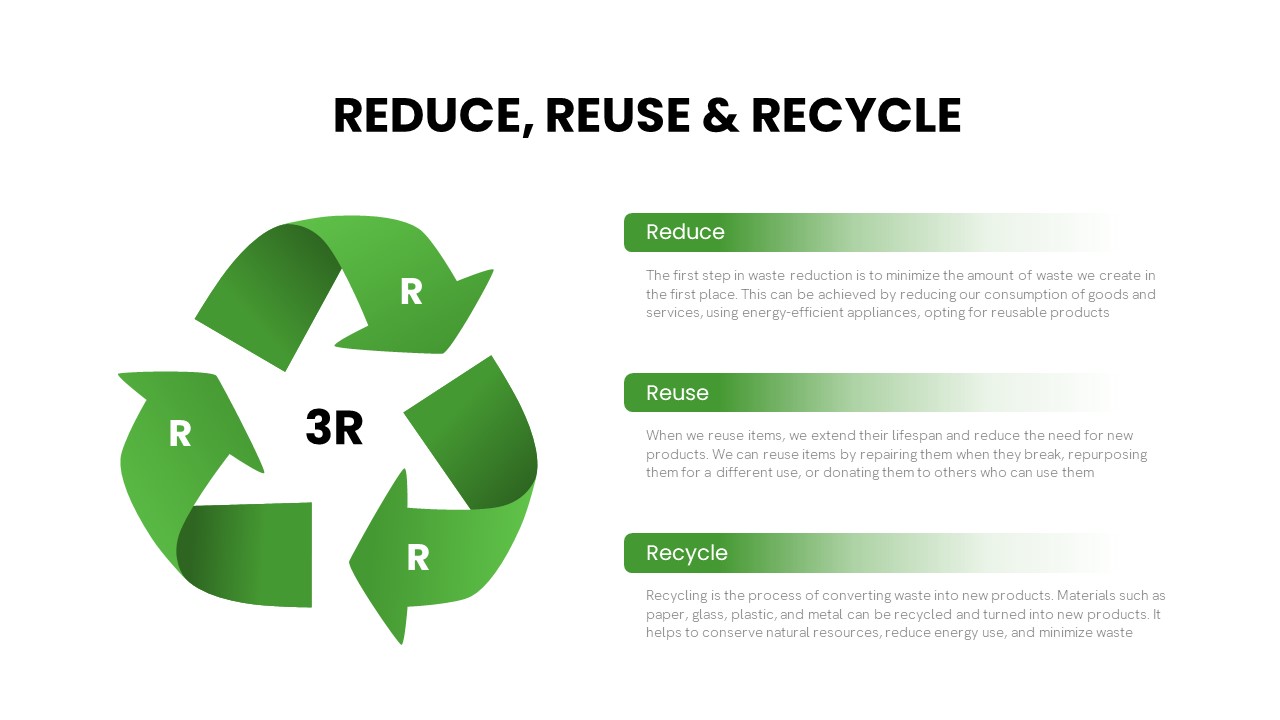
3R Waste Management Cycle Diagram Template for PowerPoint & Google Slides
Circular
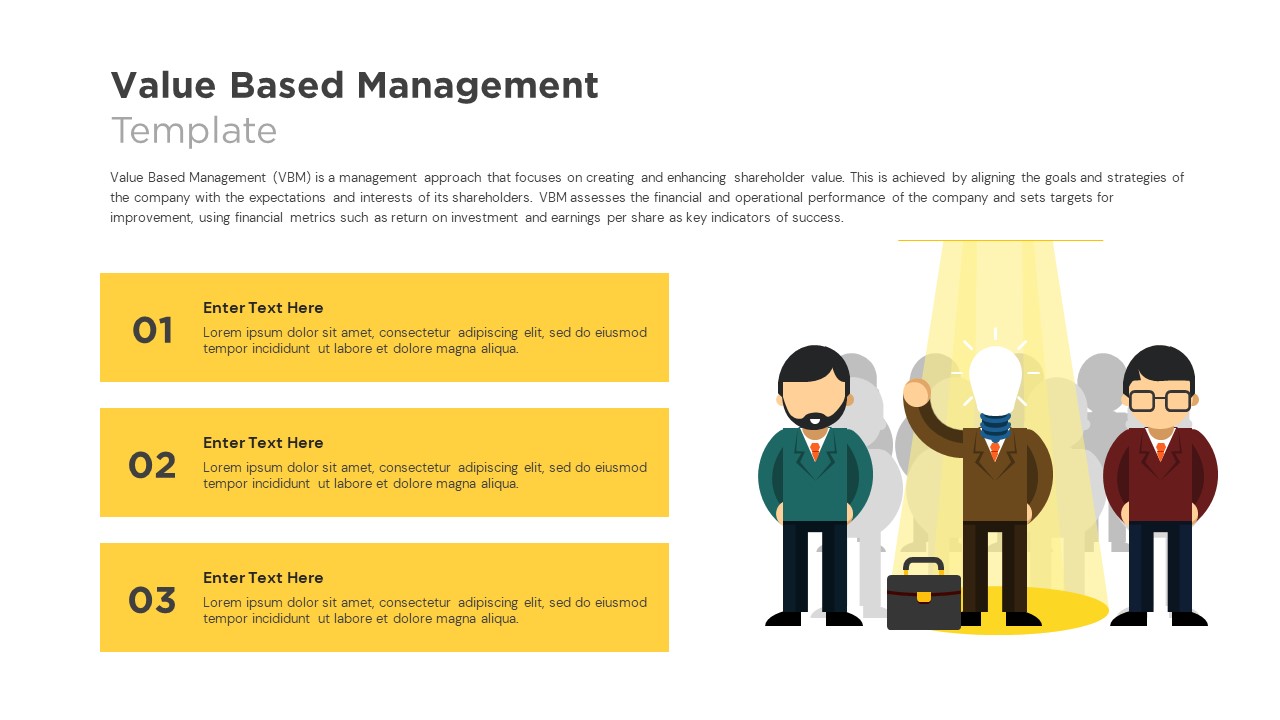
Value Based Management Step-by-Step Template for PowerPoint & Google Slides
Business Strategy
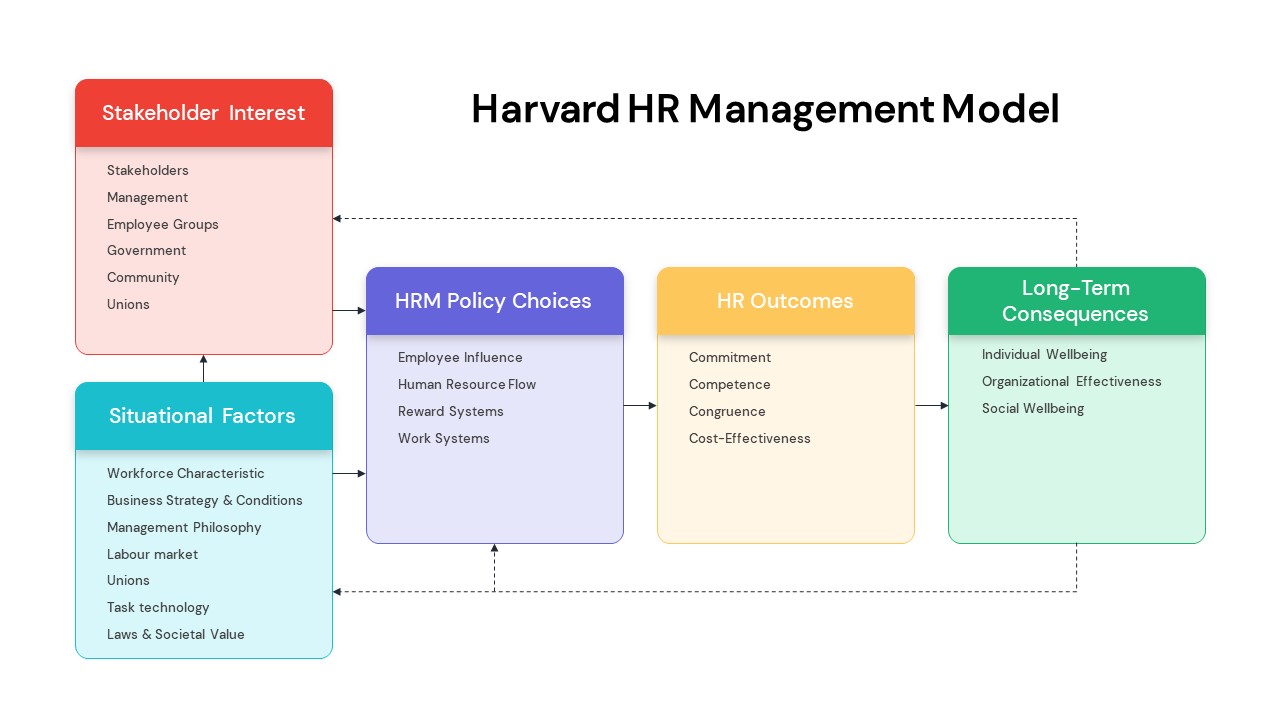
Harvard HR Management Model Diagram Template for PowerPoint & Google Slides
Process
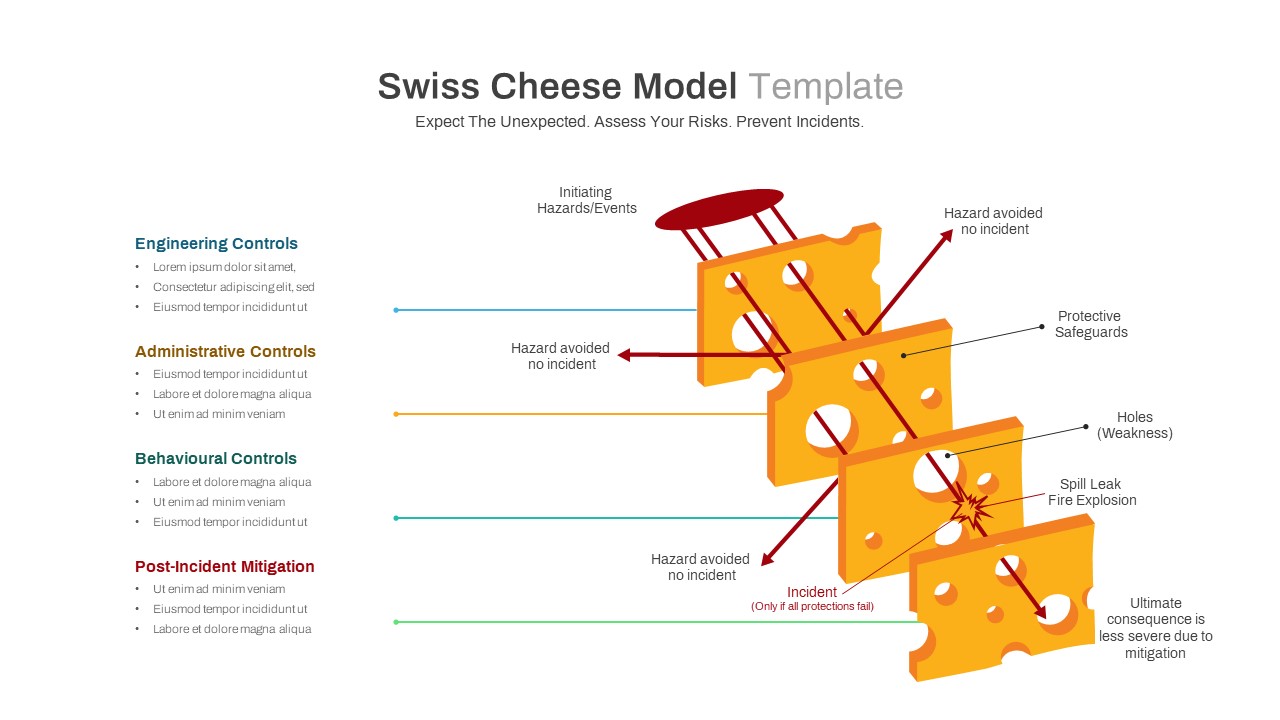
Swiss Cheese Risk Management Model Template for PowerPoint & Google Slides
Risk Management
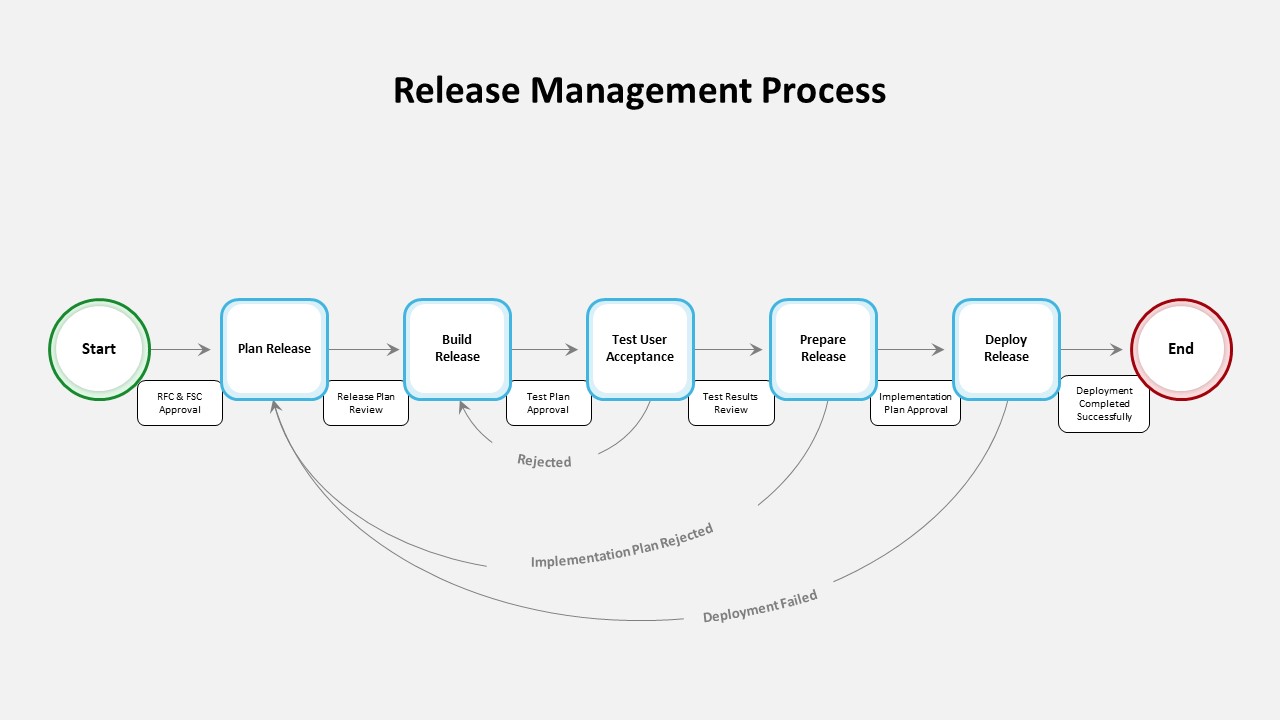
IT Agile Release Management Process Template for PowerPoint & Google Slides
Software Development
3R Waste Management Cycle Overview template for PowerPoint & Google Slides
Process
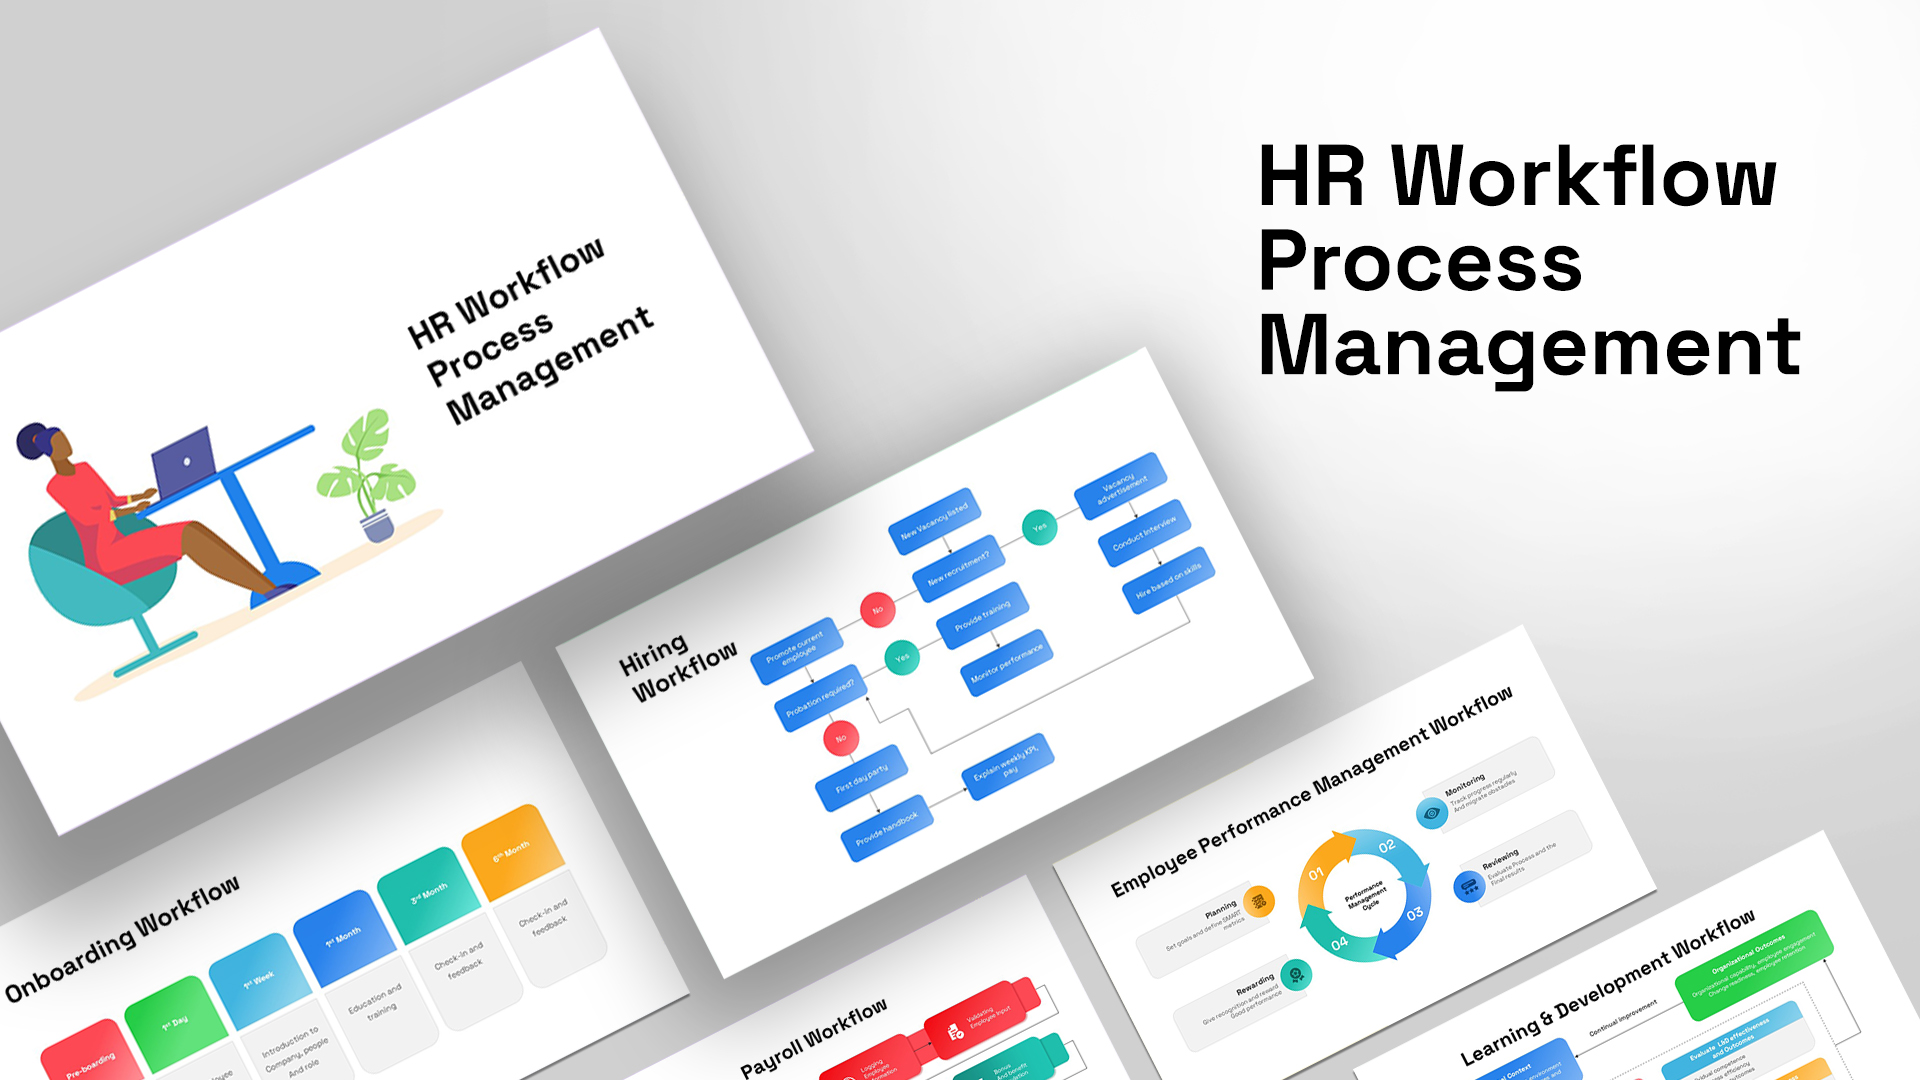
HR Workflow Process Management Template for PowerPoint & Google Slides
HR
Release Management Cycle Circular Diagram Template for PowerPoint & Google Slides
Software Development
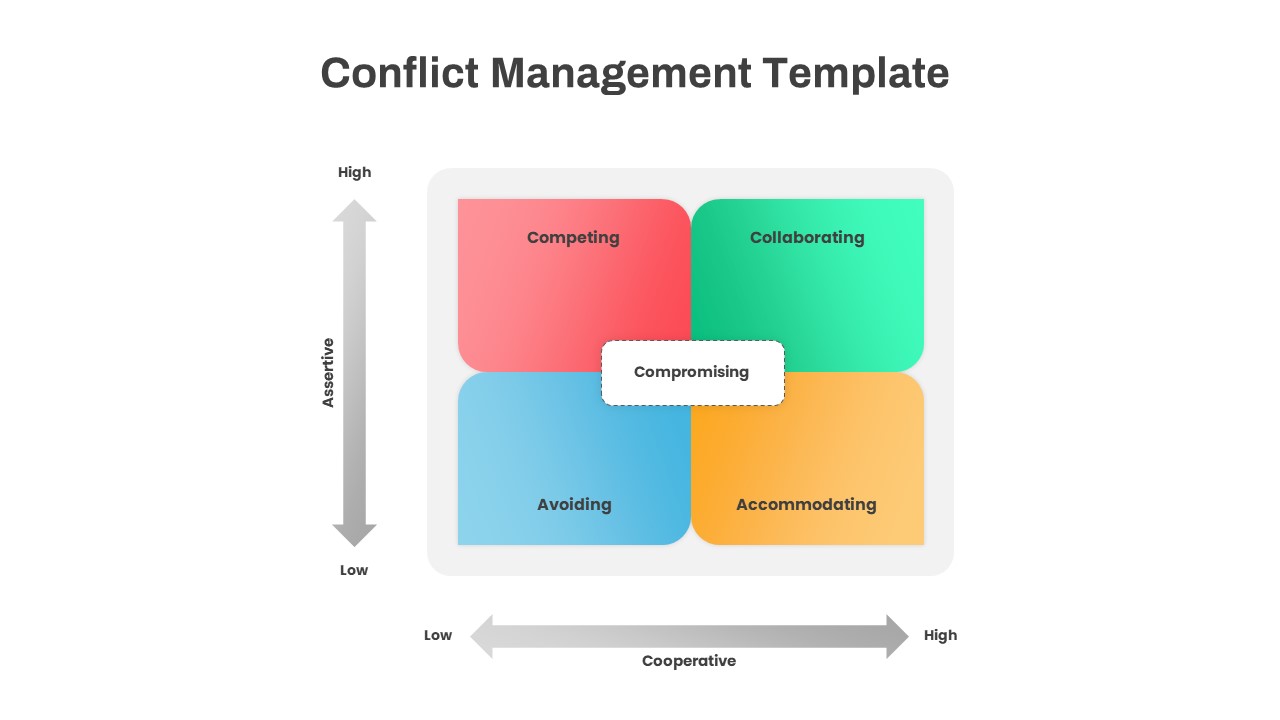
Conflict Management Matrix Template for PowerPoint & Google Slides
Leadership
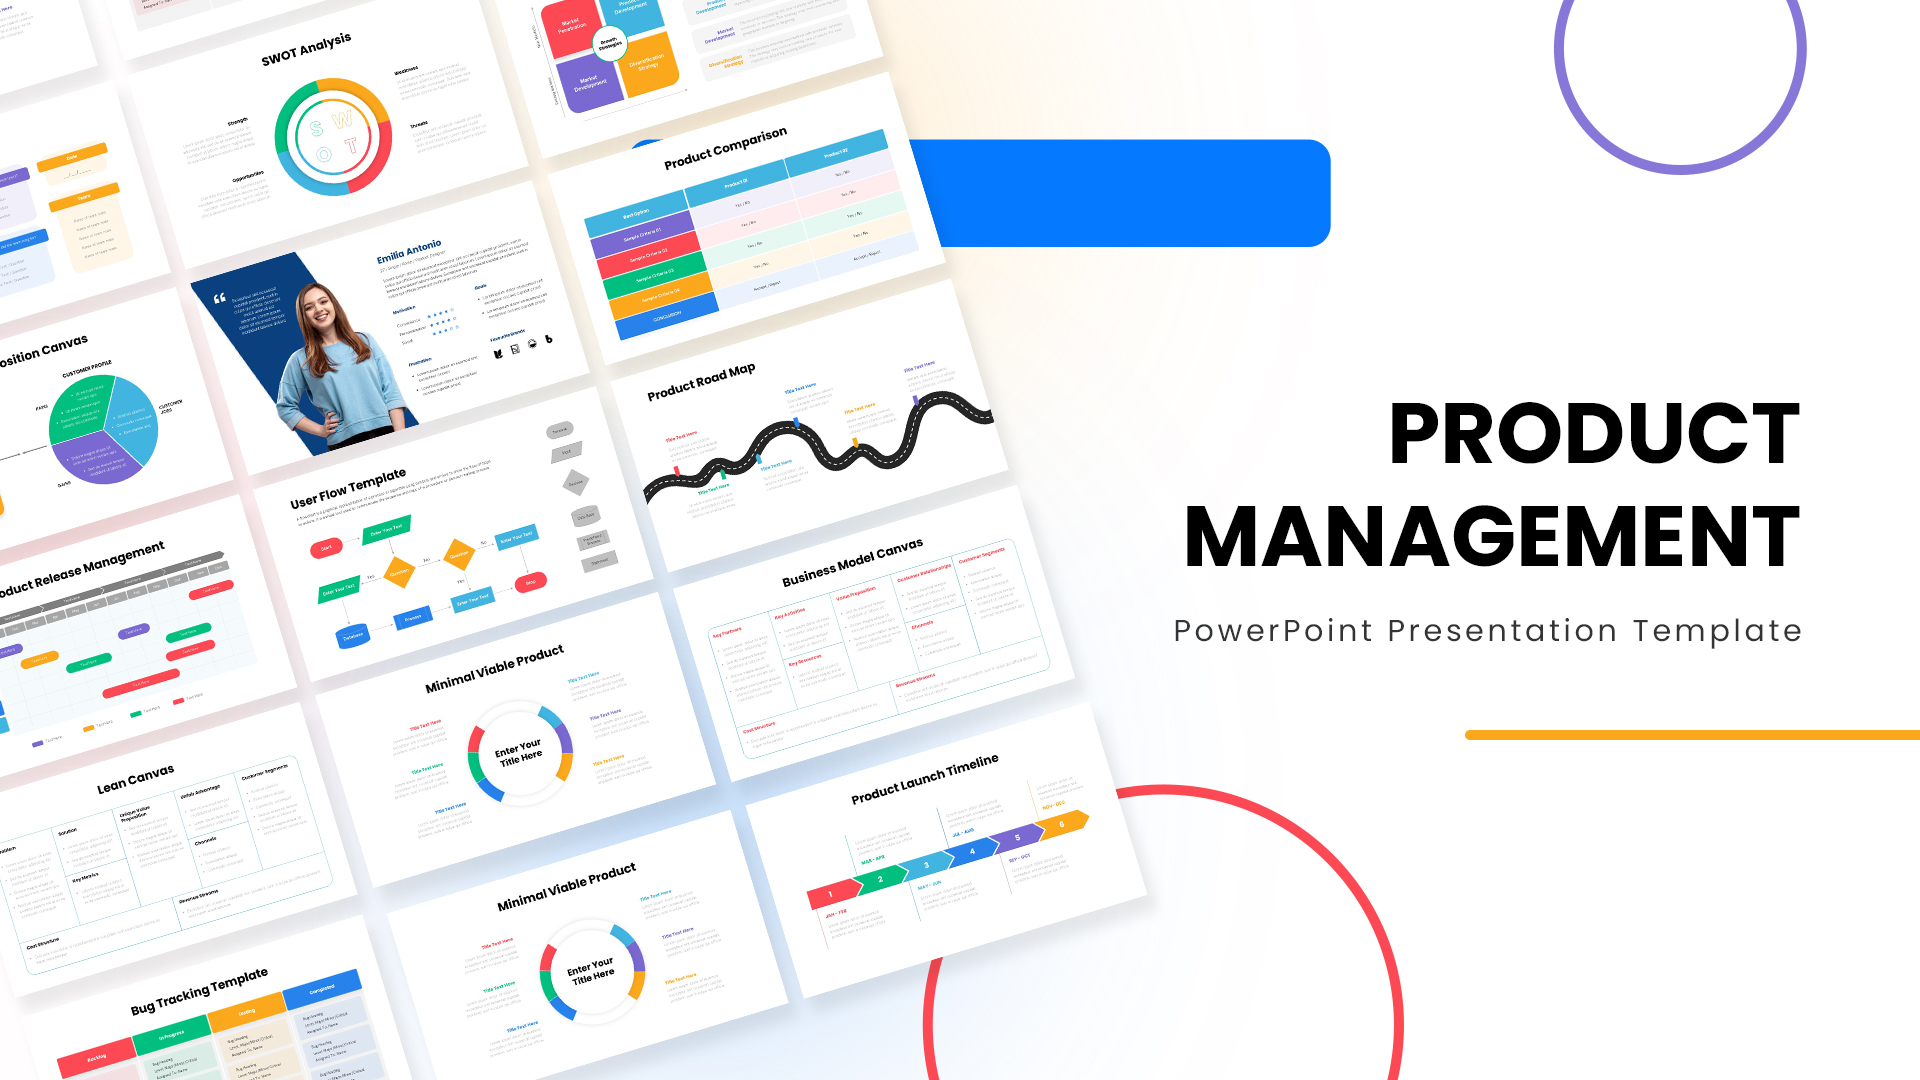
Product Management Presentation Template for PowerPoint & Google Slides
Project Status
Work Safety Training & Risk Management Template for PowerPoint & Google Slides
Risk Management
Free Comprehensive Management Strategy Deck Template for PowerPoint & Google Slides
Pitch Deck
Free
Free Time Management Clock Cycle Diagram Template for PowerPoint & Google Slides
Process
Free
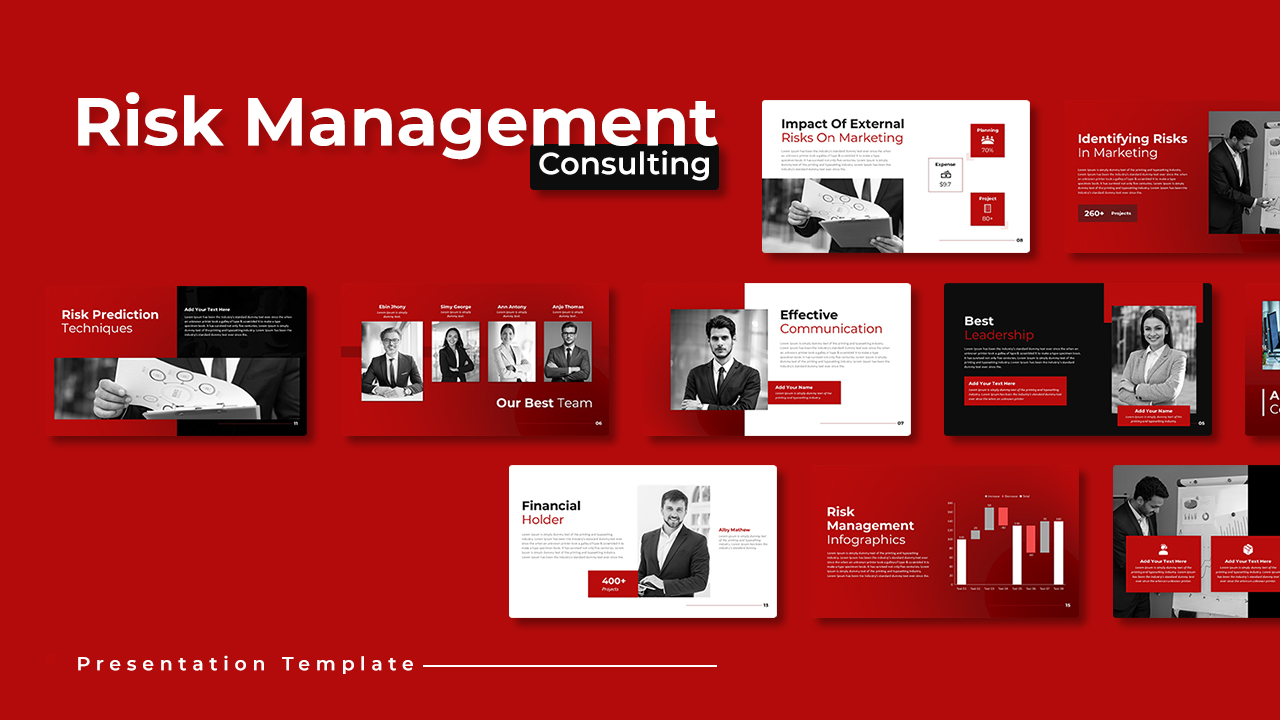
Risk Management Consulting Deck Template for PowerPoint & Google Slides
Risk Management
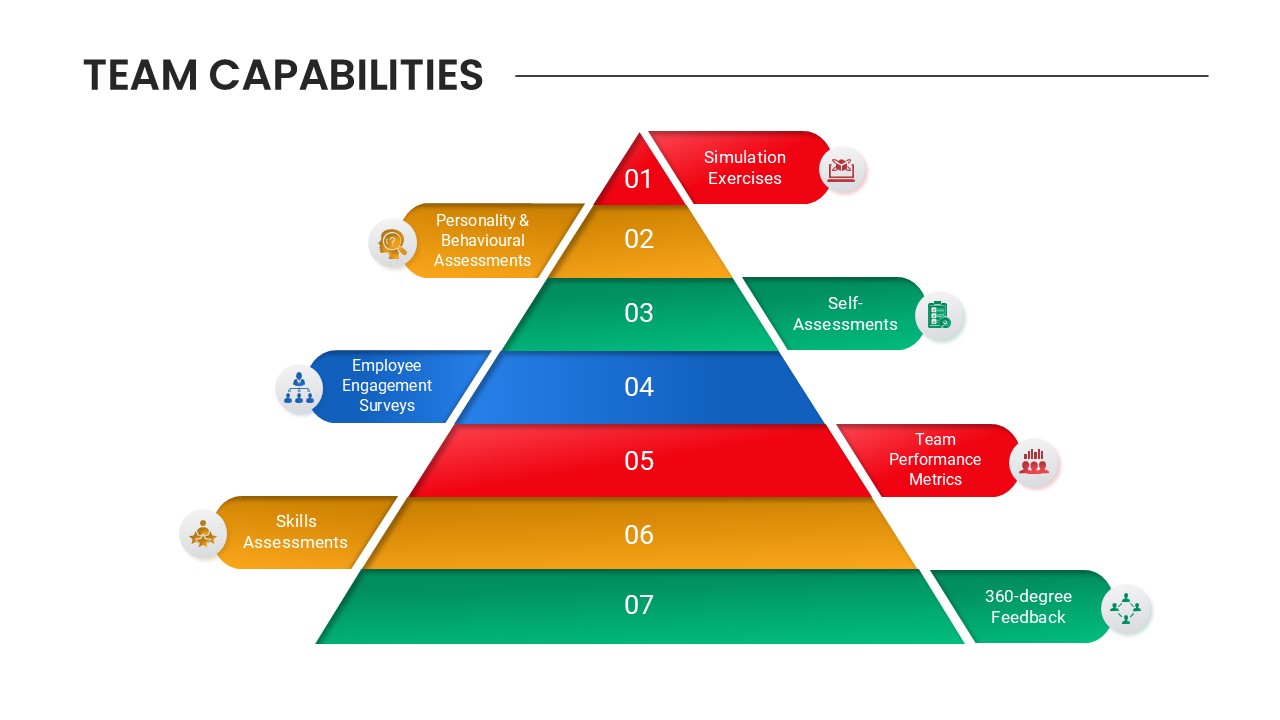
Team Capabilities and Management Template for PowerPoint & Google Slides
Our Team
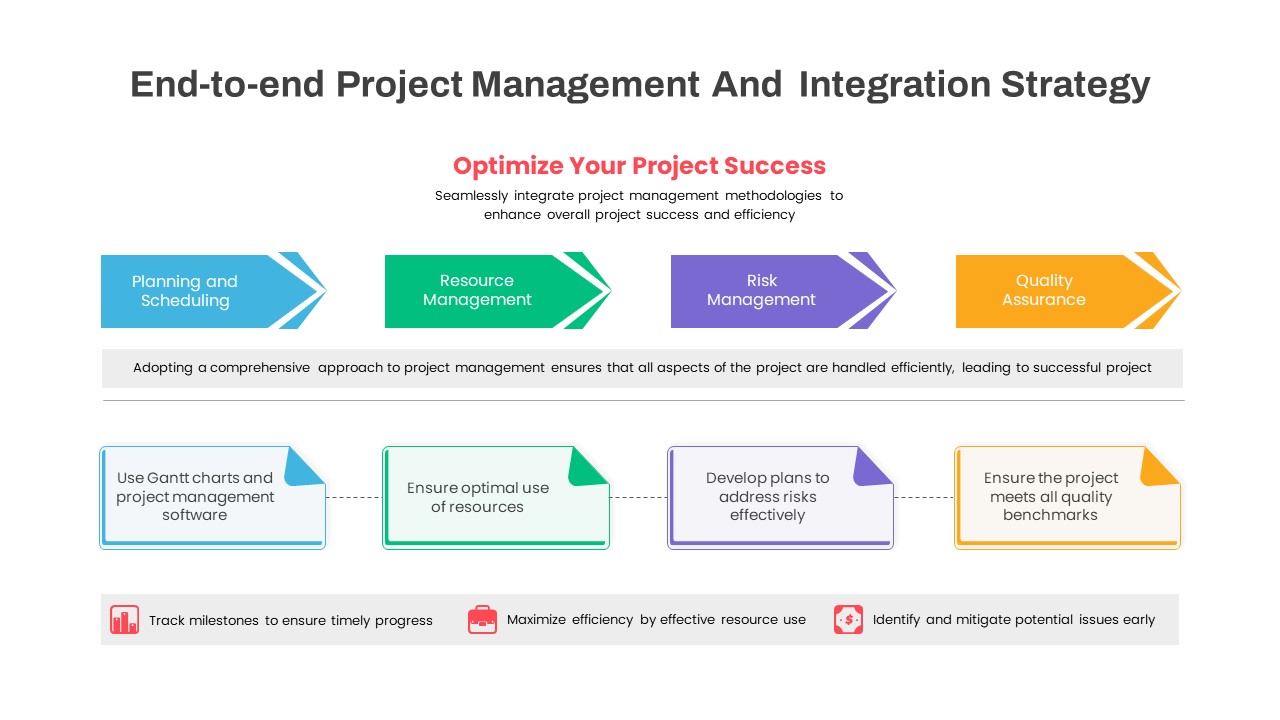
End-to-End Project Management Strategy Template for PowerPoint & Google Slides
Project
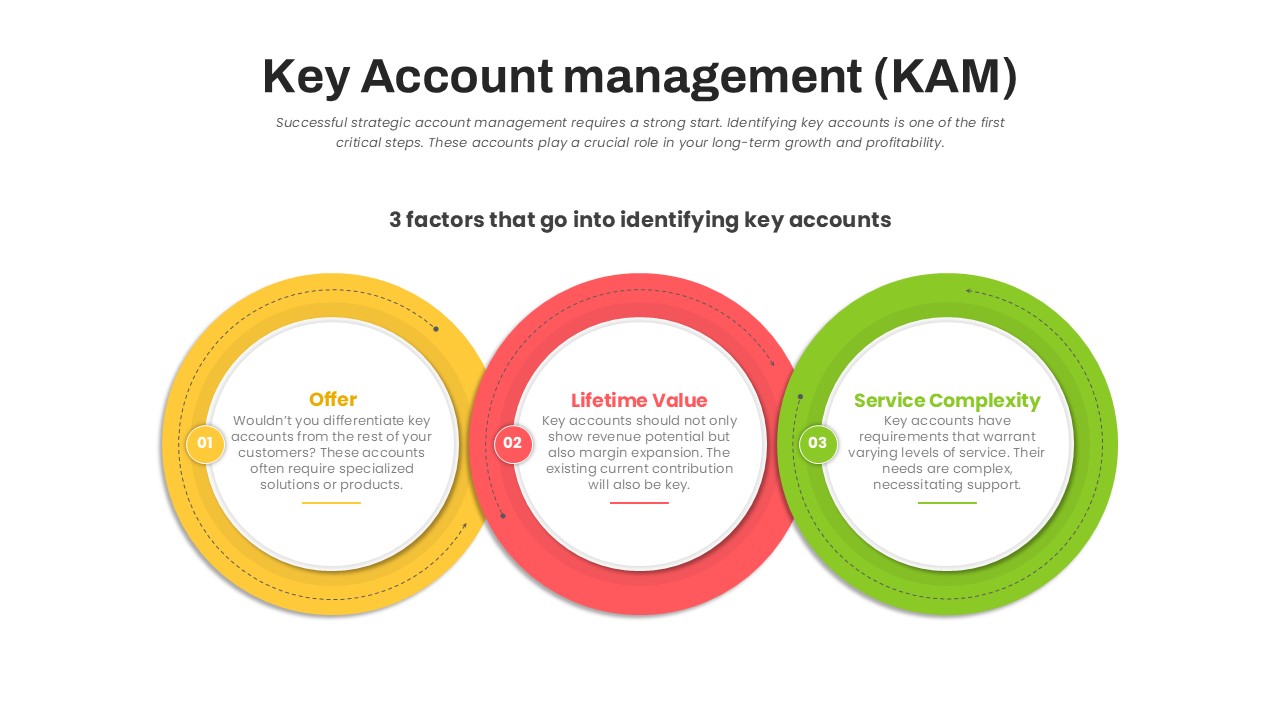
Key Account Management Circular Factors Template for PowerPoint & Google Slides
Circular
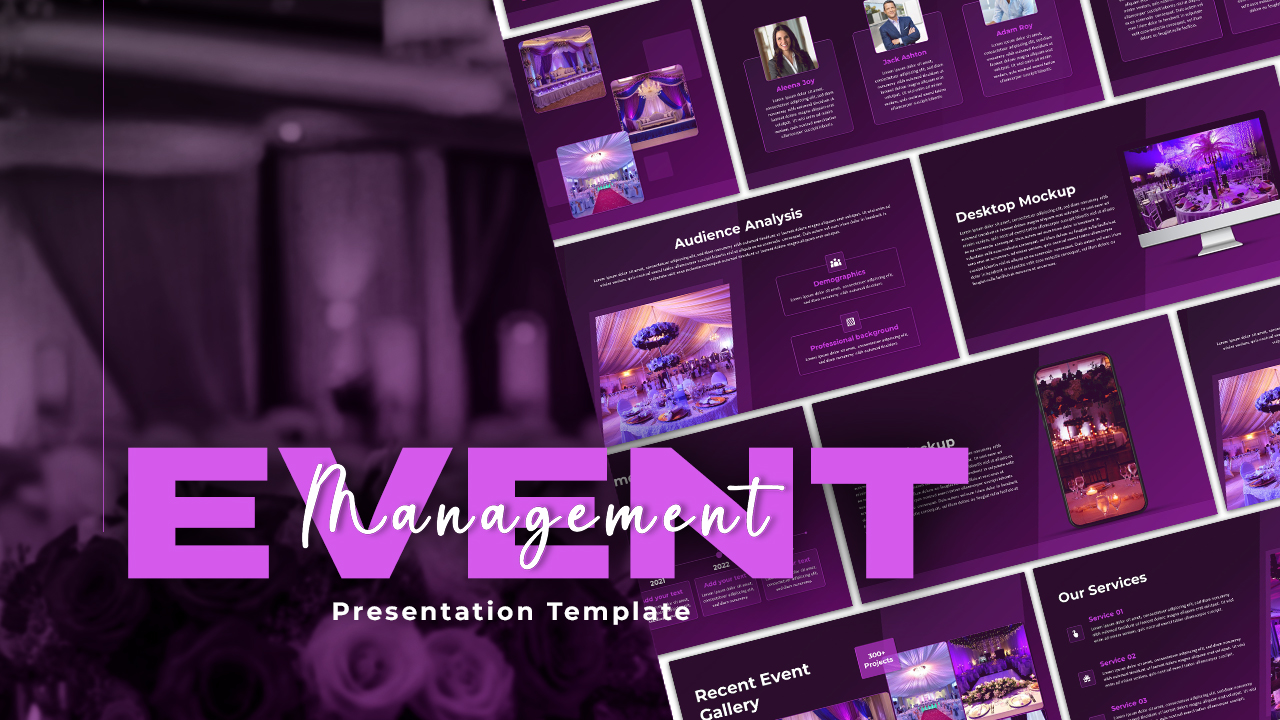
Free Event Management Gradient Template for PowerPoint & Google Slides
Company Profile
Free
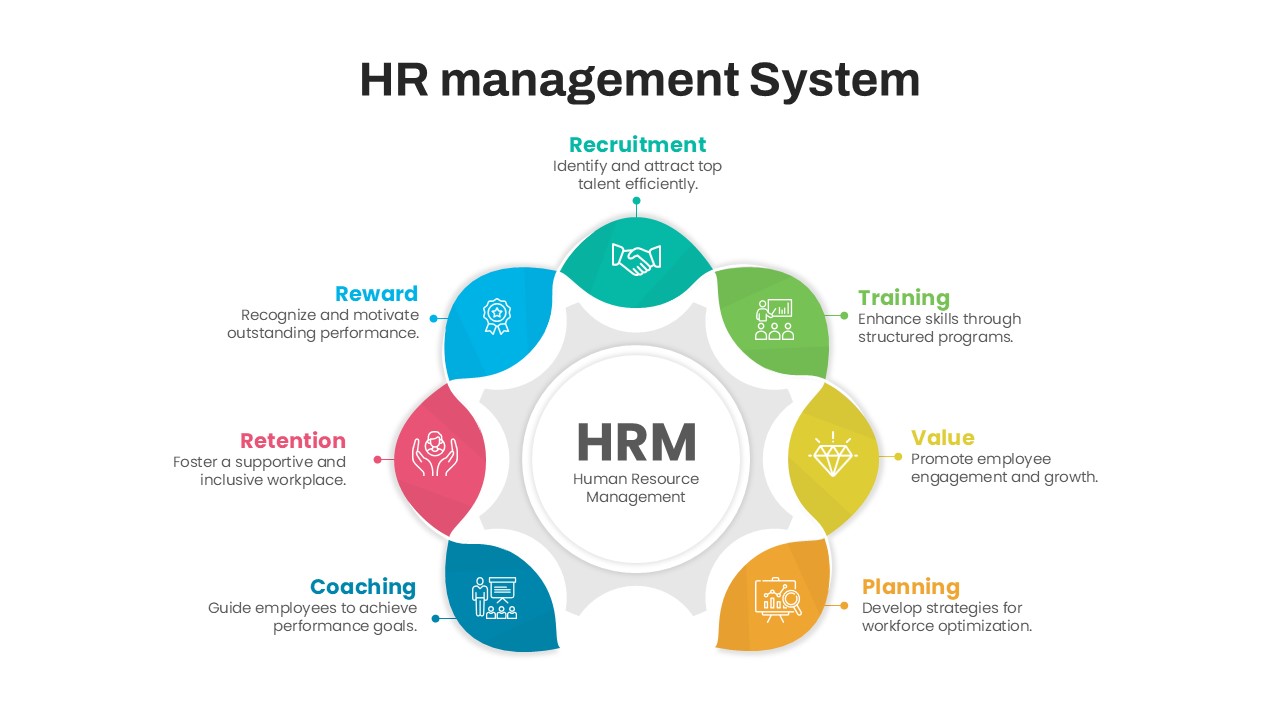
HR Management System Lifecycle Diagram Template for PowerPoint & Google Slides
Recruitment
Inventory Management Dashboard Template for PowerPoint & Google Slides
Process
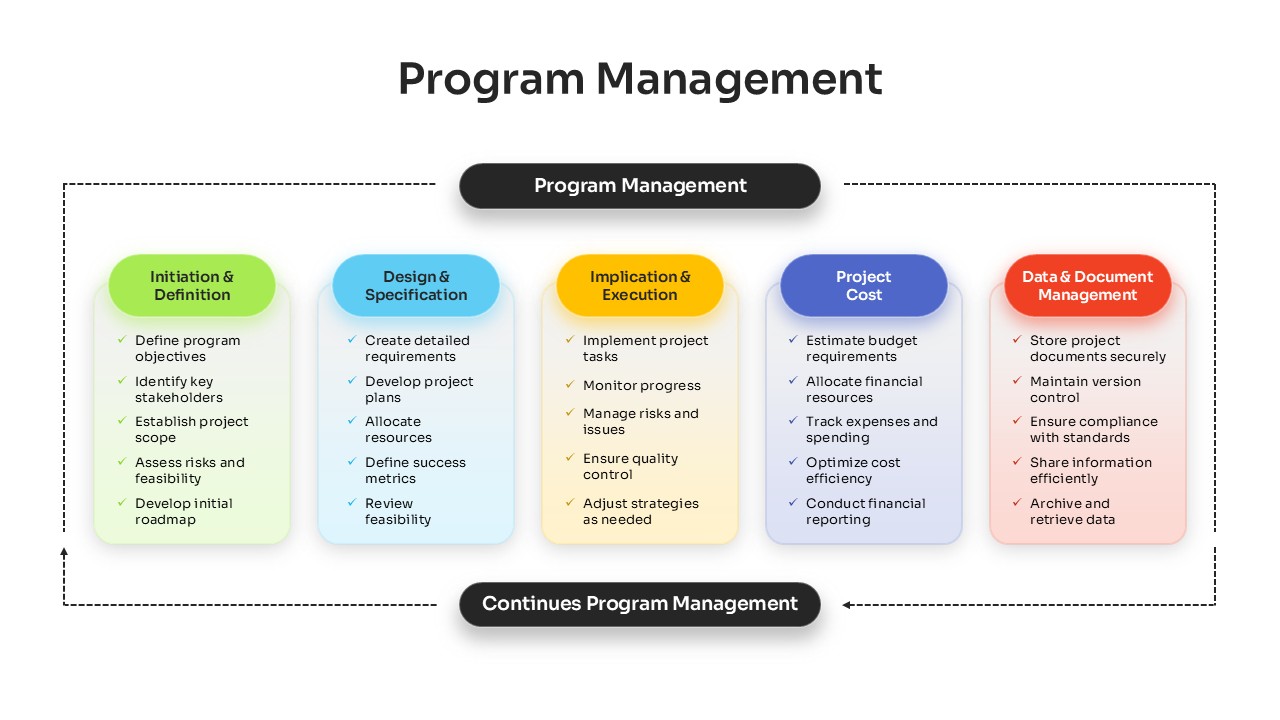
Comprehensive Program Management Process Template for PowerPoint & Google Slides
Process
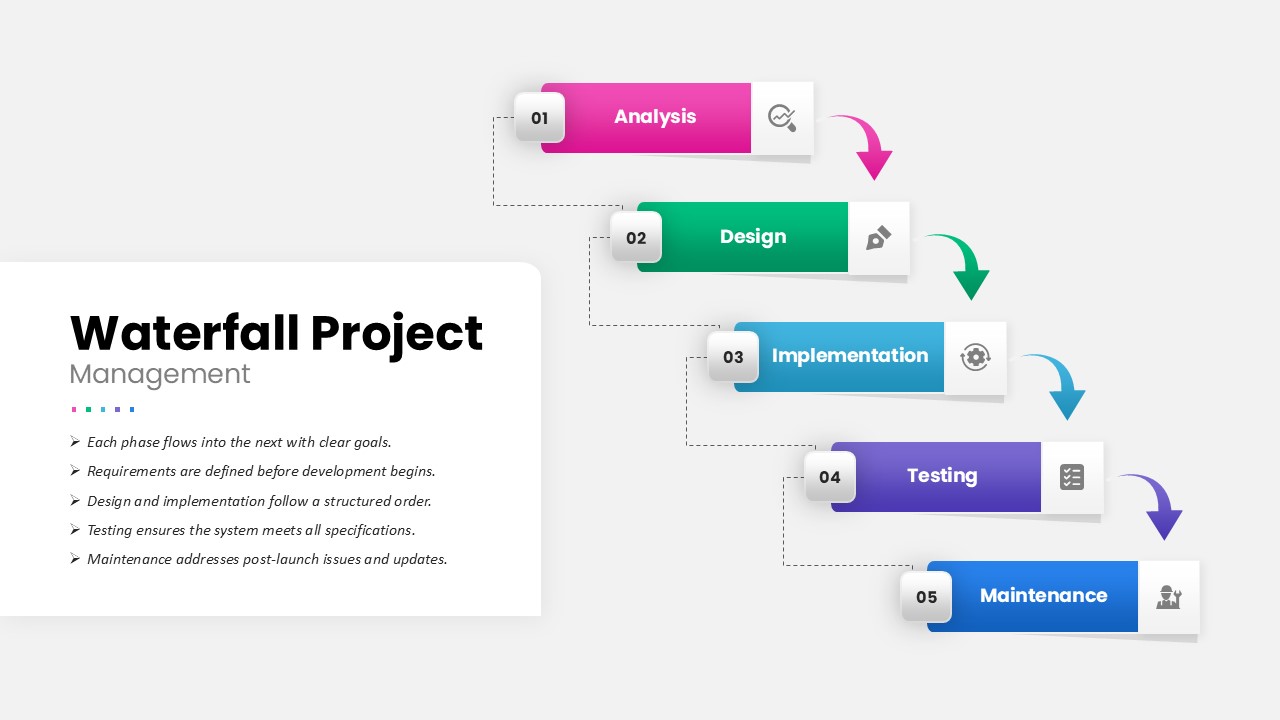
Waterfall Project Management Process template for PowerPoint & Google Slides
Process
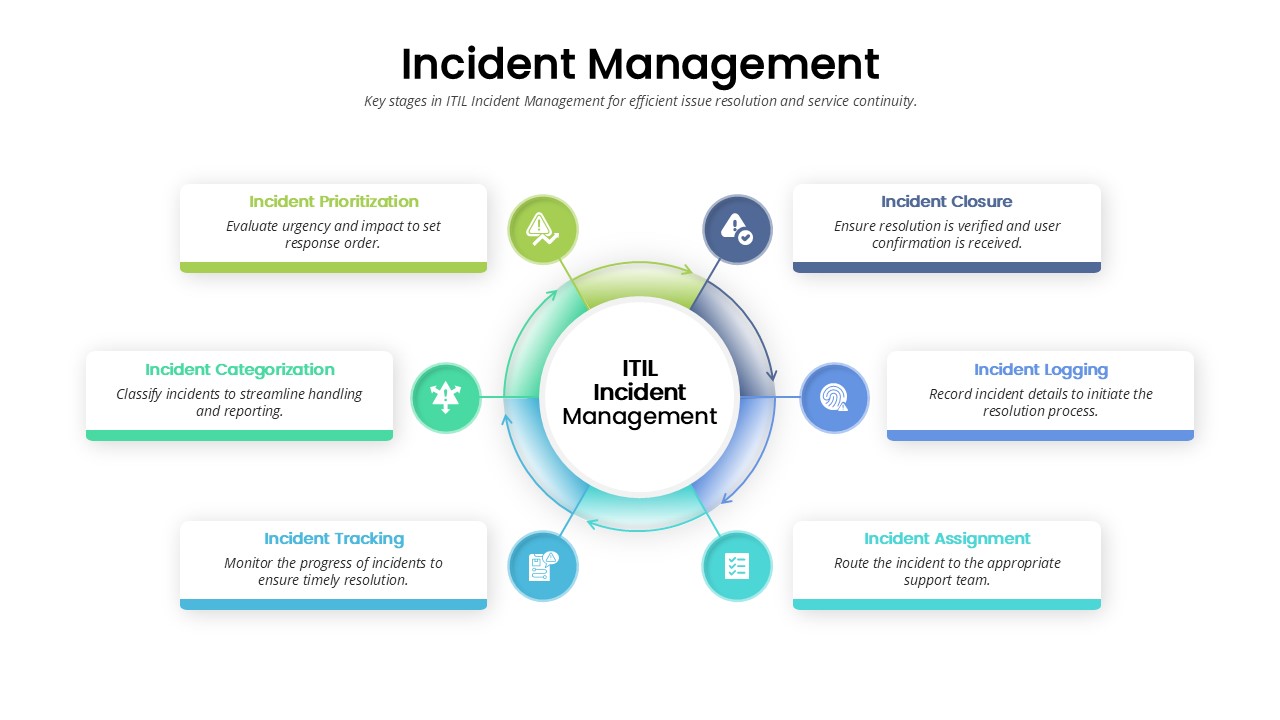
Incident Management Process template for PowerPoint & Google Slides
Process
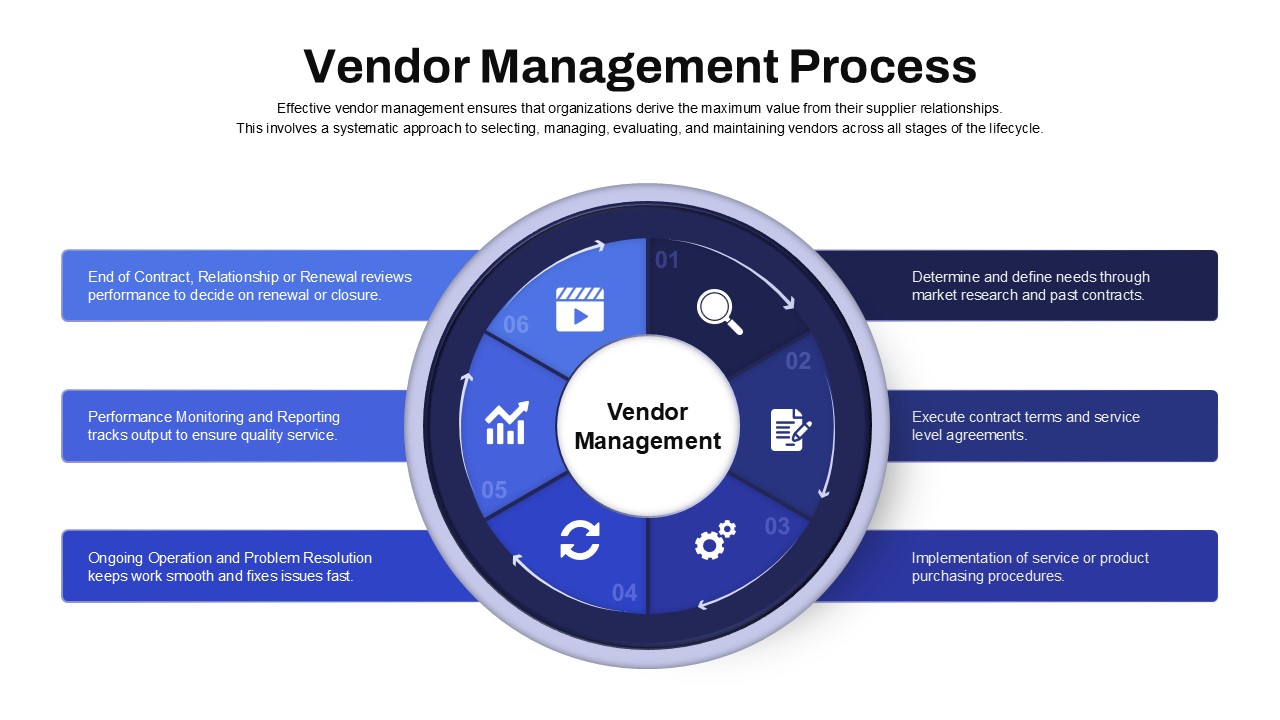
Vendor Management Process Diagram Template for PowerPoint & Google Slides
Process
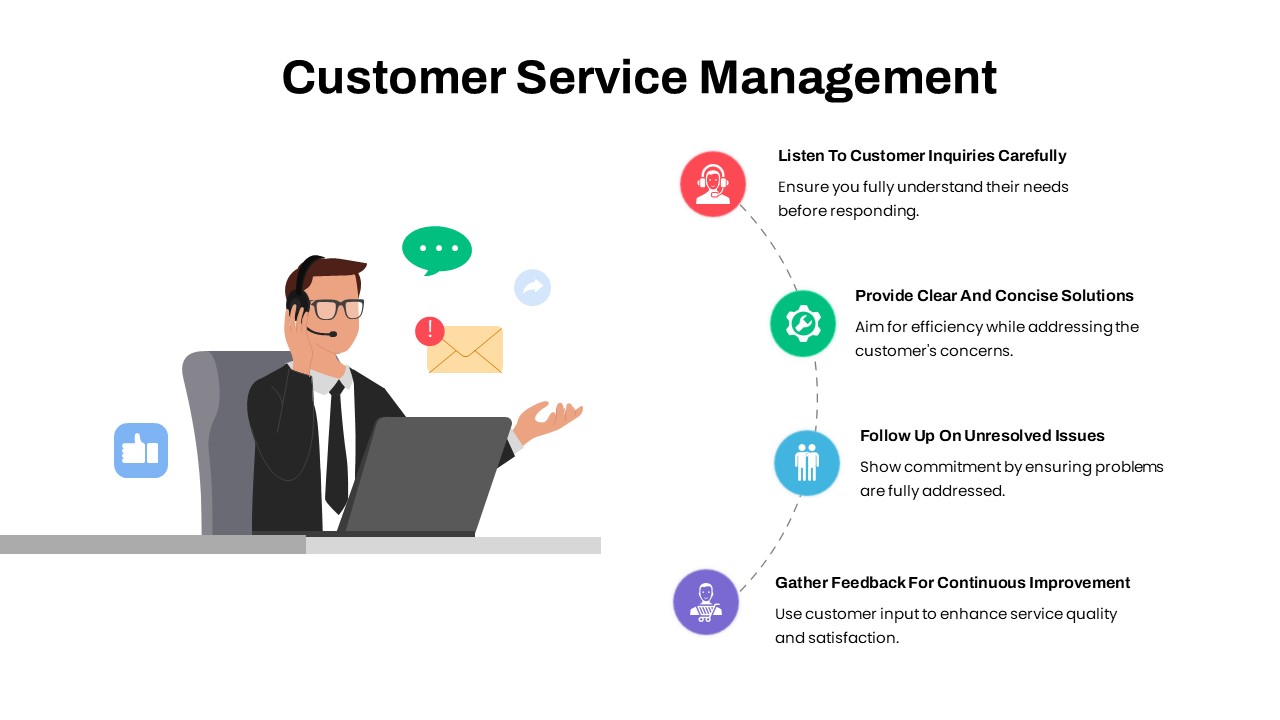
Customer Service Management Process Template for PowerPoint & Google Slides
Process
Change Management Process Cycle Diagram Template for PowerPoint & Google Slides
Process

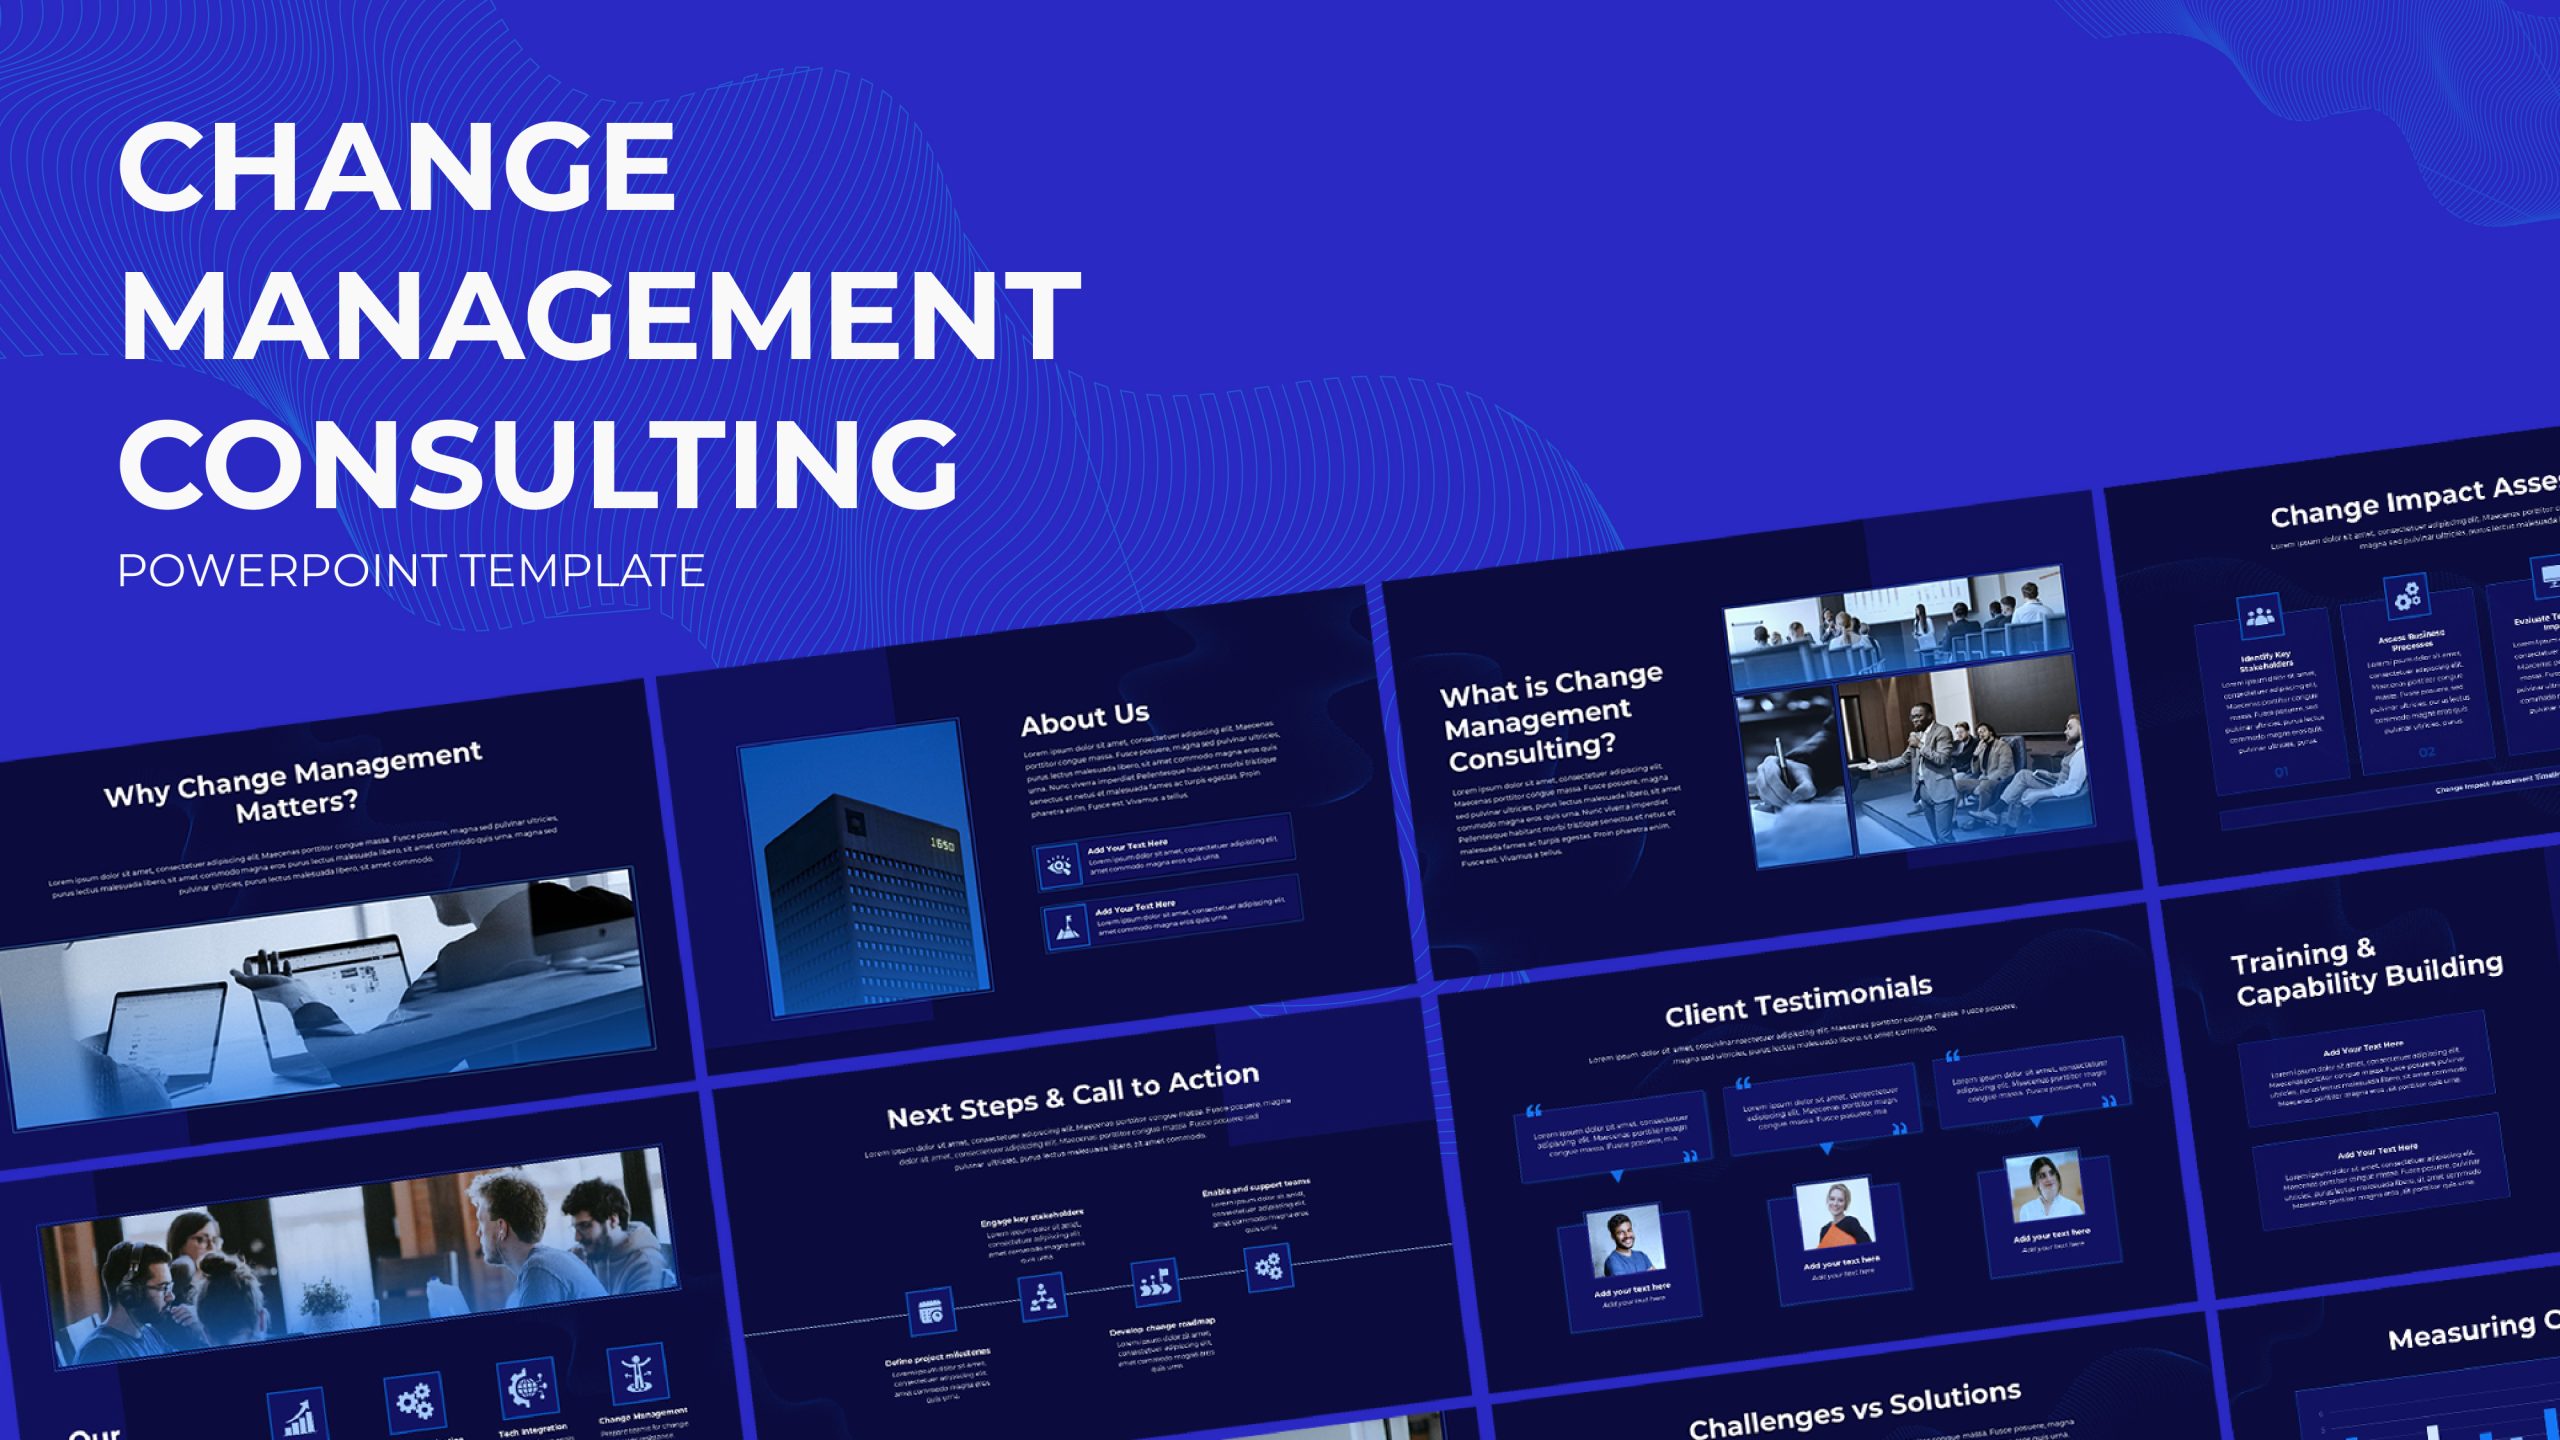
Change Management Consulting template for PowerPoint & Google Slides
Company Profile
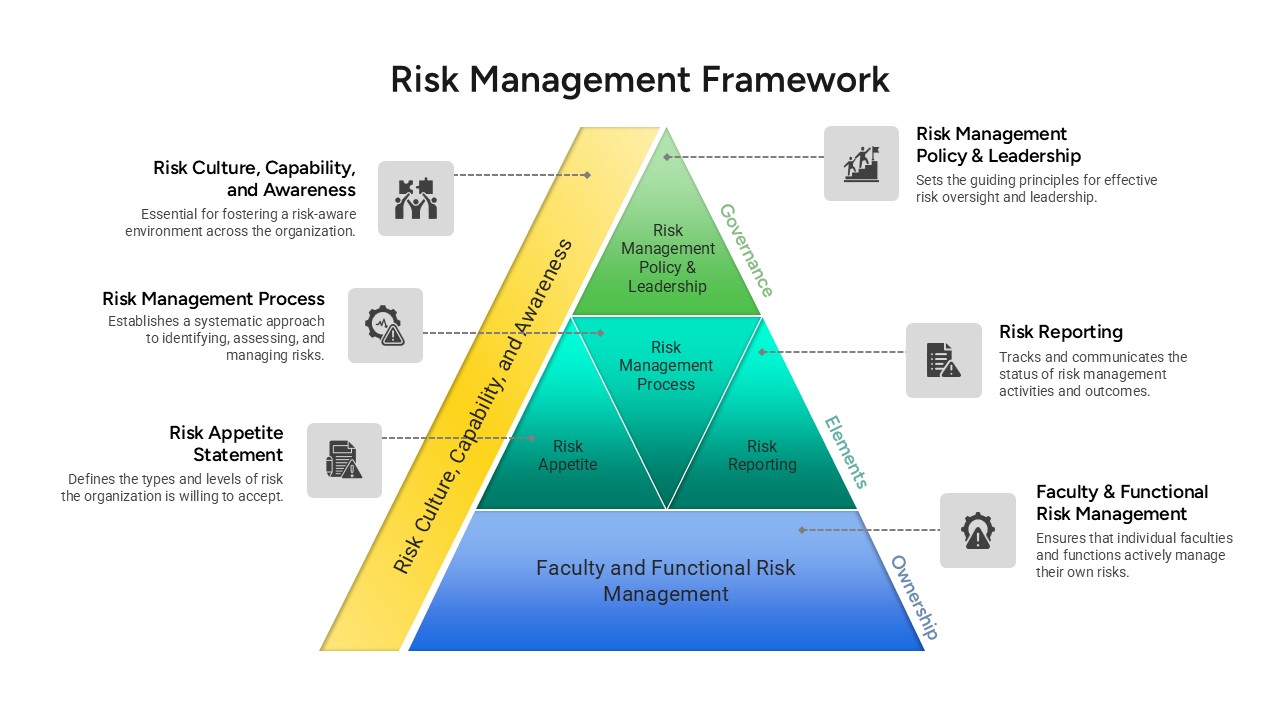
Risk Management Framework Pyramid Template for PowerPoint & Google Slides
Risk Management
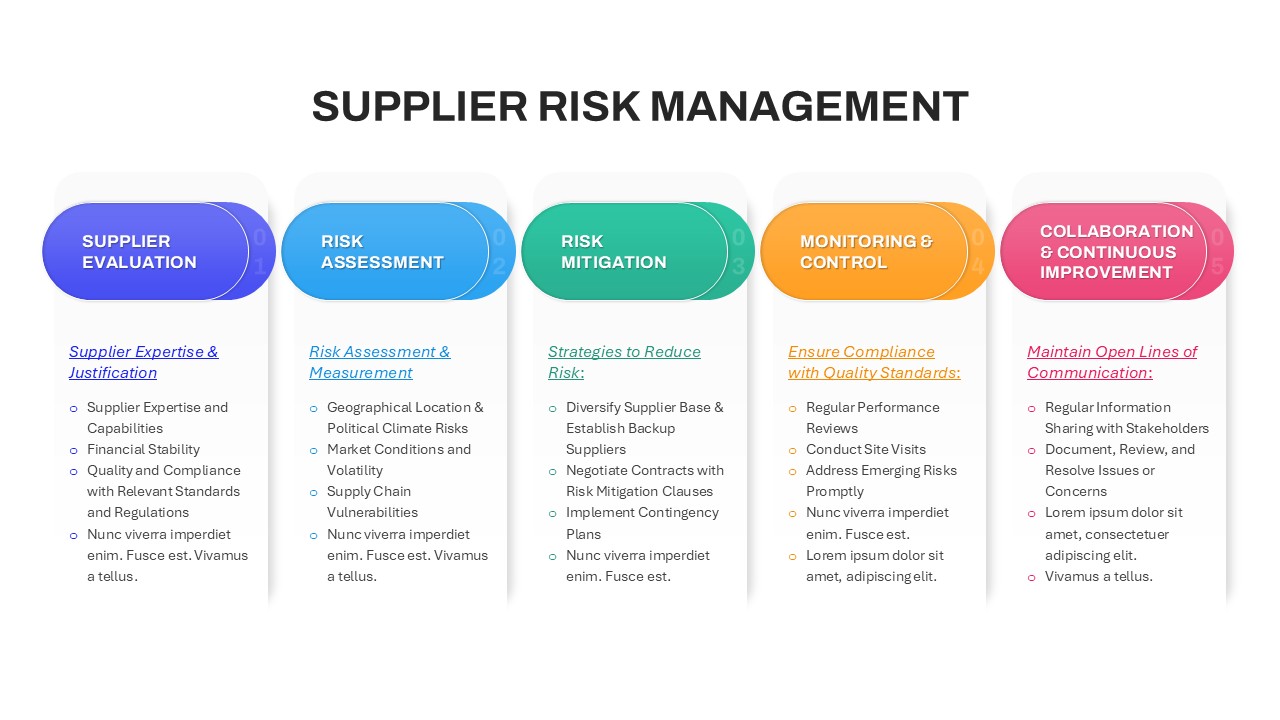
Supplier Risk Management template for PowerPoint & Google Slides
Opportunities Challenges
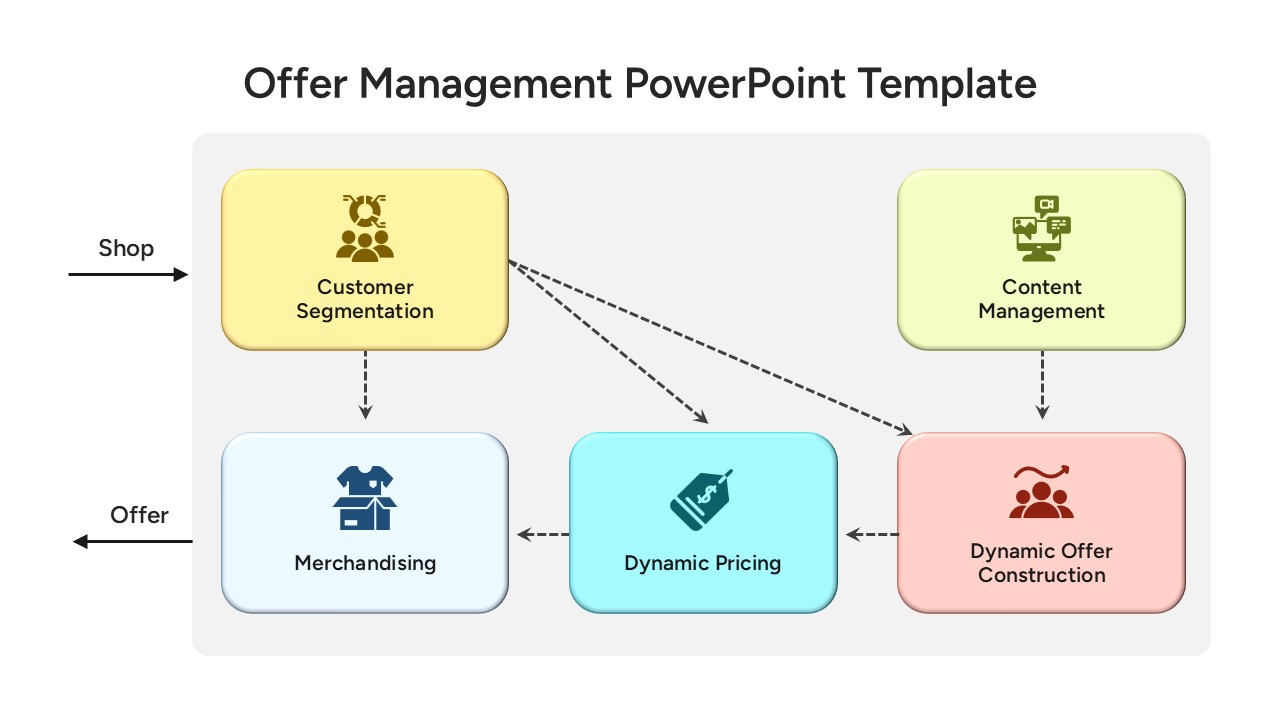
Offer Management Workflow Template for PowerPoint & Google Slides
Customer Journey
Action Items Management Dashboard Table Template for PowerPoint & Google Slides
Project Status
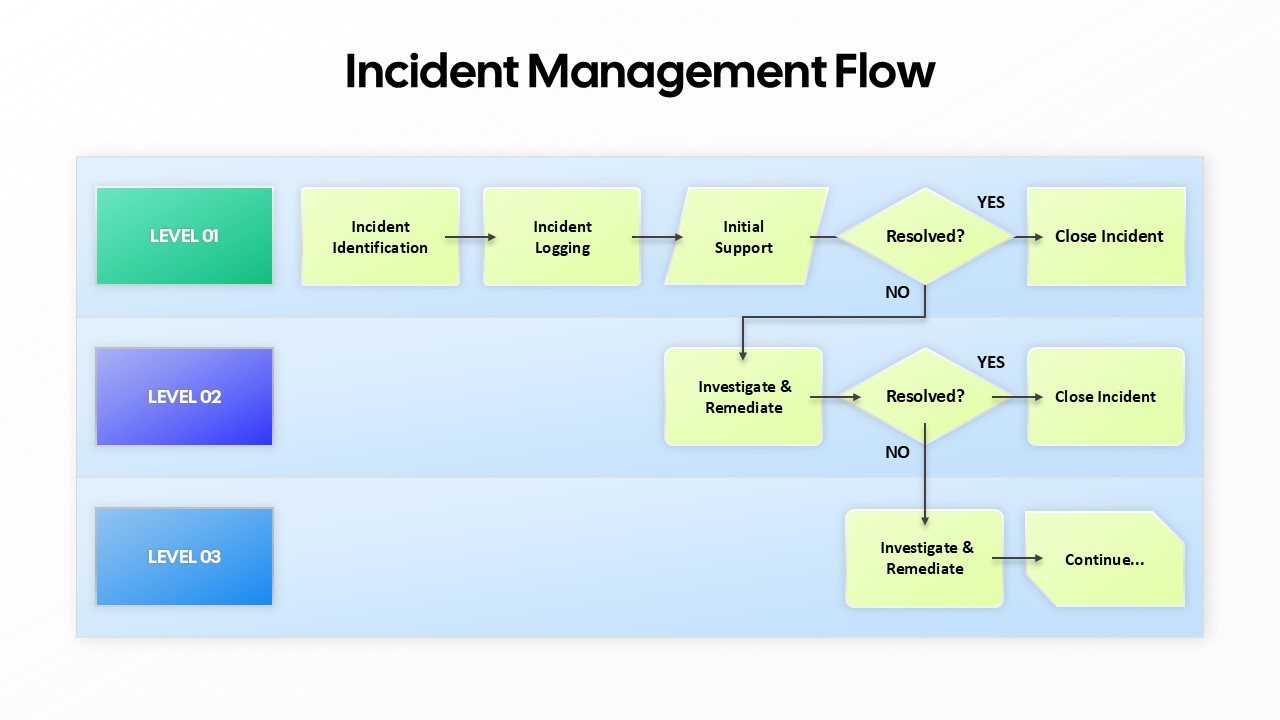
Incident Management Flow Process template for PowerPoint & Google Slides
Flow Charts
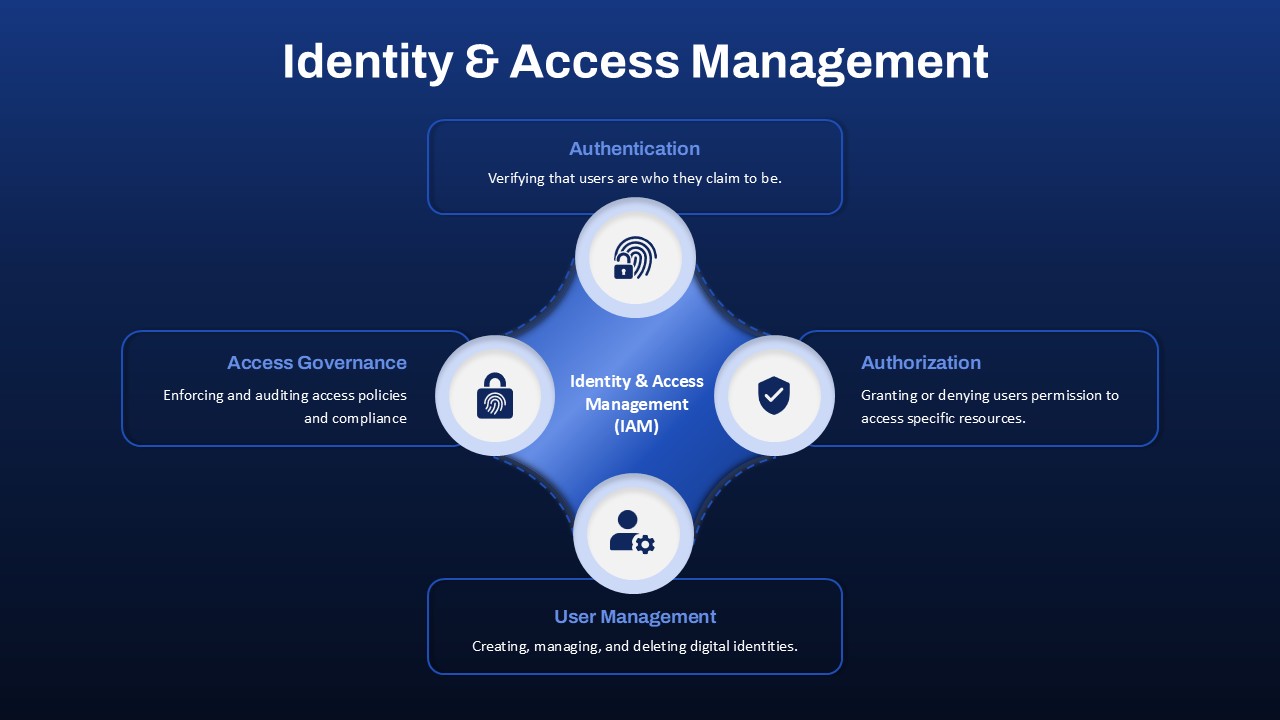
Identity & Access Management template for PowerPoint & Google Slides
Information Technology
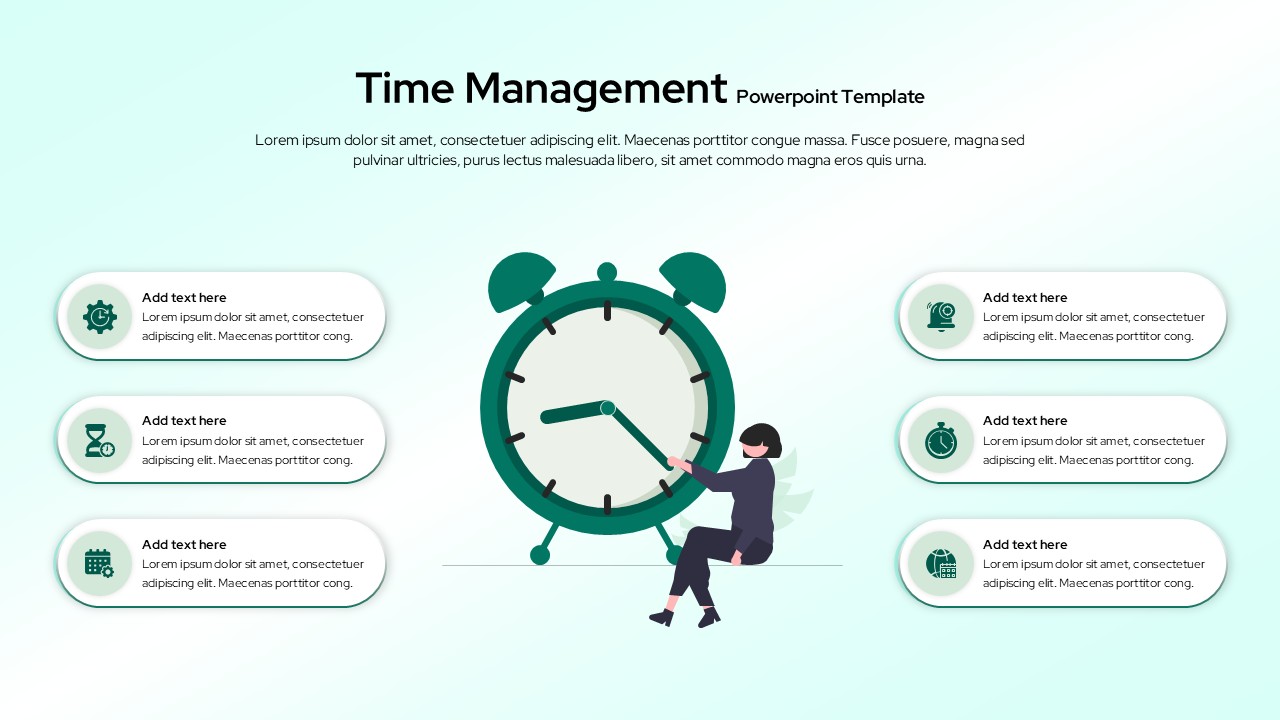
Time Management template for PowerPoint & Google Slides
Business
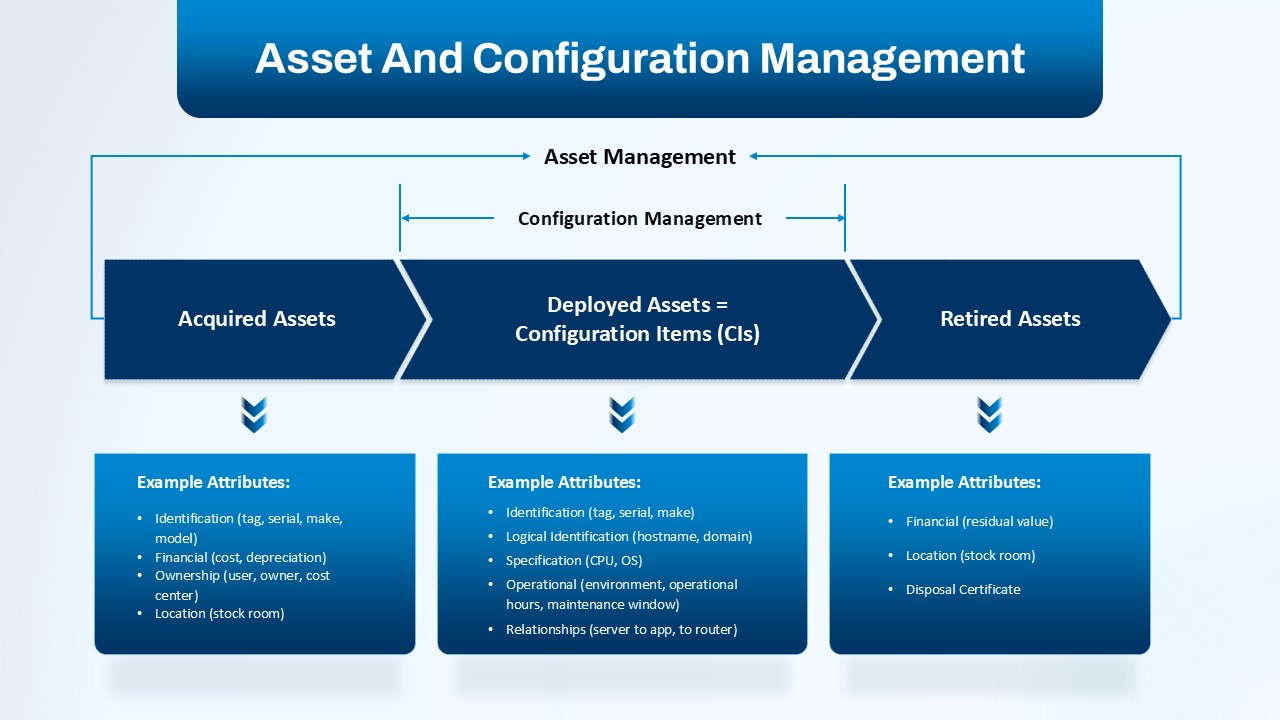
Asset and Configuration Management Overview template for PowerPoint & Google Slides
Information Technology
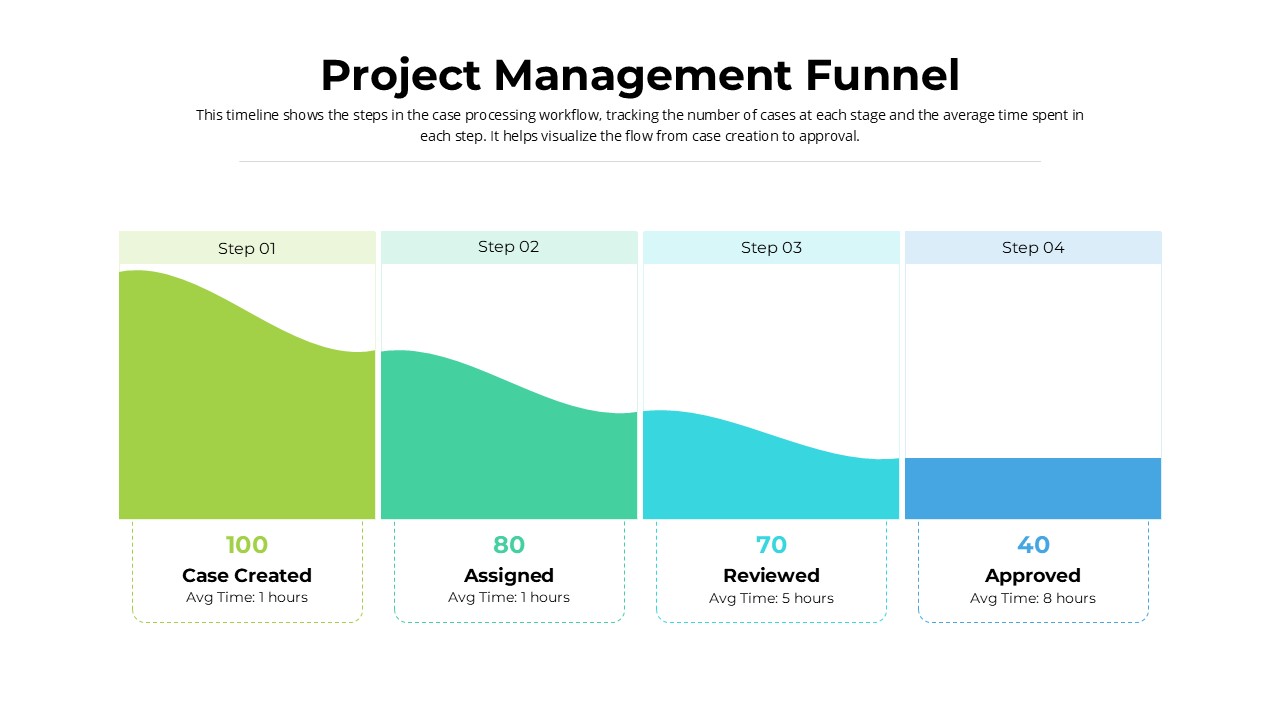
Project Management Funnel Template for PowerPoint & Google Slides
Funnel
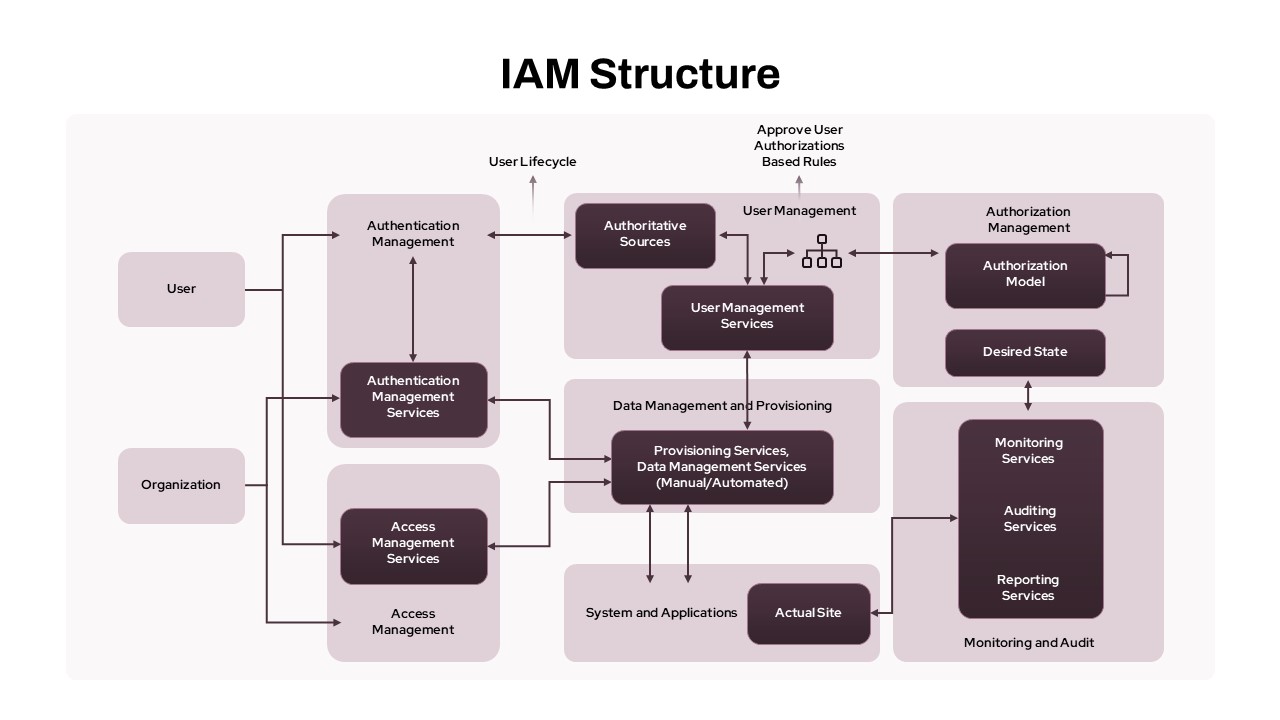
IAM Access Management Structure Diagram Template for PowerPoint & Google Slides
Flow Charts
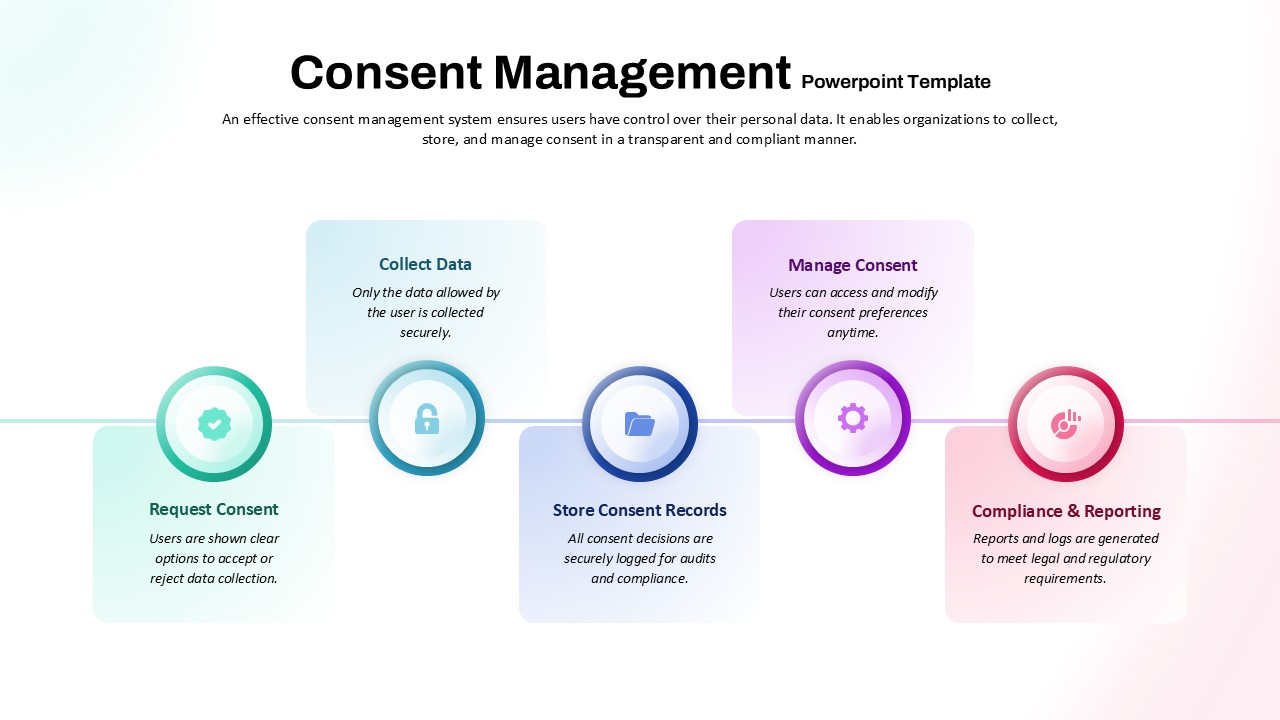
Consent Management System Process Flow Template for PowerPoint & Google Slides
Process
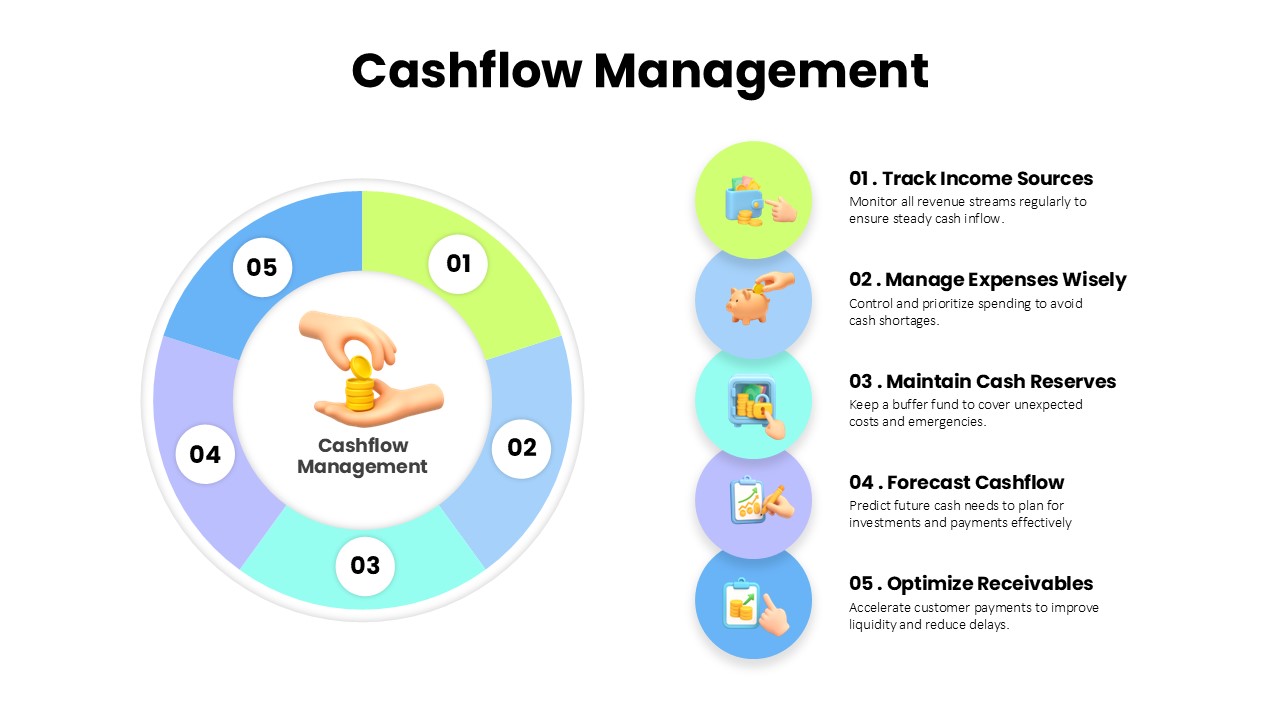
Cashflow Management Cycle Diagram Template for PowerPoint & Google Slides
Finance
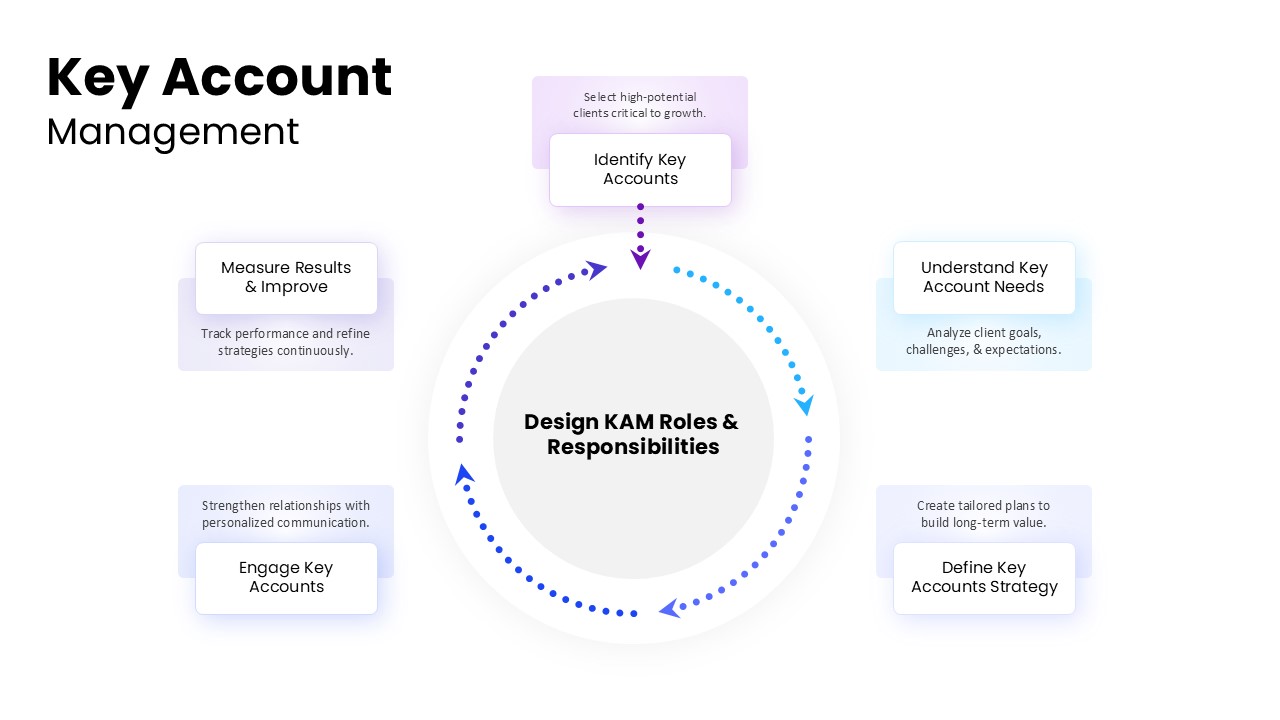
Comprehensive Key Account Management Template for PowerPoint & Google Slides
Process
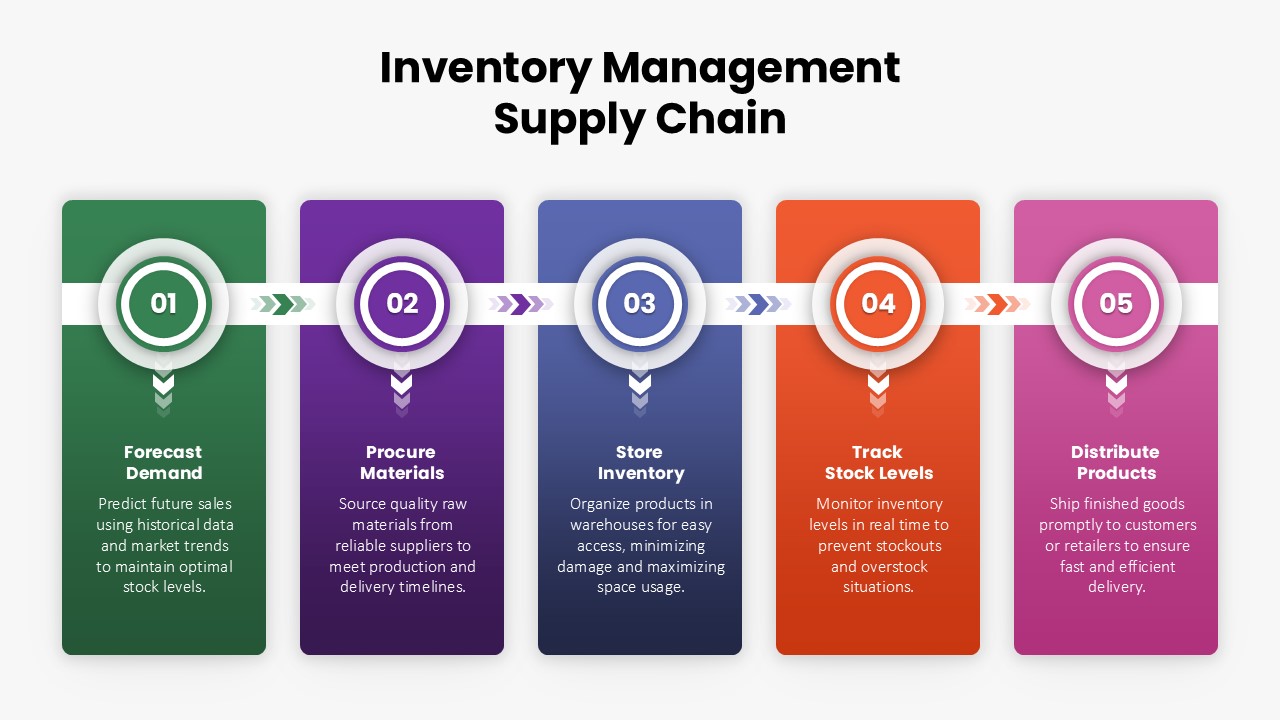
Inventory Management Supply Chain Template for PowerPoint & Google Slides
Process
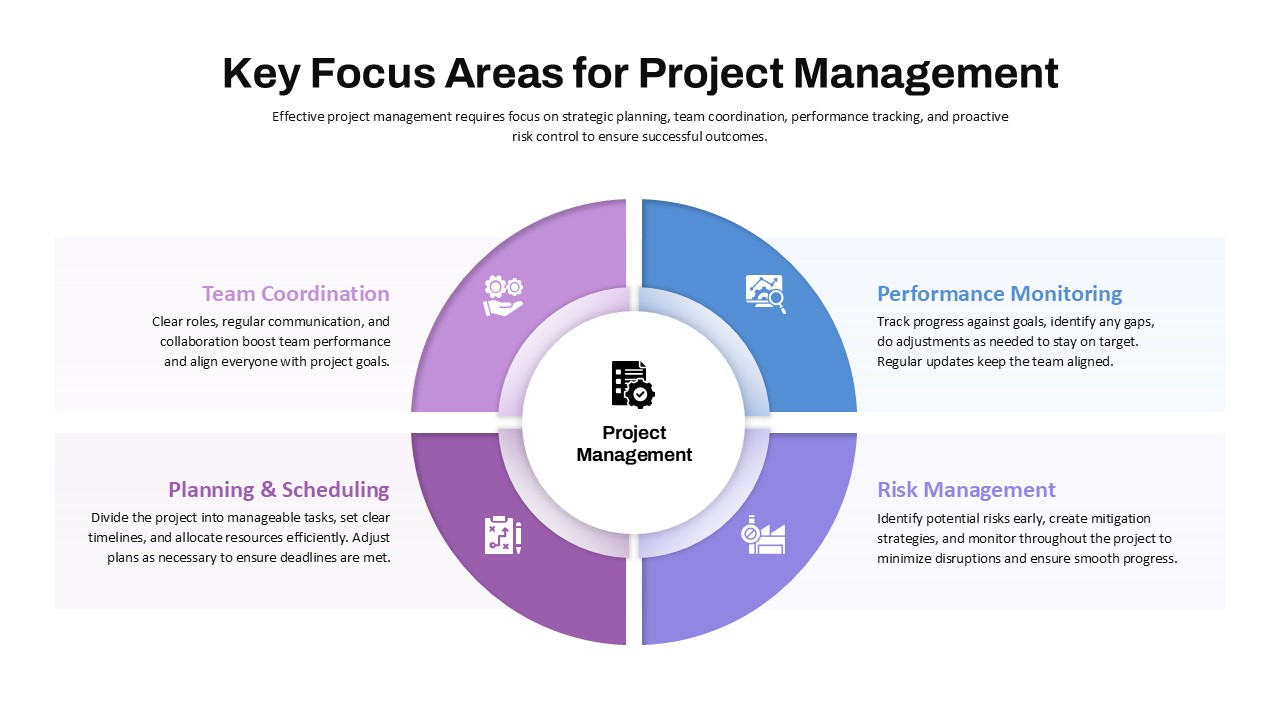
Key Focus Areas for Project Management Template for PowerPoint & Google Slides
Business
Machine Learning Model Management Template for PowerPoint & Google Slides
Machine Learning