Gear Process Diagram Template for PowerPoint & Google Slides


Description
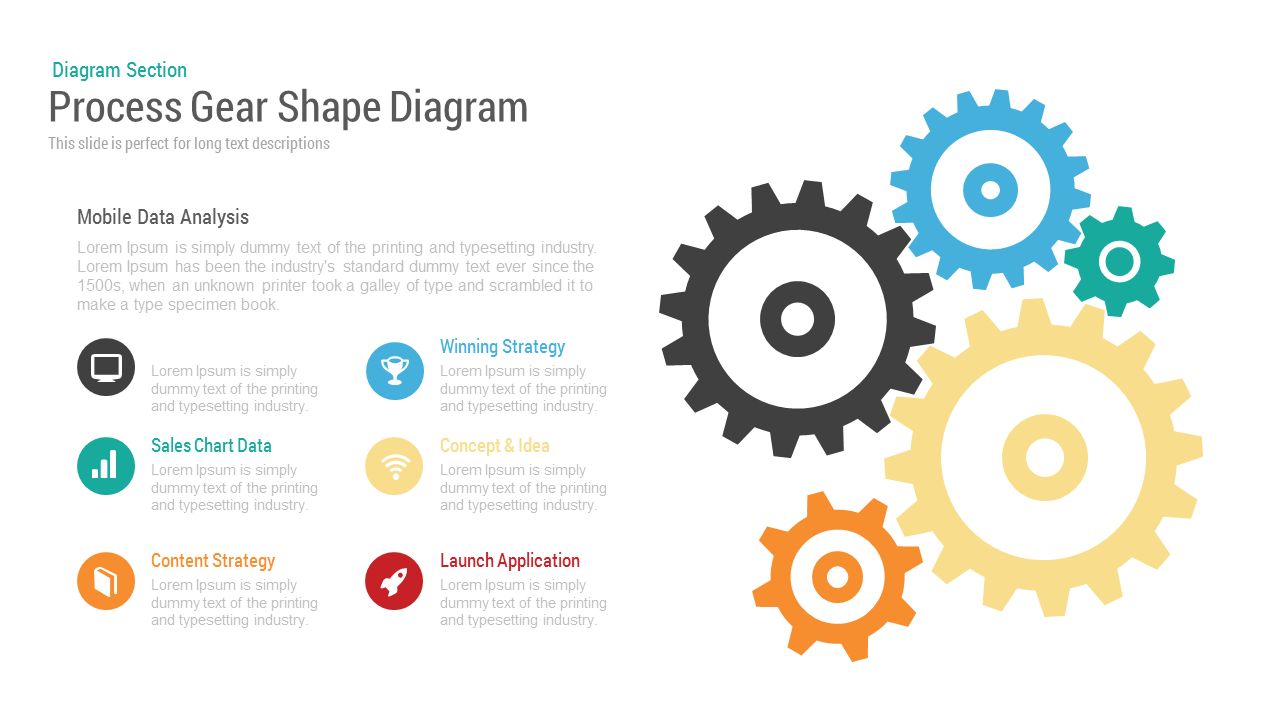
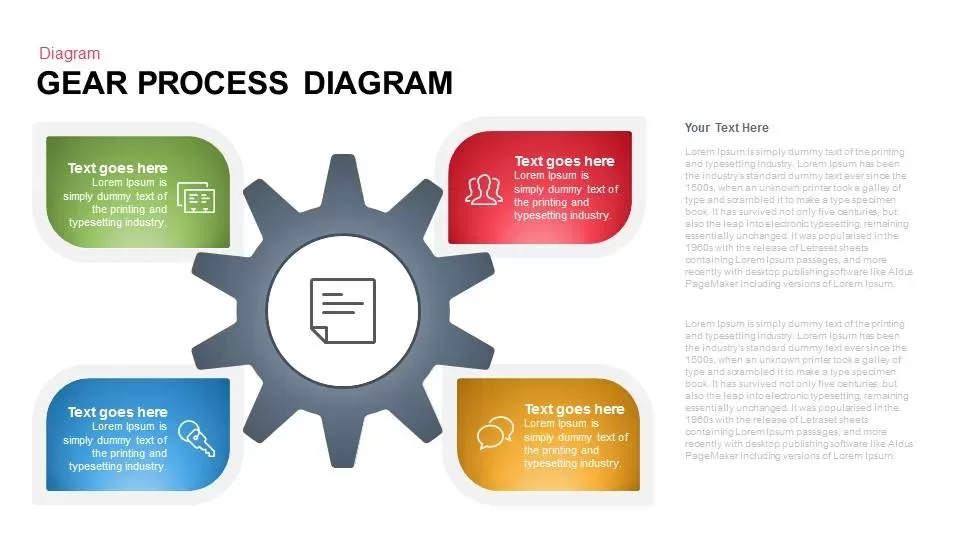
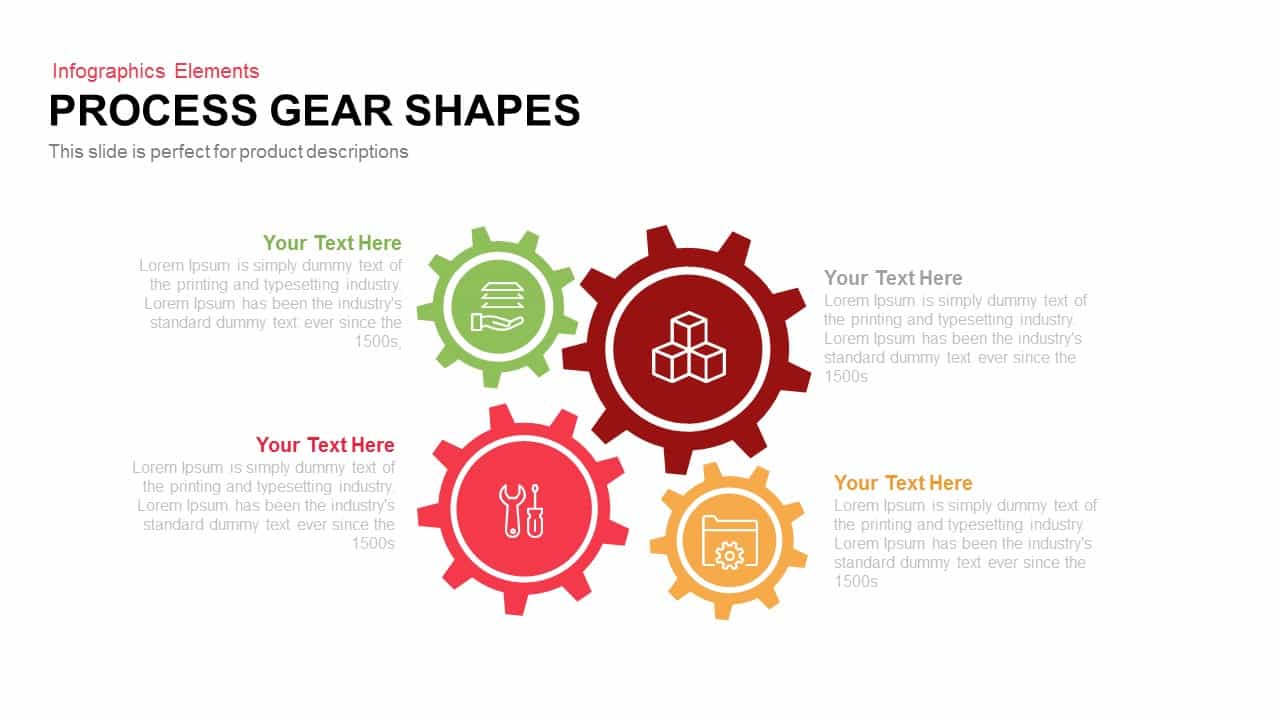
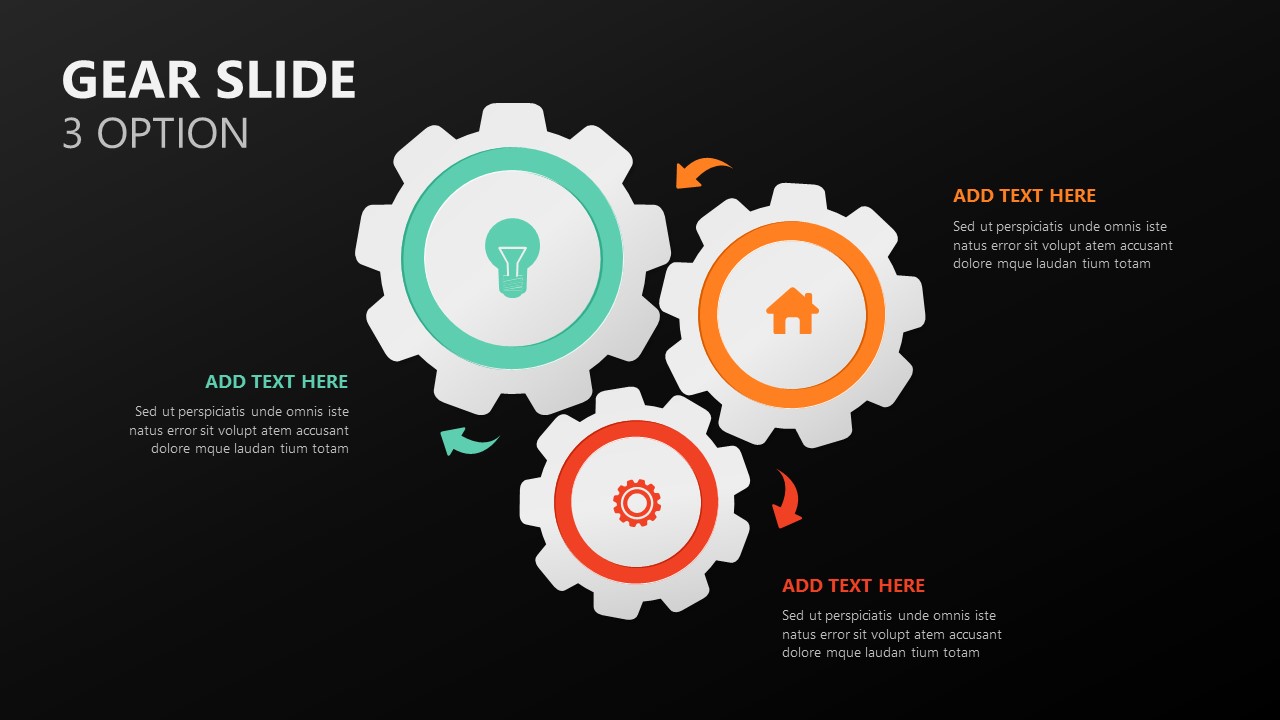
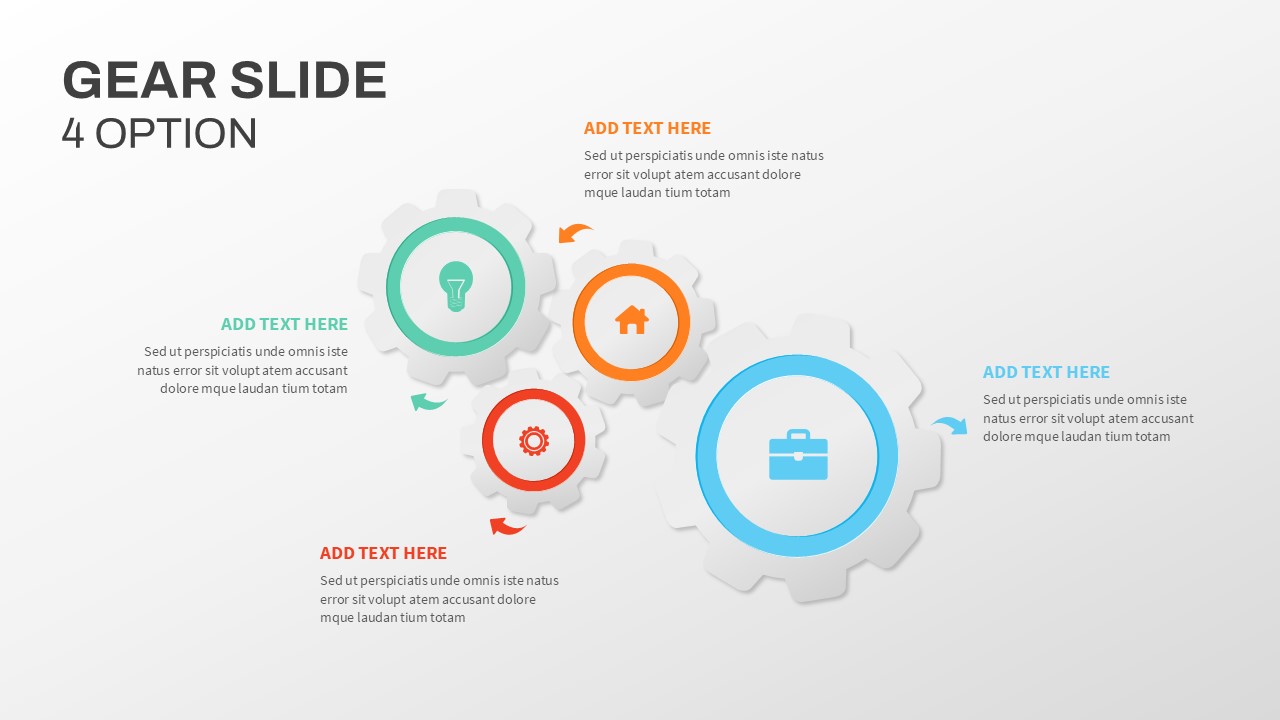
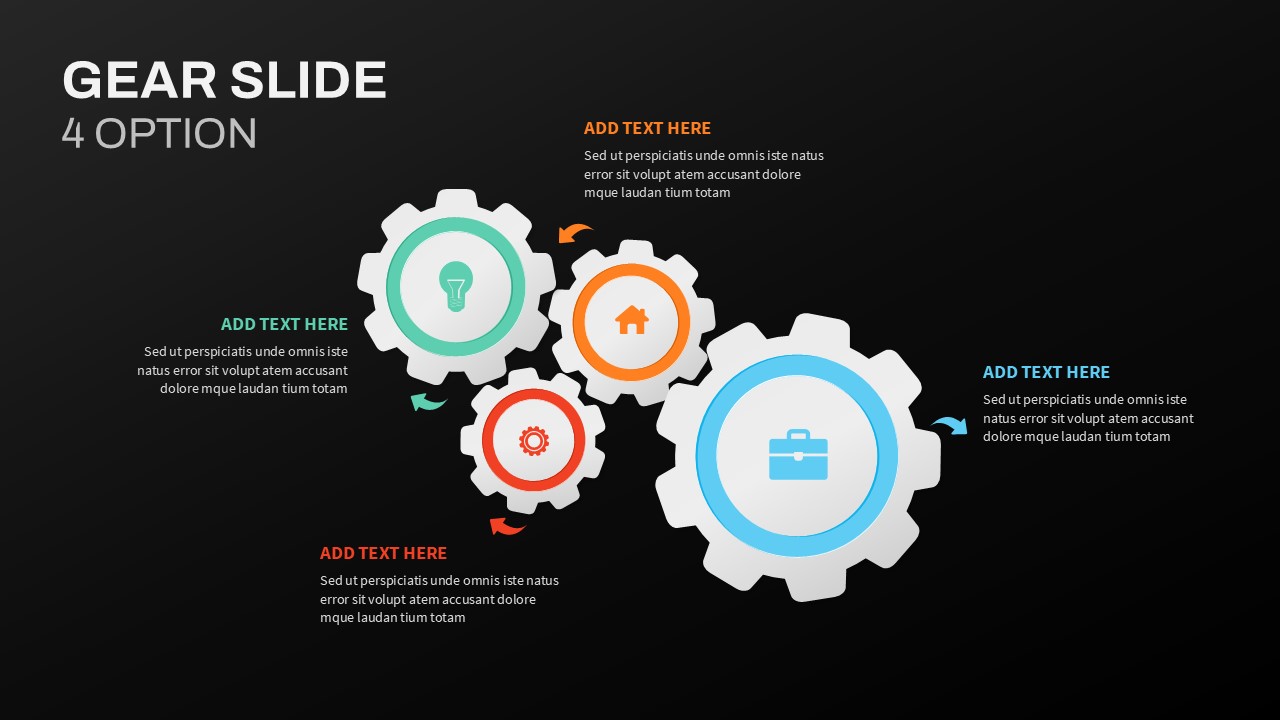
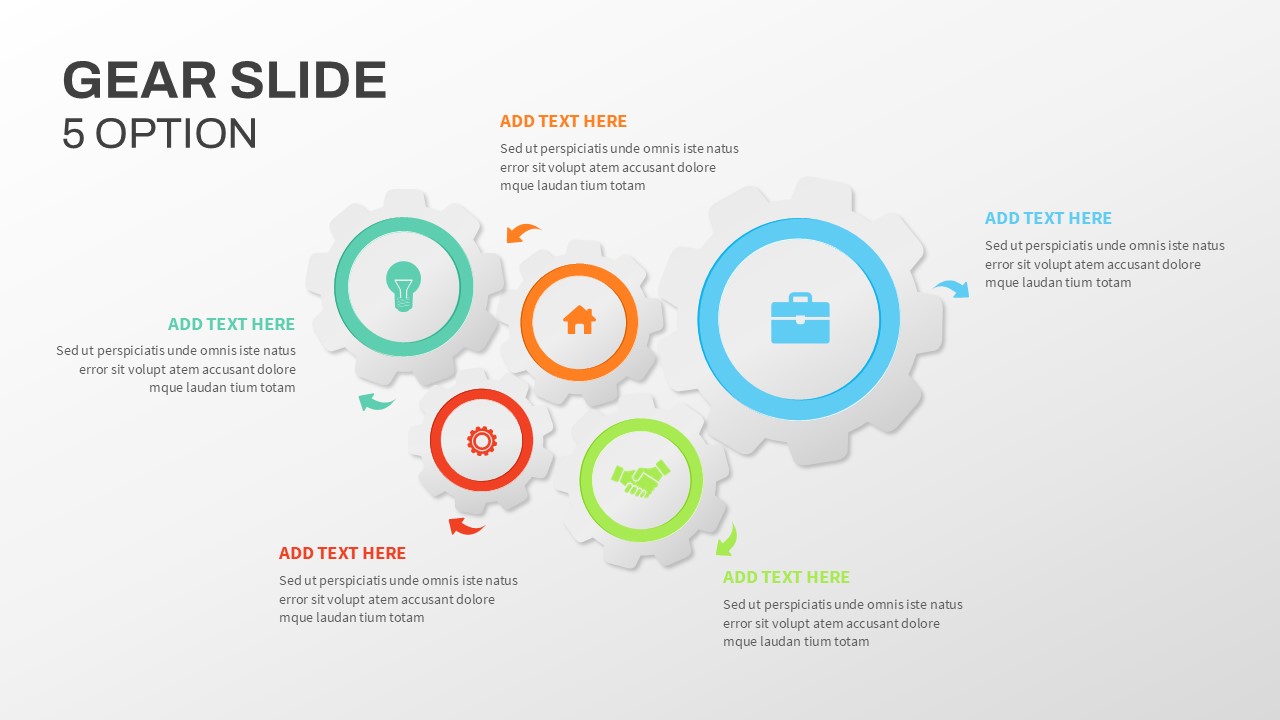
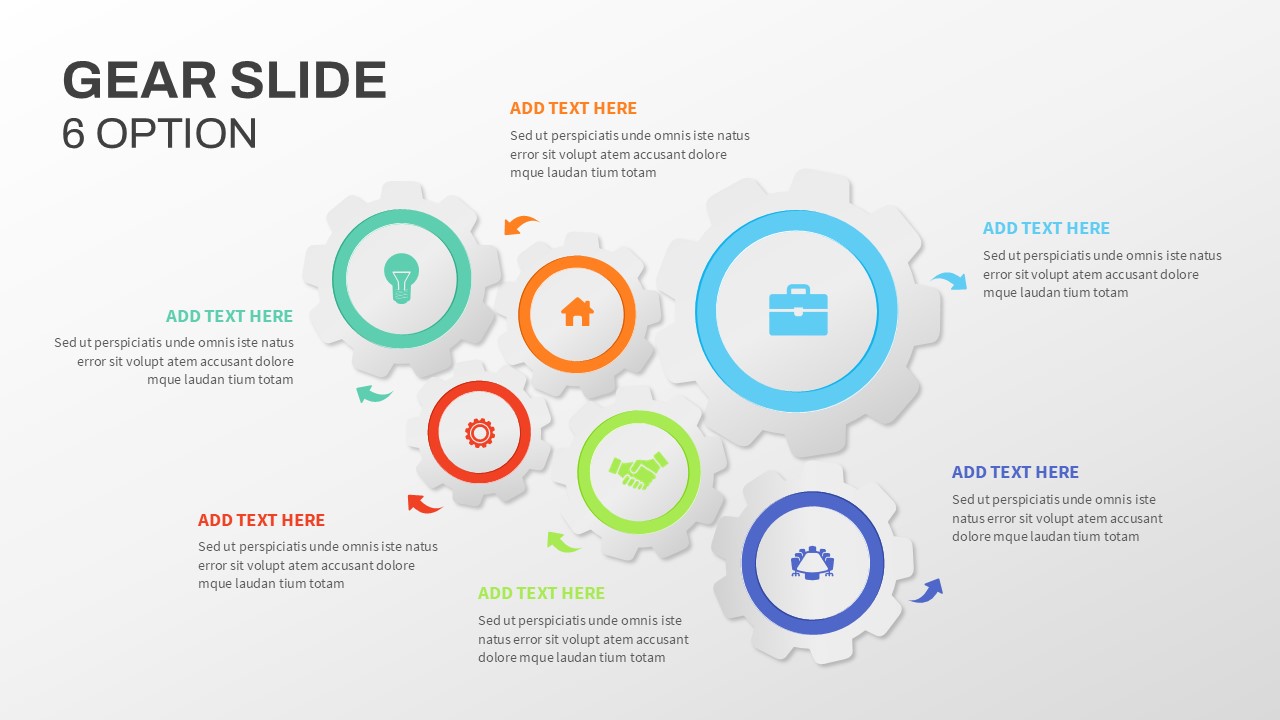
Use this dynamic infographic slide to illustrate interdependent processes or system components with precision and visual flair. The slide centers on four interlocking gear icons—designed in emerald green, vivid orange, vibrant red, and sky blue—arranged diagonally across a clean white canvas. Each gear’s vector-based construction allows for infinite scaling without pixelation, and soft drop shadows beneath each gear impart depth and realism. Color-coded circular borders around each gear match corresponding title underlines and text callouts, creating cohesive visual cues between icons and explanatory text. Adjacent to each gear, placeholder text blocks and matching colored arrow indicators guide viewers through the workflow sequence, making it easy to highlight dependencies or sequential steps. The main title area at the top offers space for a custom heading, while the optional subtitle box below can incorporate a brief introduction or key message.
Built with master slides and editable shapes, you can quickly replace gear icons with custom graphics, adjust segment sizes, swap color palettes to match brand guidelines, or modify text placeholders to include metrics, milestones, or KPIs. The slide’s subtle reflection effects and consistent styling of stroke widths ensure a polished, professional aesthetic. Compatible with both PowerPoint and Google Slides, this template maintains full-resolution clarity across devices and screen sizes, streamlining remote collaboration and eliminating formatting issues.
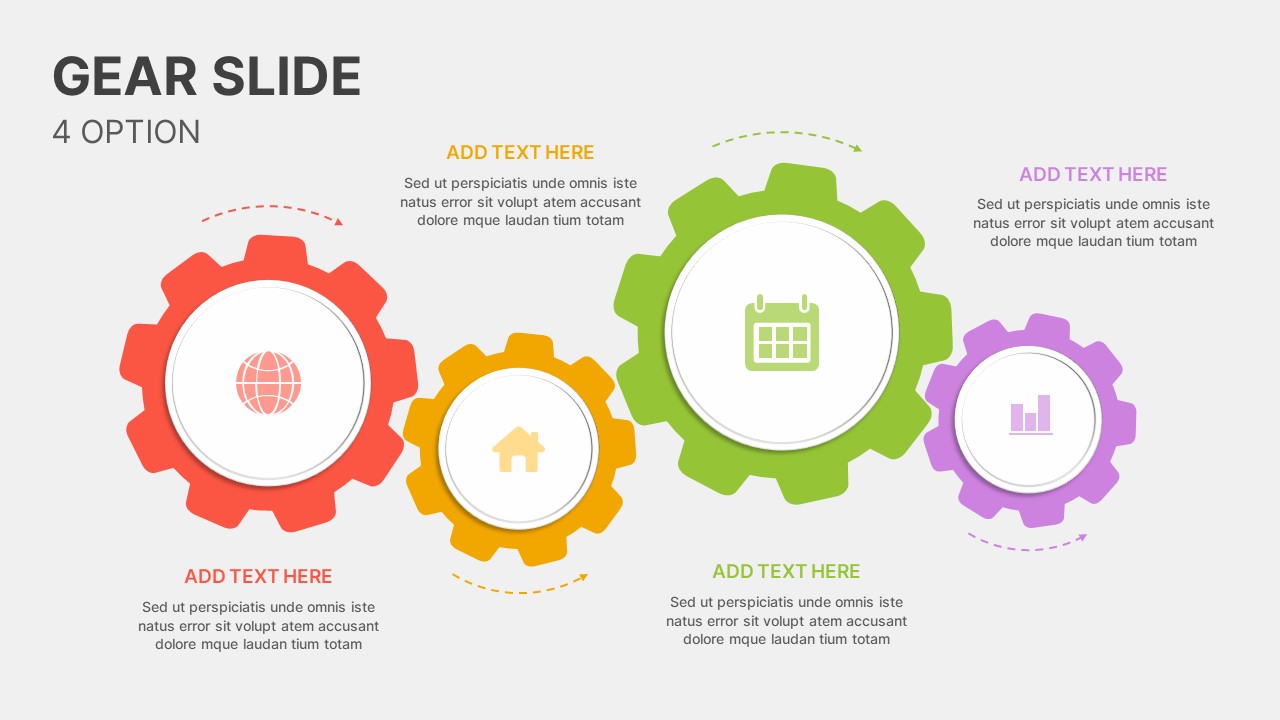
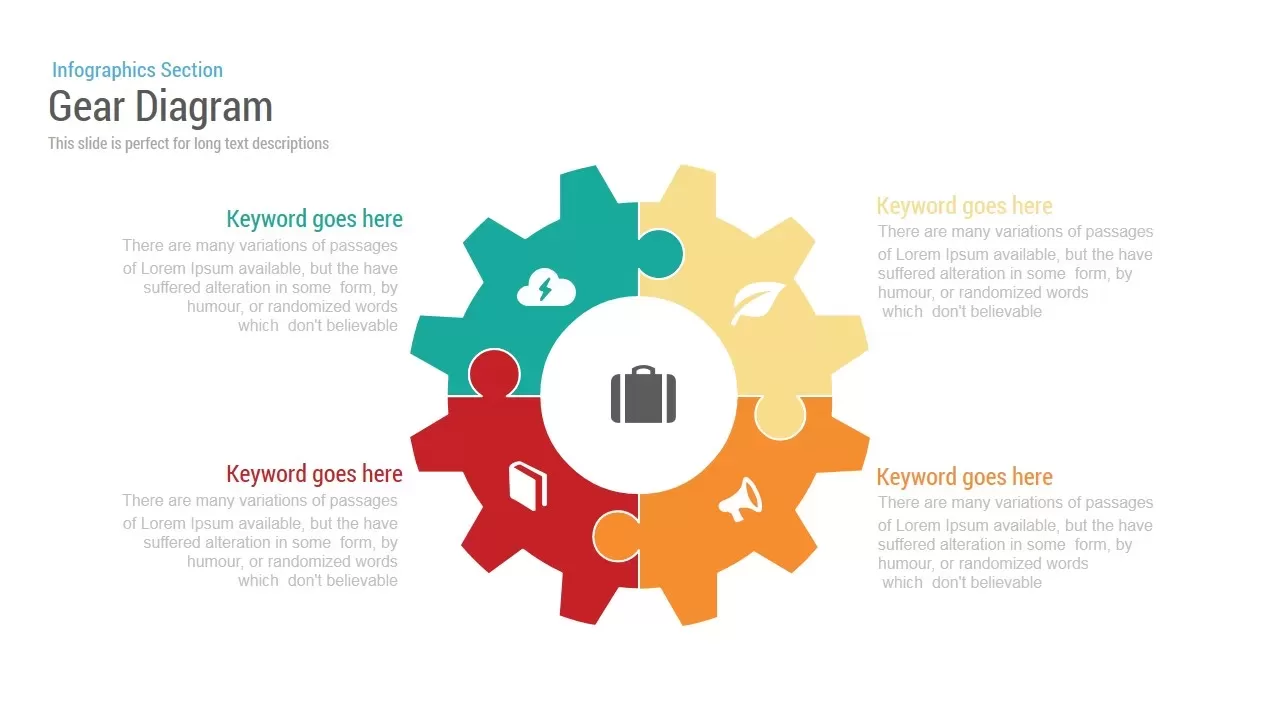
Use the slide’s grid-based layout to reposition gears into circular, linear, or hierarchical arrangements—ideal for mapping workflows, illustrating system architecture, depicting functional relationships, or presenting cross-functional team structures. Whether for operational planning, technical overviews, or strategic roadmaps, this four-gear diagram combines visual appeal and functional design to engage stakeholders and clarify complex processes with ease. Additionally, the slide adheres to accessibility guidelines by ensuring high-contrast color combinations and legible font sizes, making it suitable for diverse audiences, including color-blind viewers. For in-depth data visualization, the gears can link to on-slide charts or KPI dashboards, creating an integrated single-slide performance summary. Designers can also expand the diagram with additional nodes or connector lines while maintaining alignment guides and snapping features, empowering presenters to focus on content rather than formatting.
Who is it for
Operations managers, engineers, and project leaders will leverage this gear diagram to map processes, depict system components, or showcase cross-functional workflows. It’s perfect for stakeholder briefings, internal training sessions, and C-level presentations where clarity and professionalism are paramount.
Other Uses
Beyond process mapping, repurpose this slide for risk factor alignment, departmental overviews, resource allocation breakdowns, vendor ecosystems, or technology stacks. Simply relabel gears and adjust their arrangement to support any four-part framework or interconnected concept.
Login to download this file

Item ID
SB03284
Related Templates

Gear Process Diagram PowerPoint Template for PowerPoint & Google Slides
Process
Gear Process Diagram template for PowerPoint & Google Slides
Process
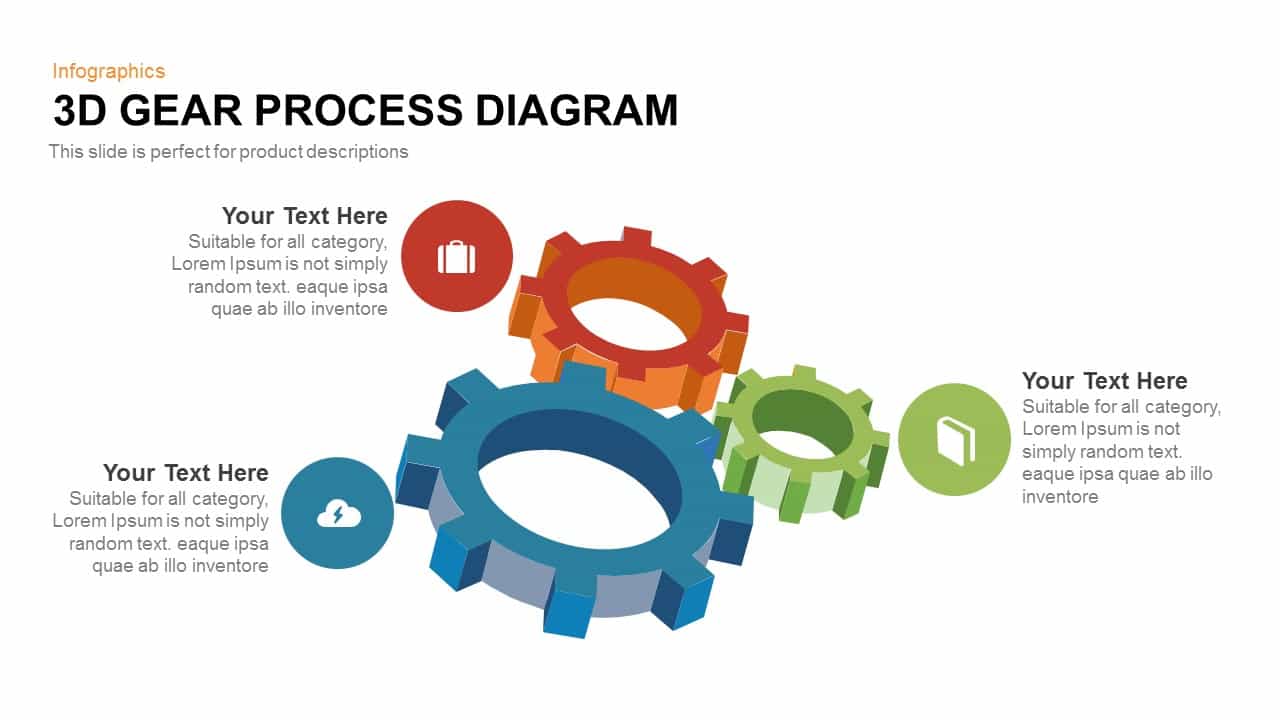
Professional 3D Gear Process Diagram Template for PowerPoint & Google Slides
Process
Gear Process Phase Diagram template for PowerPoint & Google Slides
Process

Five-Step Gear Process Diagram Template for PowerPoint & Google Slides
Process

Dynamic 4 Gear Process Diagram Template for PowerPoint & Google Slides
Process
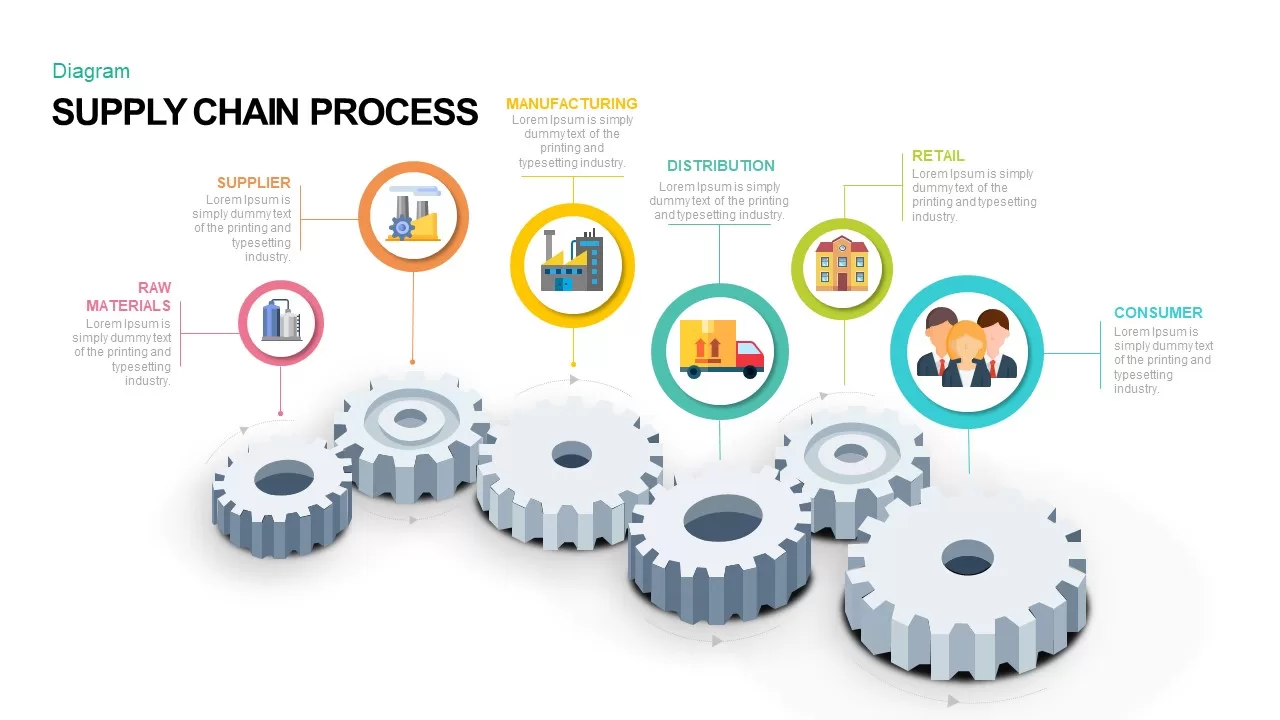
Supply Chain Process Gear Diagram Template for PowerPoint & Google Slides
Process
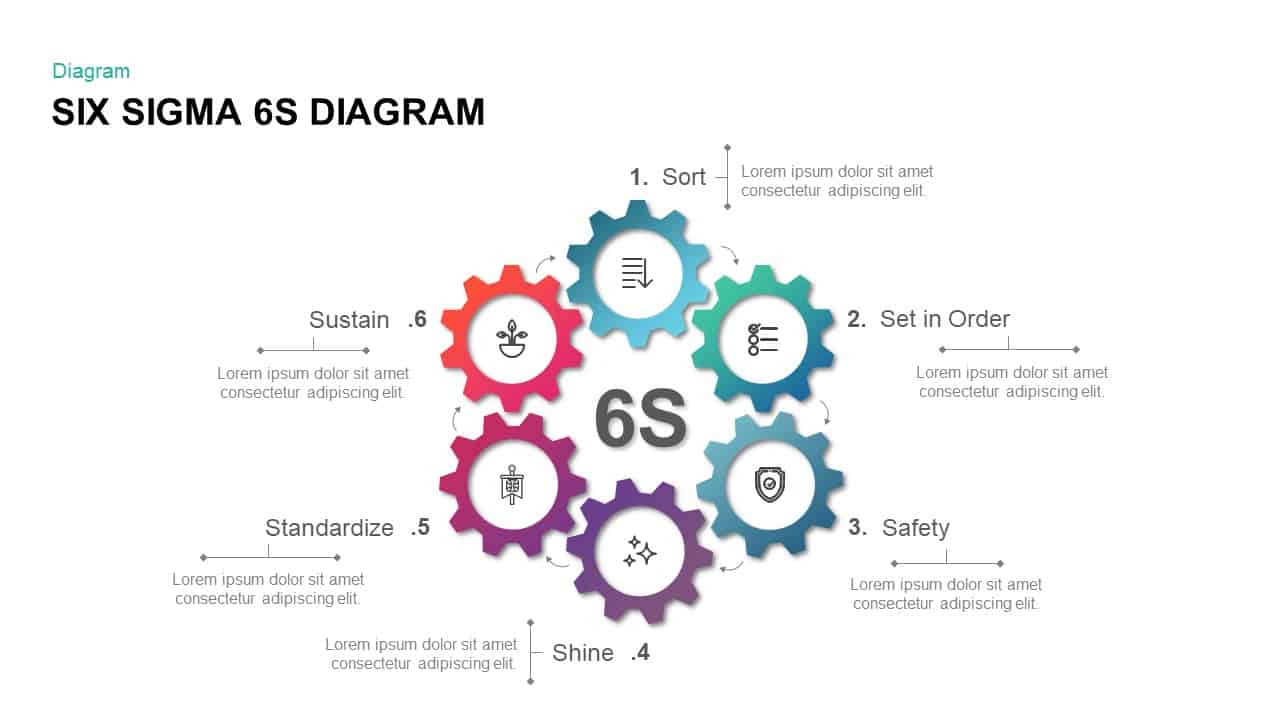
Six Sigma Gear Process Diagram Template for PowerPoint & Google Slides
Process
Four-Stage Gear Process Diagram Template for PowerPoint & Google Slides
Process
5-Stage Gear Process Flow Diagram Template for PowerPoint & Google Slides
Process
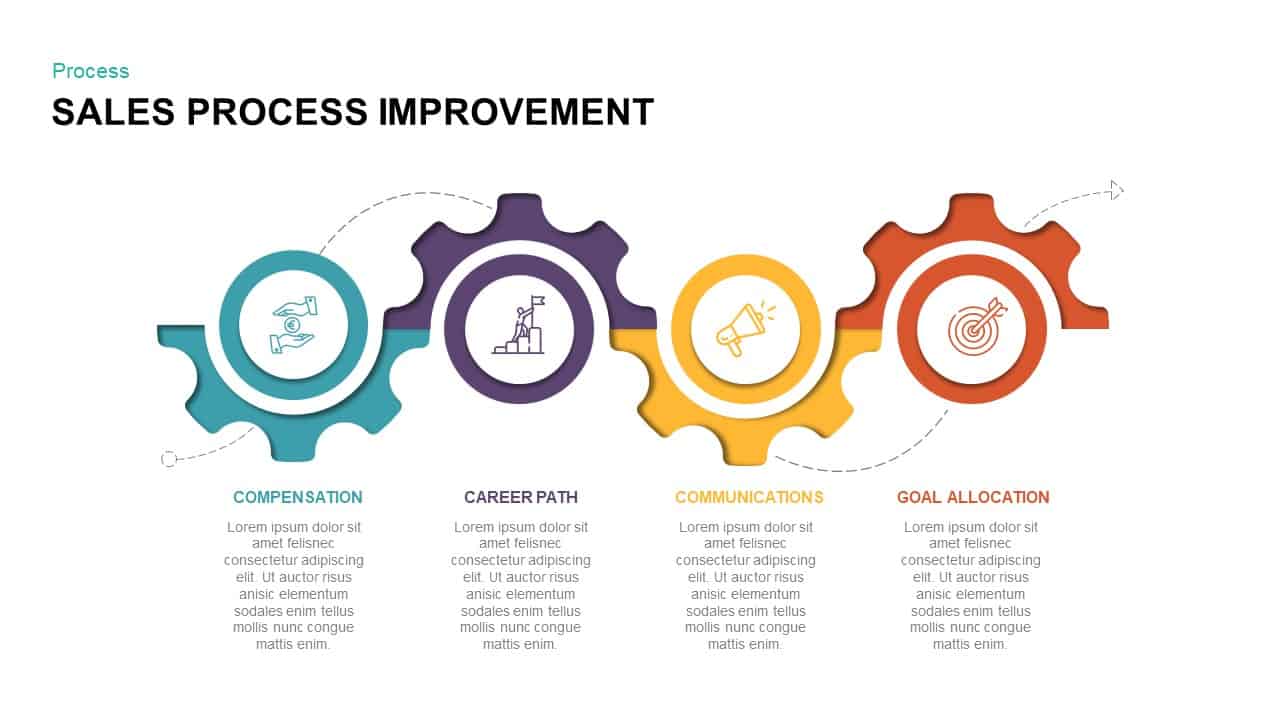
Sales Process Improvement Gear Diagram Template for PowerPoint & Google Slides
Process
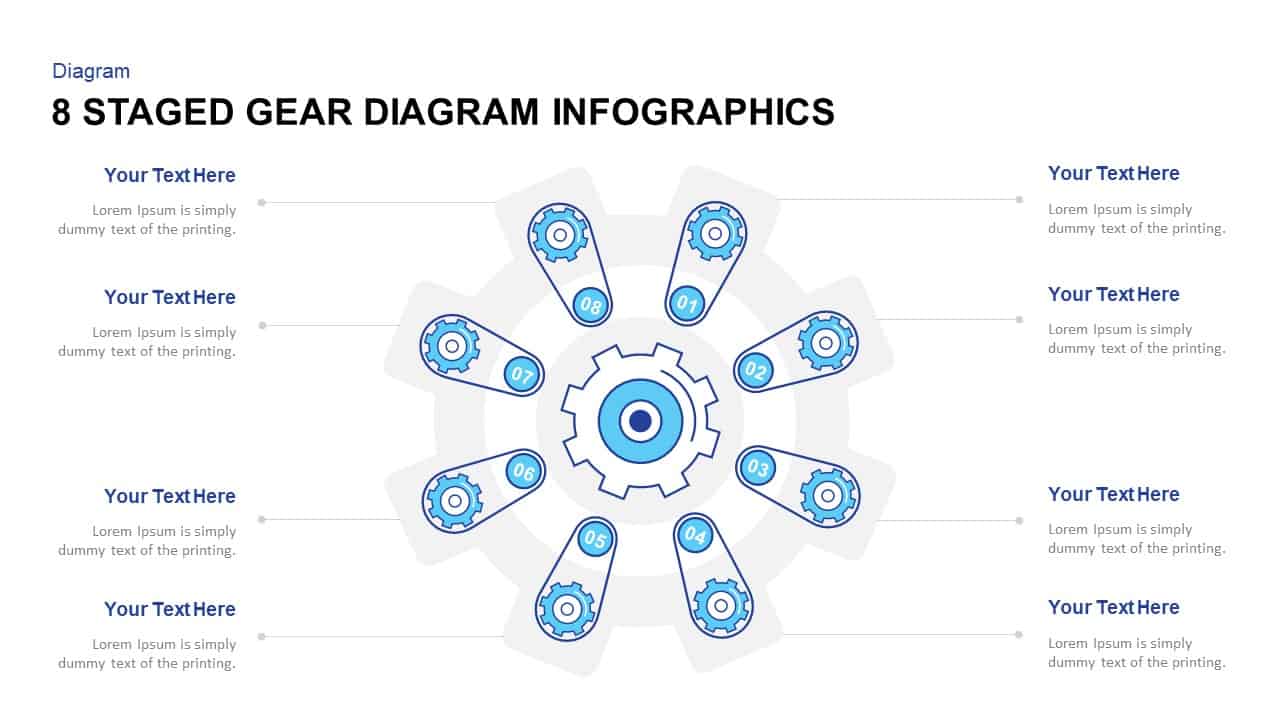
Eight-Stage Gear Diagram Process Template for PowerPoint & Google Slides
Process
Gear Process Diagram Template for PowerPoint & Google Slides
Process
Gear Process Diagram for PowerPoint & Google Slides
Process
Process Gear Shapes Template for PowerPoint & Google Slides
Infographics
Animated Gear Slide for Process Mapping Template for PowerPoint & Google Slides
Process
Dynamic Four-Step Gear Process Template for PowerPoint & Google Slides
Process
Gear Diagram template for PowerPoint & Google Slides
Process
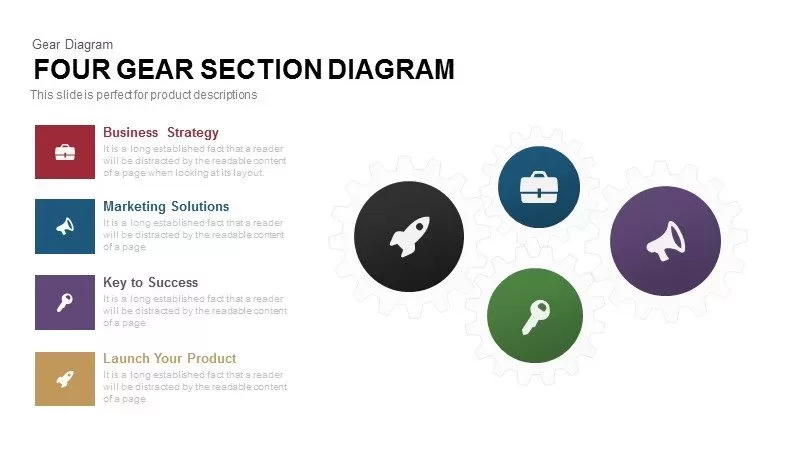
Four Gear Section Diagram Template for PowerPoint & Google Slides
Circular

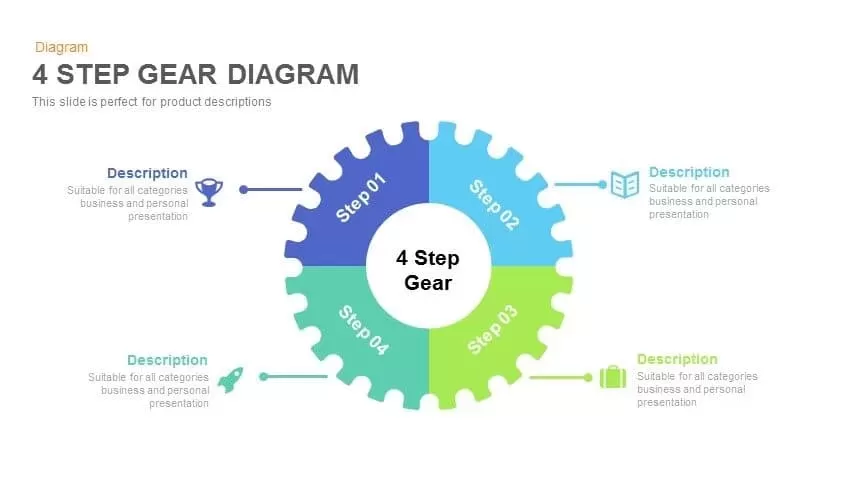
4 Step Gear Diagram Template for PowerPoint & Google Slides
Process
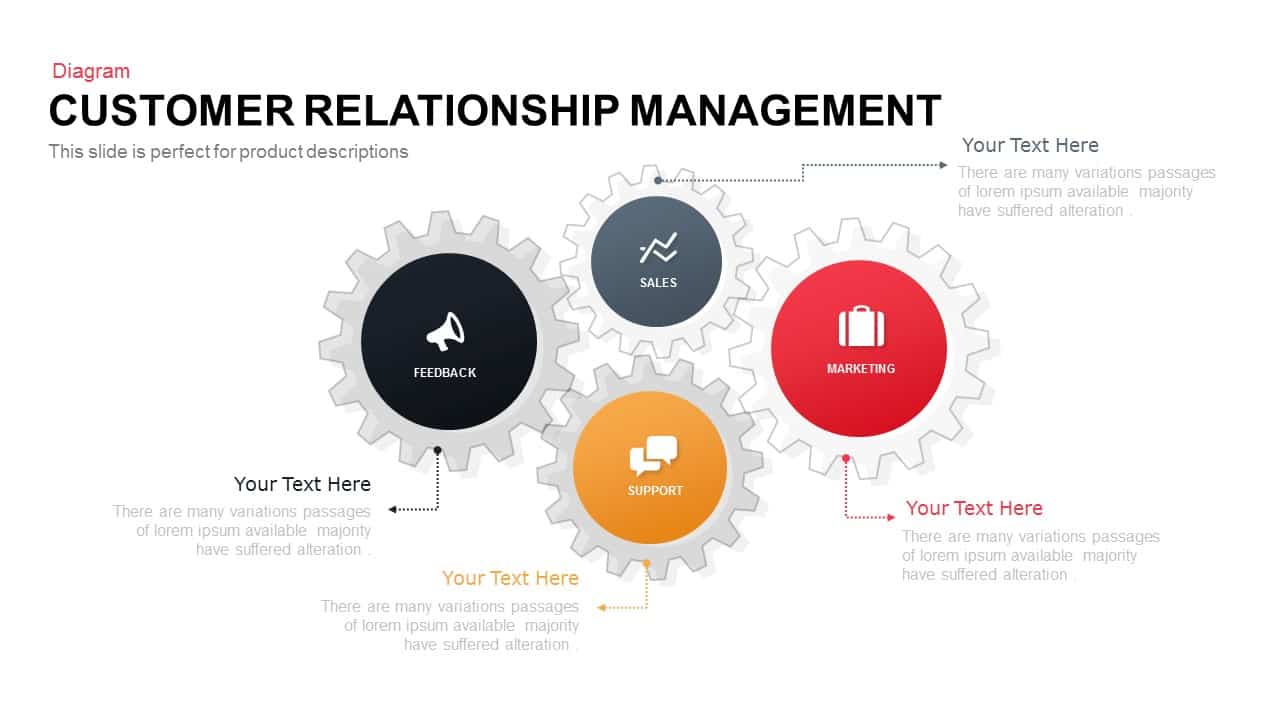
Colorful Modern CRM Gear Diagram Template for PowerPoint & Google Slides
Customer Experience
Gear Pie Diagram Data Visualization Template for PowerPoint & Google Slides
Pie/Donut
Six-Staged Gear Diagram Framework Template for PowerPoint & Google Slides
Process
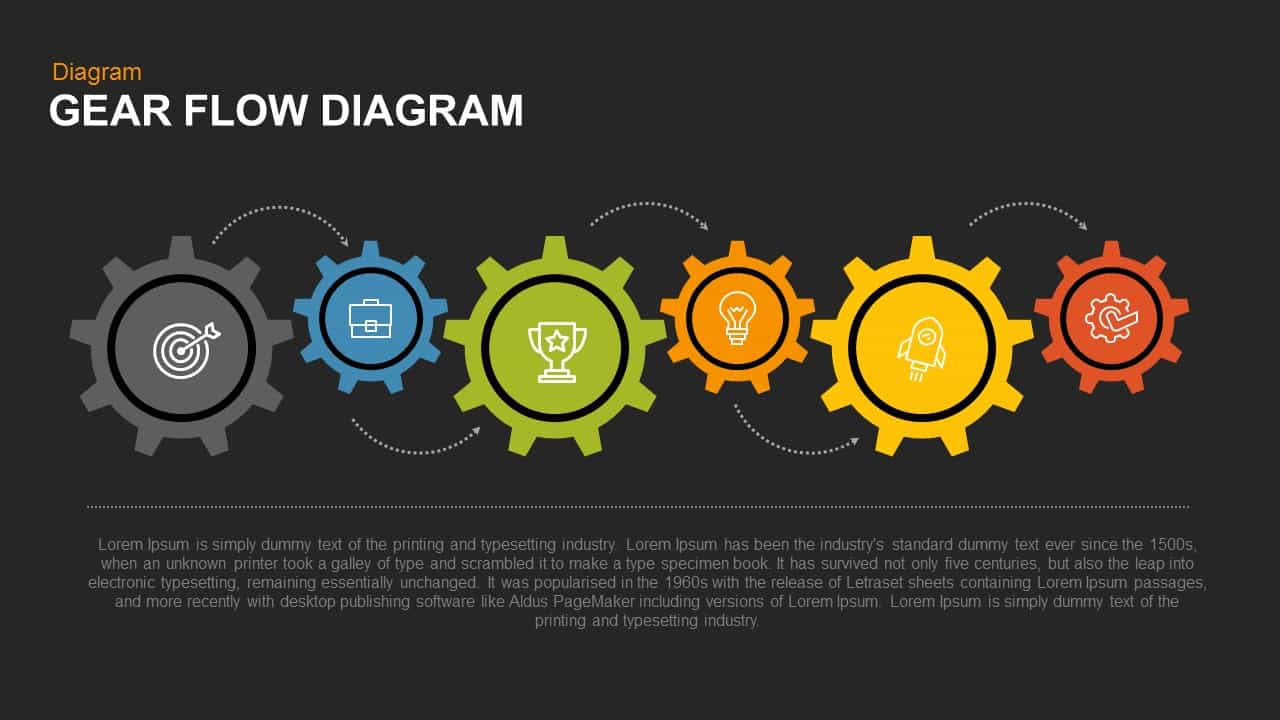
Gear Flow Diagram template for PowerPoint & Google Slides
Process

Modern Four Stage Gear Diagram Template for PowerPoint & Google Slides
Process
Artificial Intelligence Gear Diagram Template for PowerPoint & Google Slides
Process
Marketing Risk Management Gear Diagram Template for PowerPoint & Google Slides
Risk Management
SWOT Analysis Gear Diagram Slide Template for PowerPoint & Google Slides
SWOT
Six-Stage Gear Wheel Diagram Template for PowerPoint & Google Slides
Circular
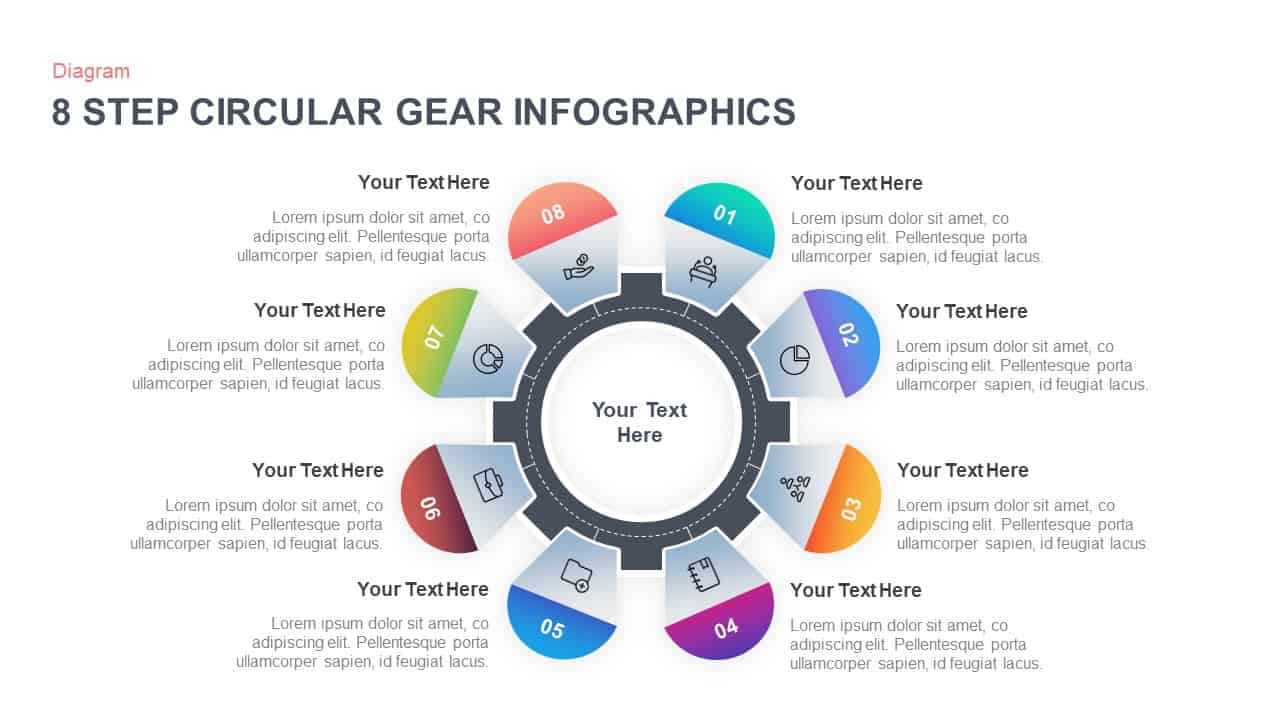
8-Step Circular Gear Infographic Diagram Template for PowerPoint & Google Slides
Circular
Modern Gear Venn Diagram Infographic Template for PowerPoint & Google Slides
Comparison
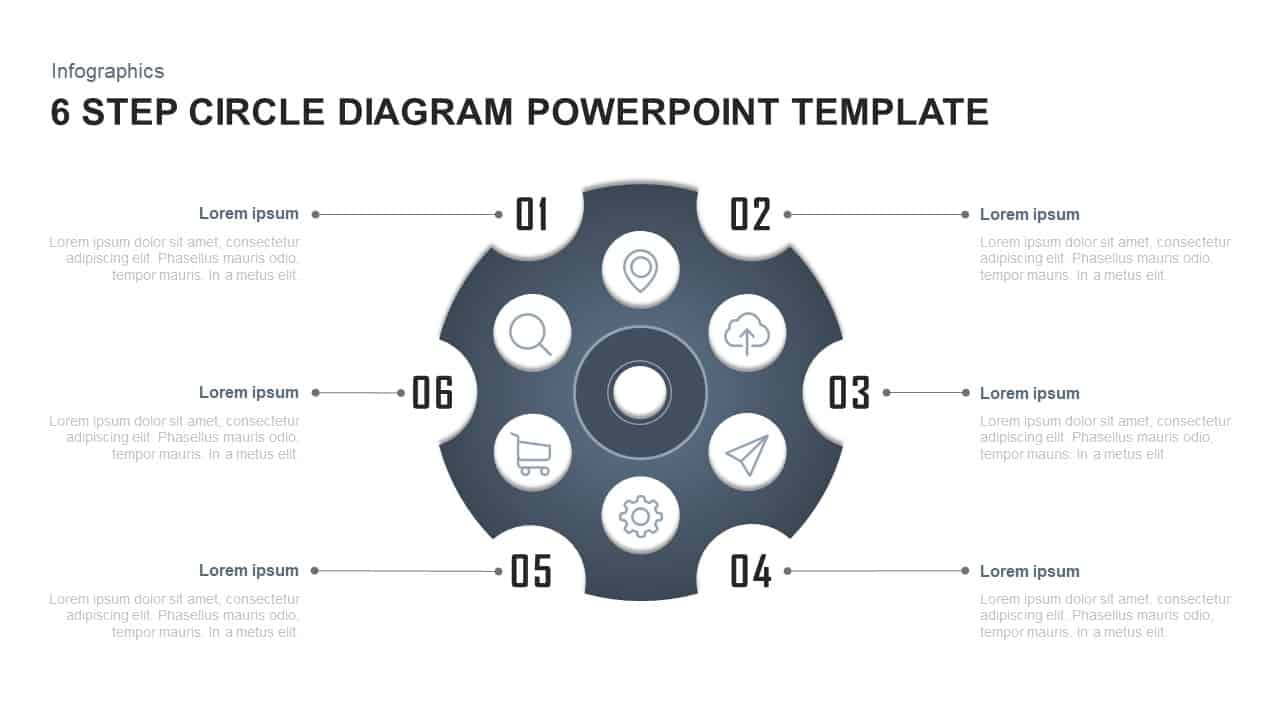
6-Part Circular Gear Infographic Diagram Template for PowerPoint & Google Slides
Process

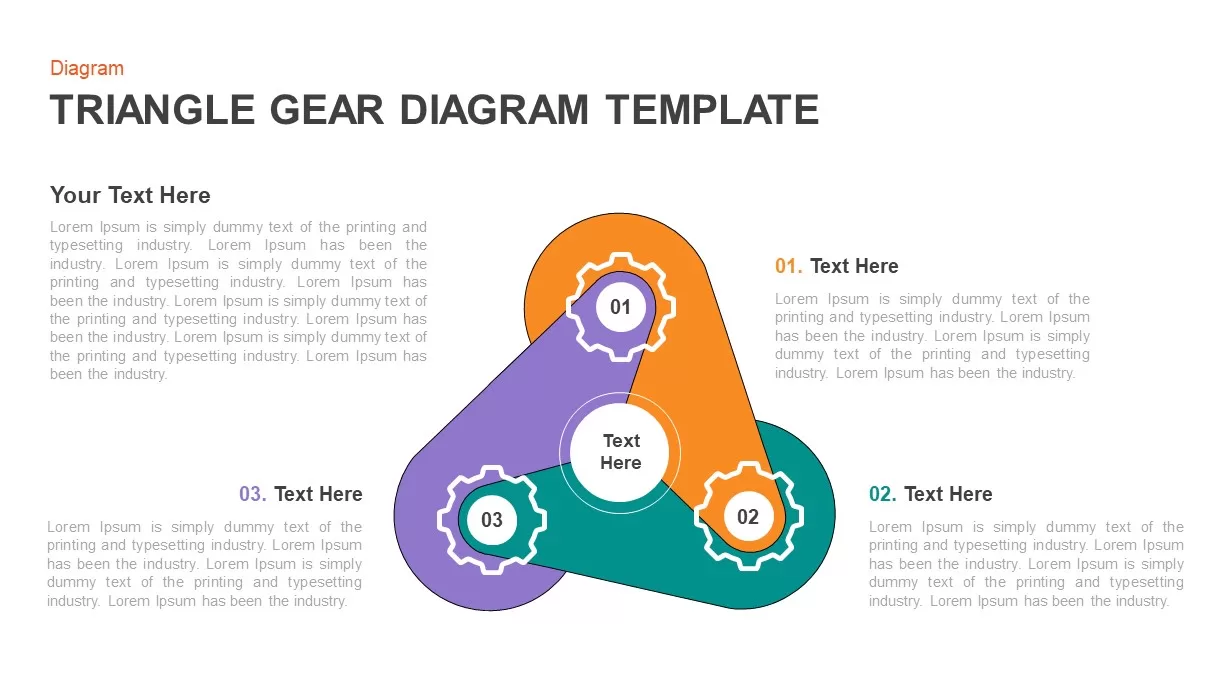
Three-Step Triangular Gear Diagram Template for PowerPoint & Google Slides
Process
Dynamic Gear Diagram Infographics Template for PowerPoint & Google Slides
Process
Six-Option Gear Diagram Slide Template for PowerPoint & Google Slides
Circular
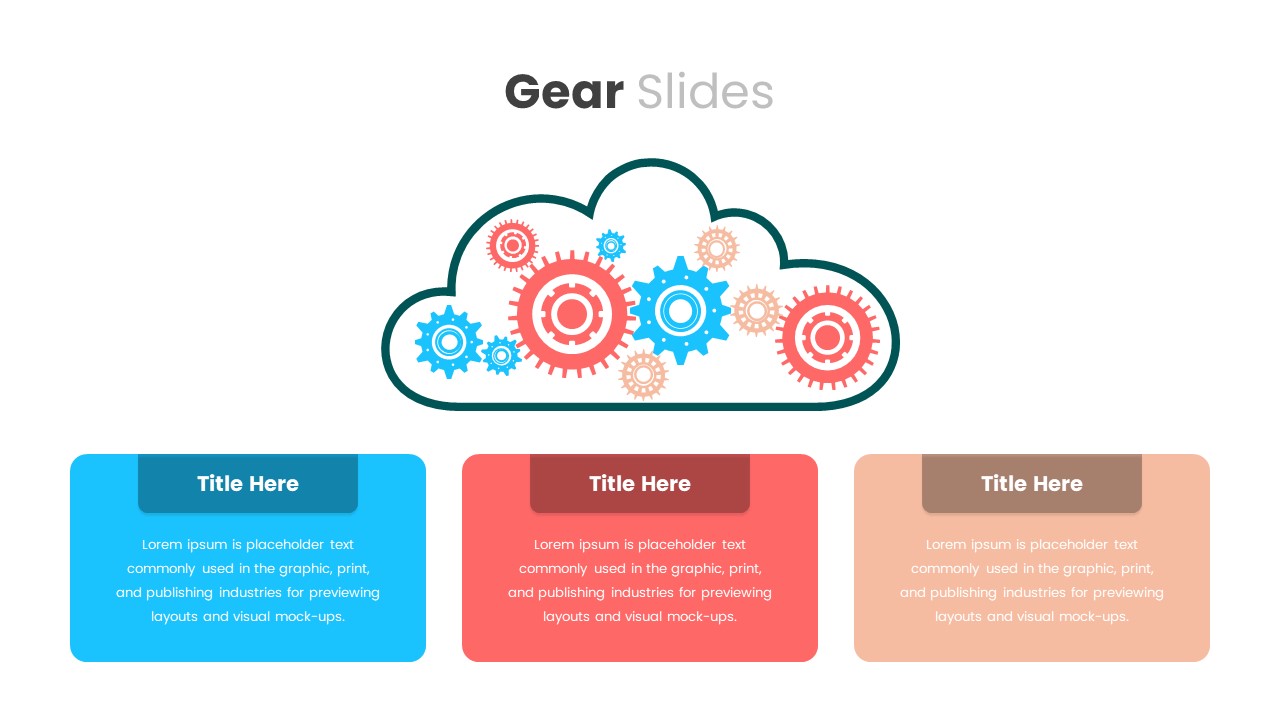
Cloud Gear Automation Diagram Template for PowerPoint & Google Slides
Cloud Computing
8-Step Circular Gear Infographics Diagram for PowerPoint & Google Slides
Process
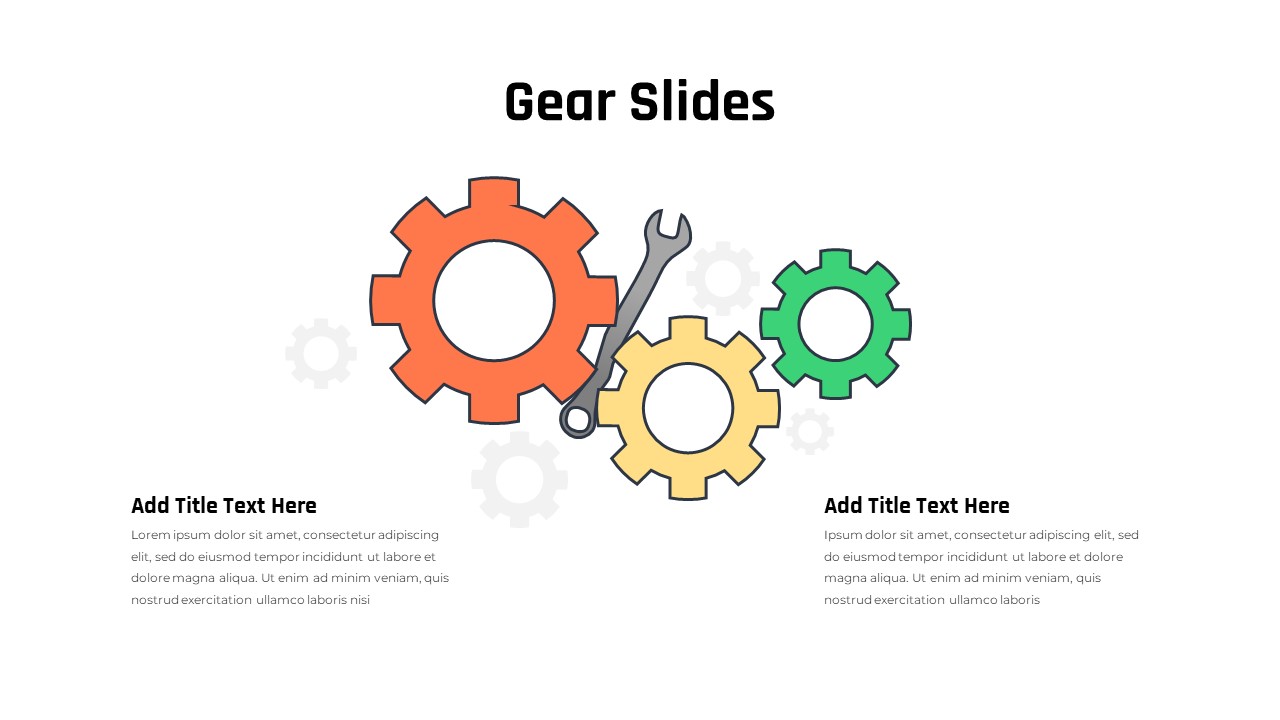
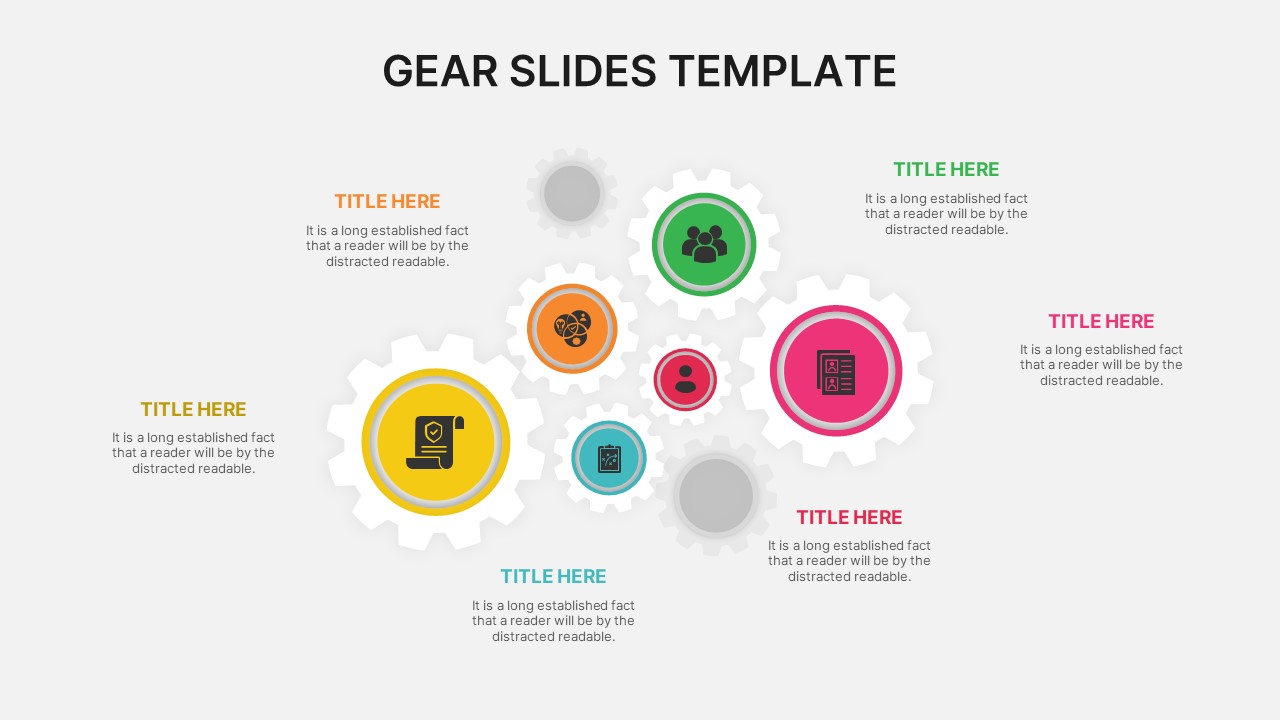
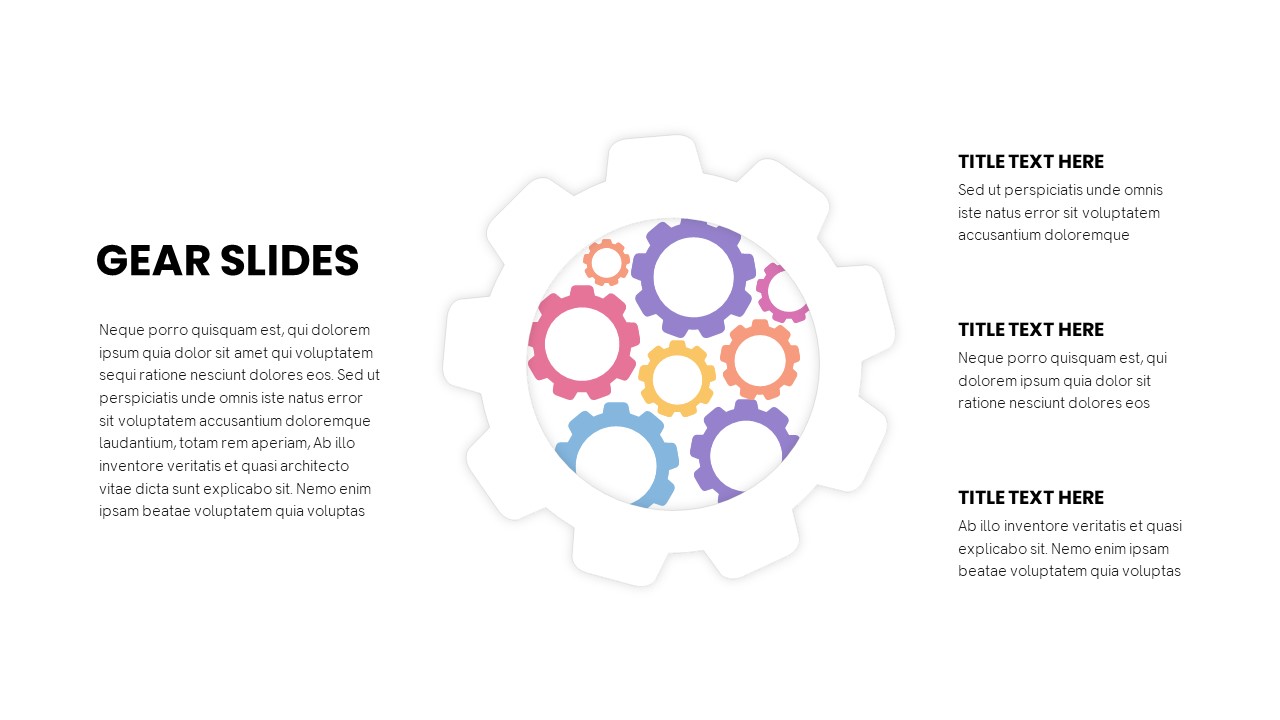
Gear Slides for PowerPoint & Google Slides
Infographics
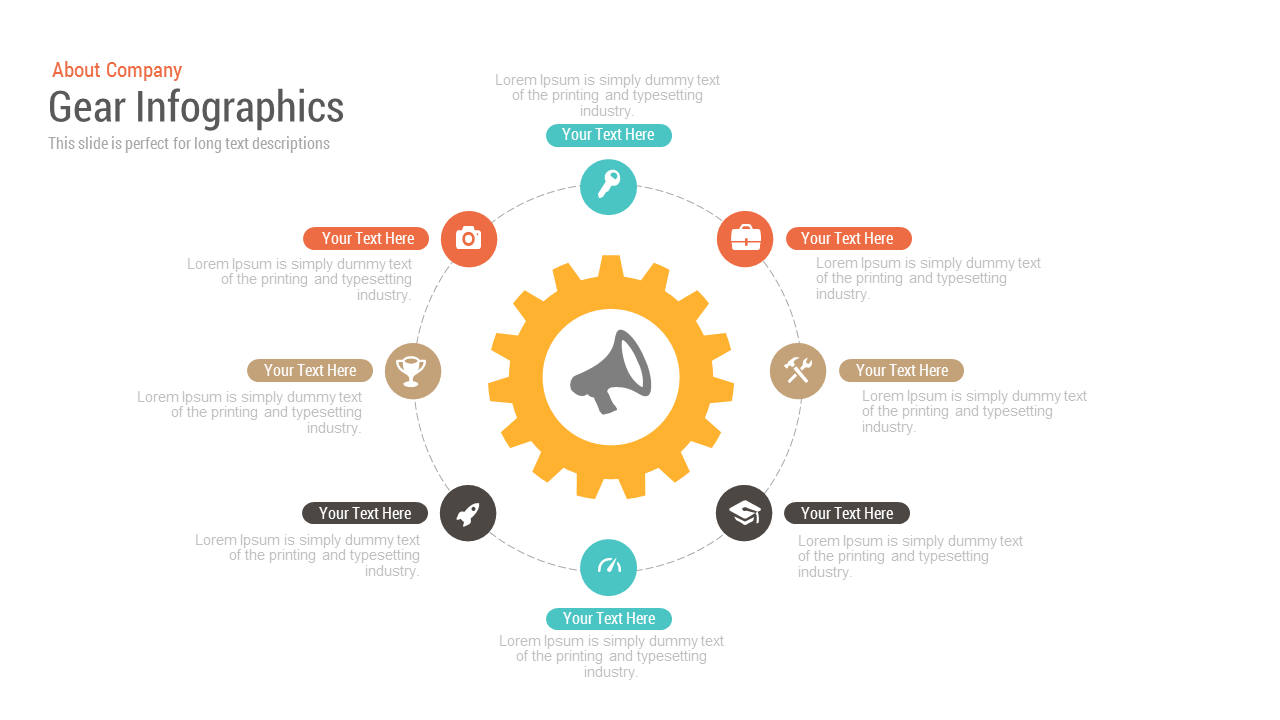
Free Gear Infographics template for PowerPoint & Google Slides
Process
Free
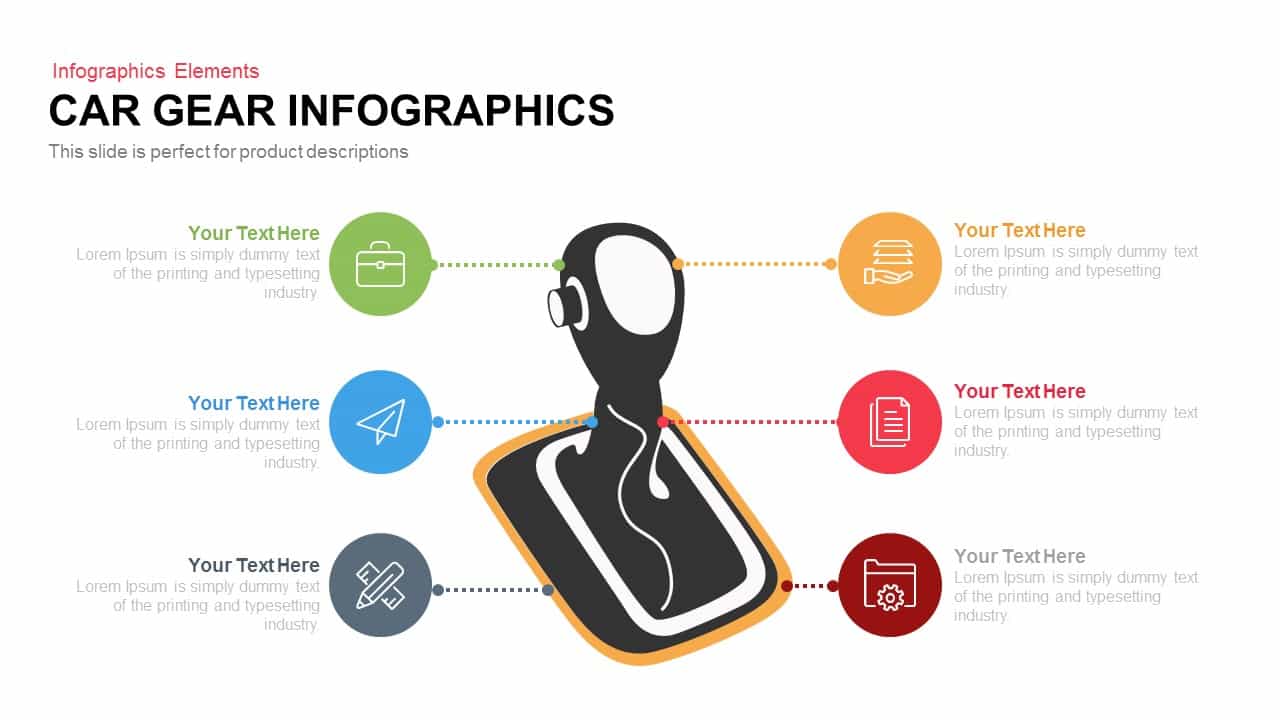
Car Gear Infographics Template for PowerPoint & Google Slides
Infographics
Brain Gear Hub-and-Spoke Infographics template for PowerPoint & Google Slides
Org Chart

Strategy Arrow and Gear Icons Template for PowerPoint & Google Slides
Infographics
Support Services Gear Infographic Template for PowerPoint & Google Slides
Business
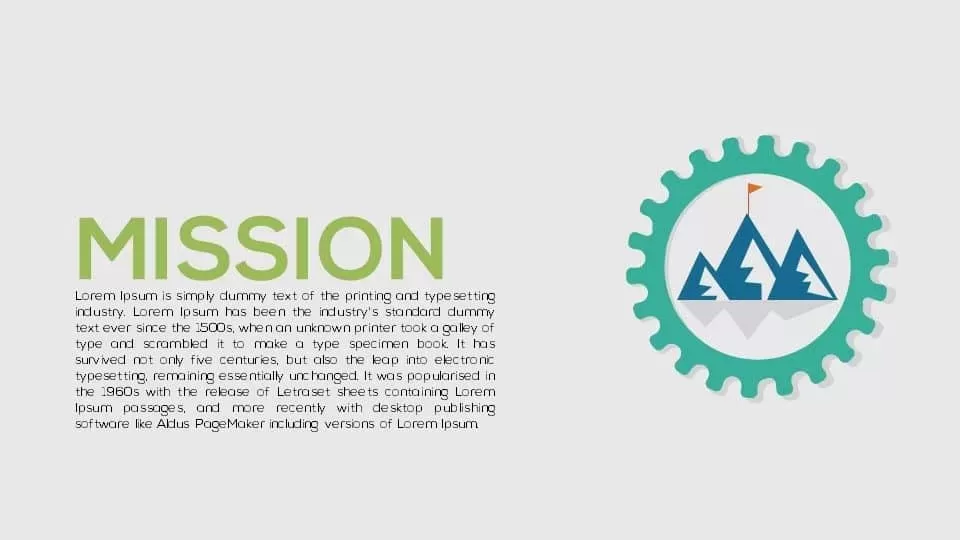
Corporate Mission Statement Gear Slide Template for PowerPoint & Google Slides
Vision and Mission
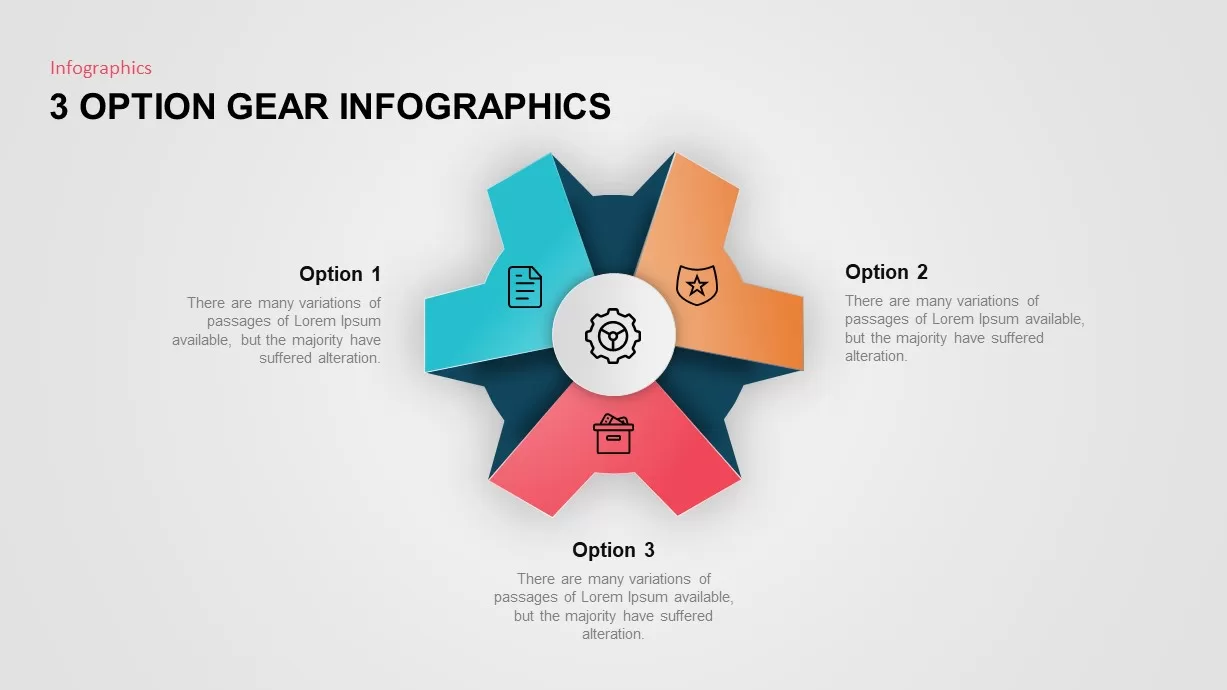
Three-Option Gear Infographic Pro Template for PowerPoint & Google Slides
Process
Three-Phase Planning Gear Infographic Template for PowerPoint & Google Slides
Process
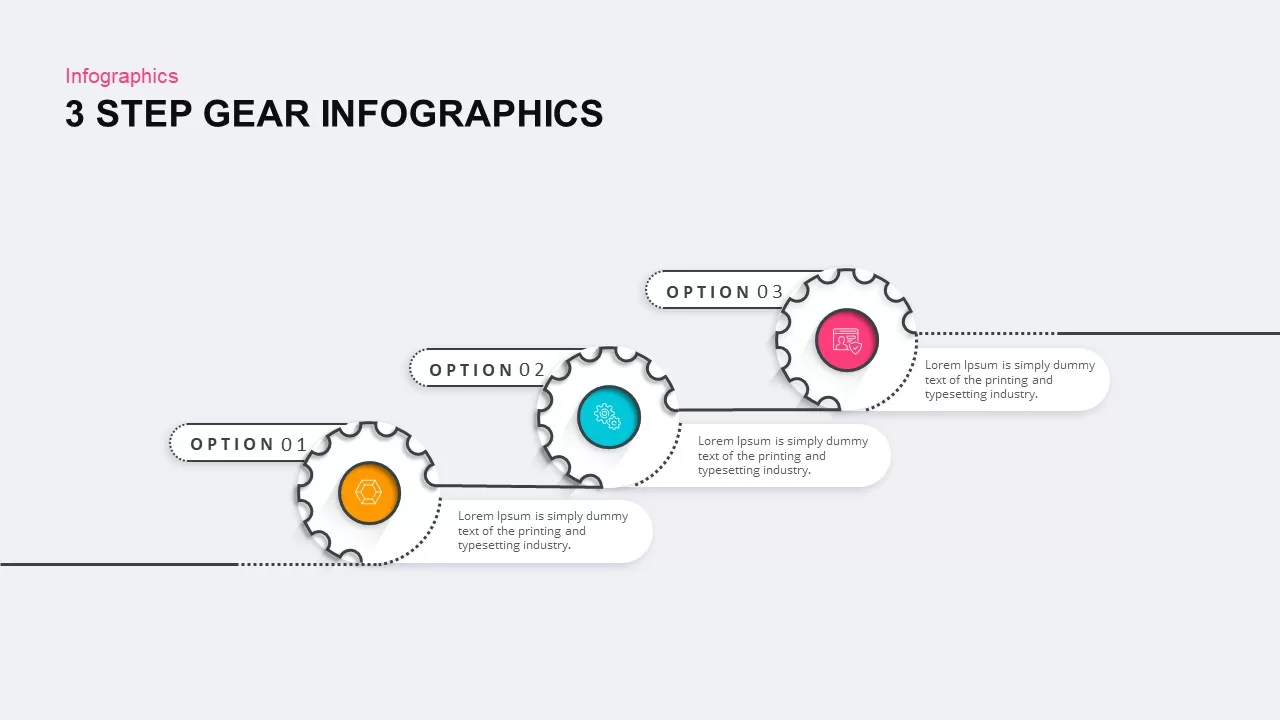
3, 4, and 5 Step Gear Infographics Template for PowerPoint & Google Slides
Process
Animated Multi-Gear Cluster Infographic Template for PowerPoint & Google Slides
Process
Six Colorful Gear Shapes Infographic Template for PowerPoint & Google Slides
Process
Free
Sales Process Workflow Funnel Diagram PowerPoint Template for PowerPoint & Google Slides
Funnel
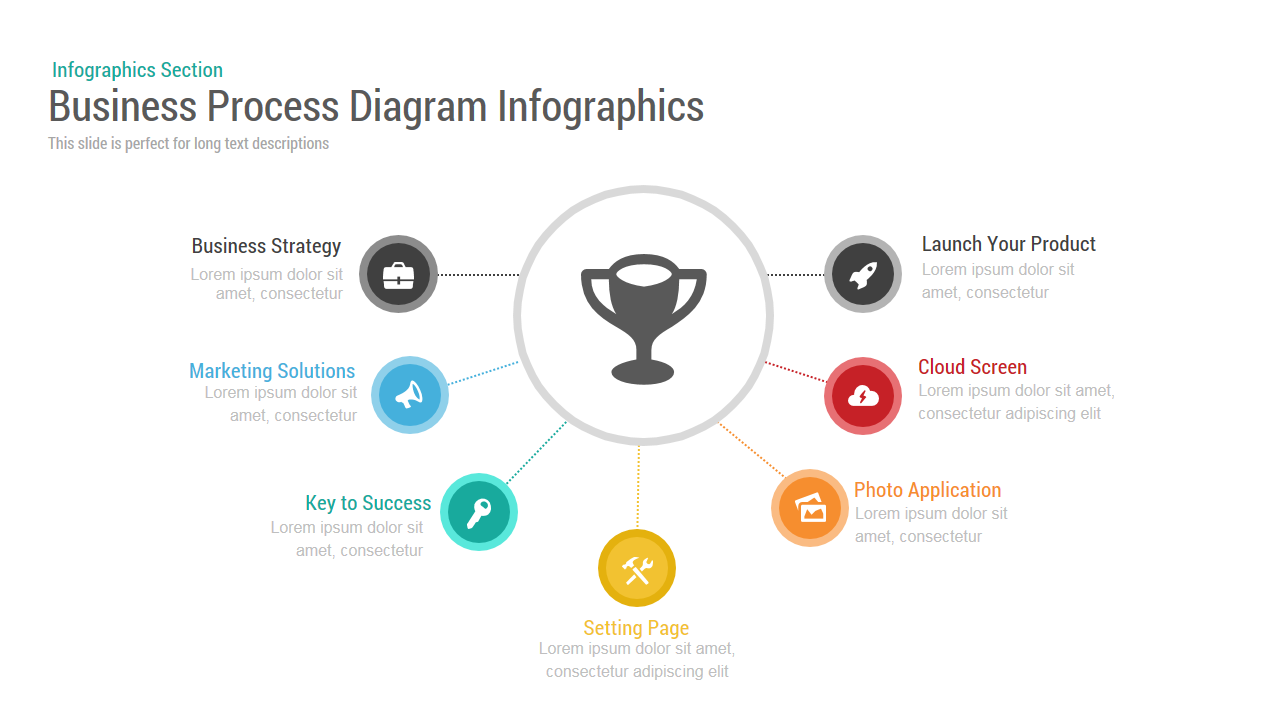
Business Process Diagram template for PowerPoint & Google Slides
Process
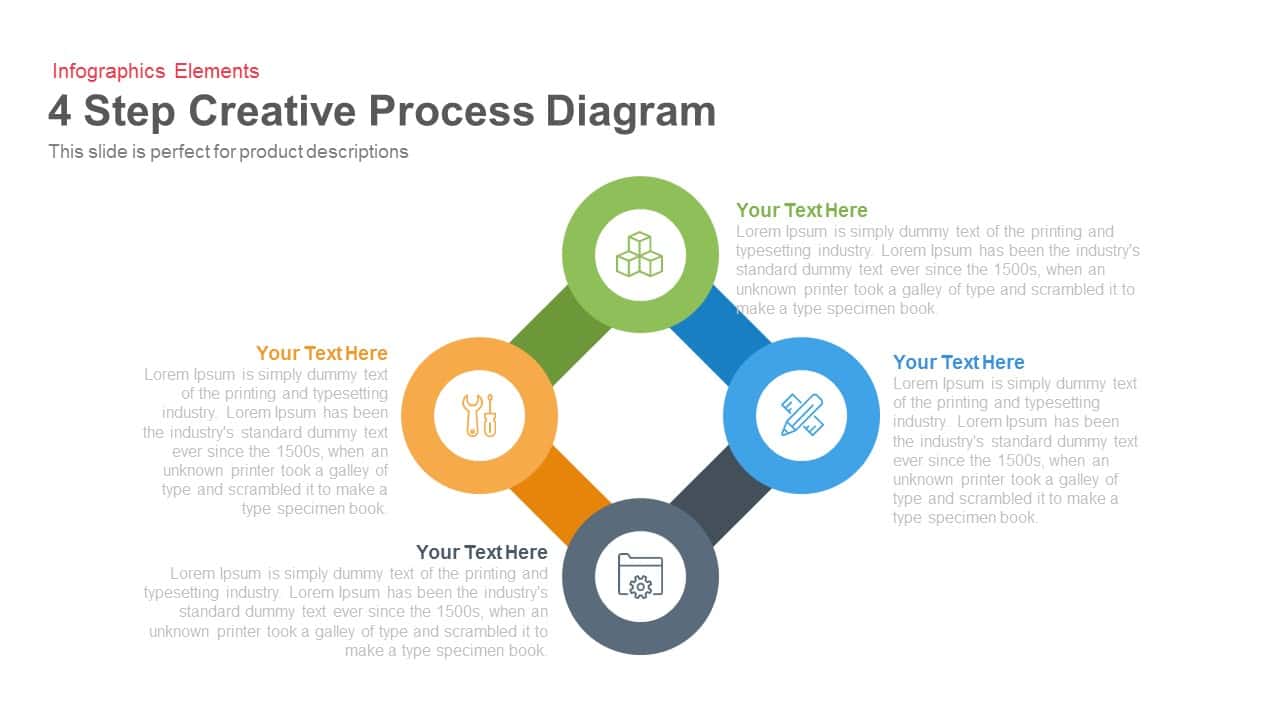
4 Step Creative Process Diagram Template for PowerPoint & Google Slides
Infographics
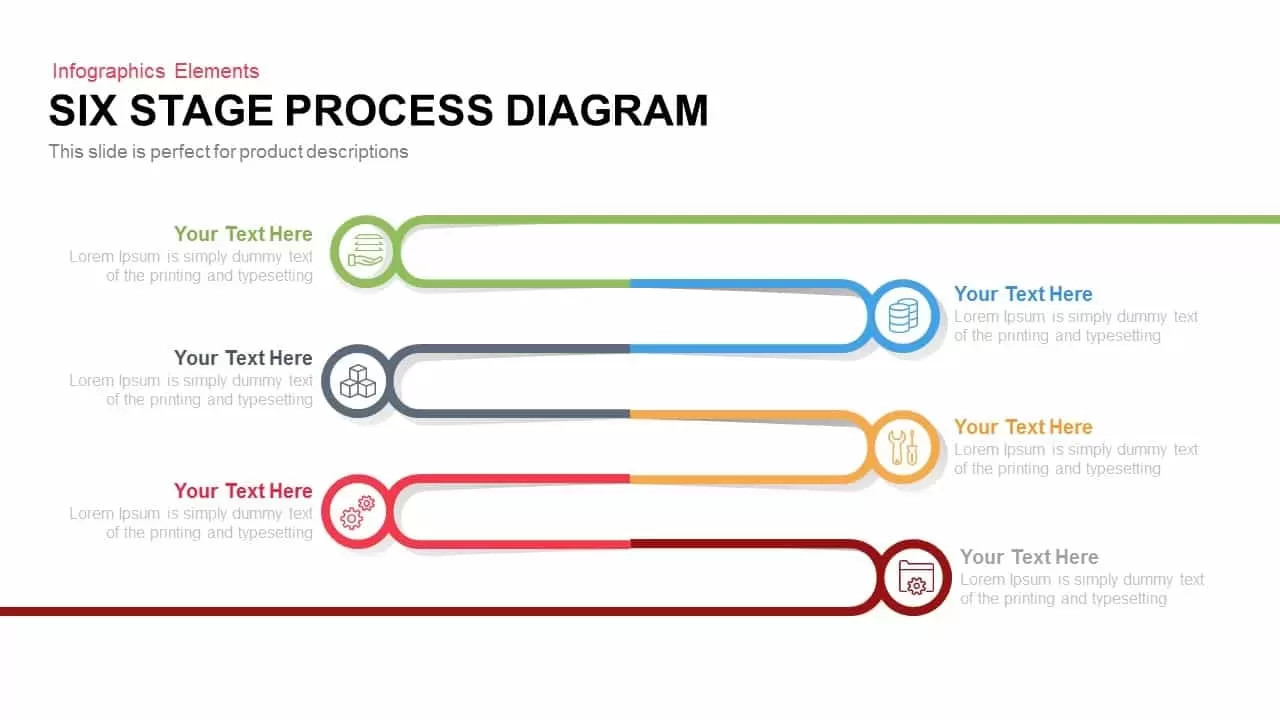
6 Stage Process Diagram Infographic Template for PowerPoint & Google Slides
Process
4 Section Pipe Diagram Process Flow Template for PowerPoint & Google Slides
Process
Dynamic Shield Process Flow Diagram template for PowerPoint & Google Slides
Process
Six Arrow Radial Process Diagram template for PowerPoint & Google Slides
Infographics
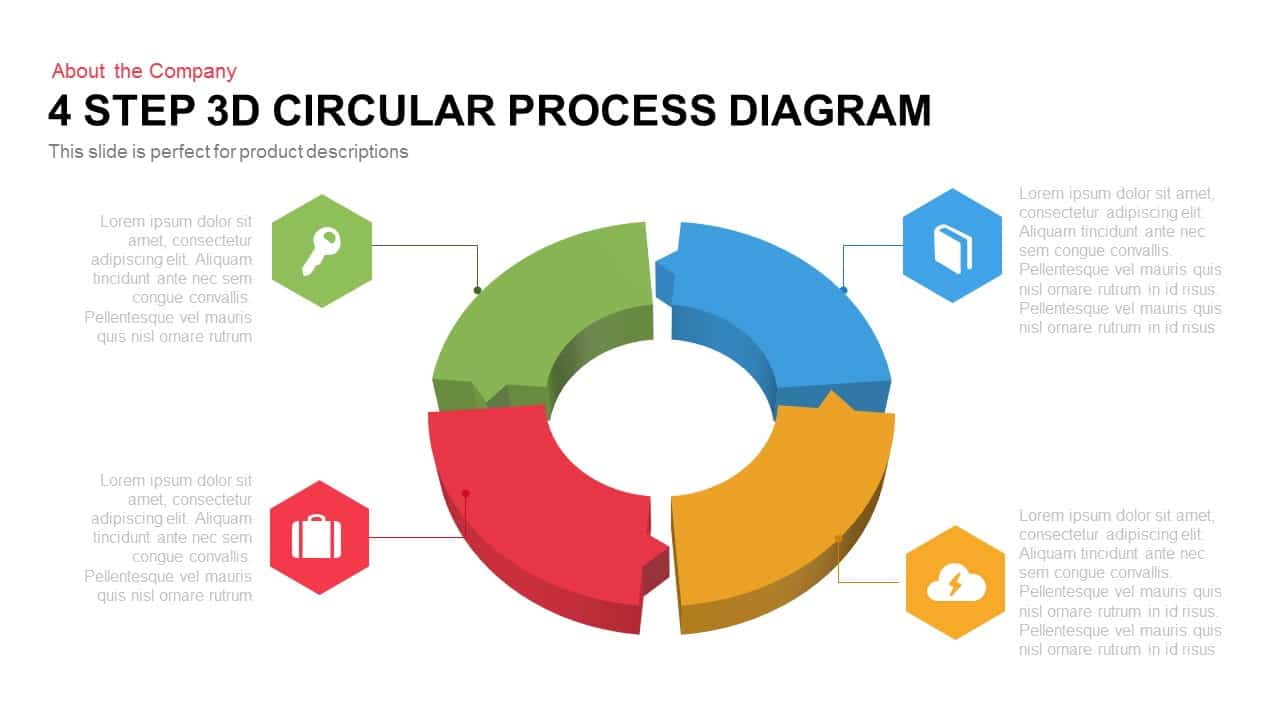
4 Step 3D Circular Process Diagram template for PowerPoint & Google Slides
Process
Three-Section Fishbone Process Diagram template for PowerPoint & Google Slides
Process
3D Sphere Arrow Process Diagram template for PowerPoint & Google Slides
Arrow
15-Step Process Flow Diagram Template for PowerPoint & Google Slides
Process
3D Shape Linear Process Flow Diagram Template for PowerPoint & Google Slides
Process
Four-Circle Venn Process Diagram template for PowerPoint & Google Slides
Process
Linear Process Flow Circles Diagram Template for PowerPoint & Google Slides
Process
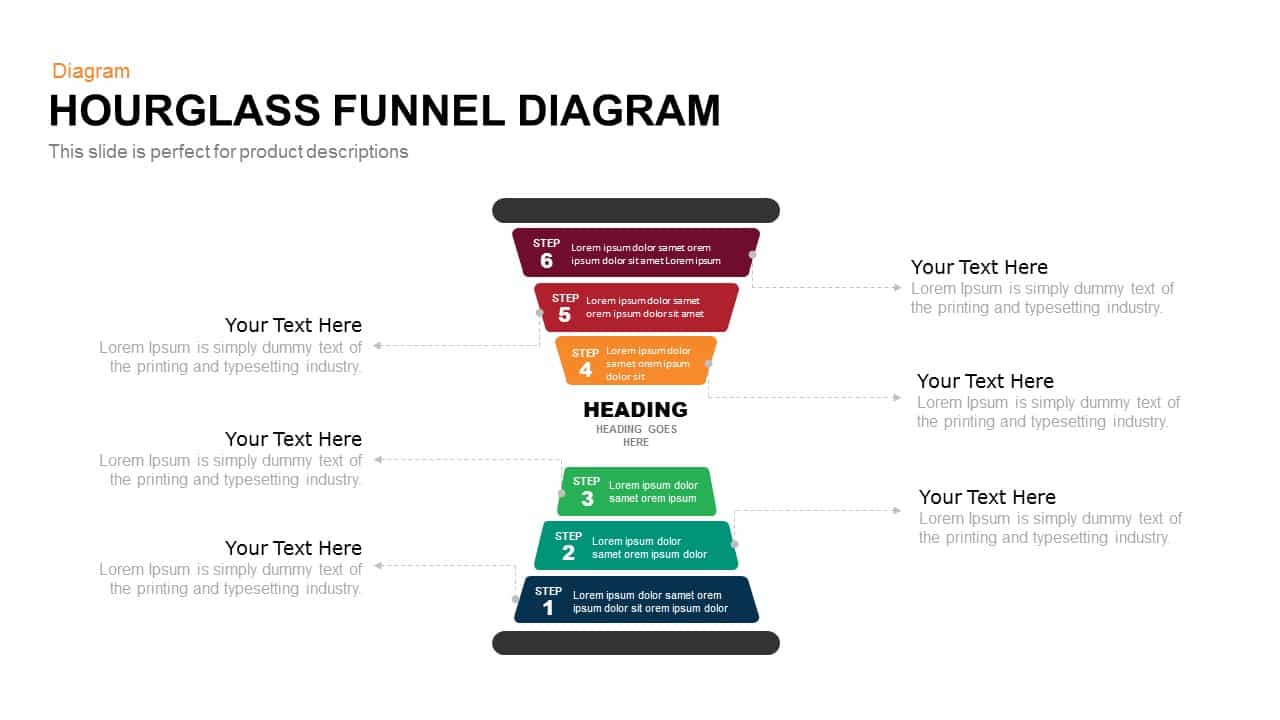
Hourglass Funnel Diagram Process Template for PowerPoint & Google Slides
Funnel
Engaging Five-Stage Process Diagram Template for PowerPoint & Google Slides
Process
8 Steps Arrow Process Diagram template for PowerPoint & Google Slides
Process
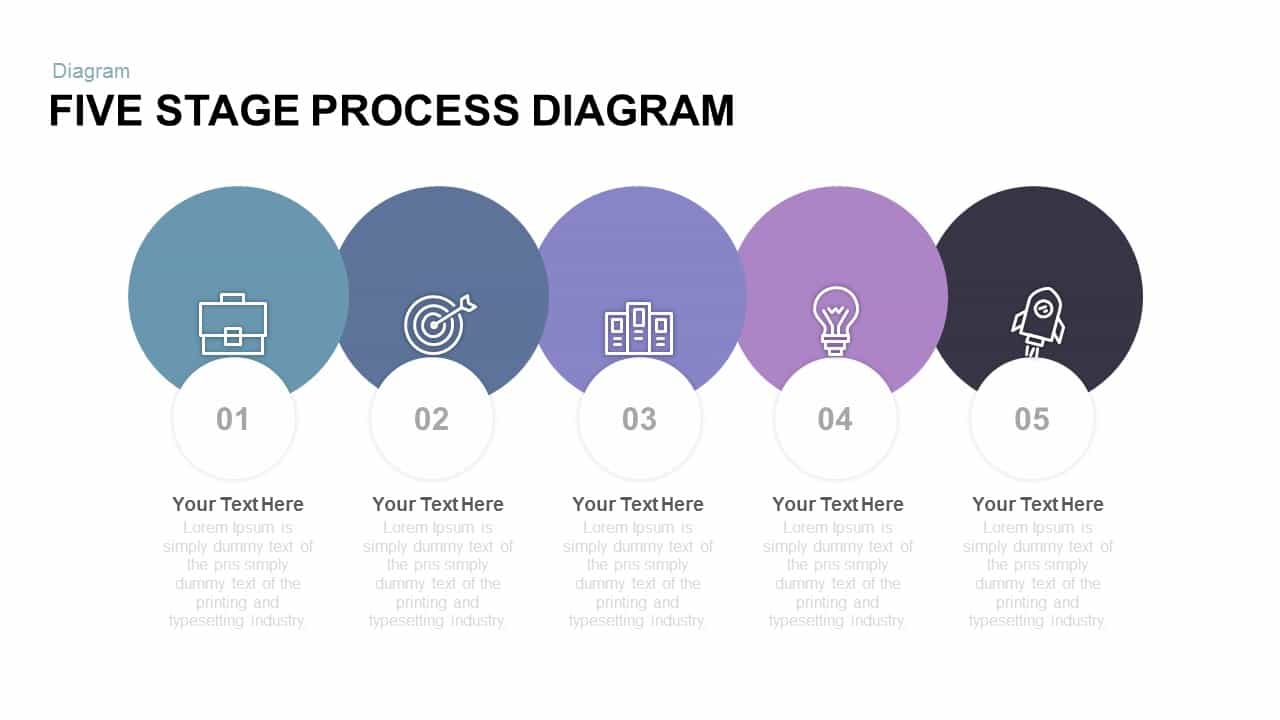
Five Stage Process Diagram template for PowerPoint & Google Slides
Process
Free
Five-Stage Cyclic Process Arrow Diagram Template for PowerPoint & Google Slides
Process
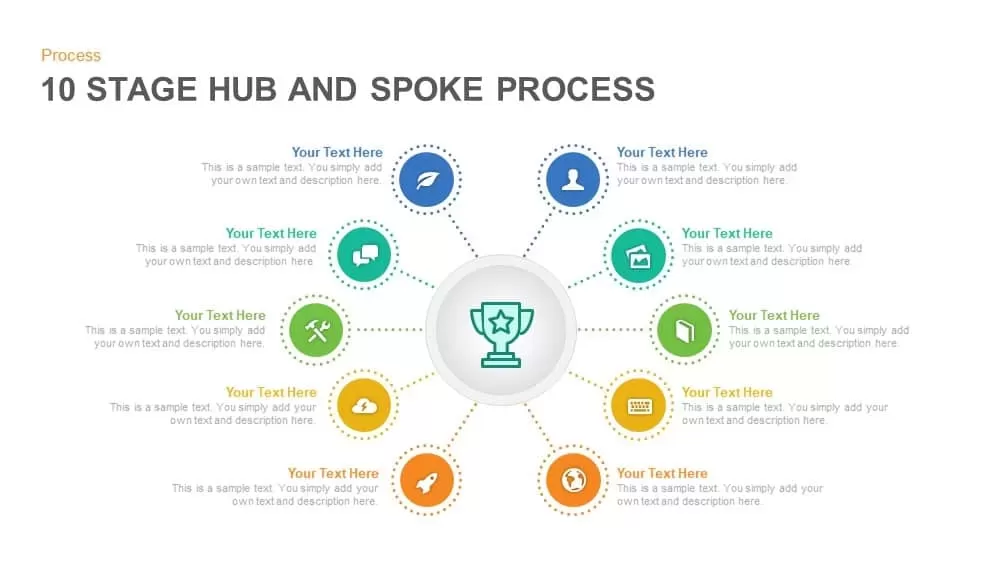
Ten-Stage Hub and Spoke Process Diagram Template for PowerPoint & Google Slides
Process
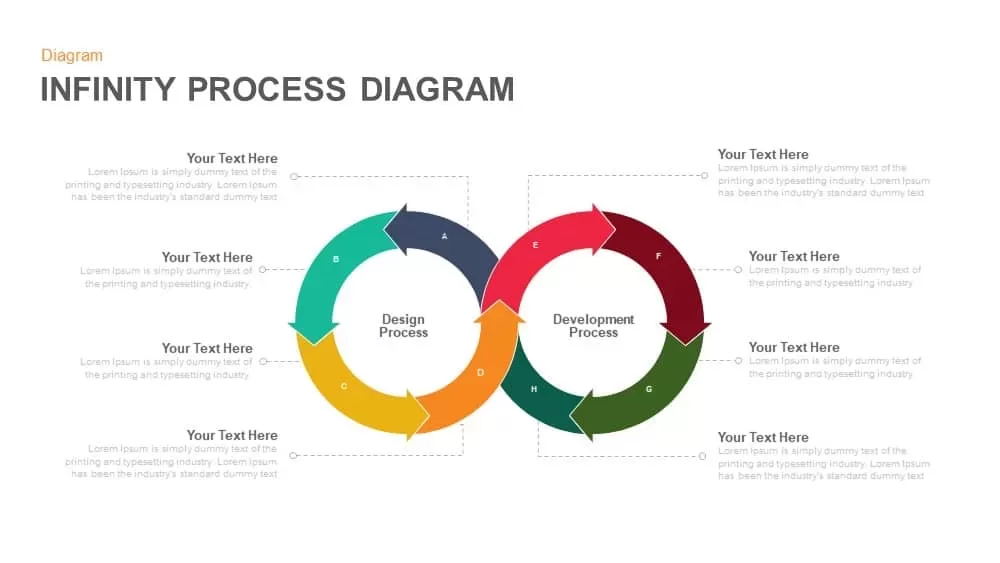
Infinity Process Diagram Template for PowerPoint & Google Slides
Process
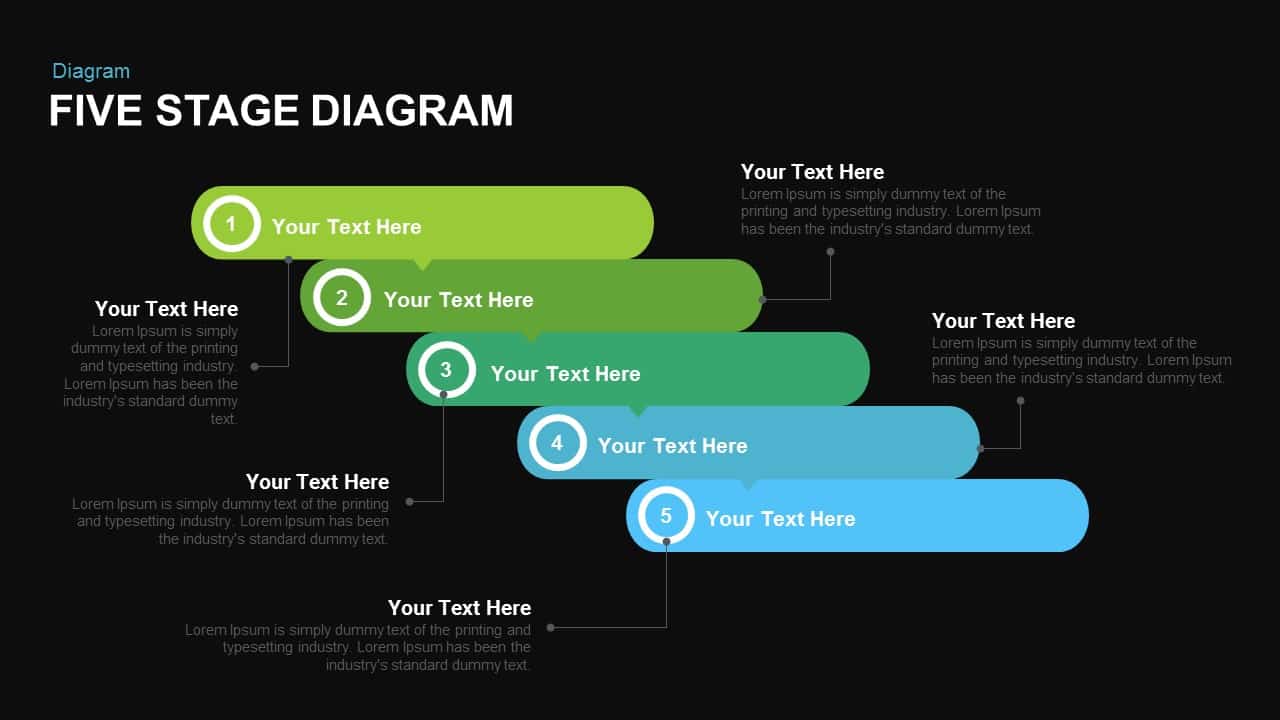
Five-Stage Process Diagram Template for PowerPoint & Google Slides
Process
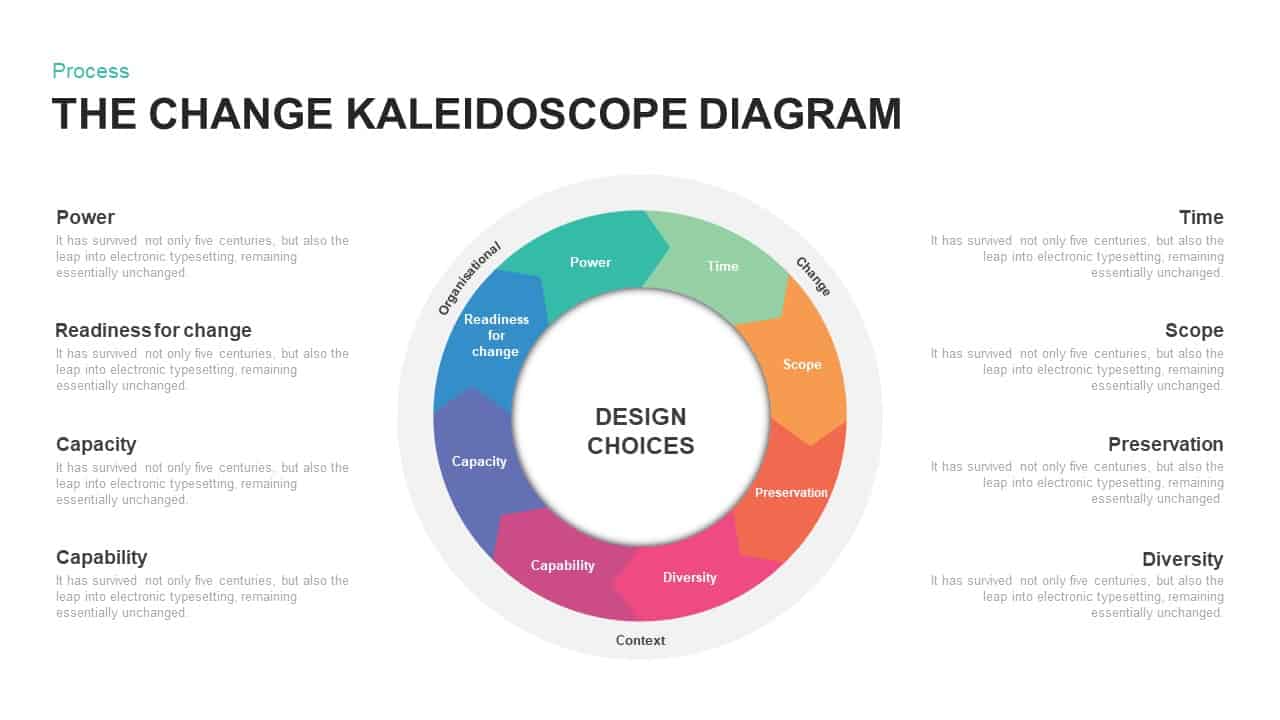
Change Kaleidoscope Process Diagram Template for PowerPoint & Google Slides
Circular
Five Stage Linear Process Flow Diagram Template for PowerPoint & Google Slides
Process
Five-Stage Linear Process Flow Diagram Template for PowerPoint & Google Slides
Process
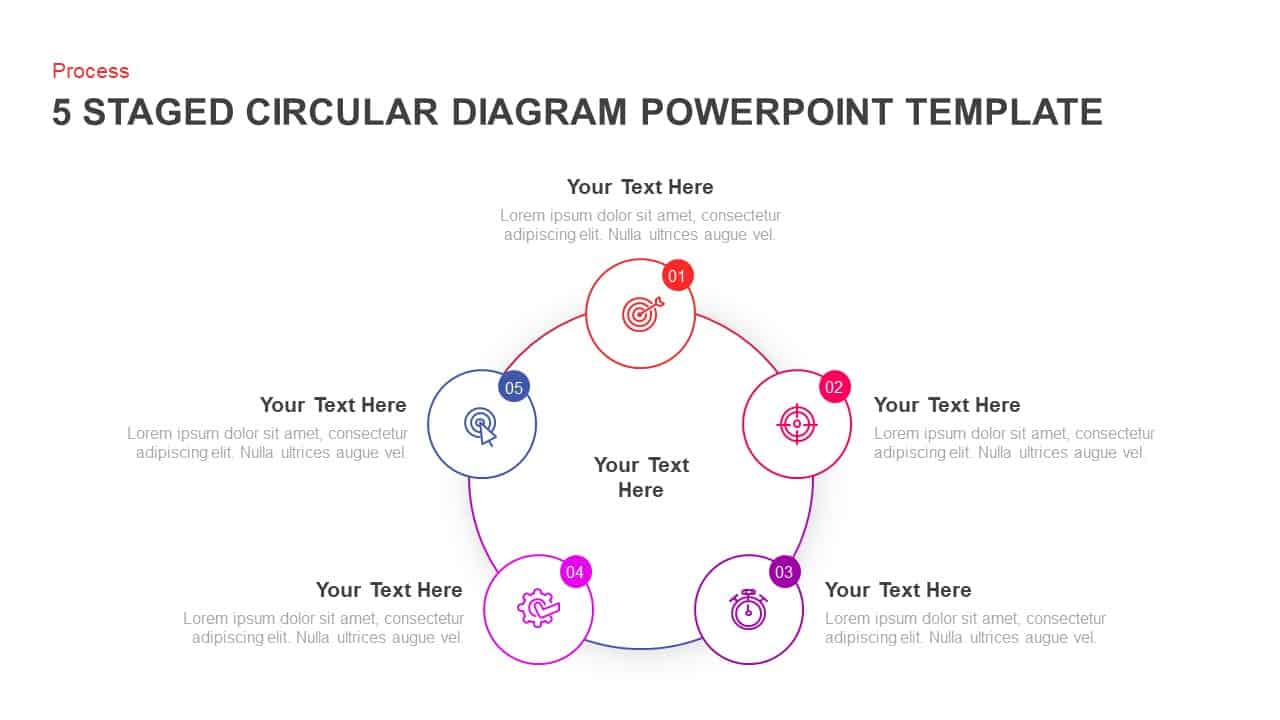
Five-Stage Circular Process Diagram Template for PowerPoint & Google Slides
Circular
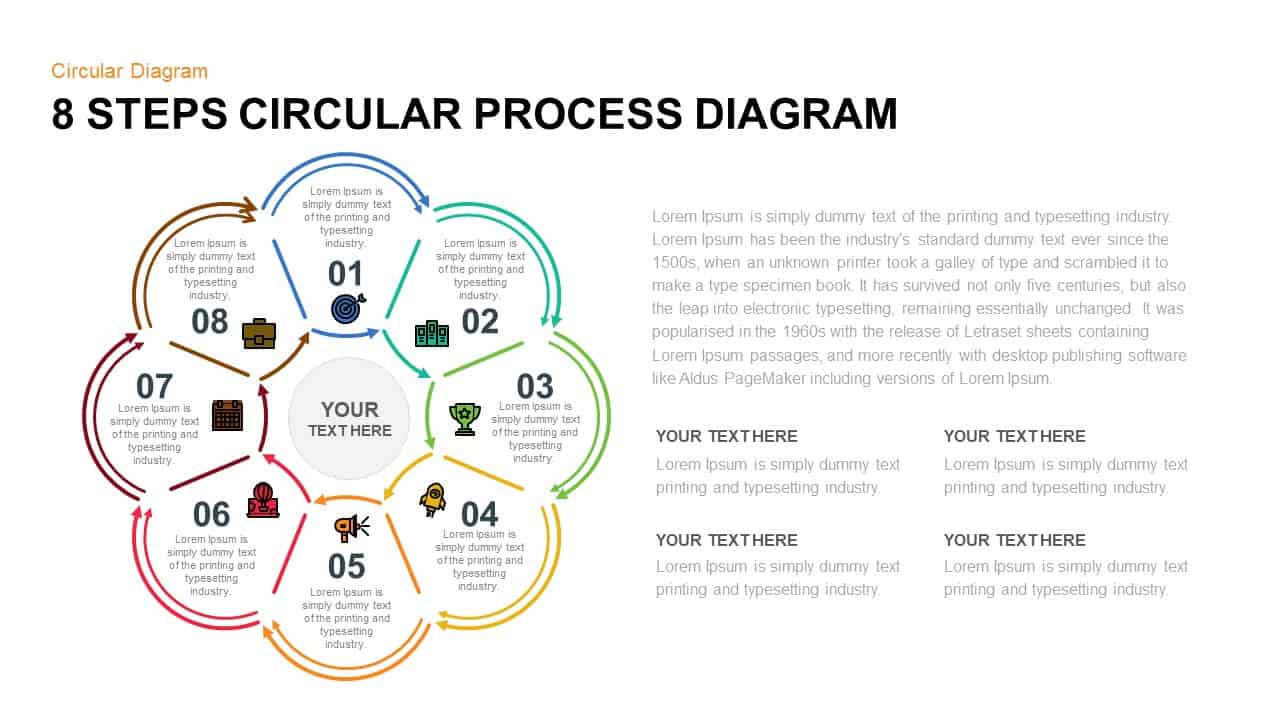
8 Steps Circular Process Diagram Template for PowerPoint & Google Slides
Circular
Four-Stage Cycle Process Diagram Template for PowerPoint & Google Slides
Process
Five-Stage Circular Process Flow Diagram Template for PowerPoint & Google Slides
Circular
5-Stage Linear Process Flow Diagram Template for PowerPoint & Google Slides
Process
7 Stage Linear Process Flow Diagram Template for PowerPoint & Google Slides
Process
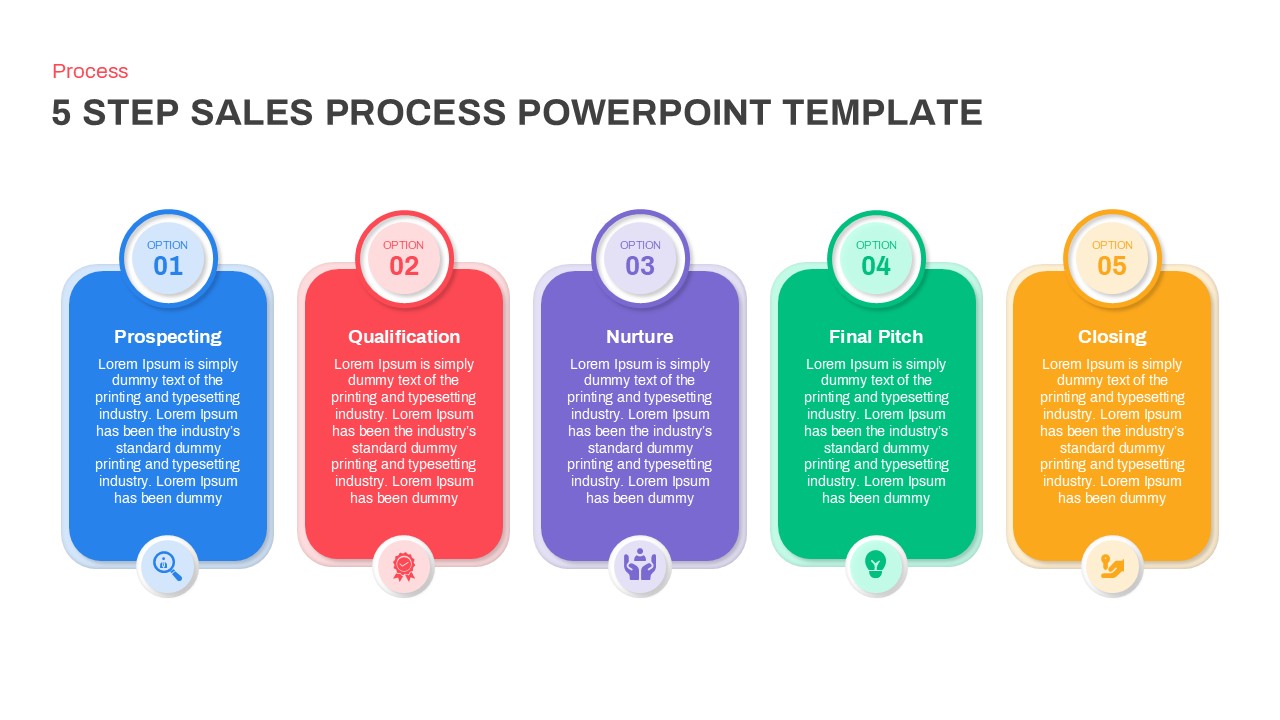
Modern 5-Step Sales Process Diagram Template for PowerPoint & Google Slides
Process
Three-Stage Loop Process Diagram Template for PowerPoint & Google Slides
Process
4-Stage Linear Process Flow Diagram Template for PowerPoint & Google Slides
Process
4-Step Linear Process Flow Diagram Template for PowerPoint & Google Slides
Process
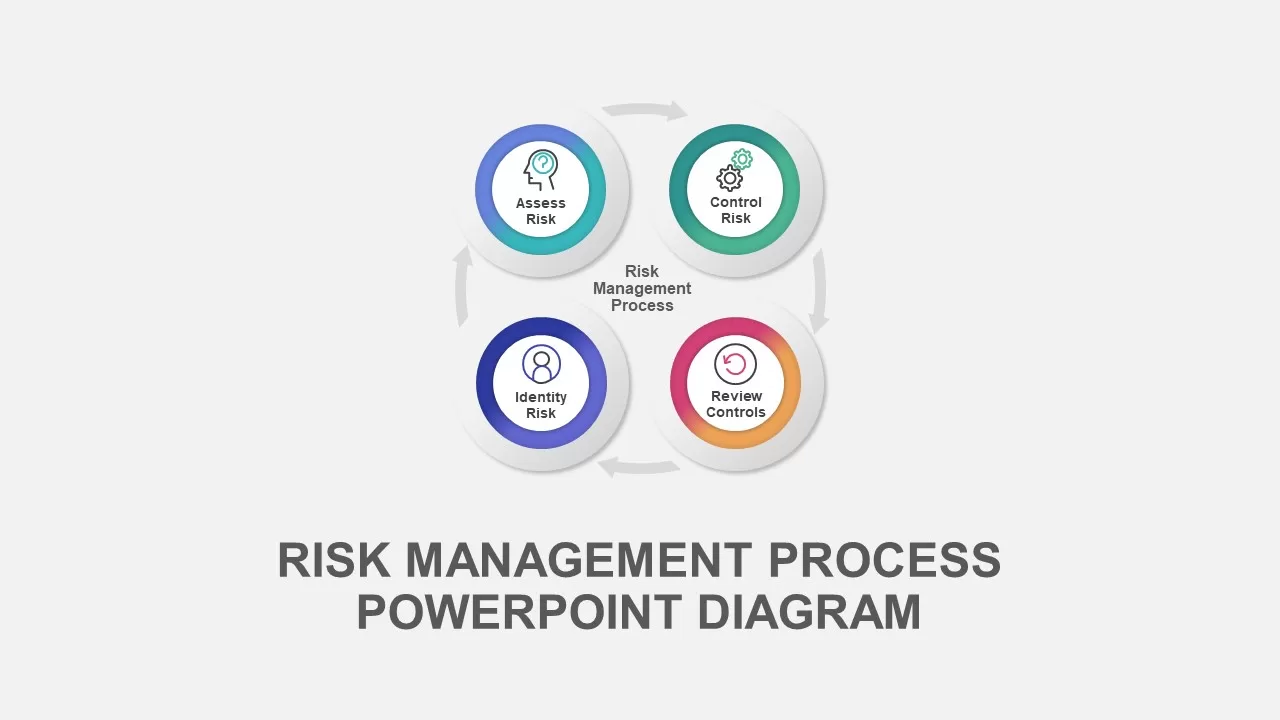
Risk Management Process Diagram Template for PowerPoint & Google Slides
Risk Management
Minimal Process Flow Diagram Infographic Template for PowerPoint & Google Slides
Process
Process Flow Diagram template for PowerPoint & Google Slides
Process
Curved Arrow Process Flow Diagram Template for PowerPoint & Google Slides
Arrow
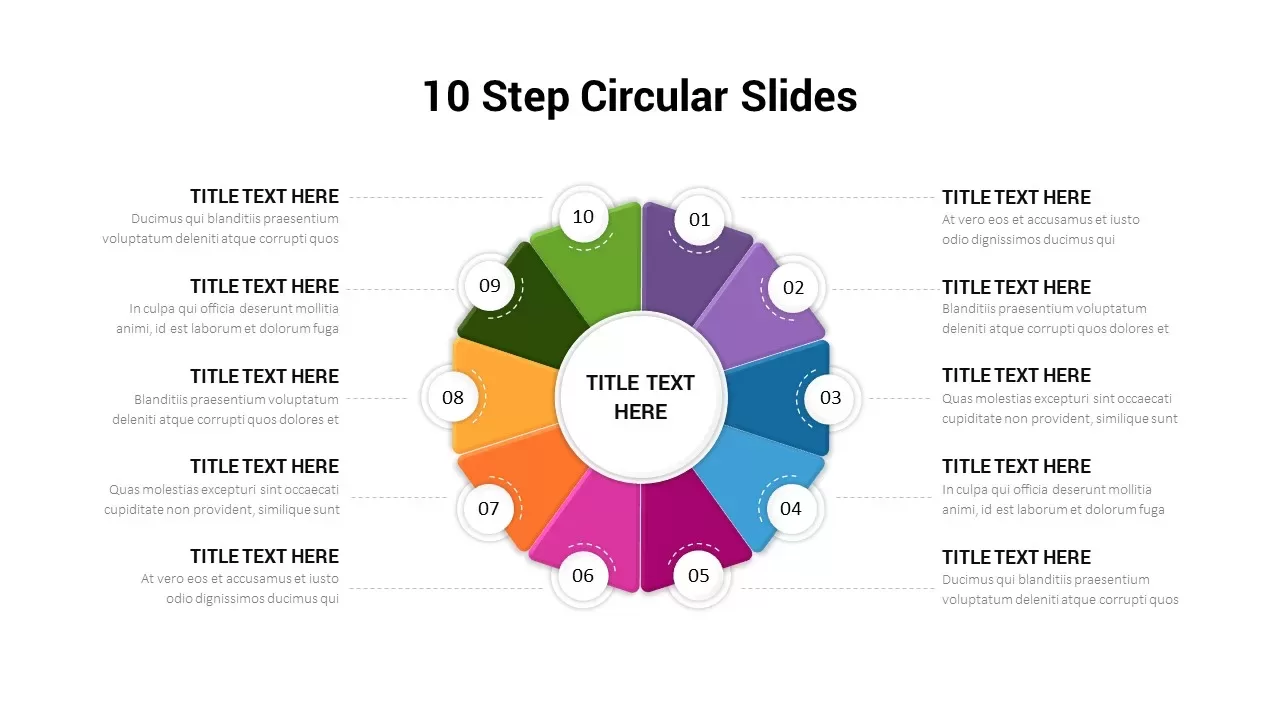
10-Step Circular Process Diagram Template for PowerPoint & Google Slides
Process
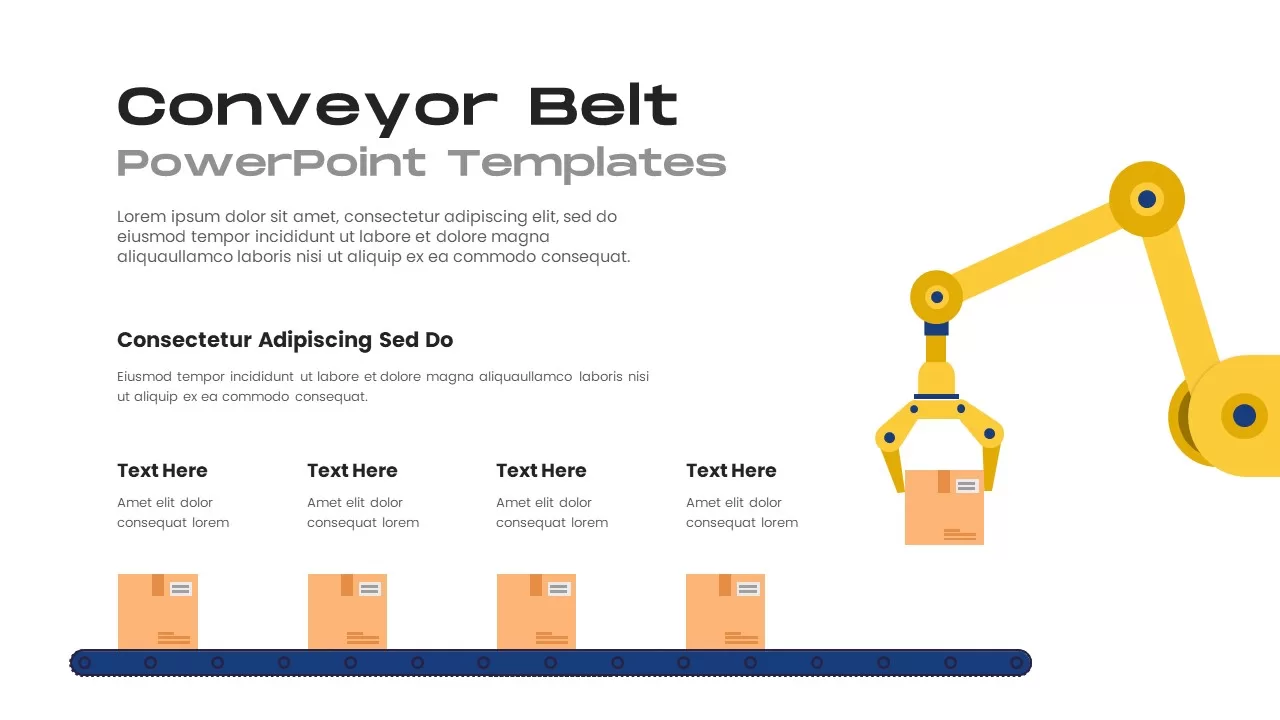
Robotic Conveyor Belt Process Diagram Template for PowerPoint & Google Slides
Process
Pentagon Arrow Process Diagram Template for PowerPoint & Google Slides
Process
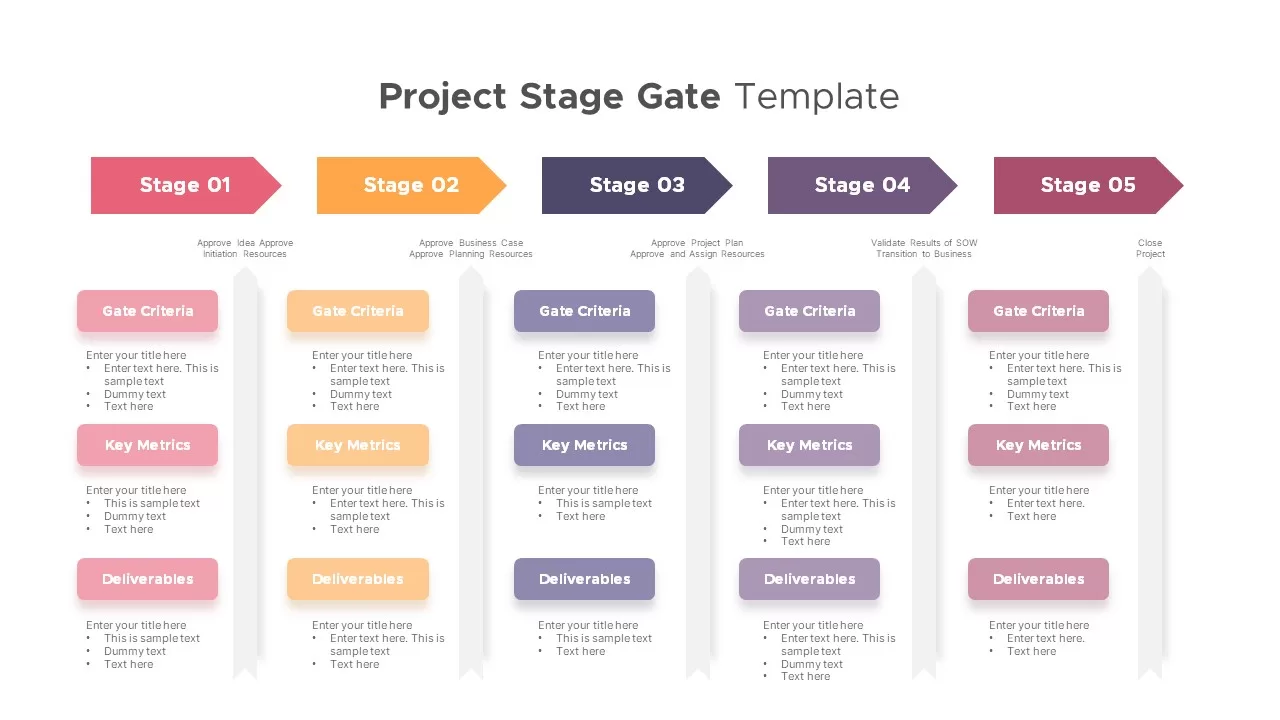
Project Stage Gate Process Diagram Template for PowerPoint & Google Slides
Process
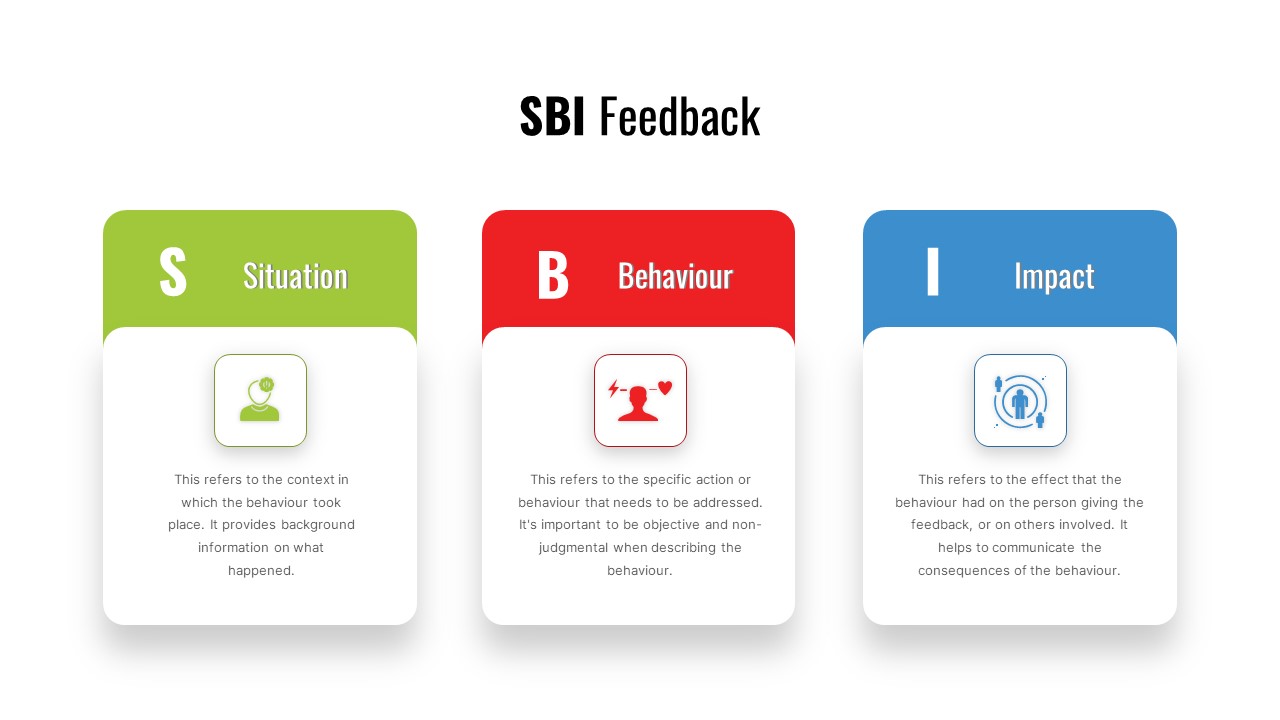
SBI Feedback Model Process Diagram Template for PowerPoint & Google Slides
Process
Simple Flowchart Process Diagram Template for PowerPoint & Google Slides
Flow Charts
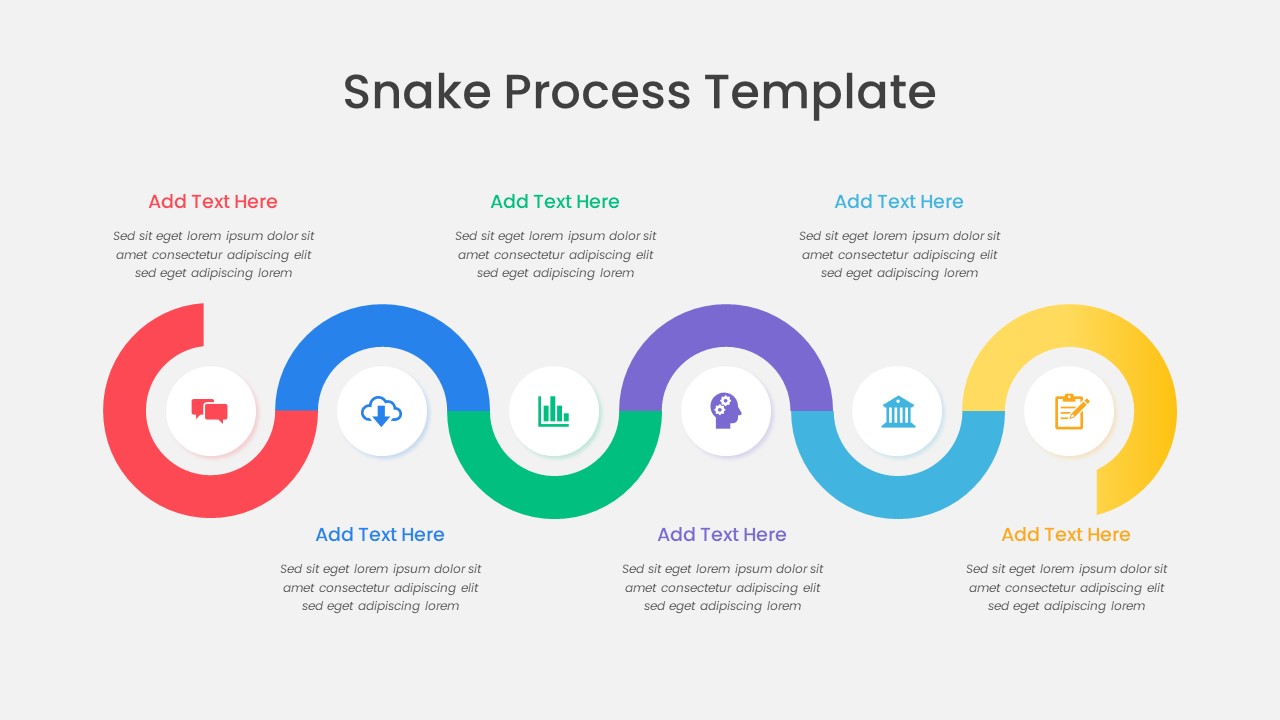
Colorful Snake Process Diagram Template for PowerPoint & Google Slides
Process
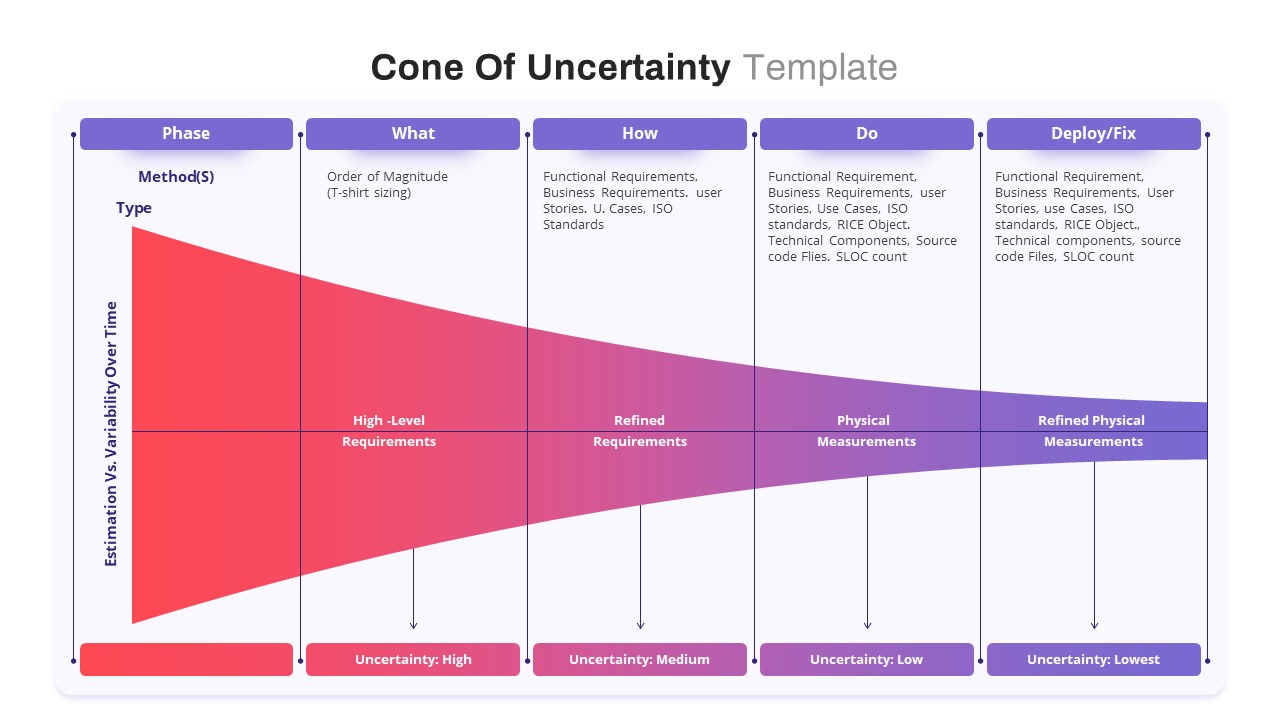
Cone of Uncertainty Process Diagram Template for PowerPoint & Google Slides
Process
Bottleneck Process Analysis Diagram Template for PowerPoint & Google Slides
Process
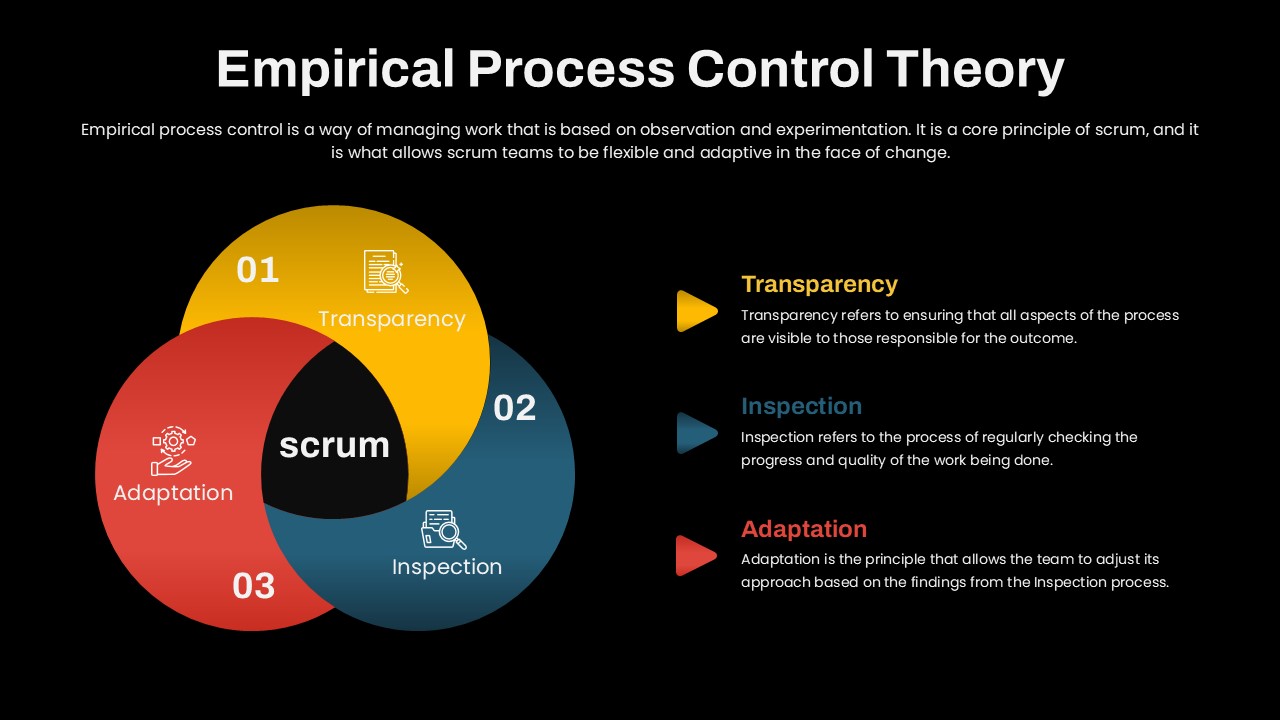
Empirical Process Control Theory Diagram Template for PowerPoint & Google Slides
Circular
Resume Screening Process Flow Diagram Template for PowerPoint & Google Slides
Process
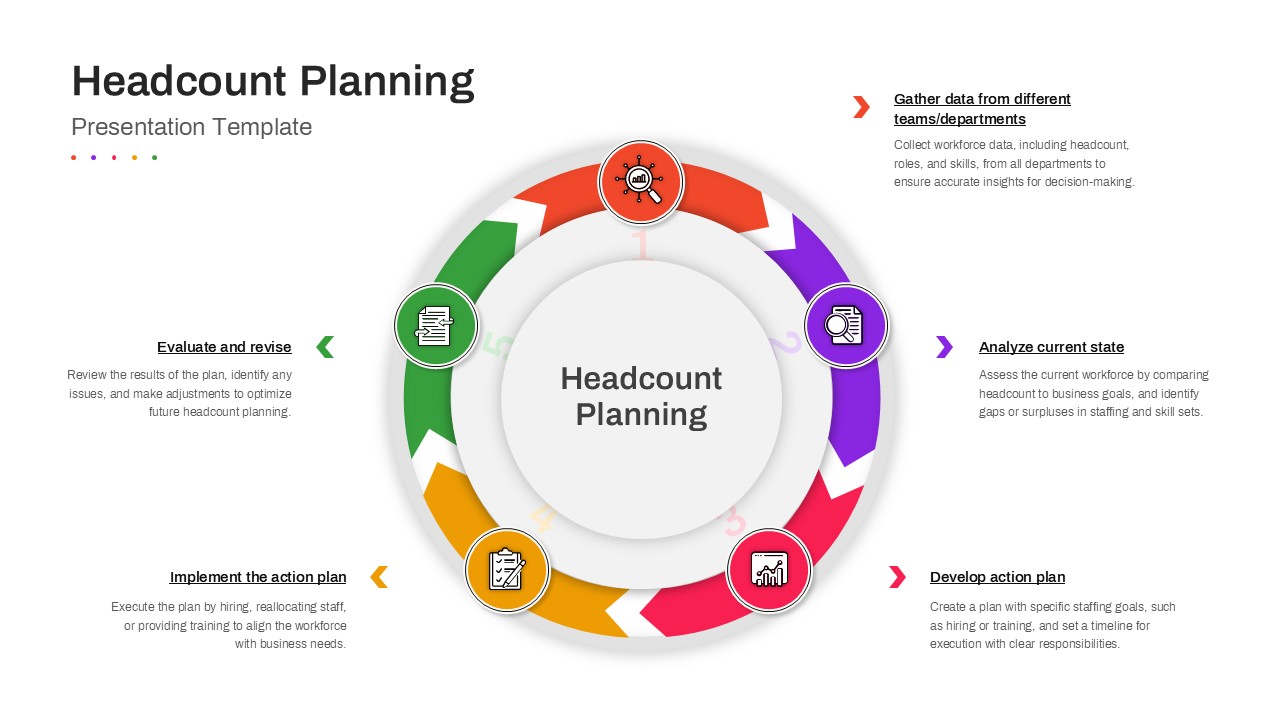
Headcount Planning Circular Process Diagram Template for PowerPoint & Google Slides
HR