Funnel Filter Diagram for PowerPoint & Google Slides
Description
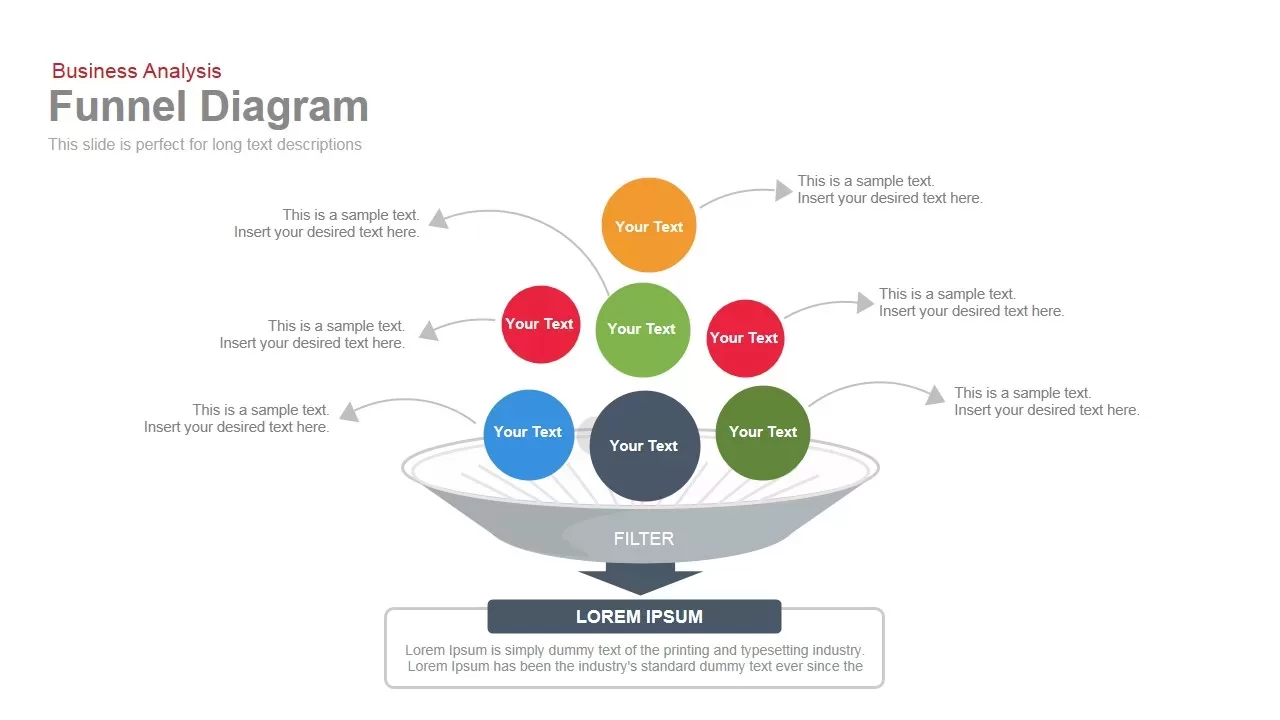
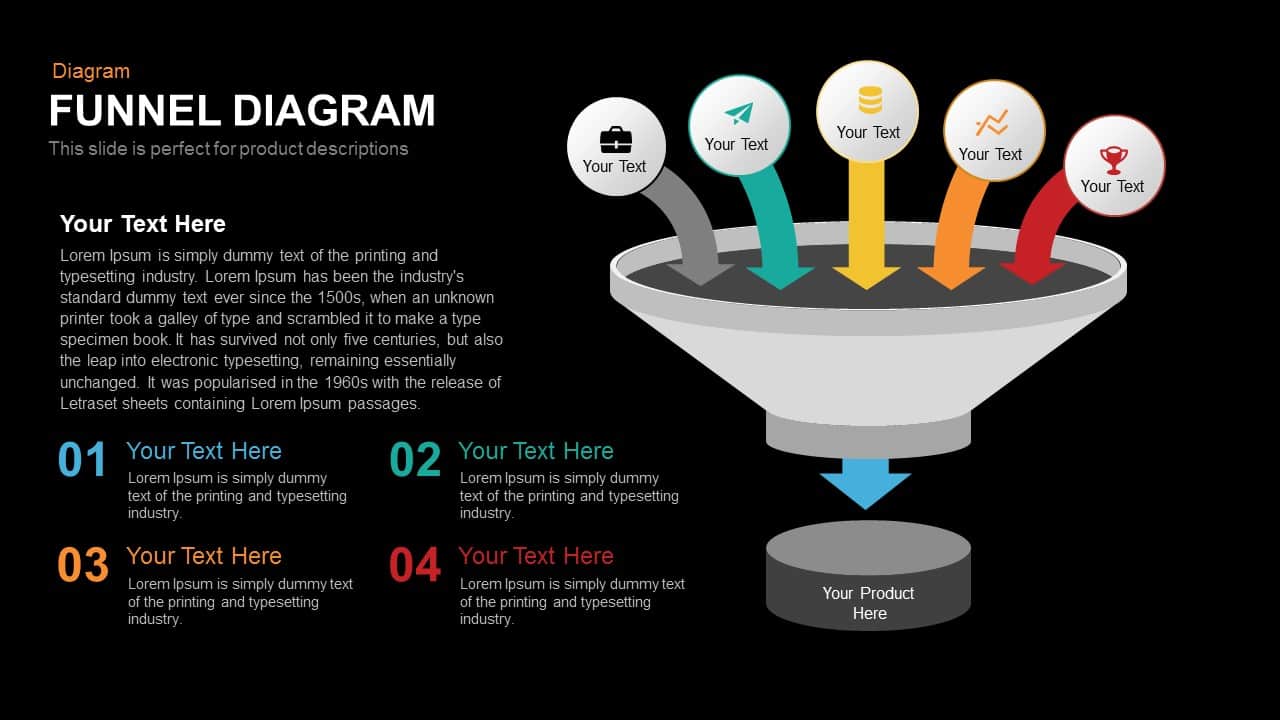
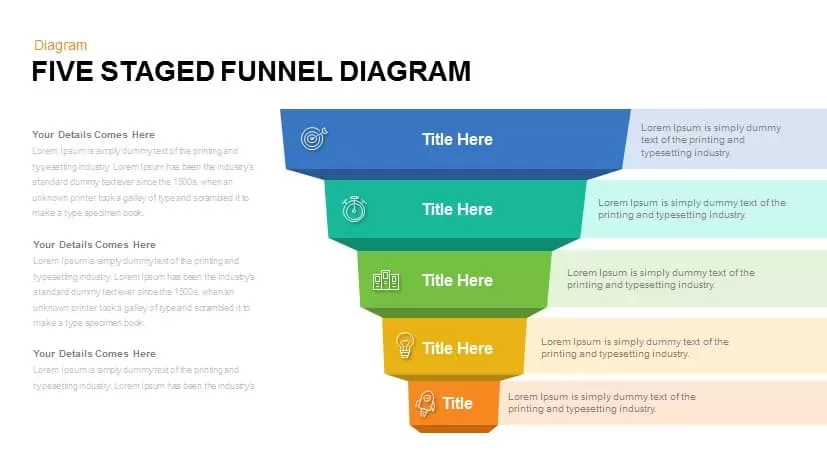
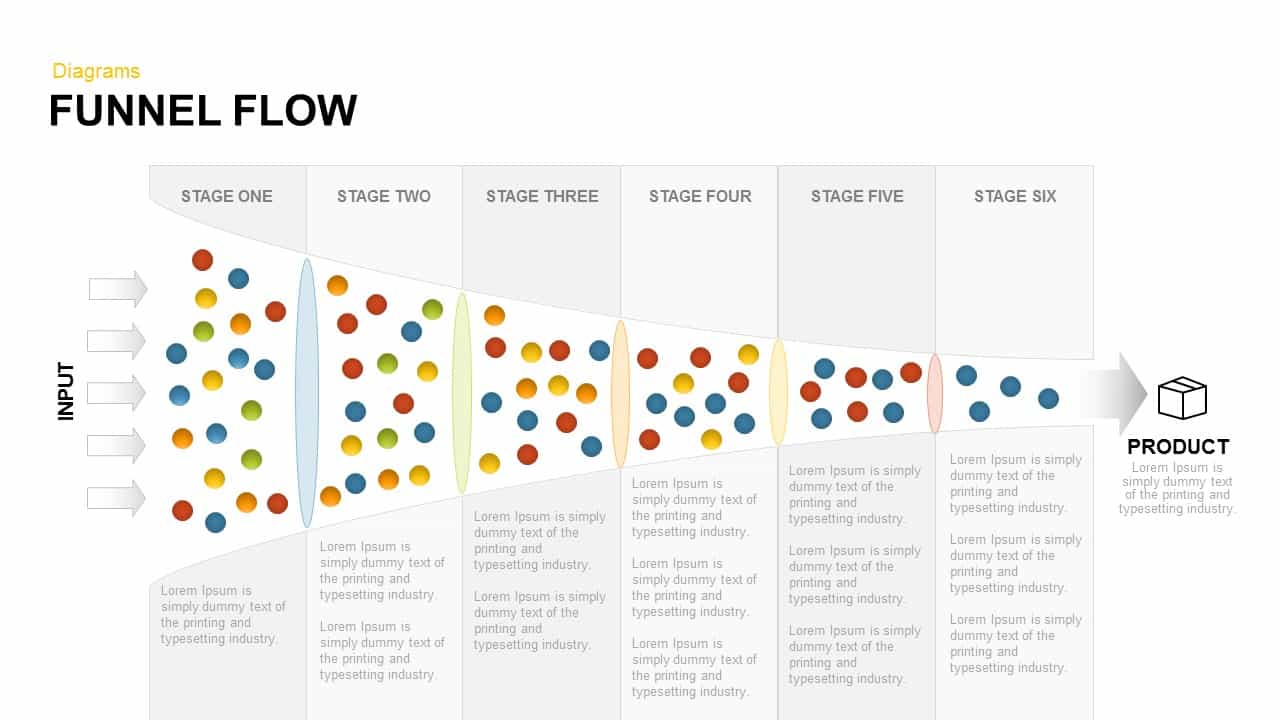
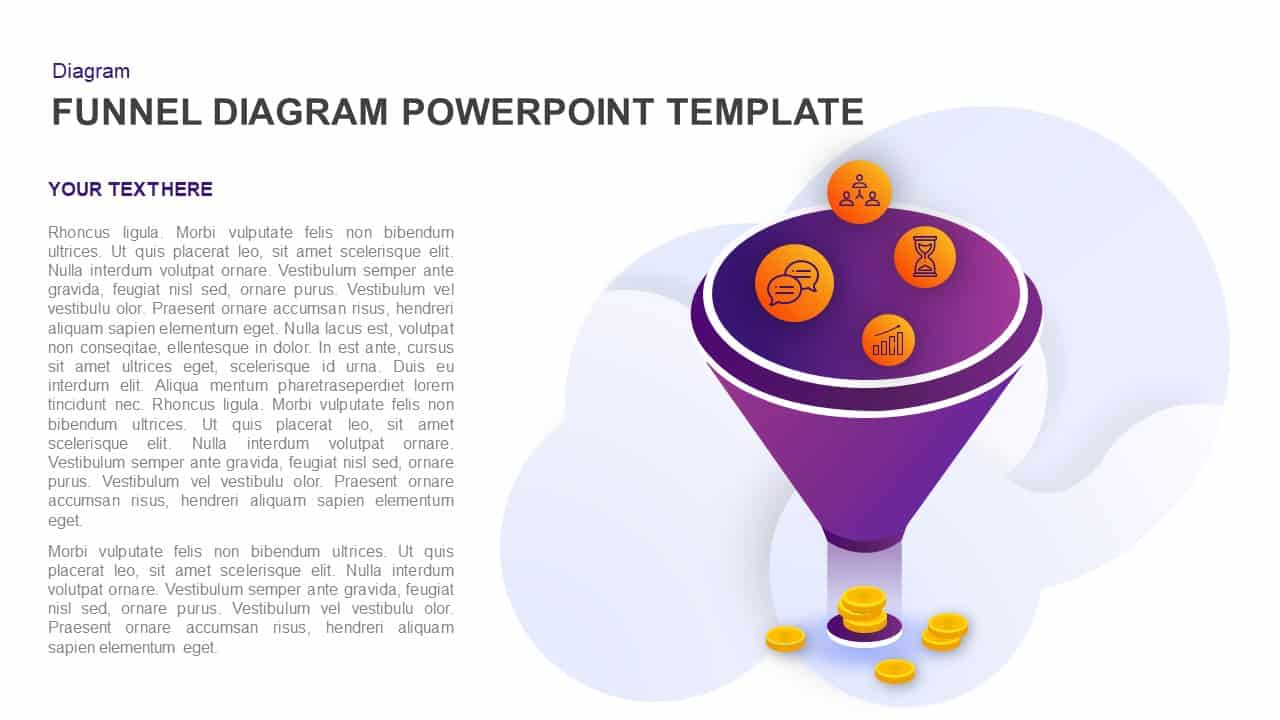
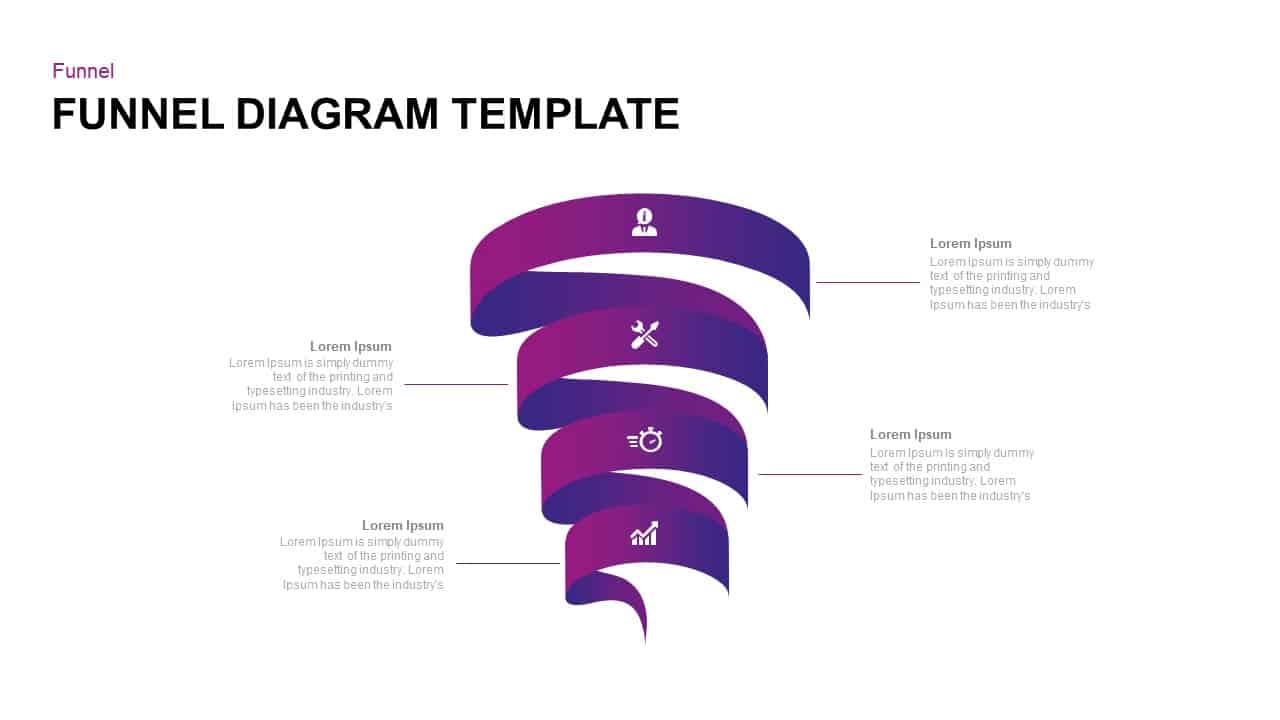
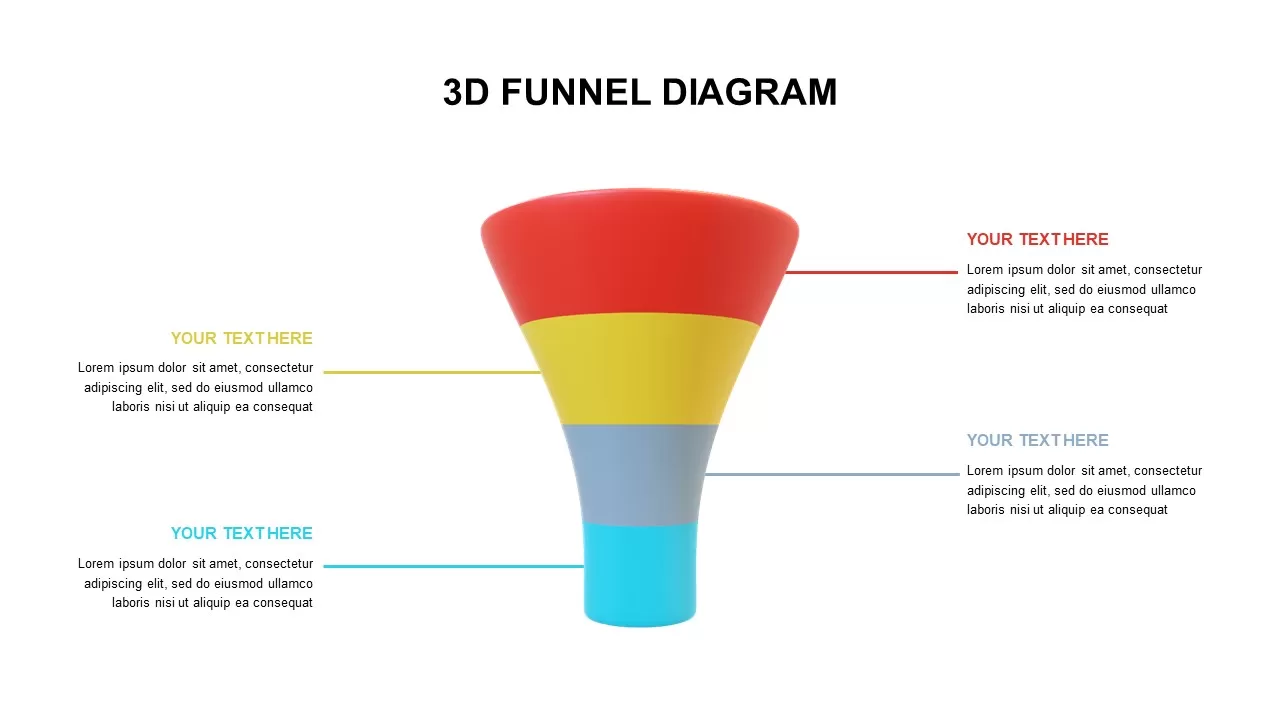
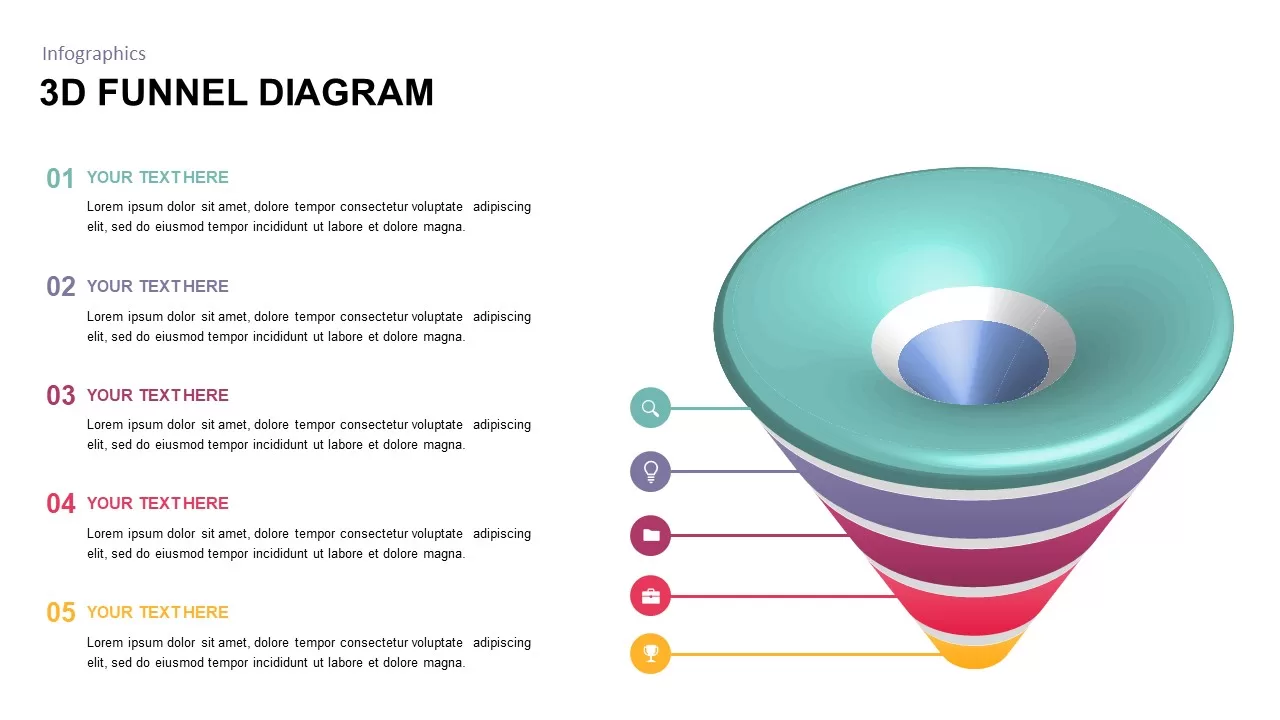
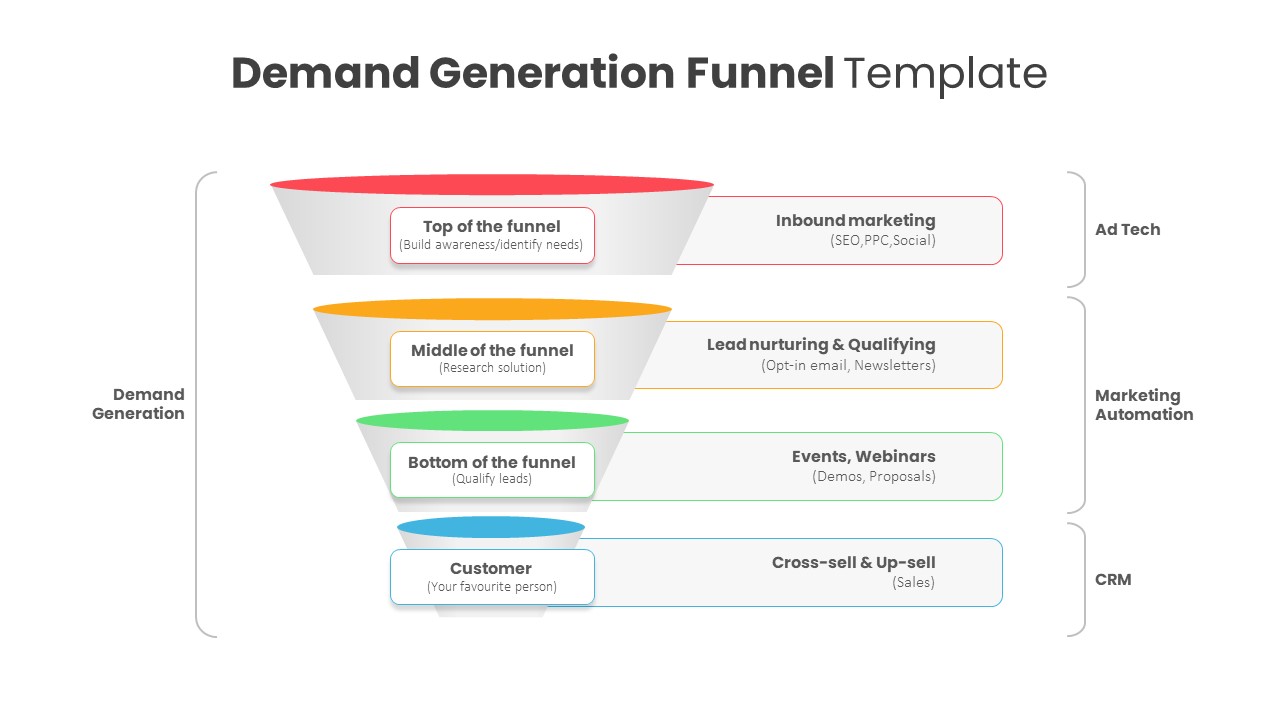
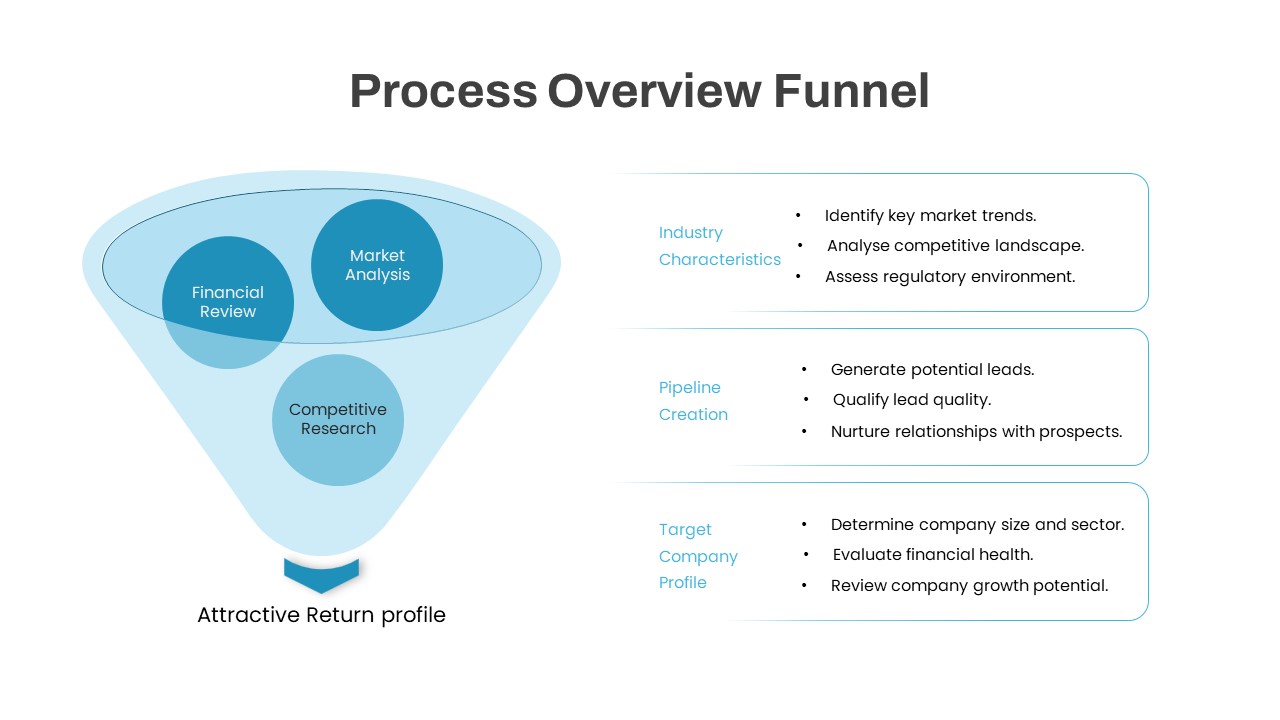
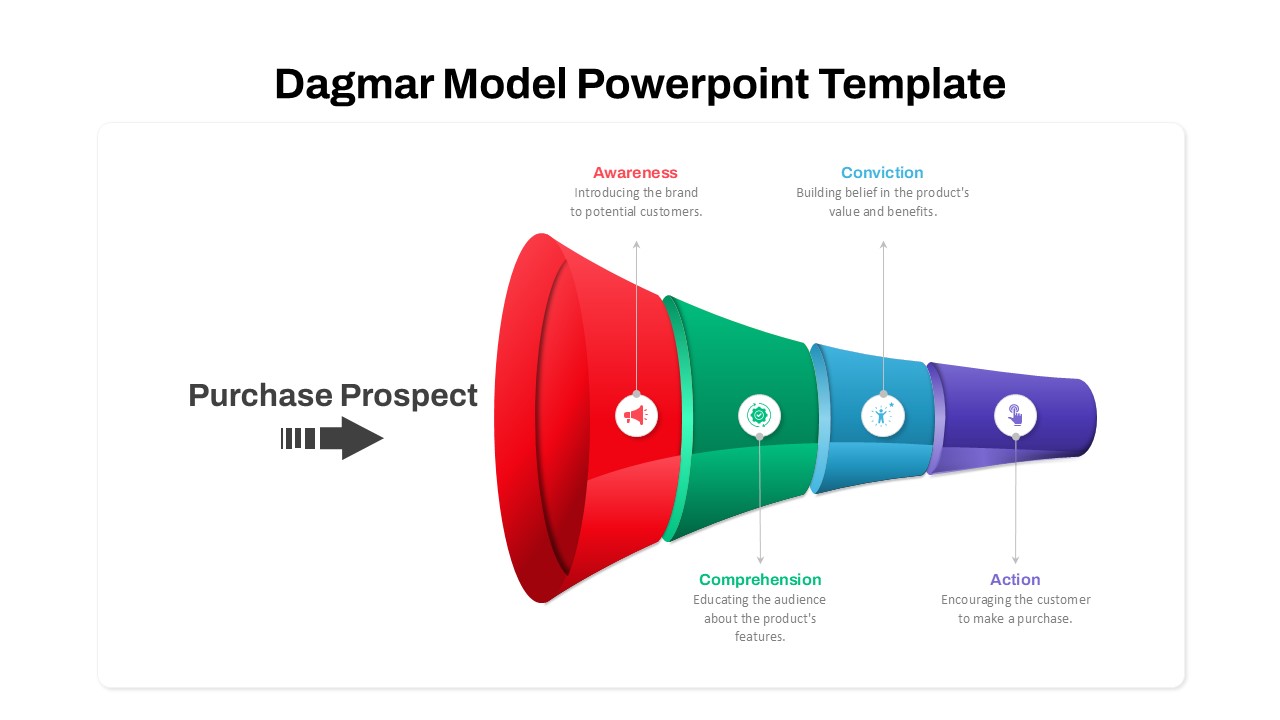
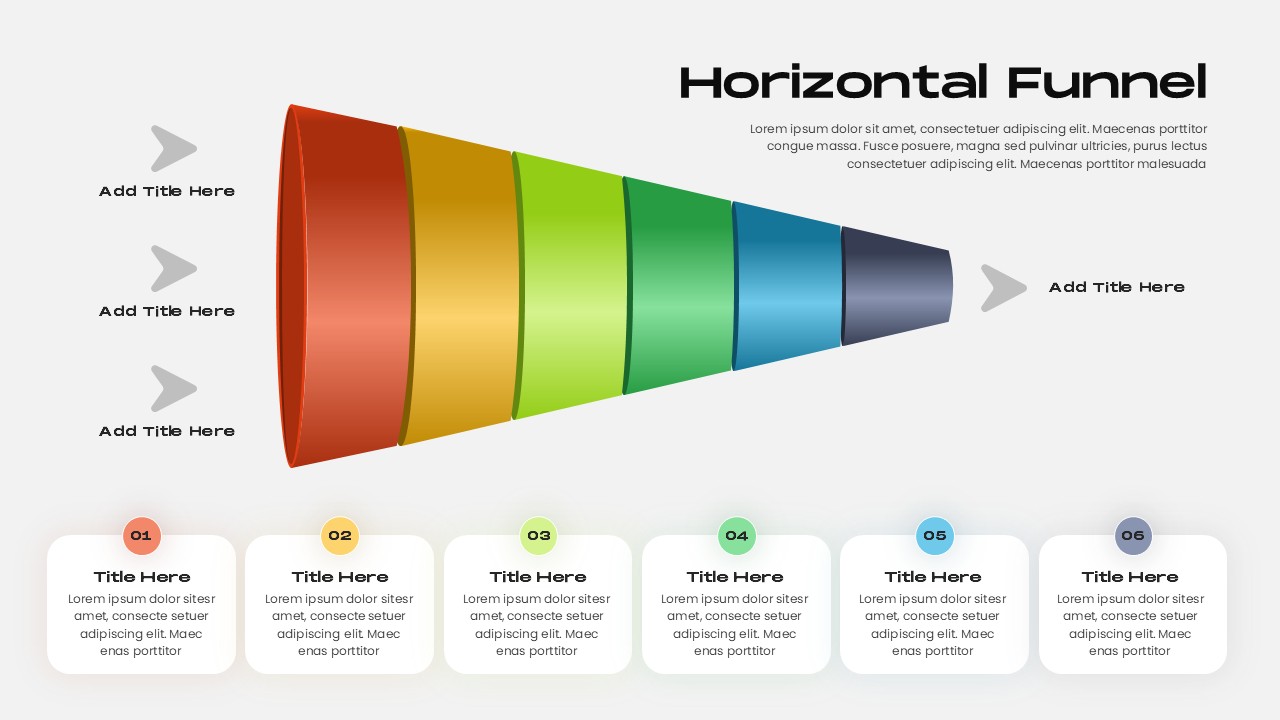
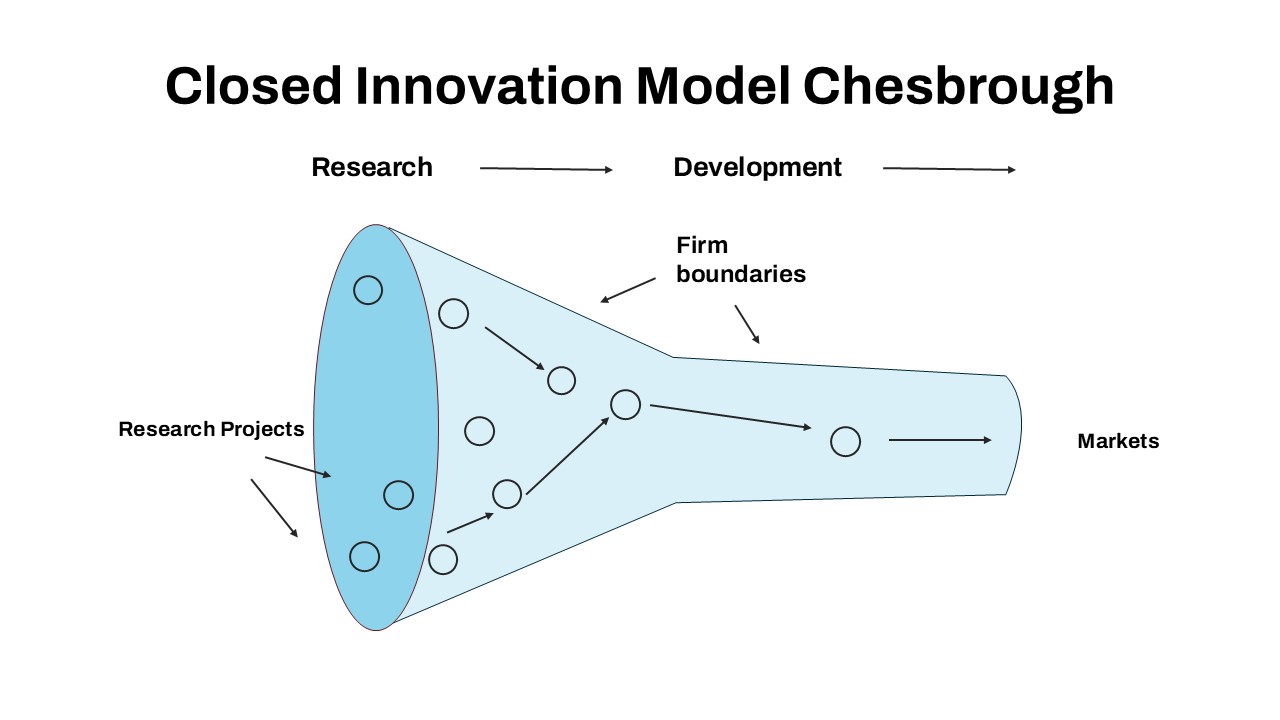
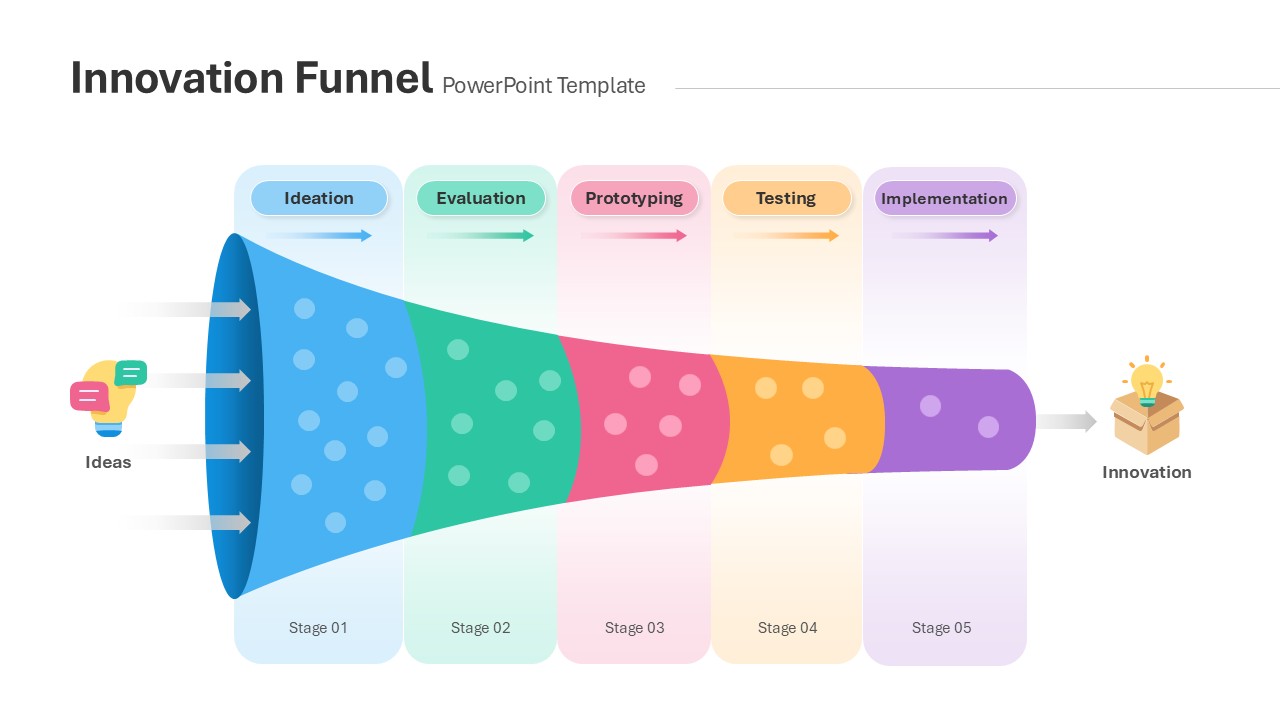
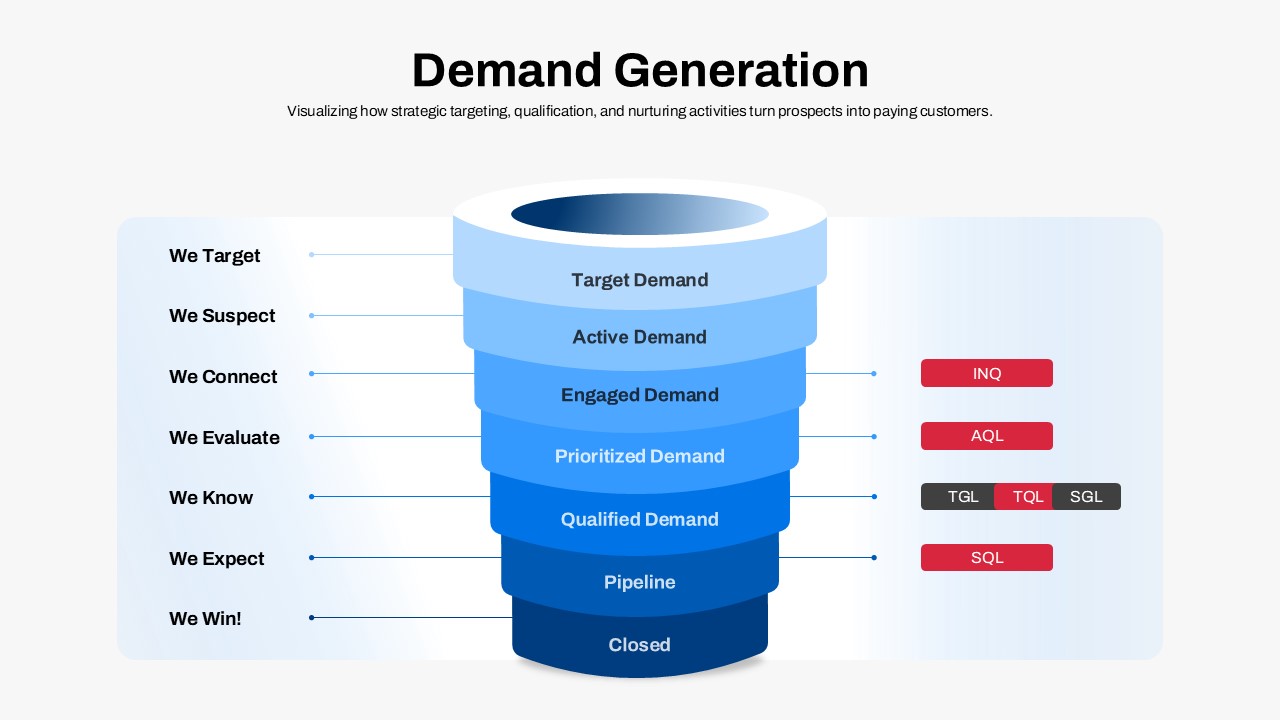
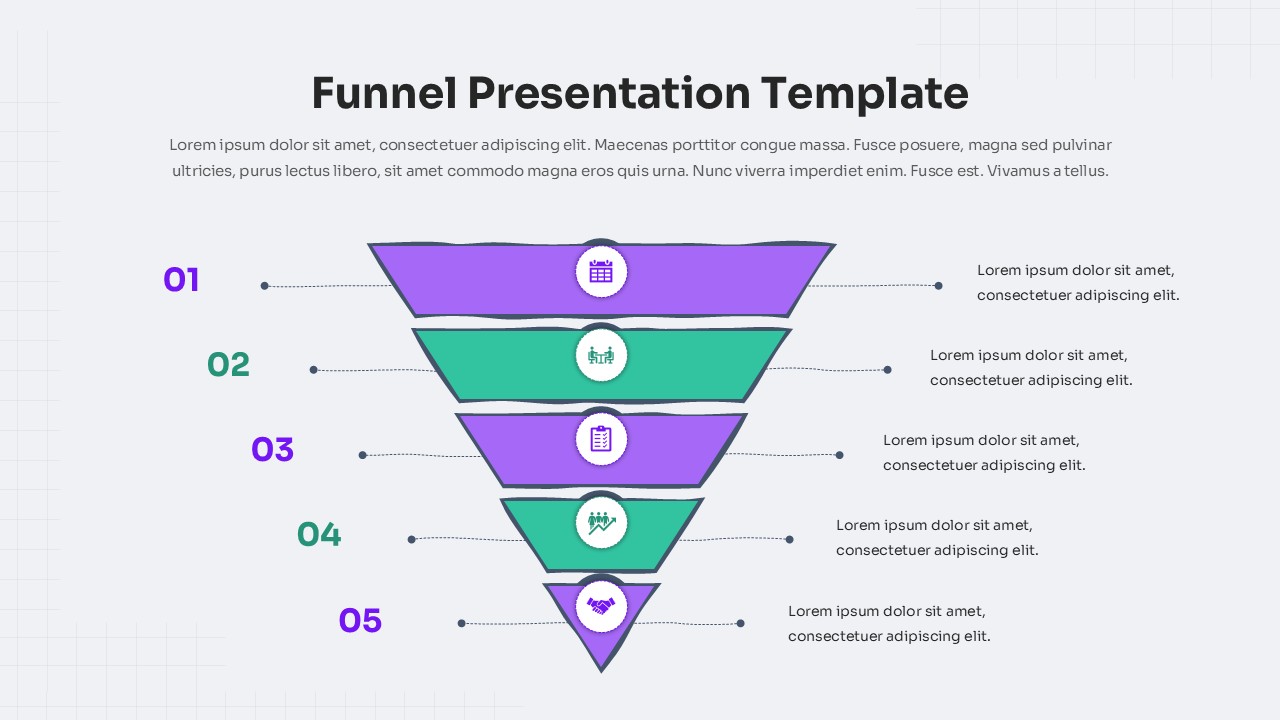
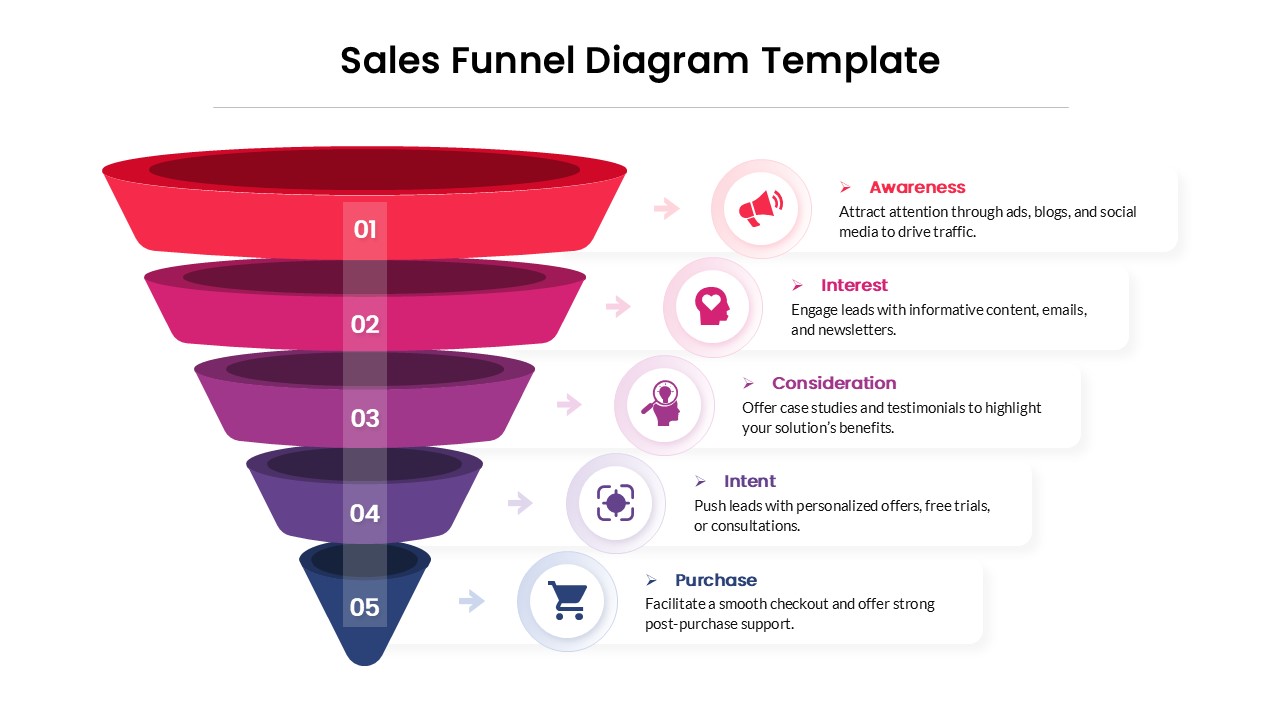
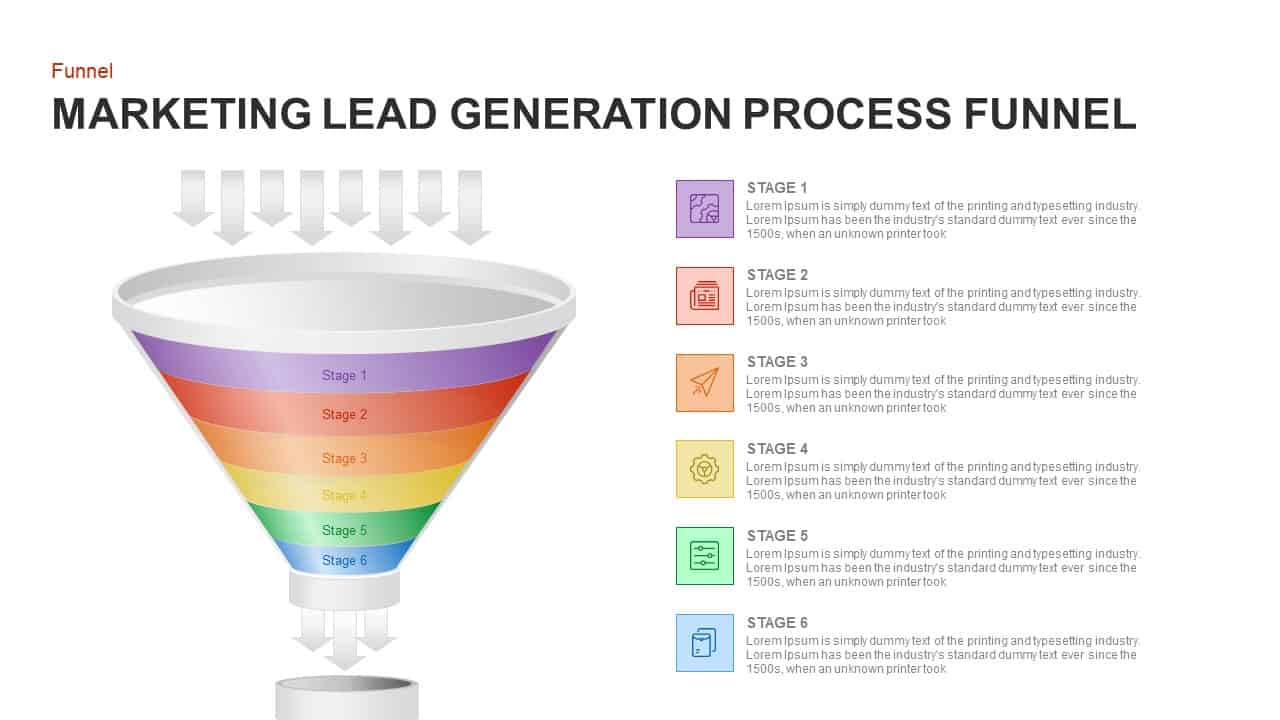
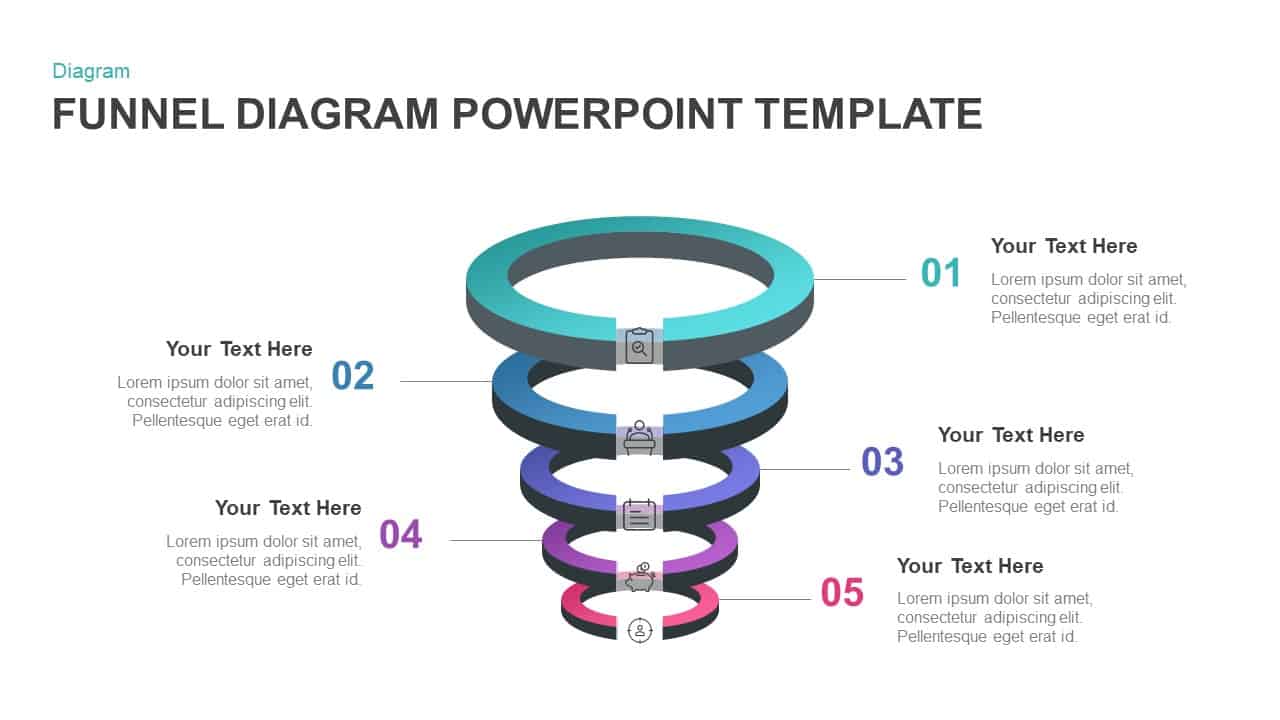
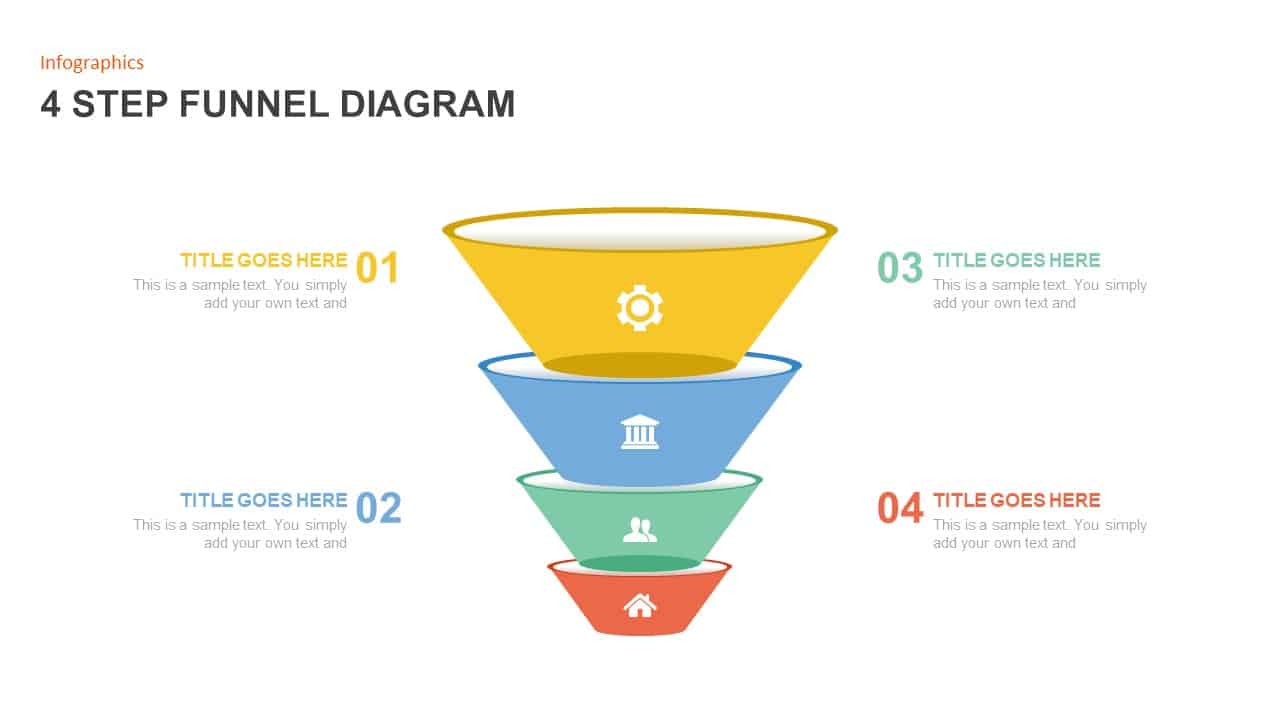
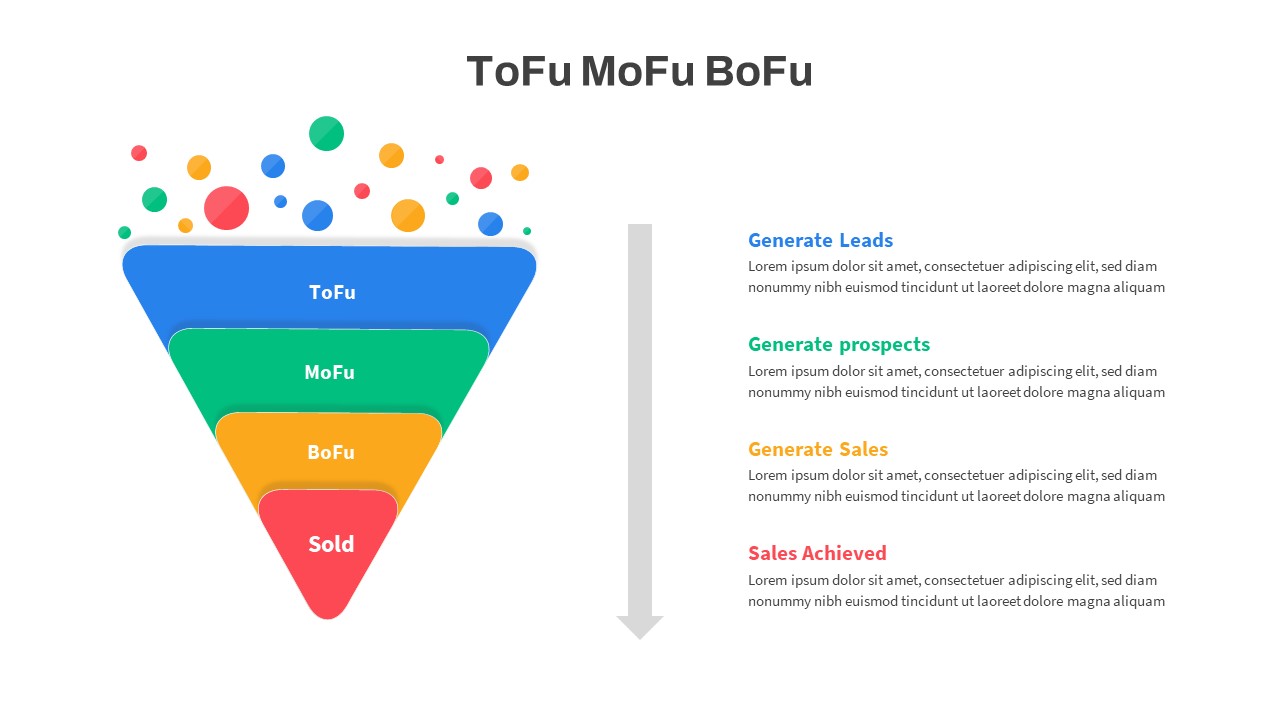
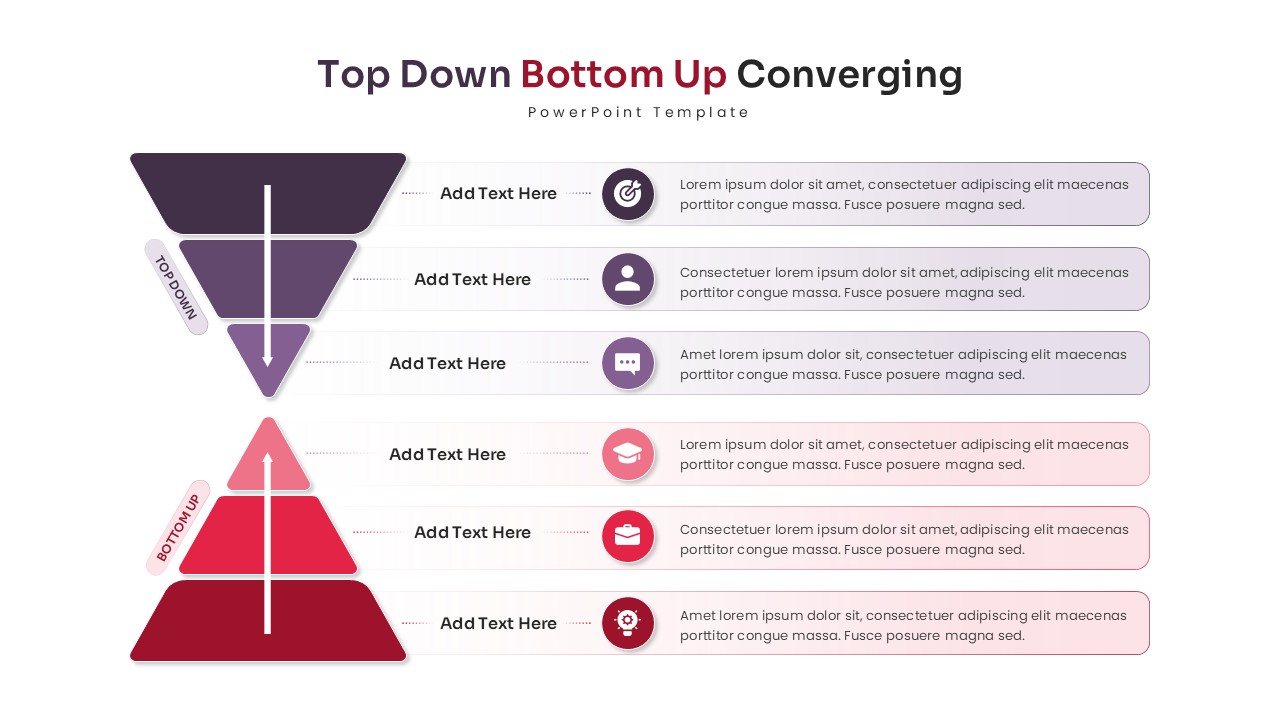
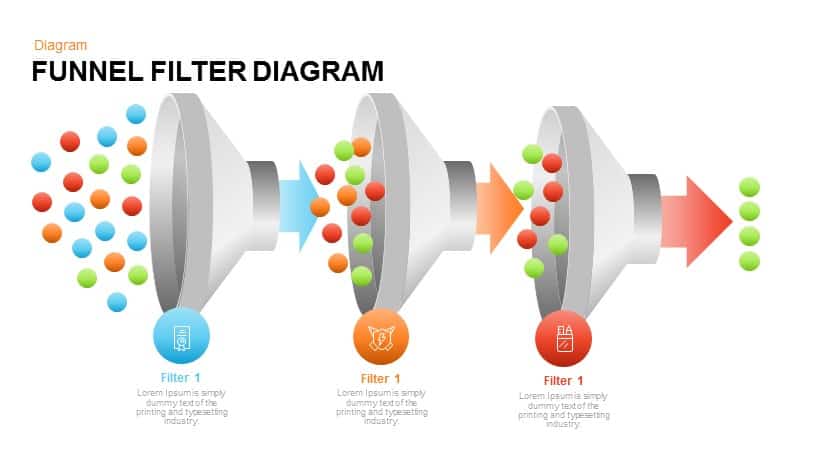
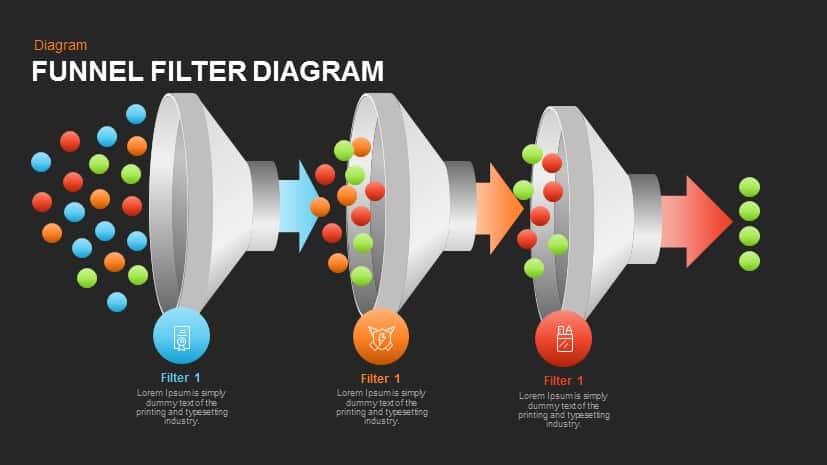
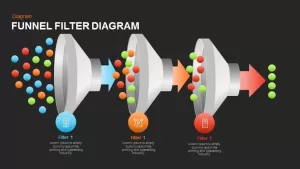
This funnel filter diagram is an ideal tool for illustrating processes or systems where elements are filtered through multiple stages. The design includes three distinct funnel shapes, each representing a filter that progressively narrows down data or content. Colorful dots flow through each funnel, symbolizing various items or steps being refined at each stage. The vibrant color palette—comprising red, blue, green, and orange—helps visually distinguish between different groups or stages of the process. If you’d like to explore more designs, you can check out a wide range of funnel templates available for different business needs.
Each funnel filter is paired with text placeholders and an icon at the bottom, which can be customized to describe specific stages, such as data selection, filtering, or decision-making processes. This makes the diagram perfect for explaining complex workflows, business processes, or customer journeys that involve narrowing down options or evaluating criteria.
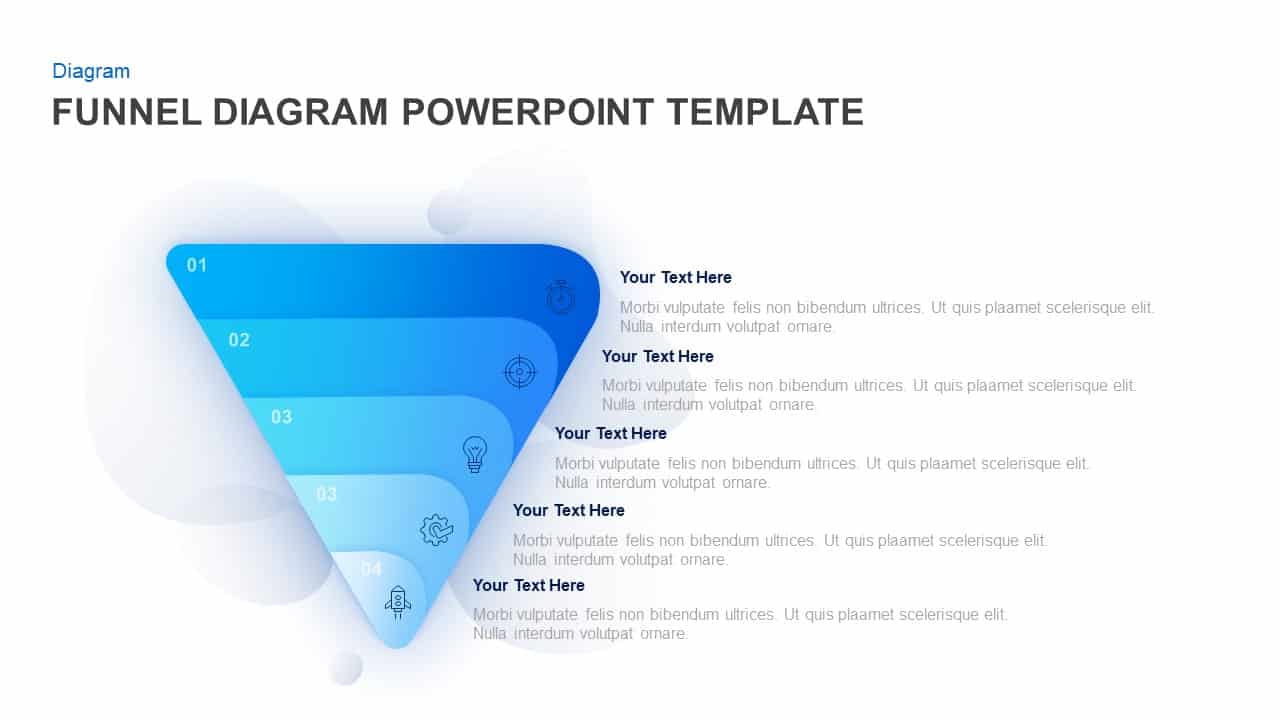
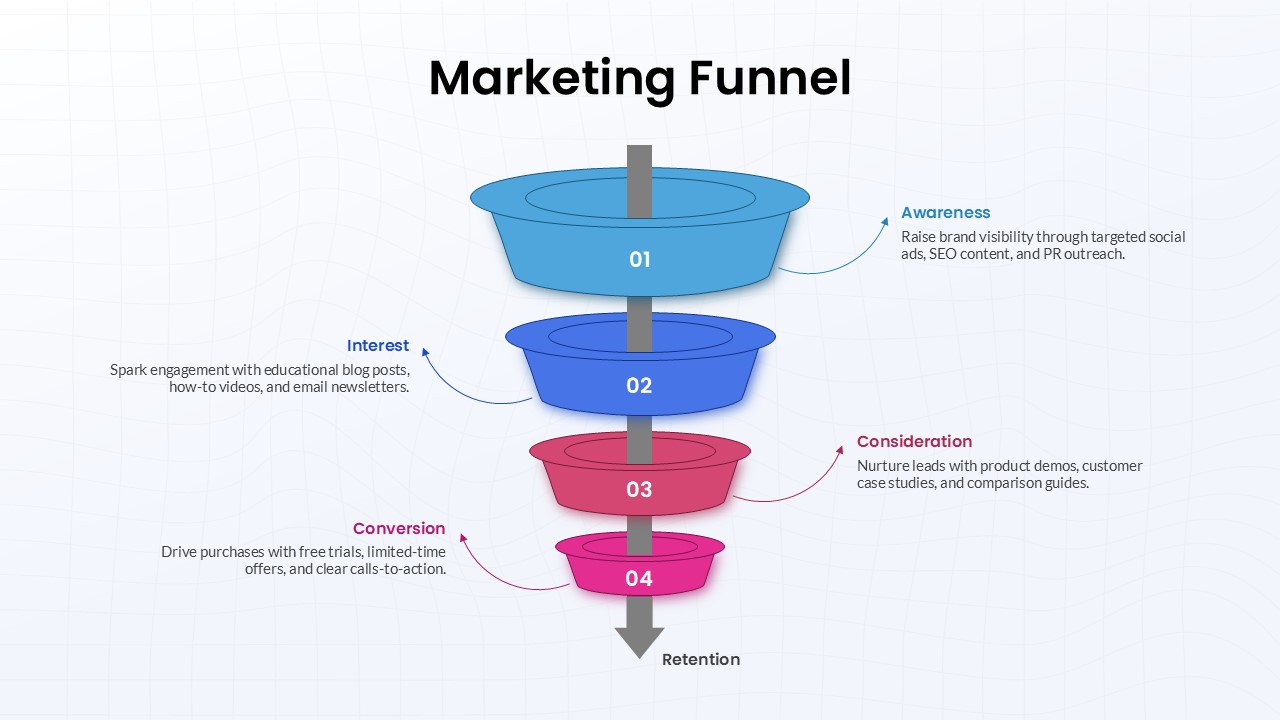
Fully editable in both PowerPoint and Google Slides, this diagram allows you to modify the text, adjust colors, and swap out icons to suit your content. Whether you’re presenting a sales funnel, a product screening process, or a decision-making flow, this diagram is an excellent visual tool for conveying how elements pass through a series of filters. For those looking for a multi-step alternative, the free 3d funnel diagram is another great choice to visualize sequential processes.
Who is it for
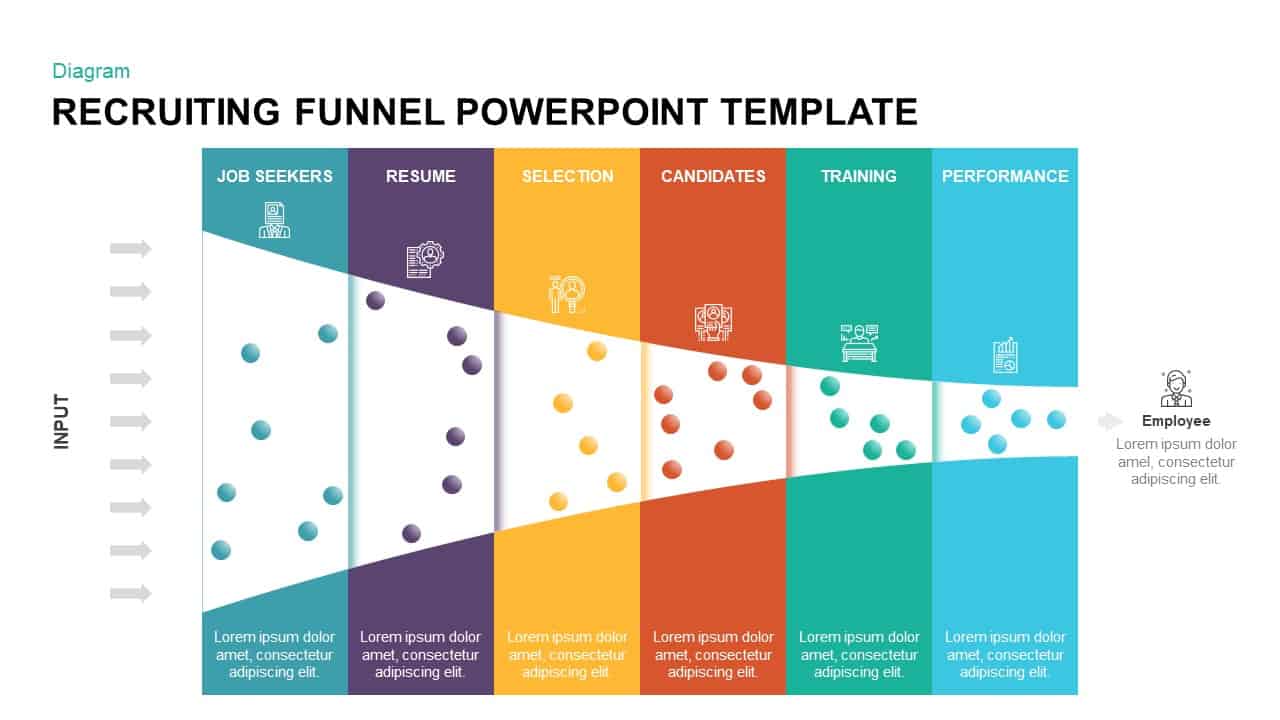
This slide is perfect for business professionals, marketers, project managers, and data analysts who need to present a step-by-step filtering process. It’s ideal for sales teams illustrating a sales funnel, operations teams showcasing a product selection process, or project managers outlining stages of decision-making.
Other Uses
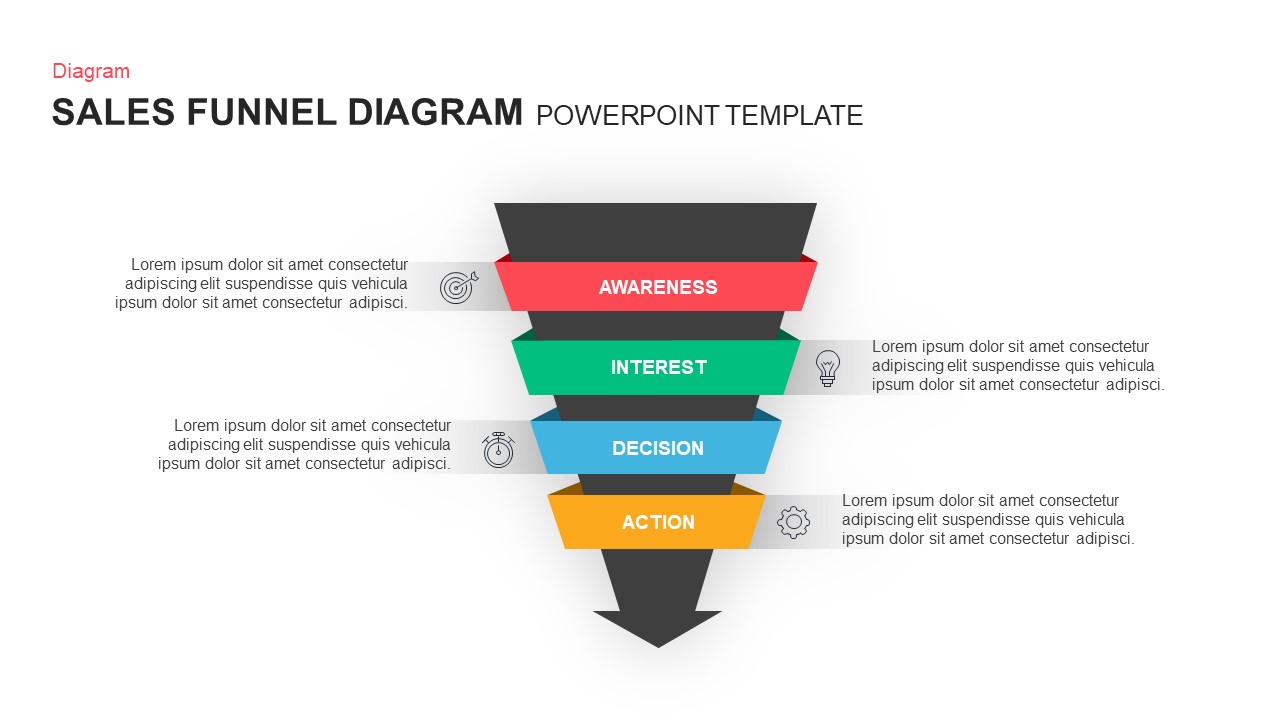
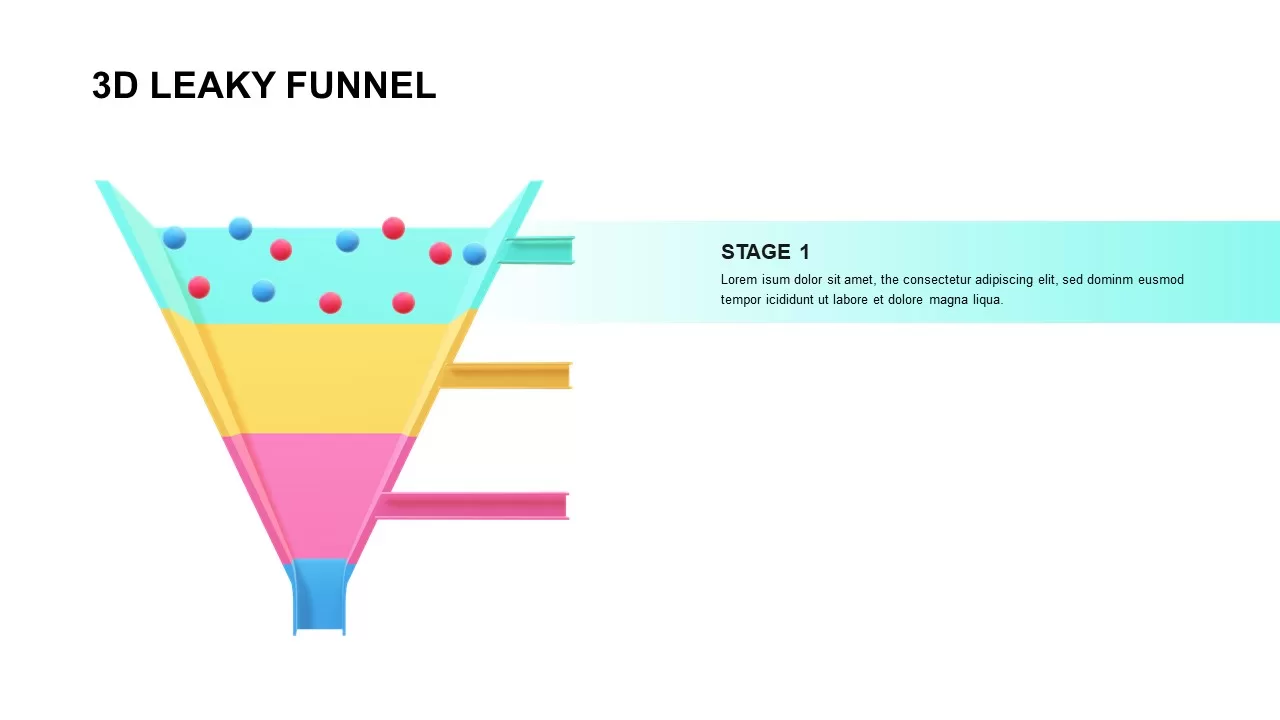
This diagram can be used to illustrate customer segmentation, data filtering, marketing lead generation, or even technical workflows where items are progressively narrowed down. It’s also effective for process optimization, quality control, and performance reviews. Another creative option is the 3D leaky funnel graphic, which works well for showing drop-offs at different funnel stages.
Login to download this file

Item ID
SB00799
Related Templates

Sales Process Workflow Funnel Diagram PowerPoint Template for PowerPoint & Google Slides
Funnel
Business Funnel Diagram template for PowerPoint & Google Slides
Funnel
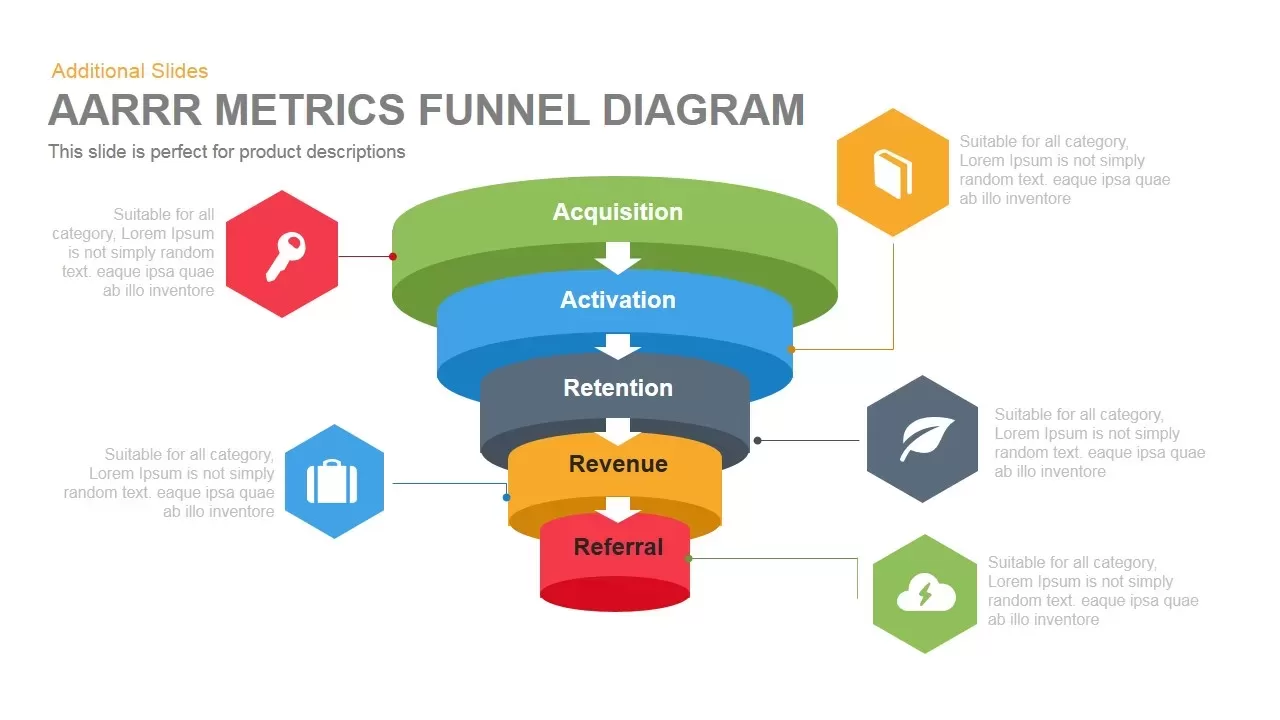
AARRR Funnel Diagram template for PowerPoint & Google Slides
Funnel
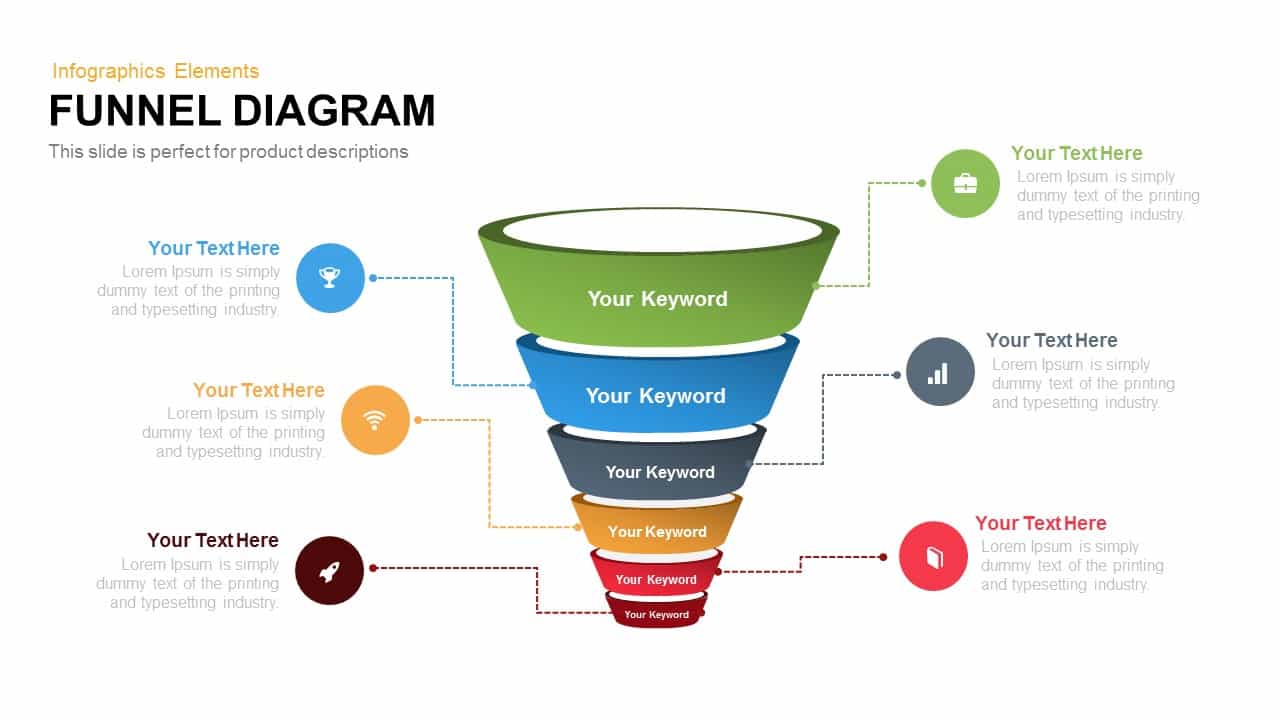
Funnel Diagram Template for PowerPoint & Google Slides
Infographics
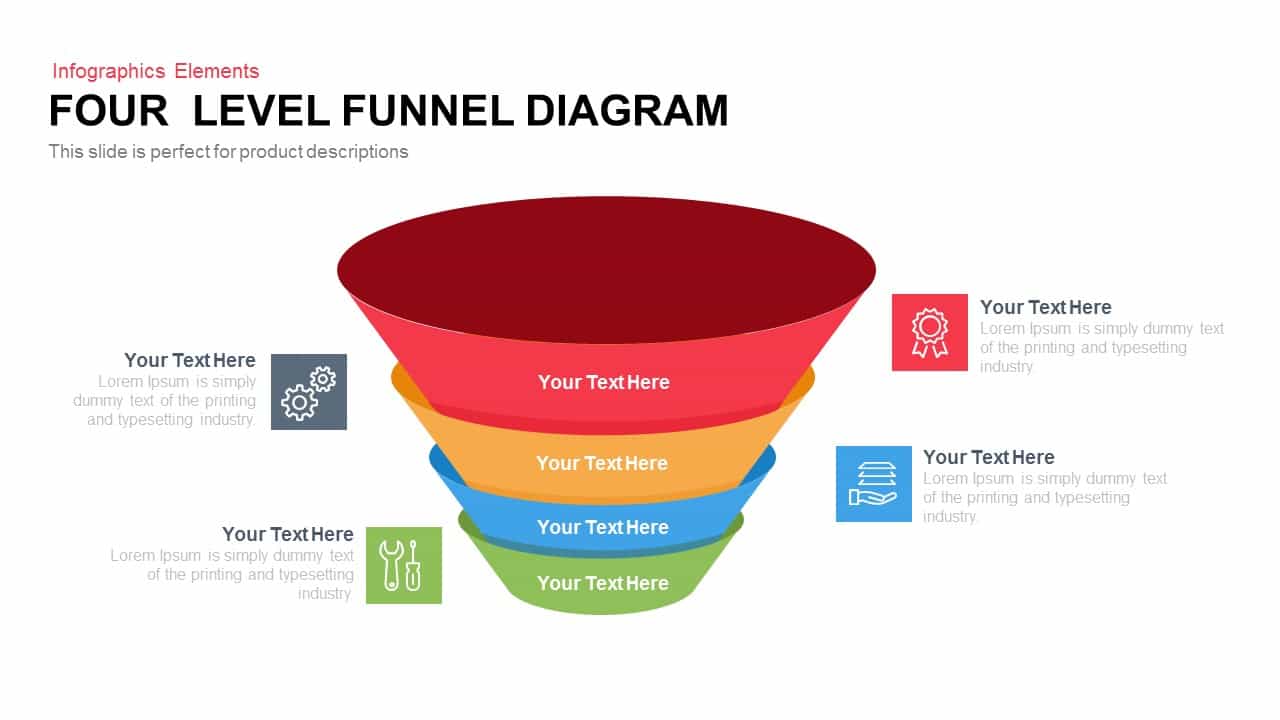
4 Level Funnel Diagram Template for PowerPoint & Google Slides
Funnel
Funnel Diagram template for PowerPoint & Google Slides
Funnel
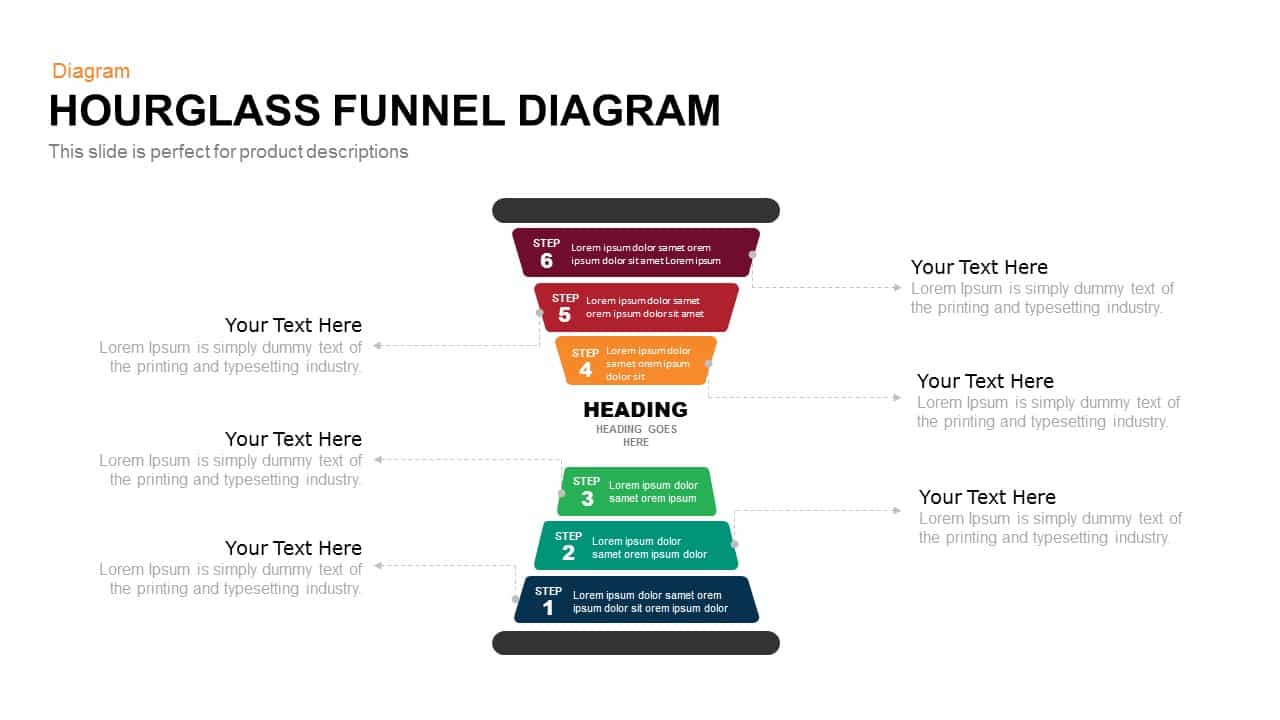
Hourglass Funnel Diagram Process Template for PowerPoint & Google Slides
Funnel
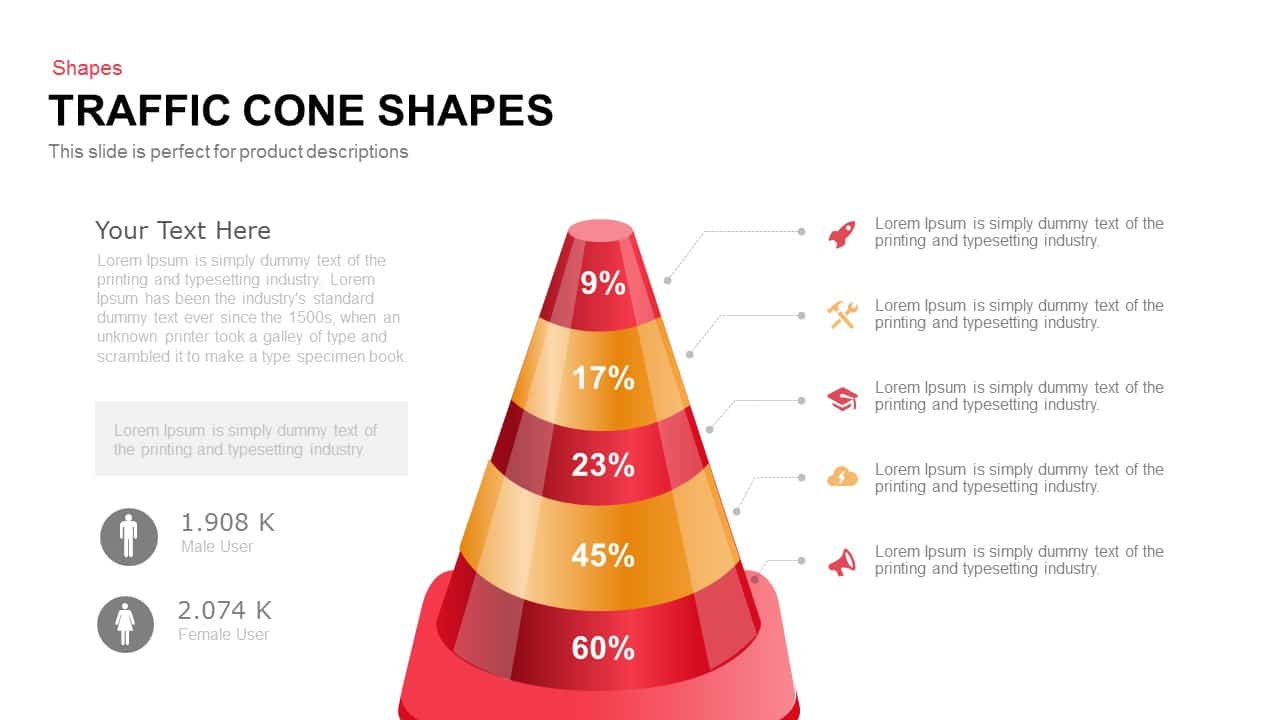
Traffic Cone Funnel Diagram Slide Template for PowerPoint & Google Slides
Funnel
Professional Four-Stage Funnel Diagram Template for PowerPoint & Google Slides
Funnel
Four and Five-Stage Funnel Diagram Template for PowerPoint & Google Slides
Funnel

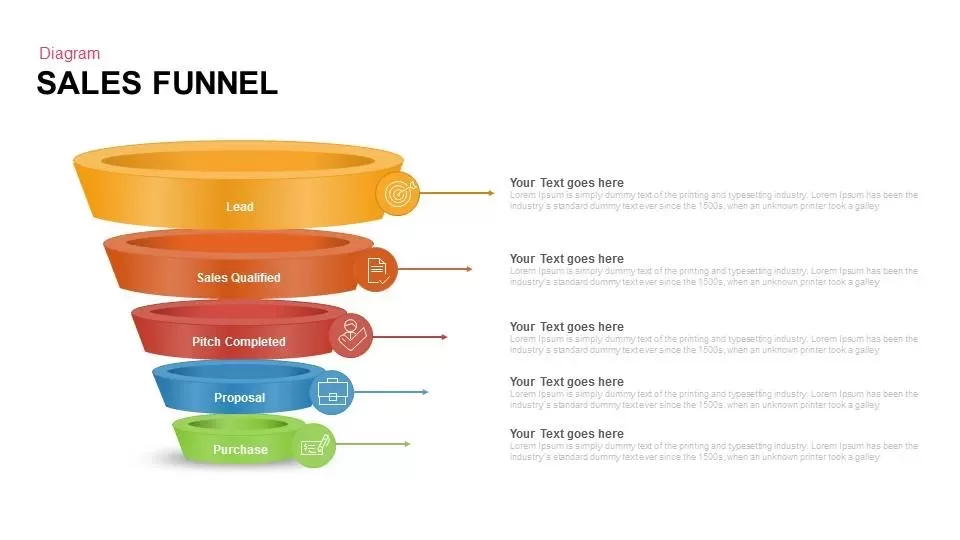
Sales Funnel Diagram for PowerPoint & Google Slides
Marketing Funnel

Five Staged Funnel Diagram for PowerPoint & Google Slides
Funnel
Funnel Flow Diagram template for PowerPoint & Google Slides
Funnel
Nine-Stage 3D Funnel Process Diagram Template for PowerPoint & Google Slides
Funnel
Three Level Funnel Process Diagram Template for PowerPoint & Google Slides
Funnel
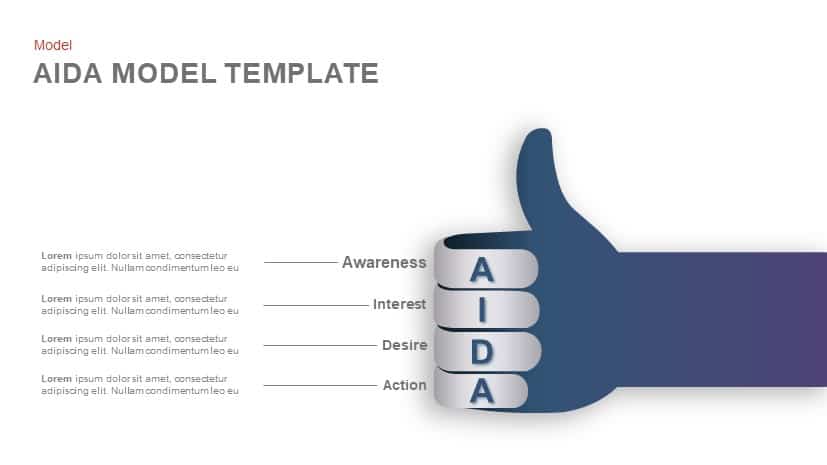
AIDA Model Funnel Thumb Diagram Template for PowerPoint & Google Slides
Process
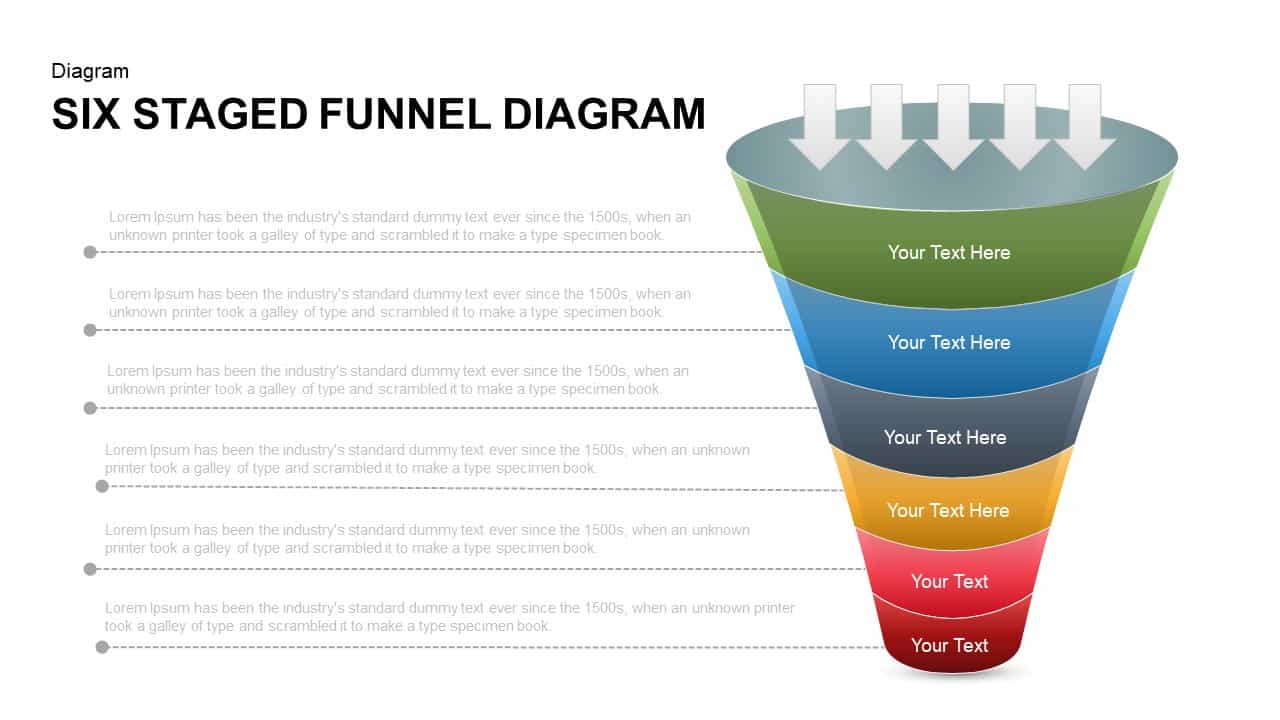
Six Staged Funnel Diagram for PowerPoint & Google Slides
Funnel
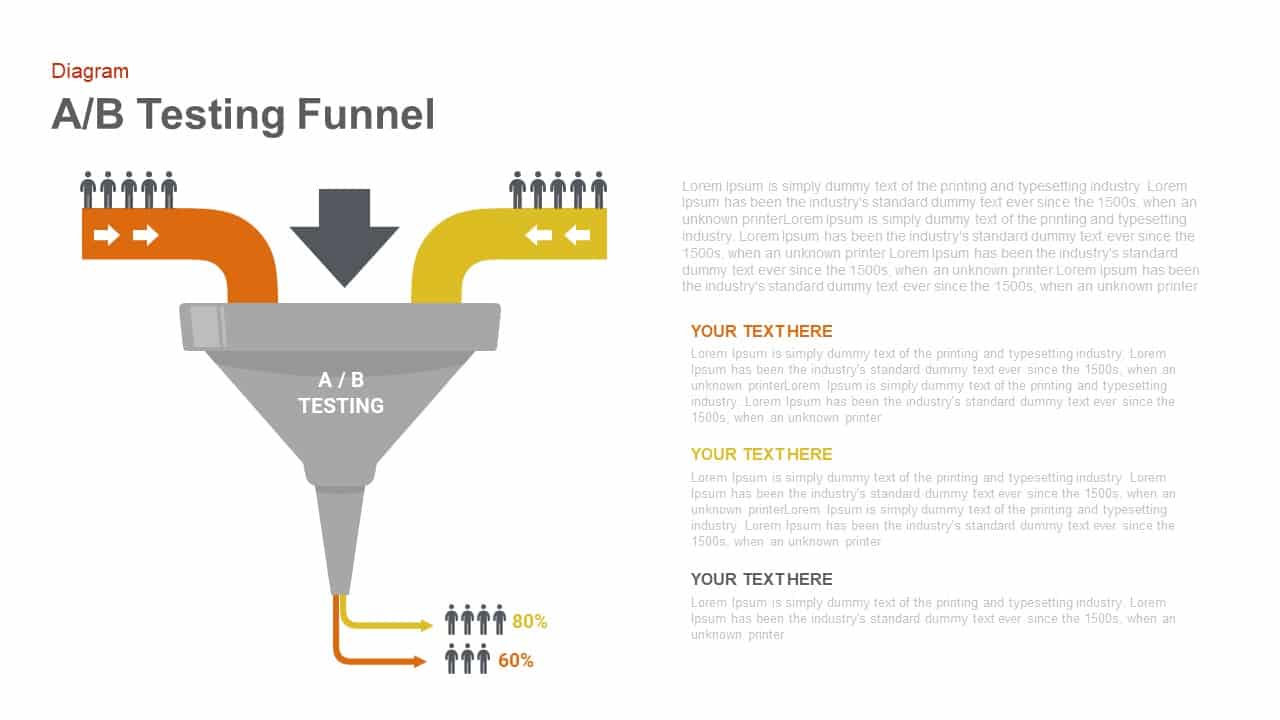
A/B Testing Funnel Diagram Template for PowerPoint & Google Slides
Digital Marketing
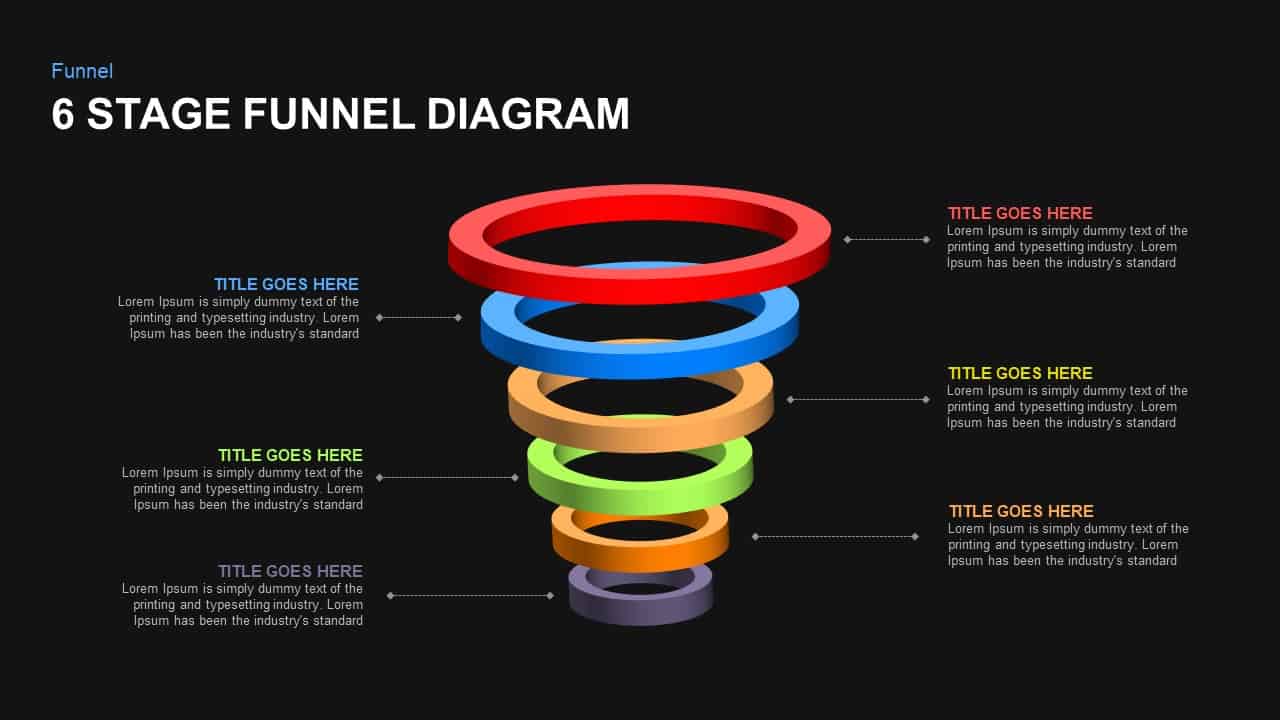
6-Stage Funnel Diagram Infographic Template for PowerPoint & Google Slides
Funnel
3D Conversion Funnel Diagram Infographic Template for PowerPoint & Google Slides
Funnel
Animated Recruiting Funnel Diagram Template for PowerPoint & Google Slides
Funnel
Professional Sales Funnel Diagram Template for PowerPoint & Google Slides
Funnel
Five-Step Gradient Blue Funnel Diagram Template for PowerPoint & Google Slides
Funnel
Four-Stage Funnel Diagram Infographic Template for PowerPoint & Google Slides
Funnel
Four-Step Spiral Funnel Diagram Template for PowerPoint & Google Slides
Funnel
5-Step Colorful Funnel Diagram Template for PowerPoint & Google Slides
Funnel
Four-Stage Funnel Diagram Infographic Template for PowerPoint & Google Slides
Funnel
4 Level Sales Funnel Diagram Design for PowerPoint & Google Slides
Marketing Funnel
Sales Funnel Infographic Diagram Template for PowerPoint & Google Slides
Funnel
Free 4-Step 3D Funnel Diagram Template for PowerPoint & Google Slides
Funnel
Free
3D Funnel Diagram Infographics for PowerPoint & Google Slides
Funnel
3D Leaky Funnel Diagram template for PowerPoint & Google Slides
Funnel
5A’s Customer Path Funnel Diagram Template for PowerPoint & Google Slides
Funnel
Demand Generation Funnel Diagram Template for PowerPoint & Google Slides
Funnel
Double Funnel Lifecycle Diagram Template for PowerPoint & Google Slides
Funnel
New Product Development Funnel Diagram Template for PowerPoint & Google Slides
Funnel
Free Business Development Funnel Diagram Template for PowerPoint & Google Slides
Marketing Funnel
Free
Process Overview Funnel Diagram Template for PowerPoint & Google Slides
Funnel
Dagmar Model Marketing Funnel Diagram Template for PowerPoint & Google Slides
Funnel
Horizontal Funnel Diagram Process Template for PowerPoint & Google Slides
Funnel
Closed Innovation Model Funnel Diagram Template for PowerPoint & Google Slides
Funnel
Modern 8-Stage Funnel Process Diagram Template for PowerPoint & Google Slides
Funnel
AIDAS Customer Journey Funnel Diagram Template for PowerPoint & Google Slides
Marketing Funnel
Sales Enablement Funnel diagram for PowerPoint & Google Slides
Funnel
Innovation Funnel Process Diagram Template for PowerPoint & Google Slides
Funnel
Demand Generation Funnel Process Diagram Template for PowerPoint & Google Slides
Funnel
Five-Step Modern Funnel Diagram Template for PowerPoint & Google Slides
Funnel
Four-Stage Marketing Funnel Diagram Template for PowerPoint & Google Slides
Marketing Funnel
5 Stage Sales Funnel Diagram Template for PowerPoint & Google Slides
Funnel

Innovation Ambition Matrix & Funnel Strategy Slides for PowerPoint & Google Slides
Process
Marketing Lead Generation Process Funnel PowerPoint Template for PowerPoint & Google Slides
Funnel
Funnel Flow Stage Infographics template for PowerPoint & Google Slides
Funnel
Professional 3D Funnel Infographic Template for PowerPoint & Google Slides
Funnel
E-commerce Purchase Funnel Report template for PowerPoint & Google Slides
Funnel
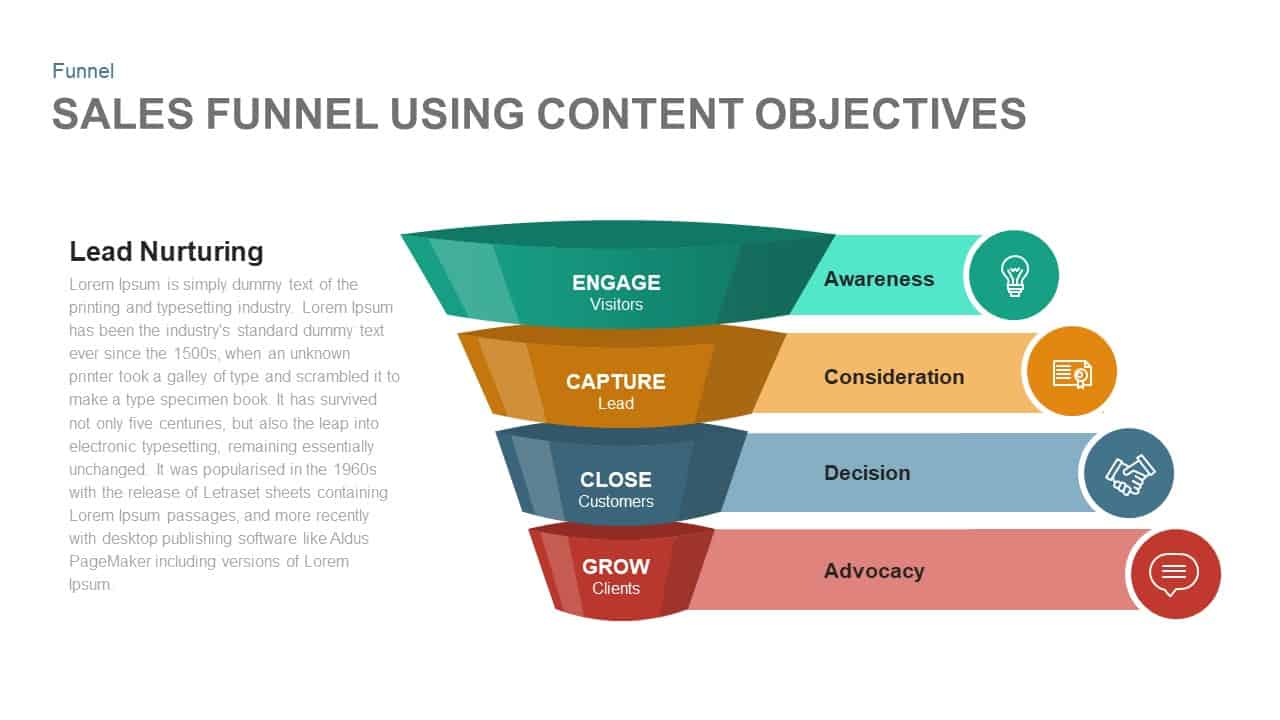
Sales Funnel Using Content Objectives Template for PowerPoint & Google Slides
Funnel
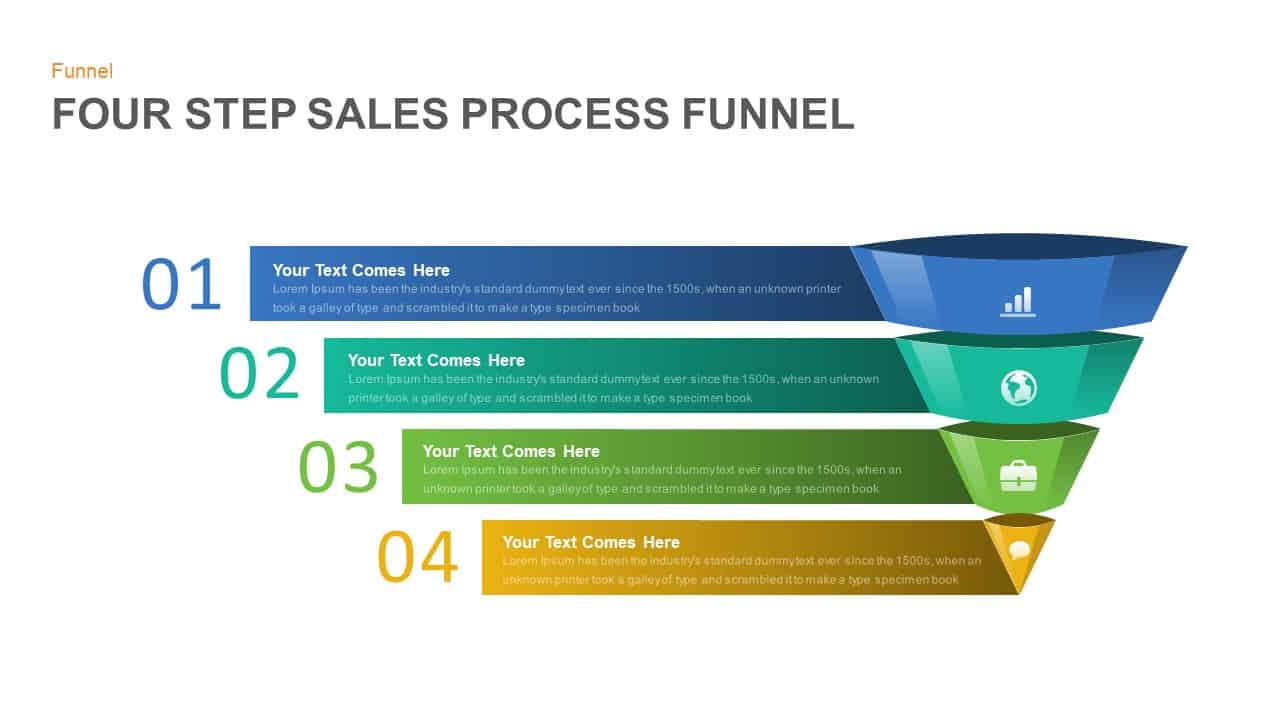
Four Step Sales Process Funnel Template for PowerPoint & Google Slides
Funnel
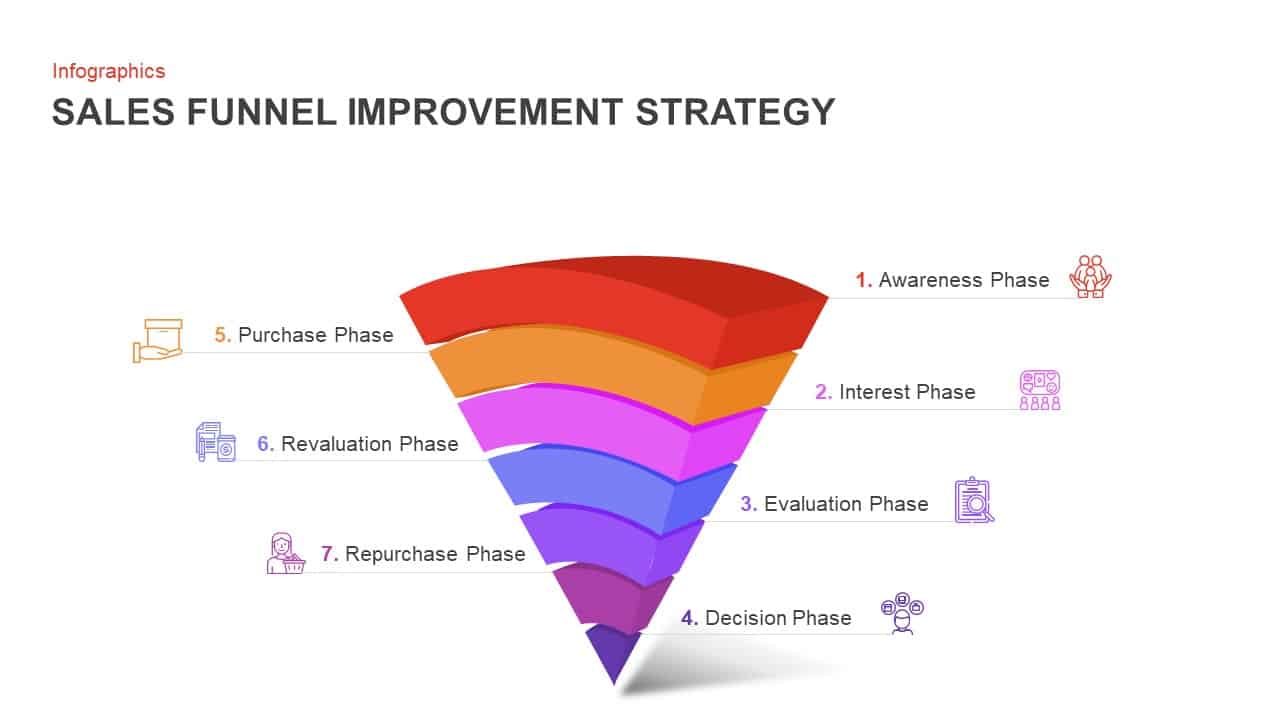
7-Step Sales Funnel Improvement Strategy Template for PowerPoint & Google Slides
Infographics
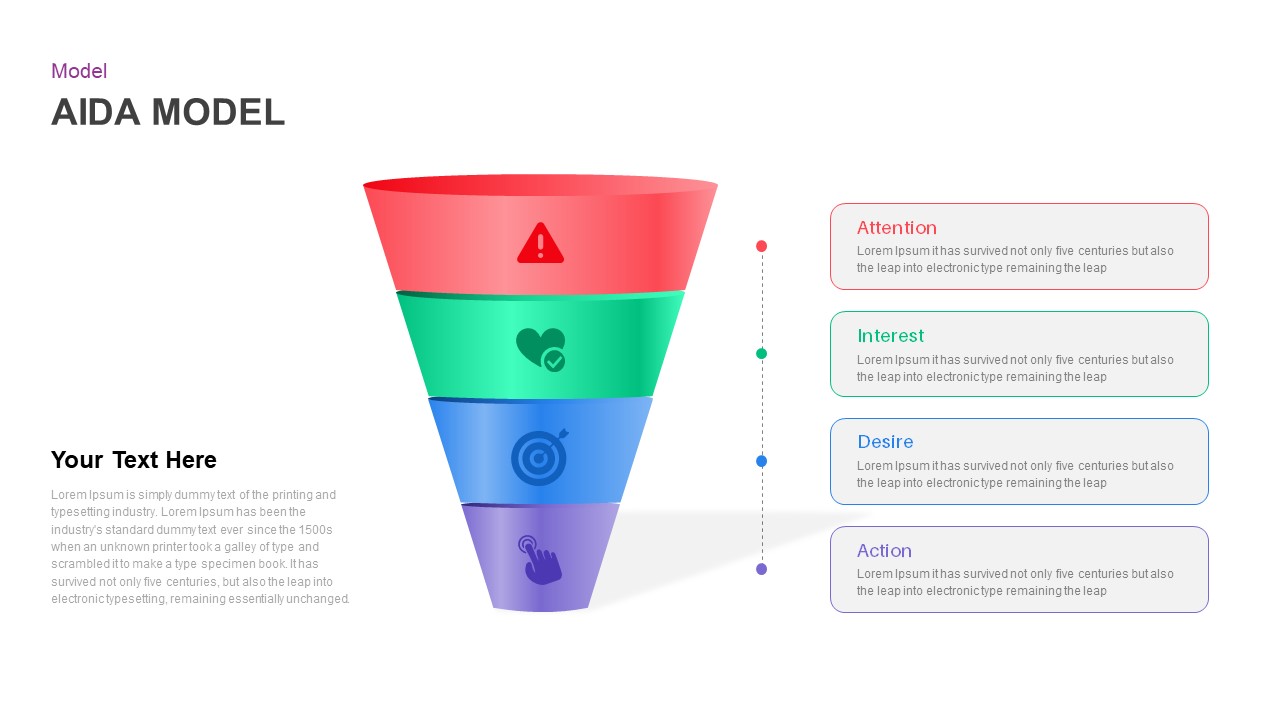
AIDA Marketing Funnel Model Template for PowerPoint & Google Slides
Marketing
Gradient 5-Stage Funnel Infographic Template for PowerPoint & Google Slides
Funnel
Recruitment Process Funnel Infographics Template for PowerPoint & Google Slides
Recruitment
Five-Stage Marketing Funnel Infographic Template for PowerPoint & Google Slides
Funnel
Lead Generation Funnel Metaphor Template for PowerPoint & Google Slides
Marketing Funnel
Four-Step Funnel Infographic Pack Template for PowerPoint & Google Slides
Funnel
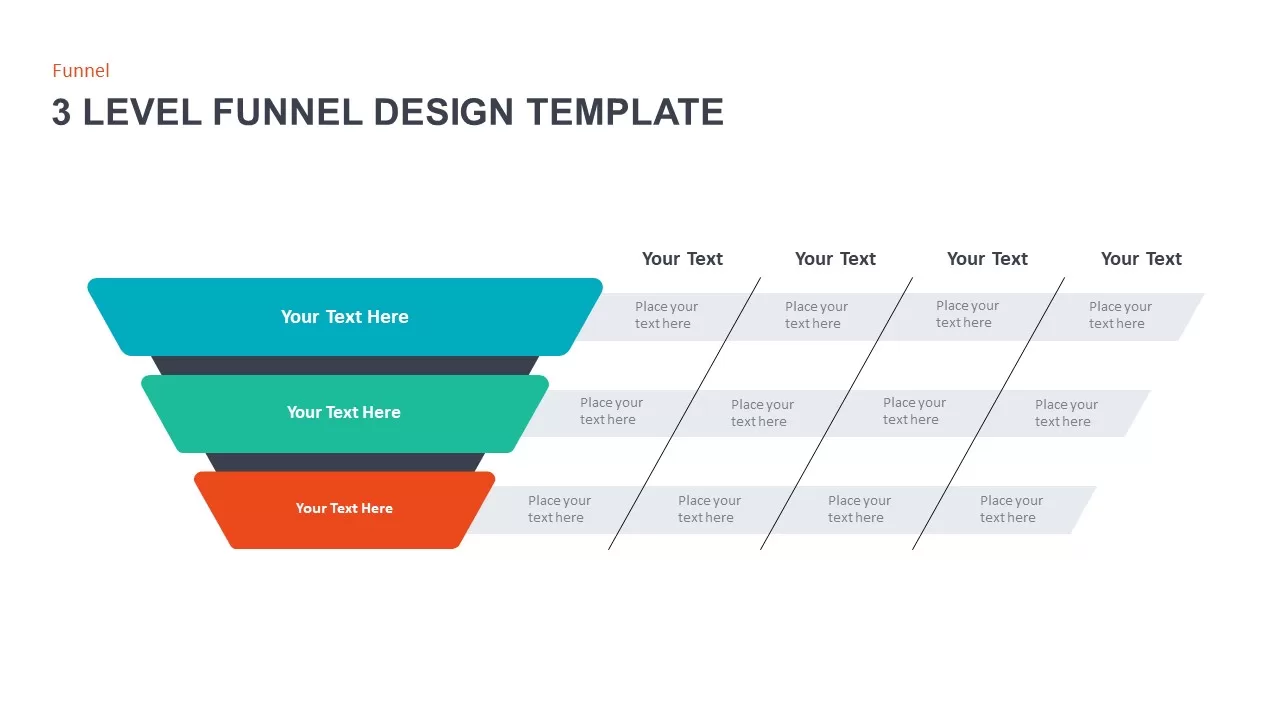
3 Level Funnel Design Visualization Template for PowerPoint & Google Slides
Funnel
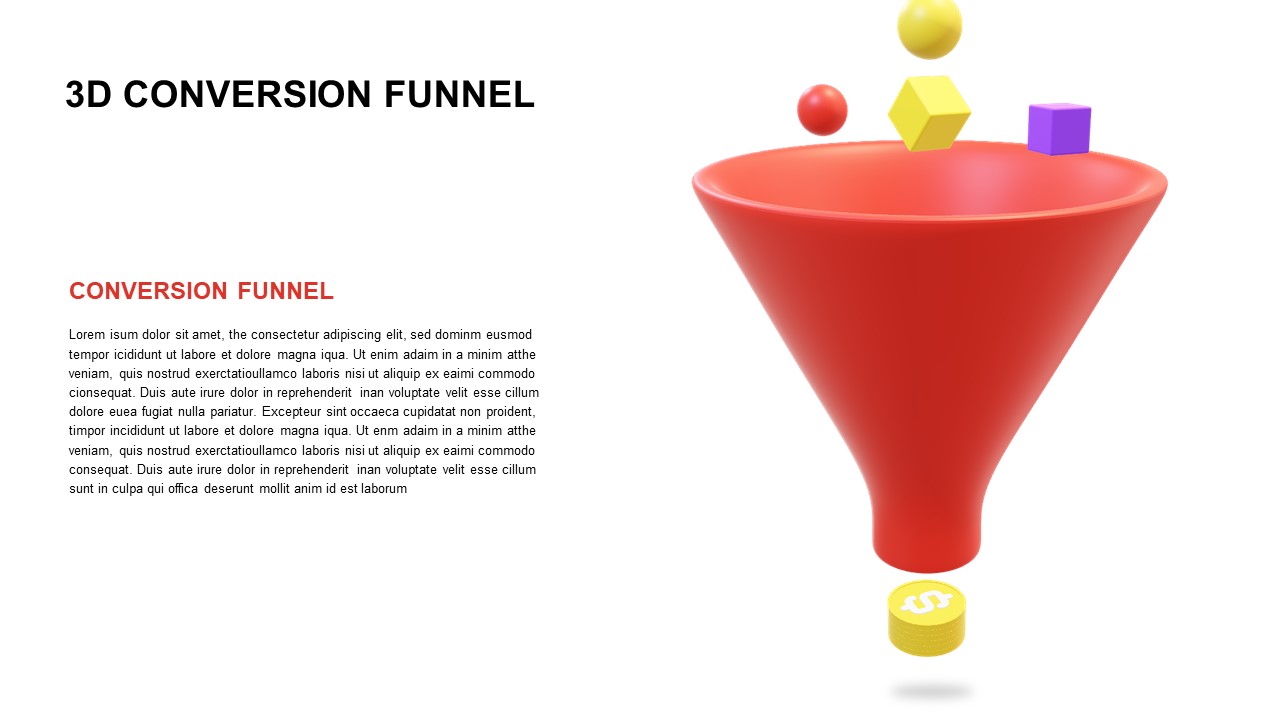
Free 3D Conversion Funnel Overview template for PowerPoint & Google Slides
Funnel
Free
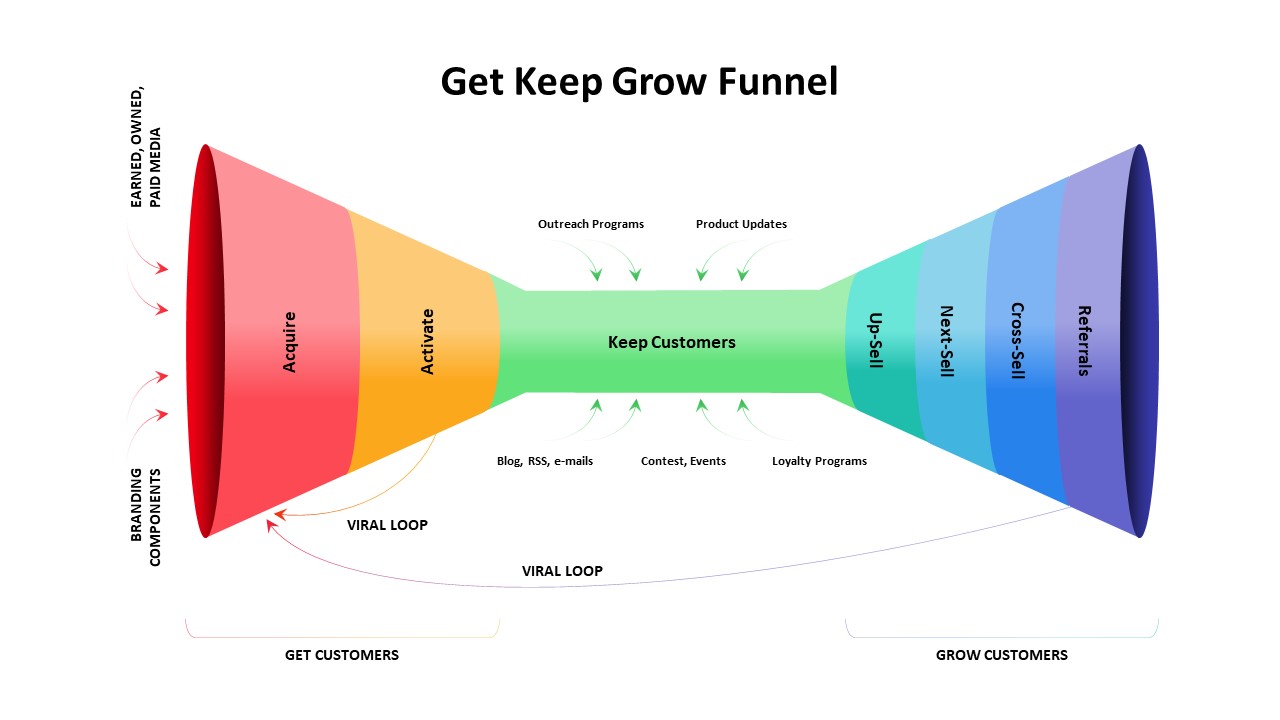
Get Keep Grow Customer Funnel Lifecycle Template for PowerPoint & Google Slides
Funnel
Project Management Funnel template for PowerPoint & Google Slides
Project
Bow Tie Customer Funnel Presentation Template for PowerPoint & Google Slides
Funnel
Free Multi-Step Funnel Infographic Slide Pack Template for PowerPoint & Google Slides
Funnel
Free
Inverted Sales Funnel Marketing Stages Template for PowerPoint & Google Slides
Marketing Funnel
Sandler Pain Funnel Sales Qualification Template for PowerPoint & Google Slides
Funnel
8 Stage Funnel Process template for PowerPoint & Google Slides
Funnel
TOFU-MOFU-BOFU Marketing Funnel Template for PowerPoint & Google Slides
Funnel
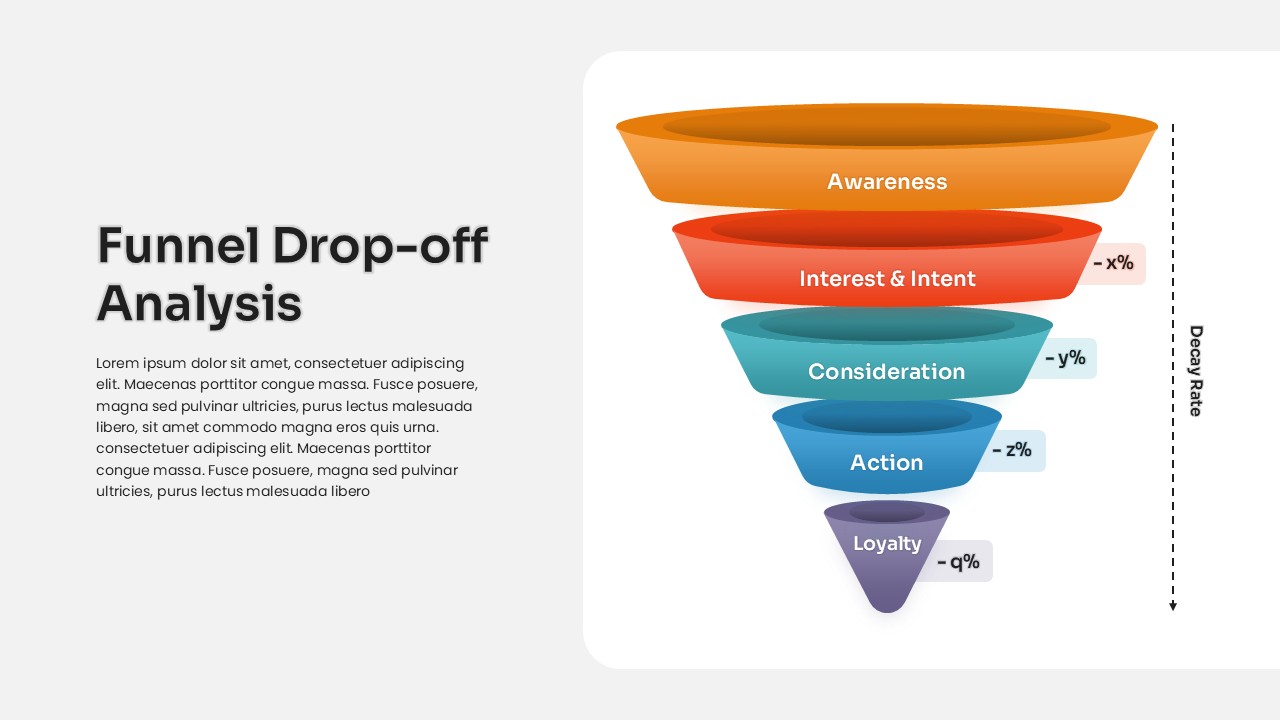
Funnel Drop-off Analysis template for PowerPoint & Google Slides
Business
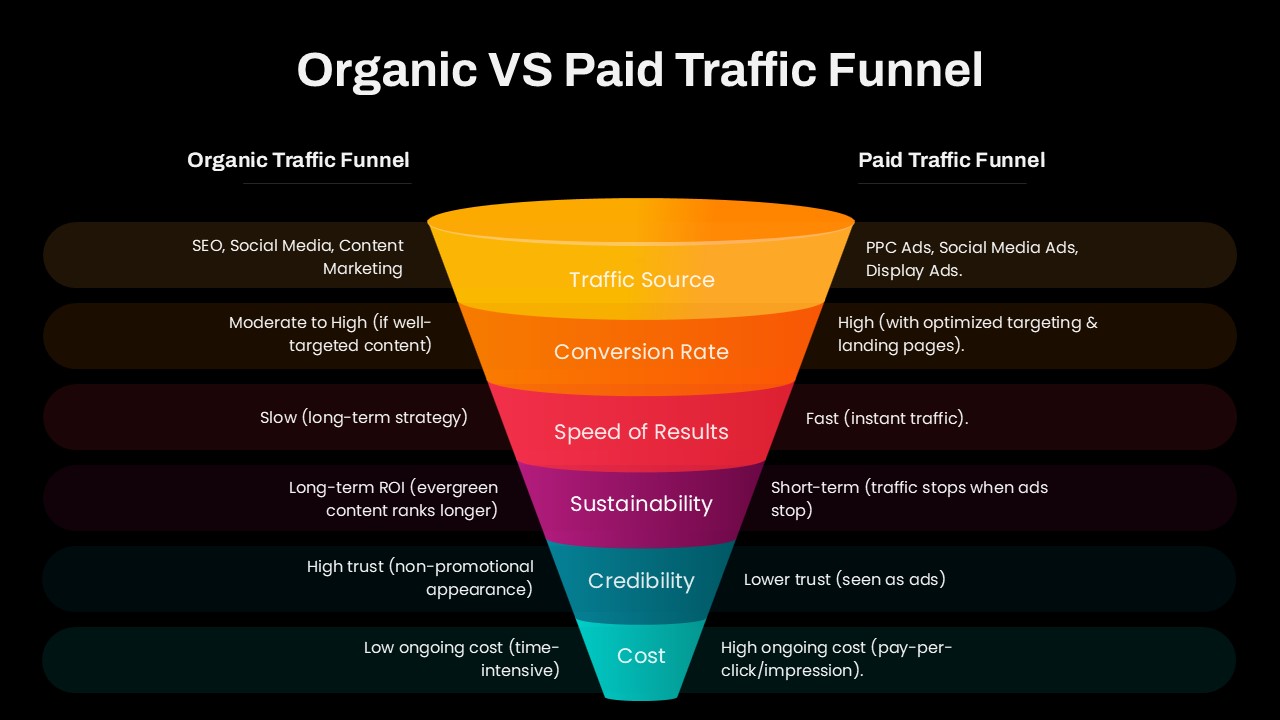
Organic vs Paid Traffic Funnel Template for PowerPoint & Google Slides
Marketing Funnel

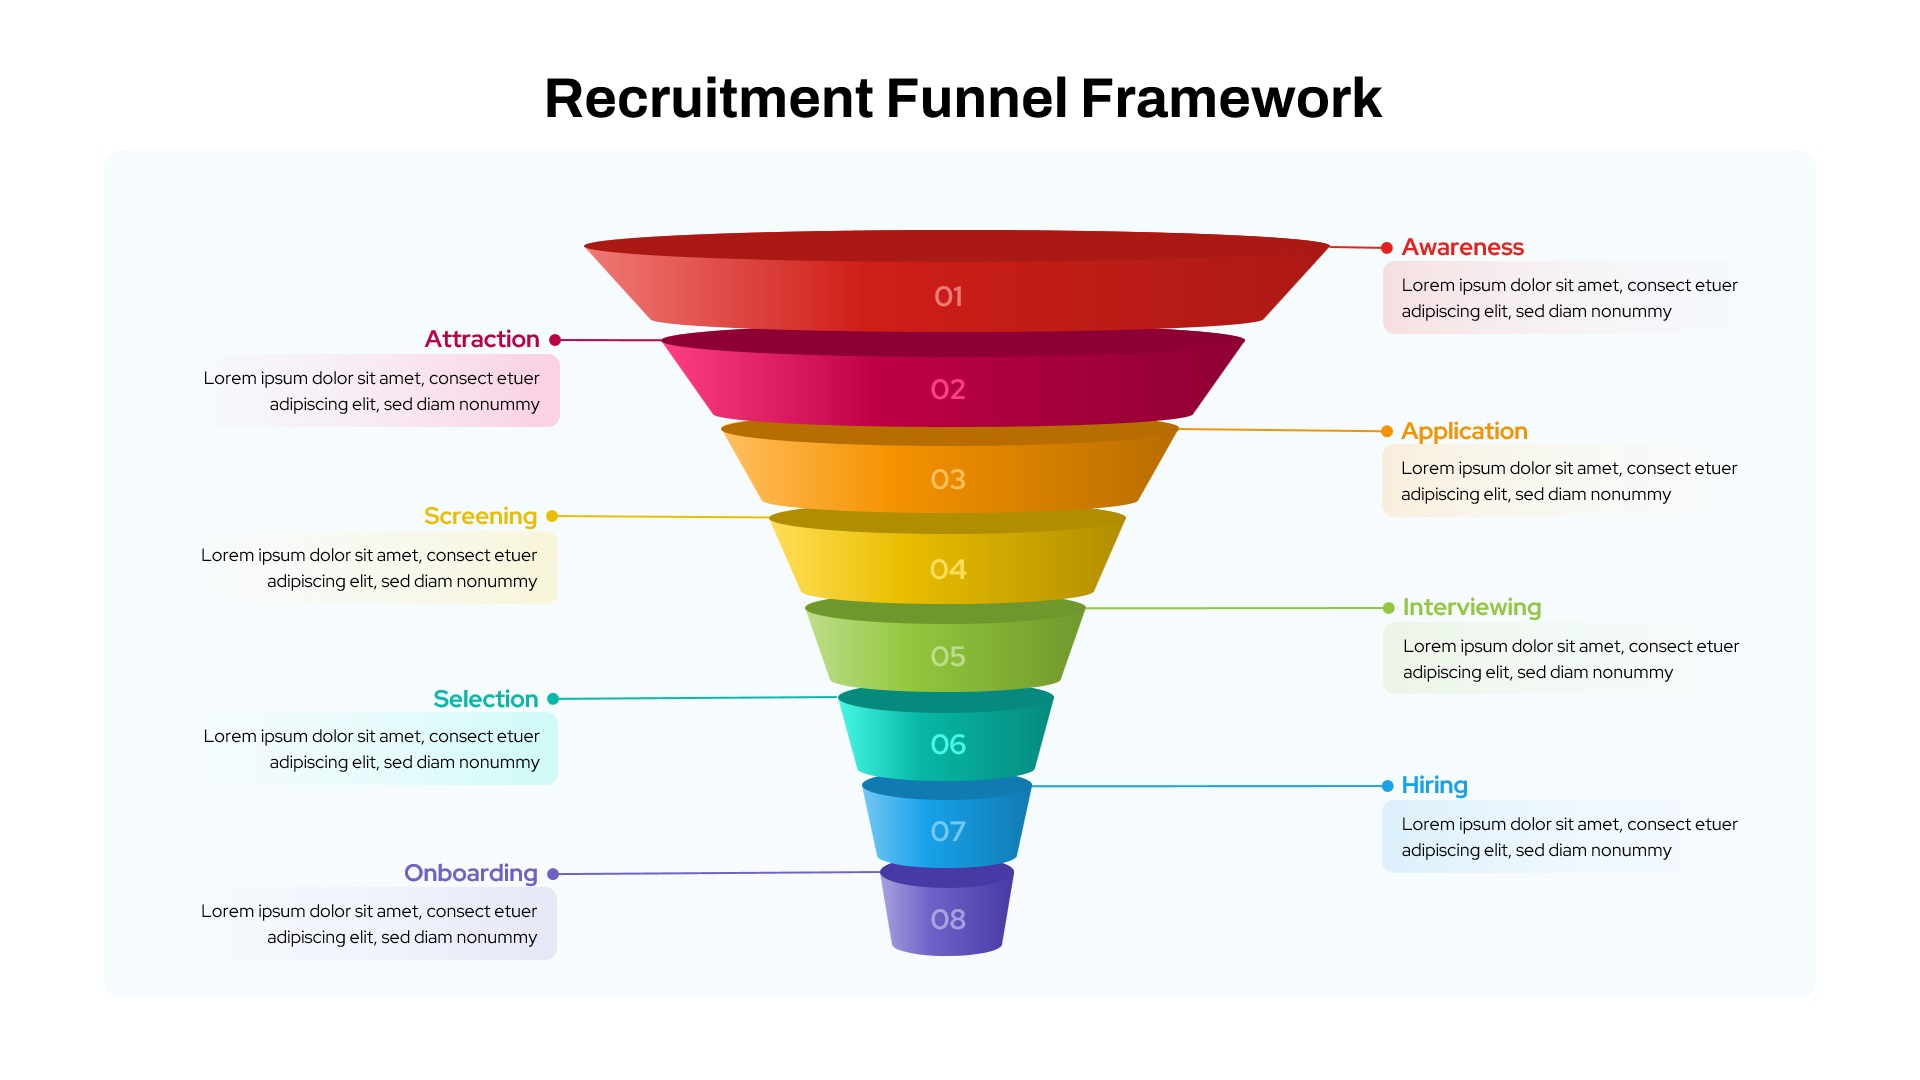
Recruitment Funnel Framework template for PowerPoint & Google Slides
Recruitment
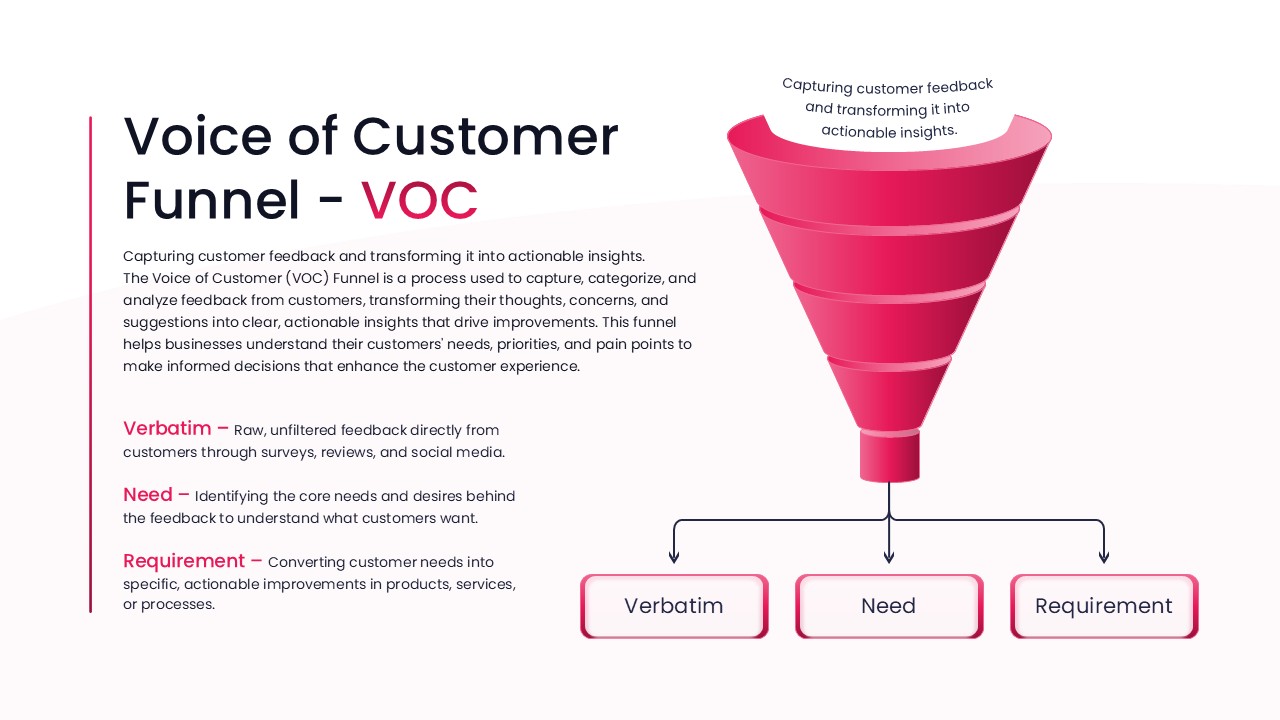
Voice of Customer Funnel (VOC) template for PowerPoint & Google Slides
Marketing
Pirate Metrics AARRR Funnel Framework Template for PowerPoint & Google Slides
Funnel
Top Down Bottom Up Converging Funnel for PowerPoint & Google Slides
Funnel
Funnel and Flywheel Thinking Comparison template for PowerPoint & Google Slides
Infographics
Project Management Funnel Template for PowerPoint & Google Slides
Funnel
Hiring Funnel Timeline with Six Phases Template for PowerPoint & Google Slides
Recruitment
Four-Stage Marketing Funnel Template for PowerPoint & Google Slides
Marketing Funnel
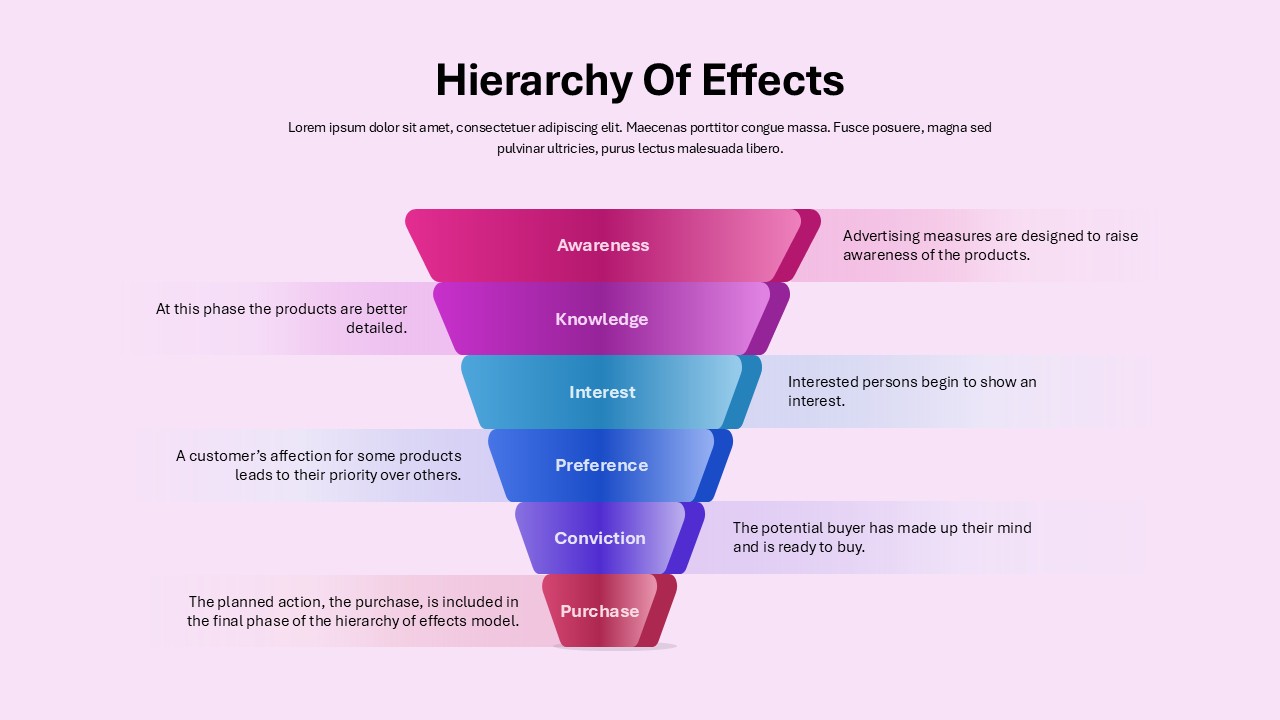
Marketing Funnel Hierarchy of Effects Template for PowerPoint & Google Slides
Marketing Funnel
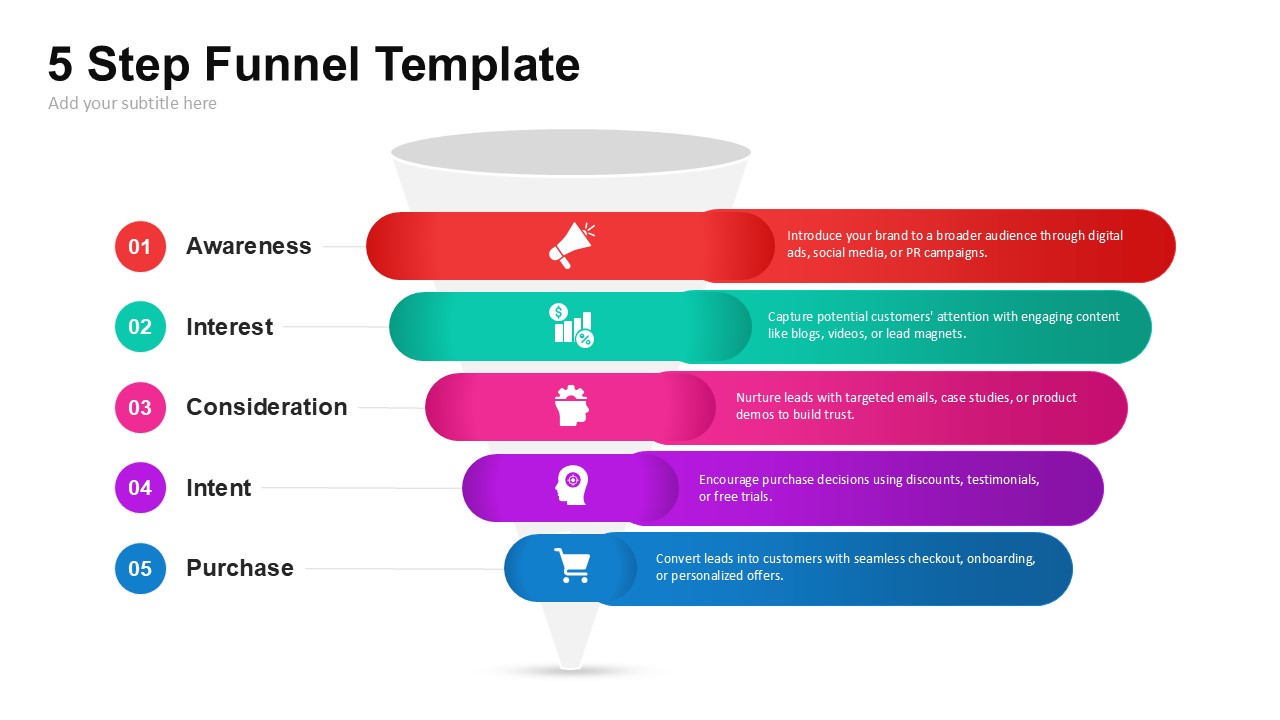
5-Step Marketing Funnel Template for PowerPoint & Google Slides
Marketing Funnel
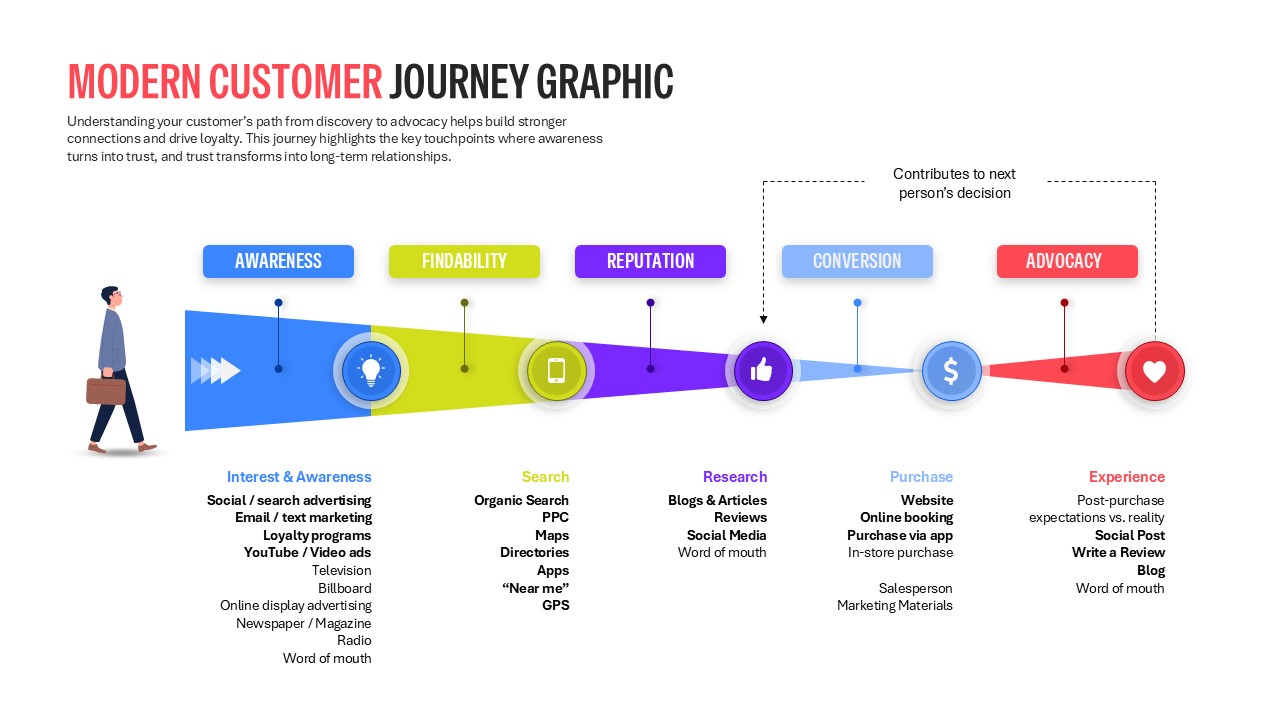
Modern Customer Journey Graphic Funnel Template for PowerPoint & Google Slides
Customer Journey
Snake Diagram Pack of 8 Slides template for PowerPoint & Google Slides
Process
Gear Process Diagram PowerPoint Template for PowerPoint & Google Slides
Process
Puzzle Diagram PowerPoint Template for PowerPoint & Google Slides
Process
Transportation Logistics PowerPoint Diagram template for PowerPoint & Google Slides
Process
Emoji Scale PowerPoint Diagram for PowerPoint & Google Slides
Infographics
4 Step Problem Solving PowerPoint Diagram for PowerPoint & Google Slides
Process
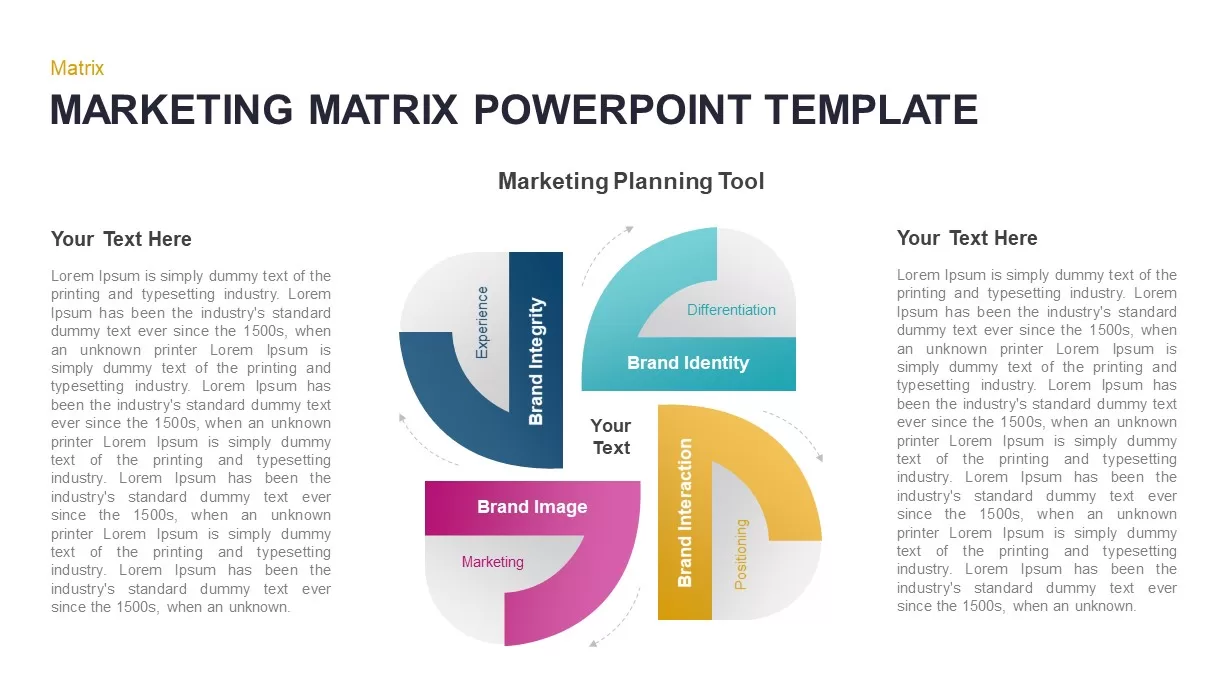
Marketing Matrix Brand Quadrant Diagram Template for PowerPoint & Google Slides
Process
Circular CRM Process Infographic Diagram Template for PowerPoint & Google Slides
Circular
Four-Phase Maturity Model Diagram Template for PowerPoint & Google Slides
Process
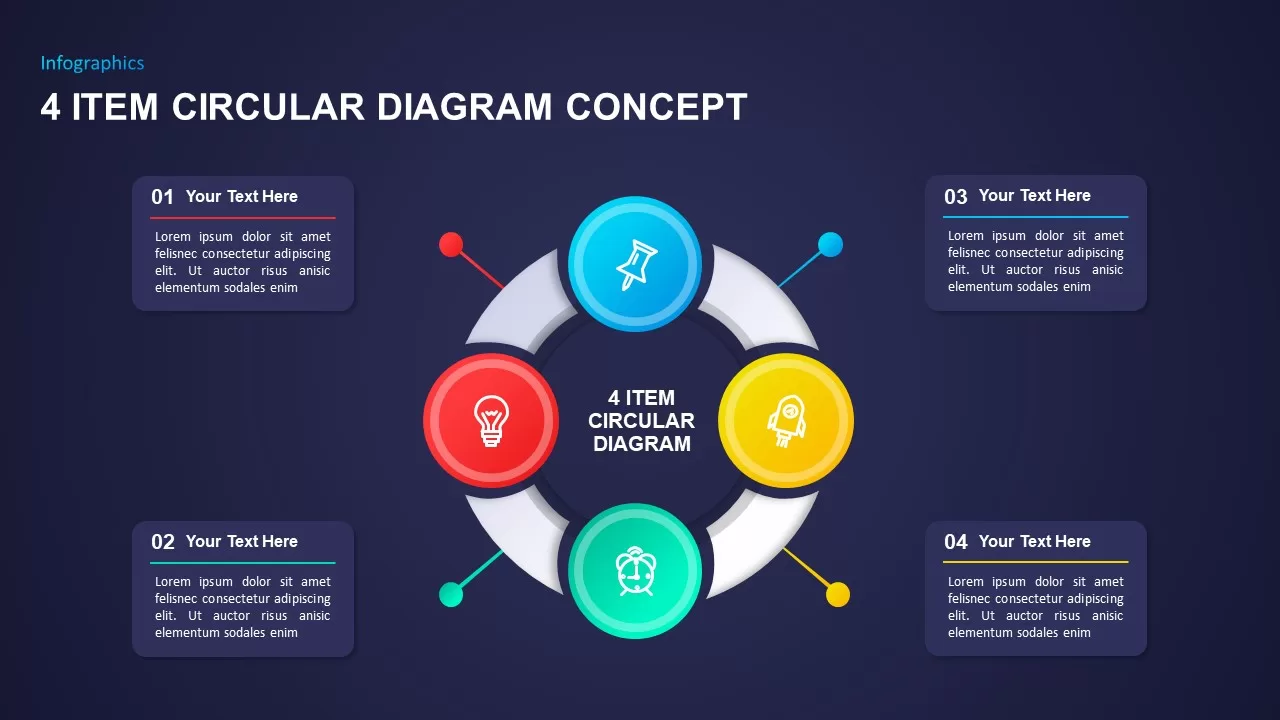
Four-Item Circular Diagram Concept Template for PowerPoint & Google Slides
Circular
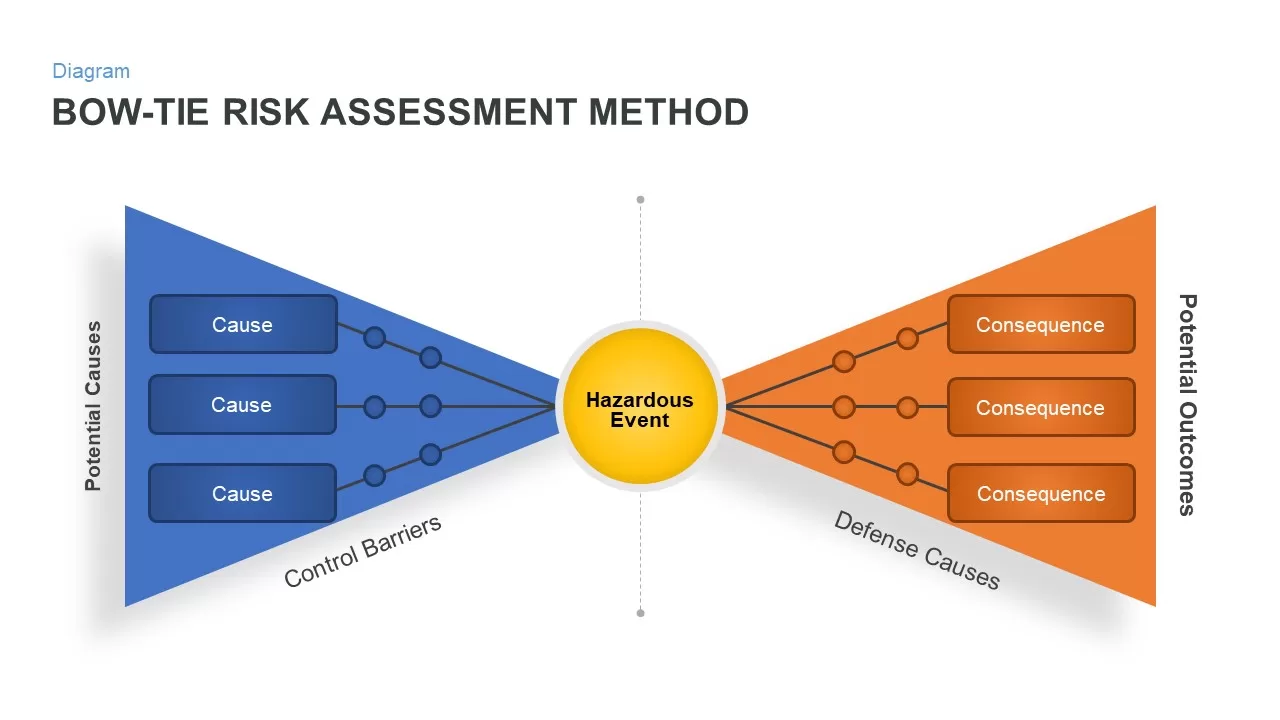
Bow-Tie Risk Assessment Diagram Template for PowerPoint & Google Slides
Risk Management
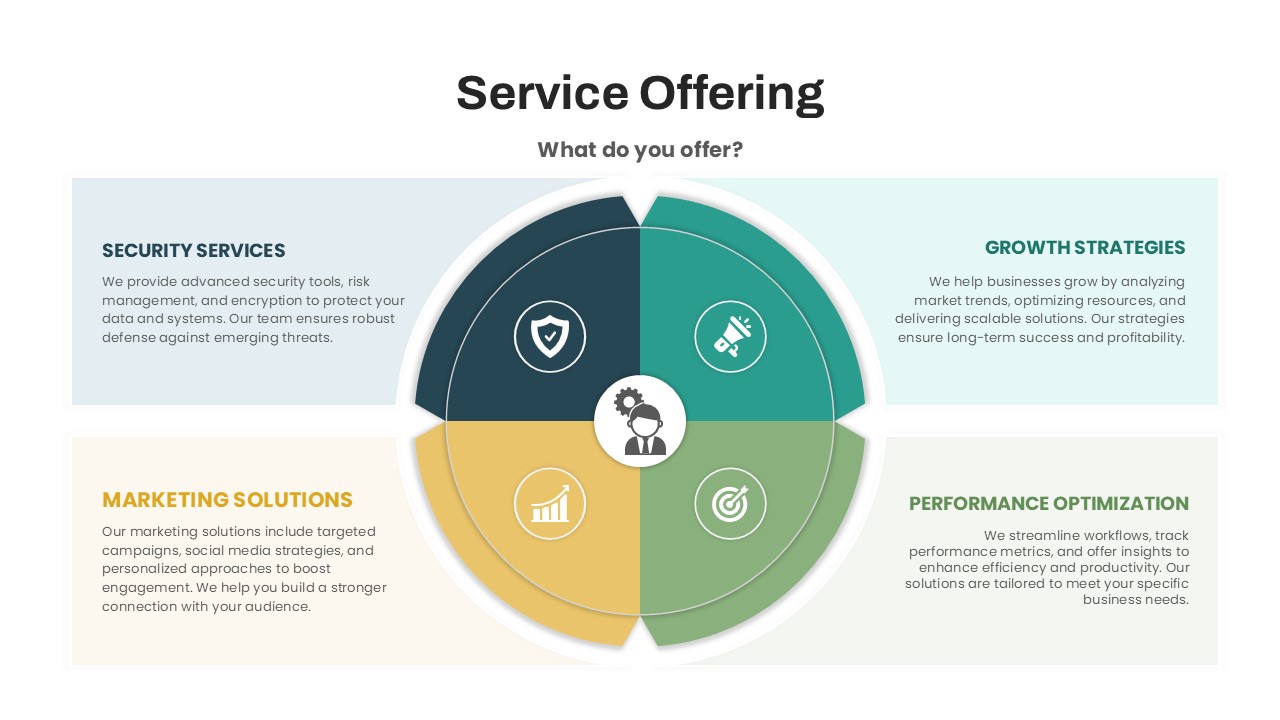
Circular Service Offering Diagram Template for PowerPoint & Google Slides
Circular
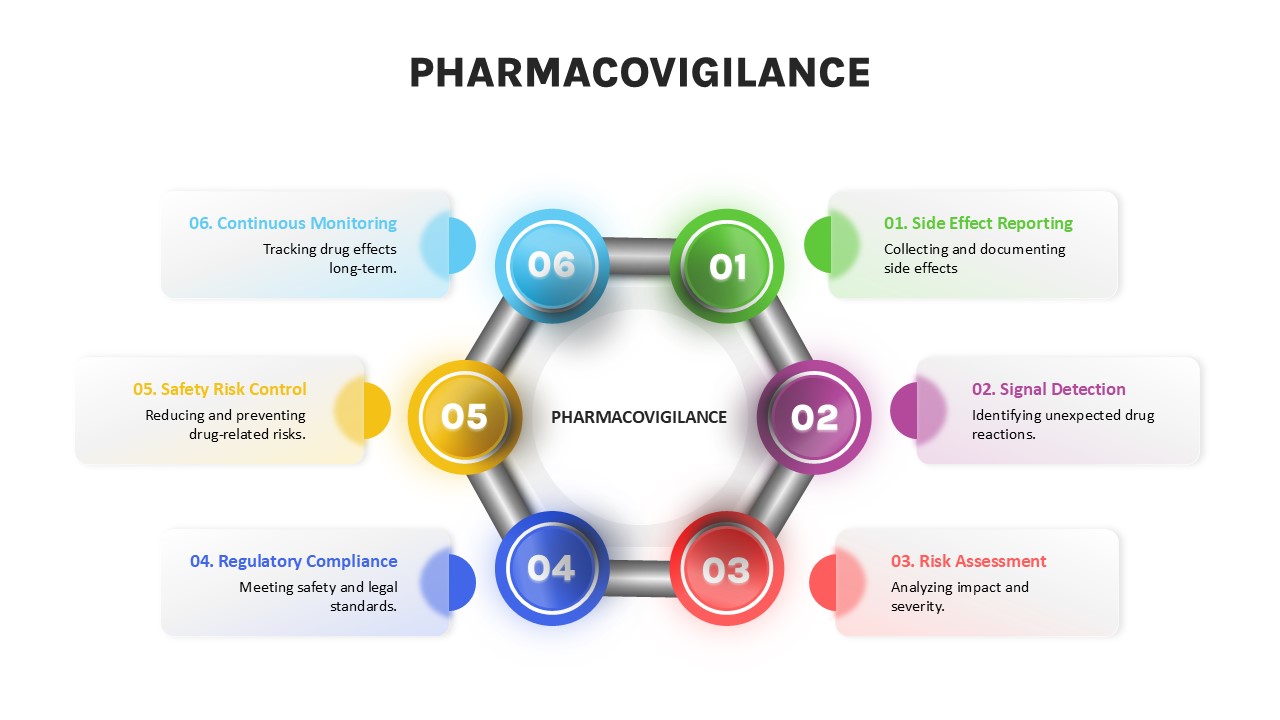
Pharmacovigilance Process Diagram Template for PowerPoint & Google Slides
Process
14 Steps Circular Process Diagram Template for PowerPoint & Google Slides
Circular