Free Editable U.S. Map with Regional Metrics Template for PowerPoint & Google Slides

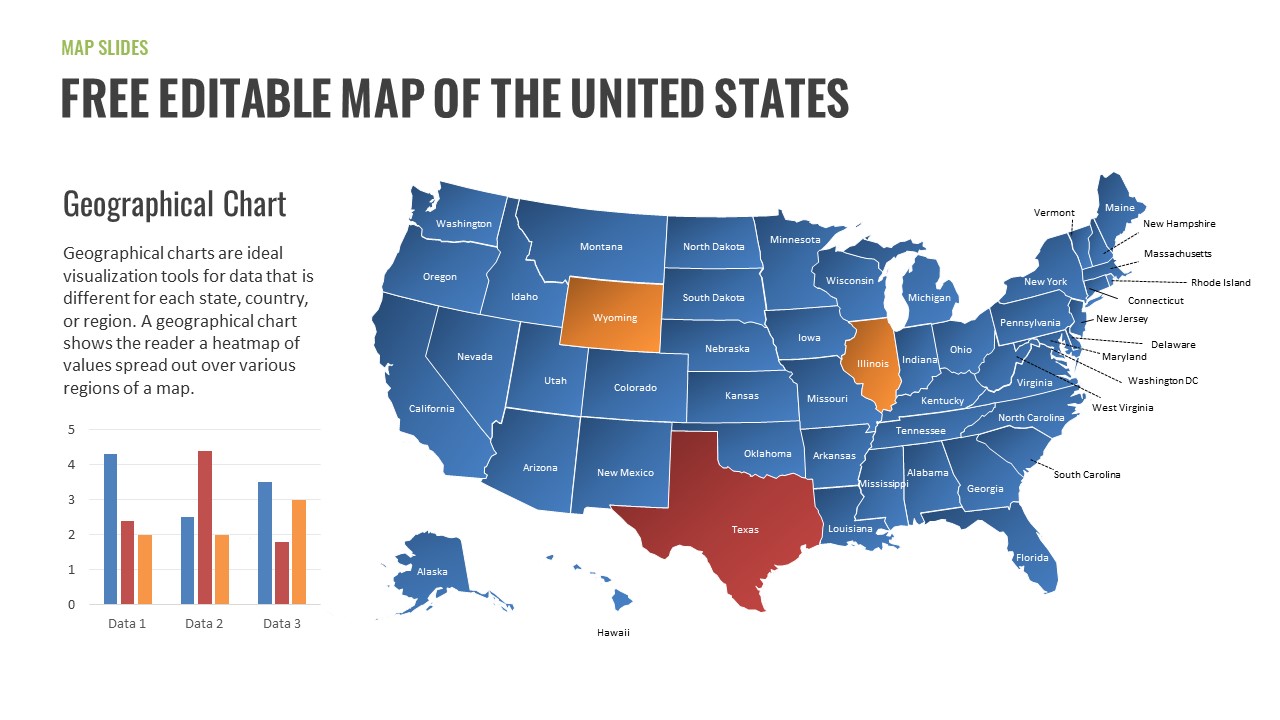

Present regional data with clarity using this free editable U.S. map template for PowerPoint and Google Slides. This set includes three professionally designed slide layouts, each offering a different way to visualize state-level and regional metrics.
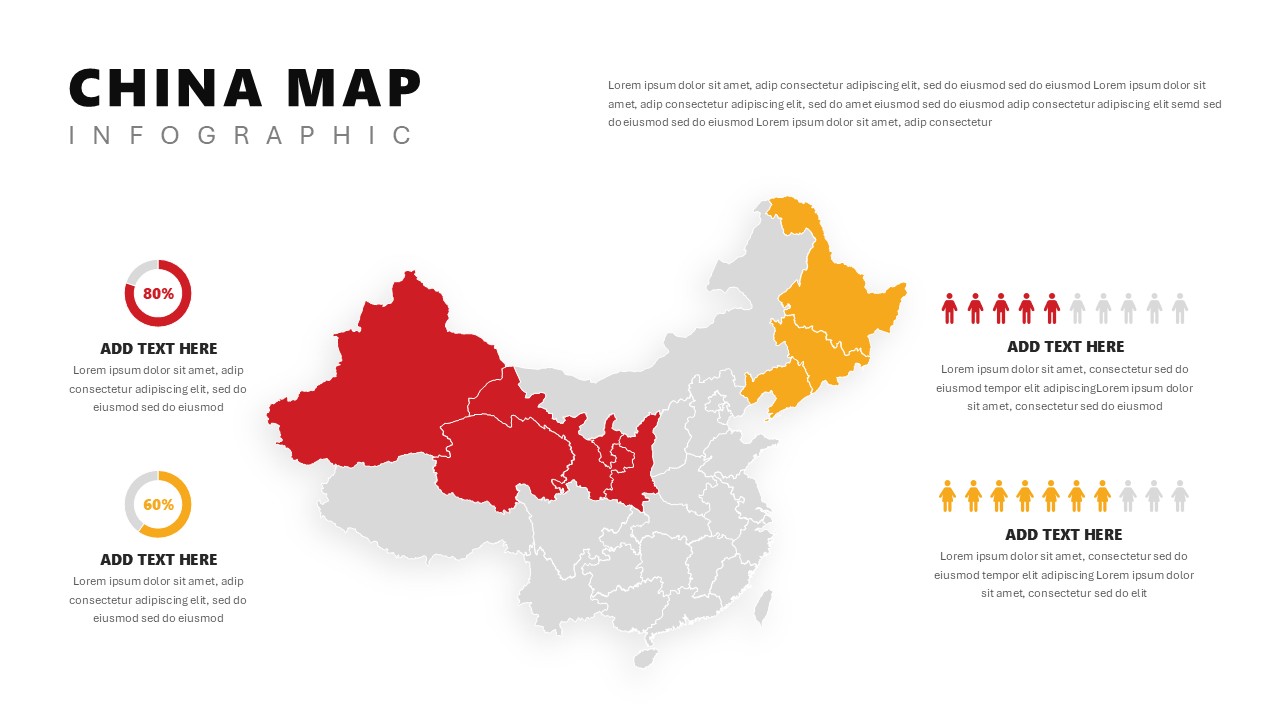
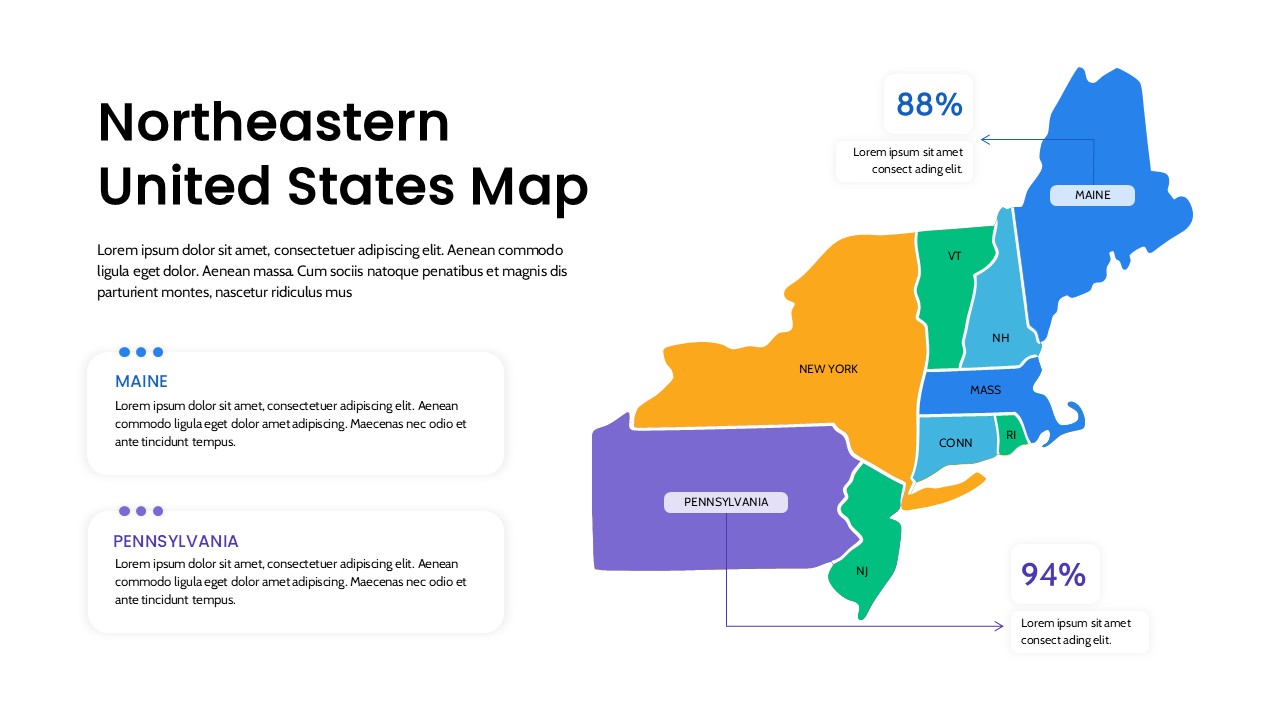
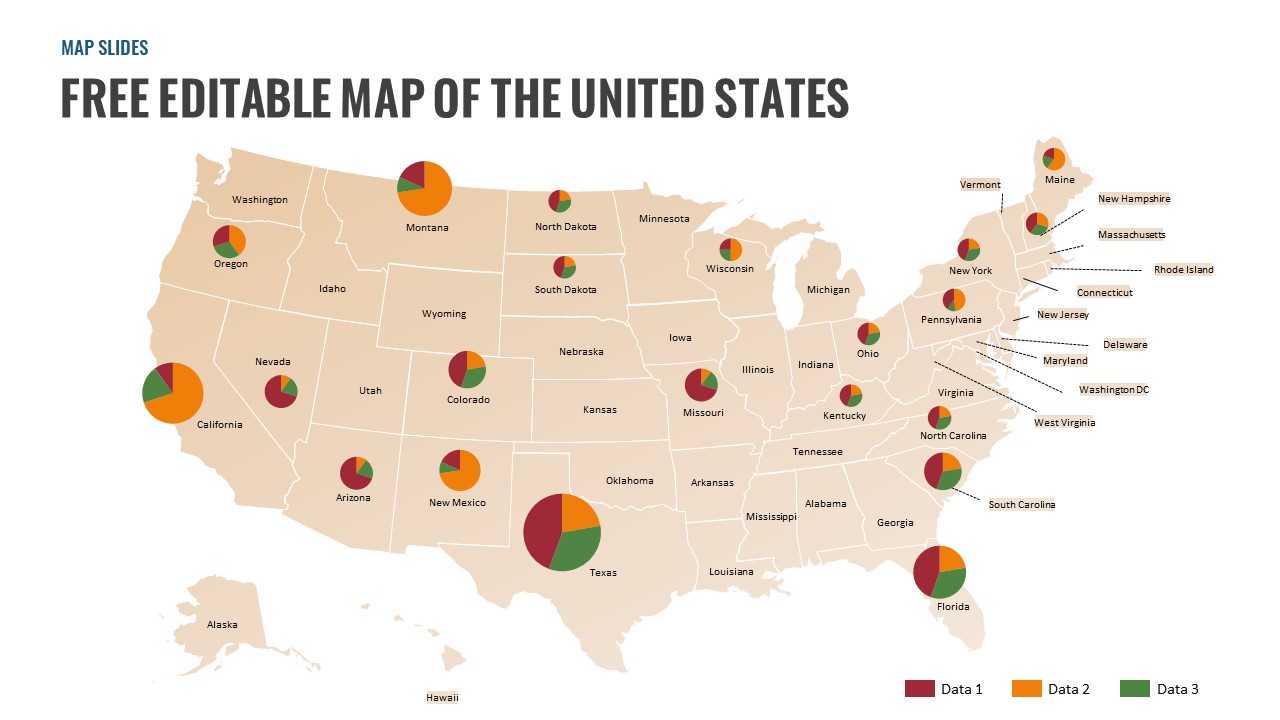
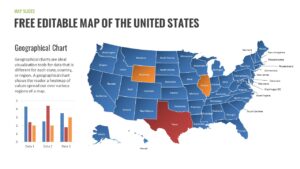
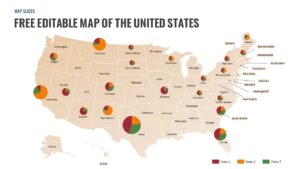
The first slide features an editable United States map with donut charts displaying percentage values for highlighted regions. The second combines a color-coded U.S. state map with a grouped bar chart for side-by-side data comparison. The third places pie charts directly over individual states, making it easy to show data distribution across the country at a glance.
Every element is fully editable. Recolor individual states, update chart values, change labels, and adjust layouts to match your brand or data set. No plugins or special tools needed everything works natively in PowerPoint and Google Slides.
Ideal for sales territory maps, market analysis presentations, regional performance dashboards, demographic breakdowns, business expansion plans, and geographic data reports.
Download this free U.S. map PowerPoint template and start building data-driven presentations in minutes.
Login to download this file

Item ID
SB03637
Related Templates

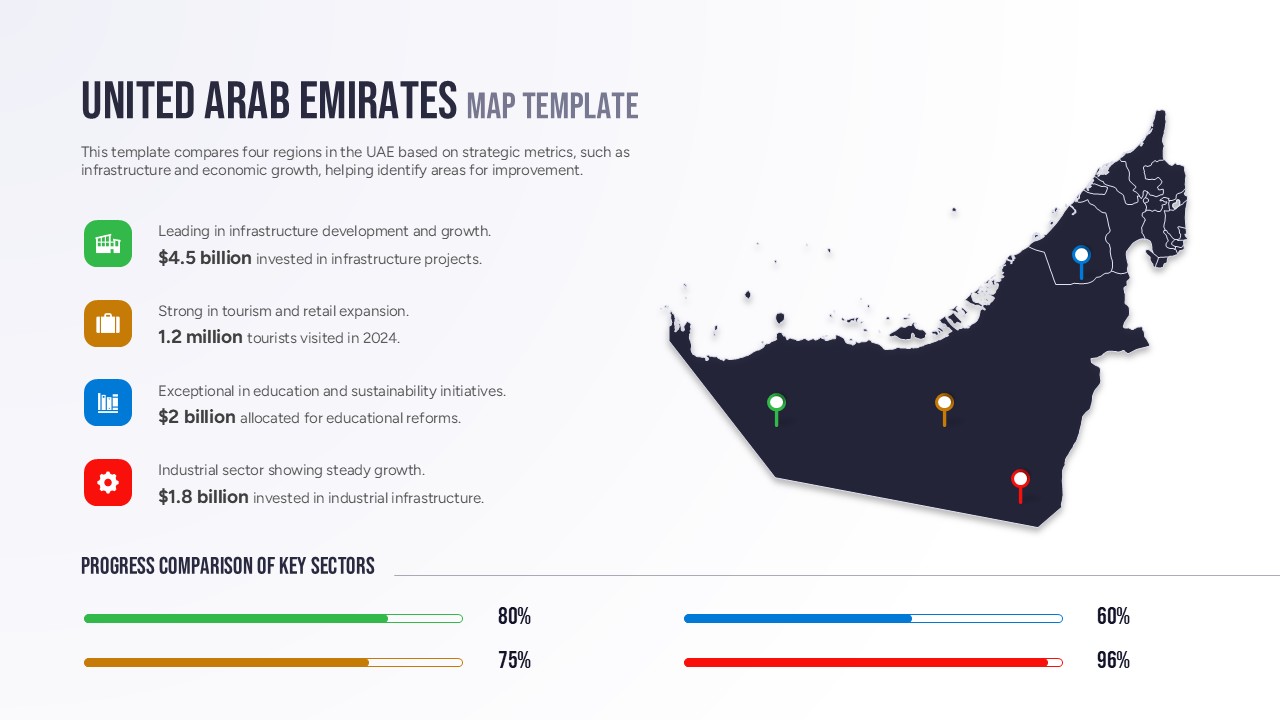
Free United Arab Emirates Regional Map for PowerPoint & Google Slides
World Maps
Free

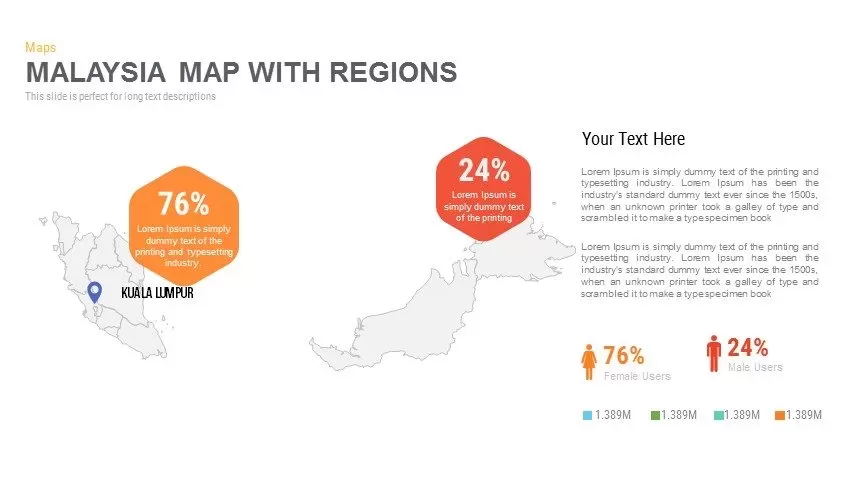
Malaysia Regional Map Infographic Template for PowerPoint & Google Slides
Maps
Egypt Regional Map Slide Pack Template for PowerPoint & Google Slides
World Maps
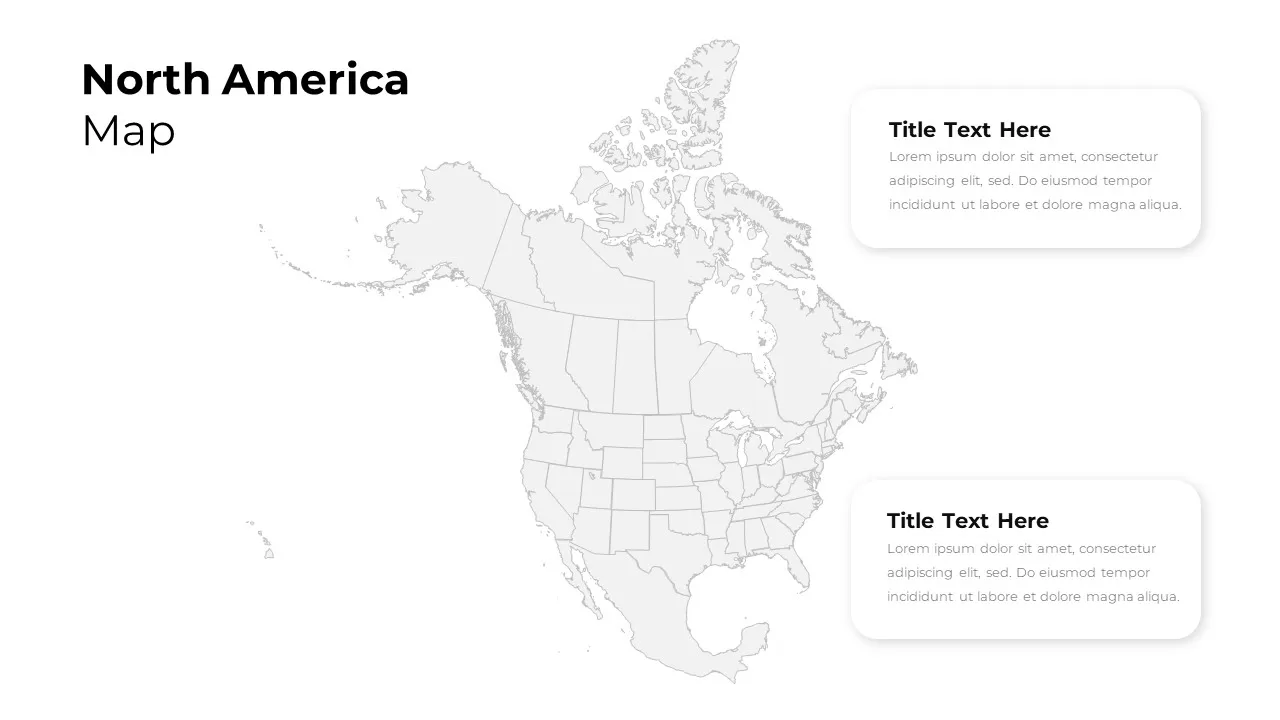
North America Regional Map Overview Template for PowerPoint & Google Slides
World Maps
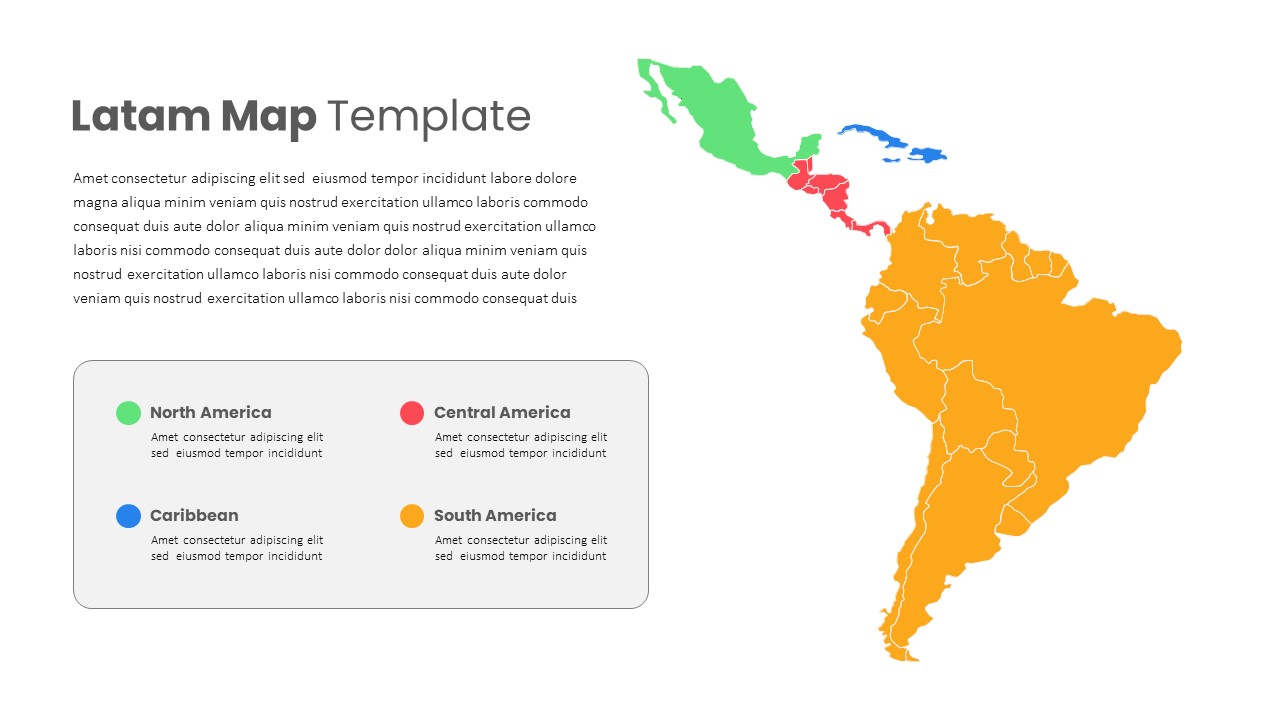
Latin America Regional Map Breakdown Template for PowerPoint & Google Slides
World Maps
Germany Map with Regional Callouts Template for PowerPoint & Google Slides
World Maps
Syria Regional Data Map Infographic Template for PowerPoint & Google Slides
World Maps
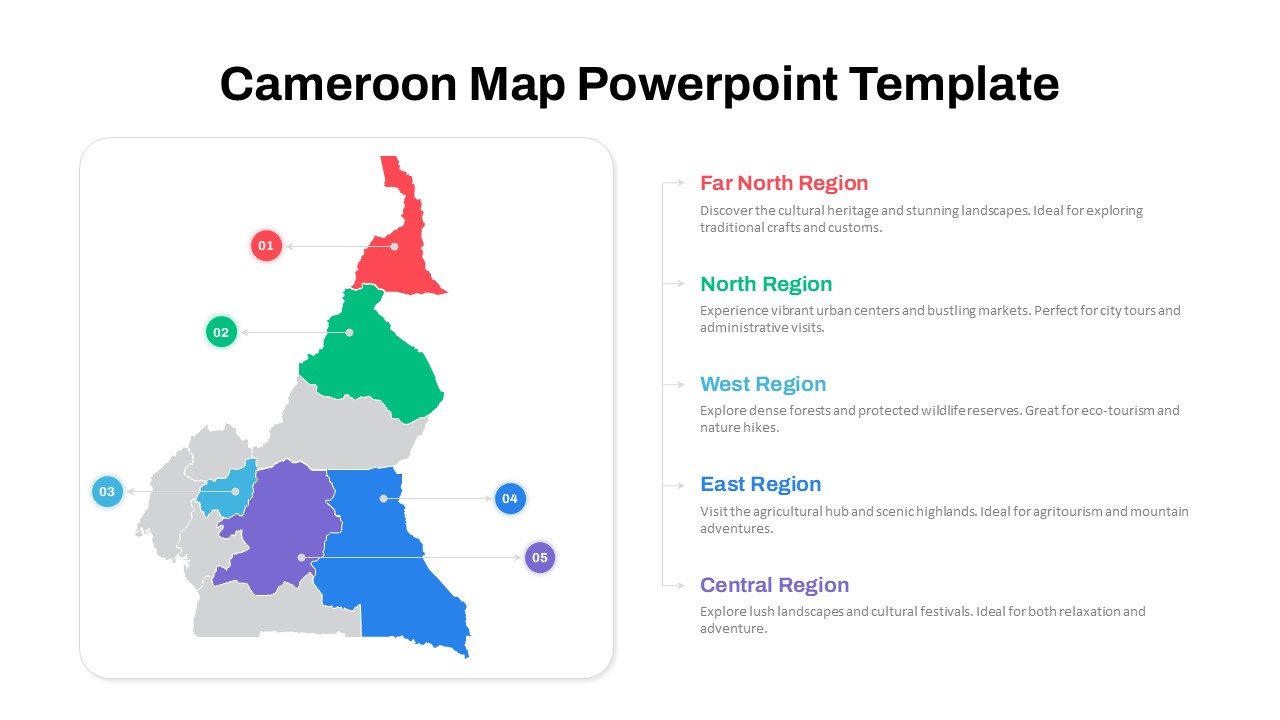
Numbered Cameroon Regional Map Slide Template for PowerPoint & Google Slides
World Maps
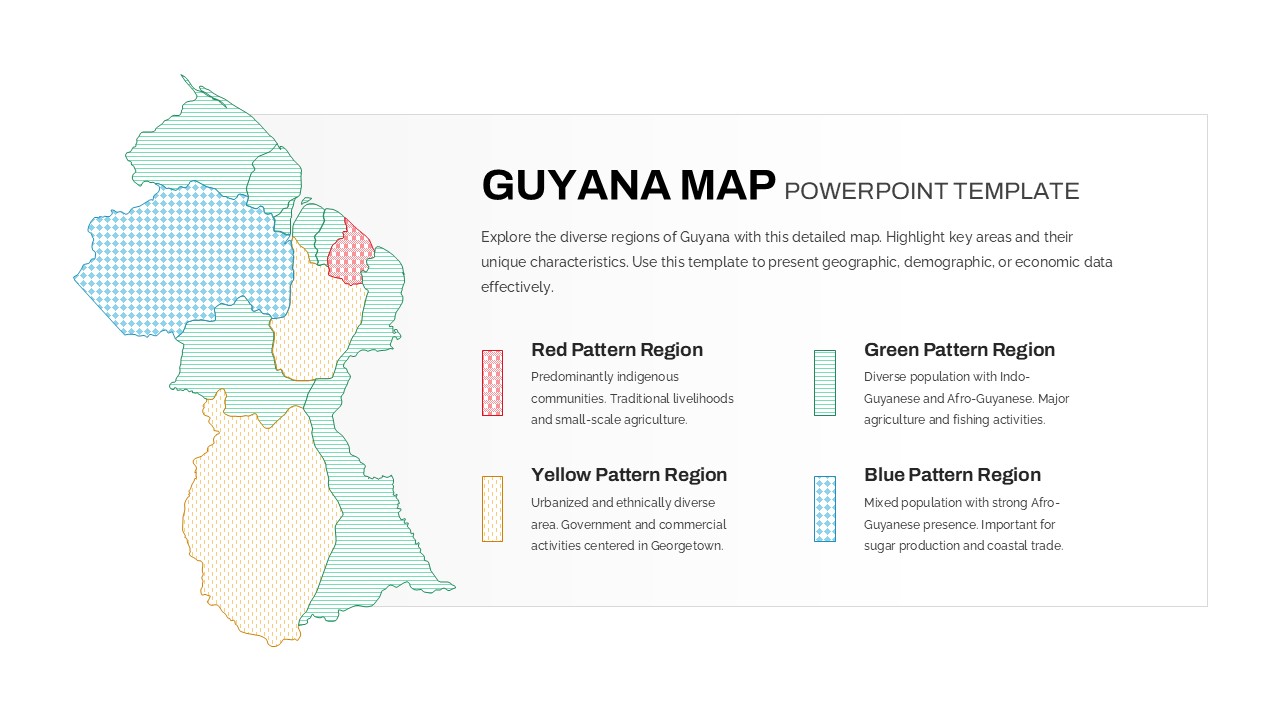
Patterned Guyana Regional Map Template for PowerPoint & Google Slides
World Maps
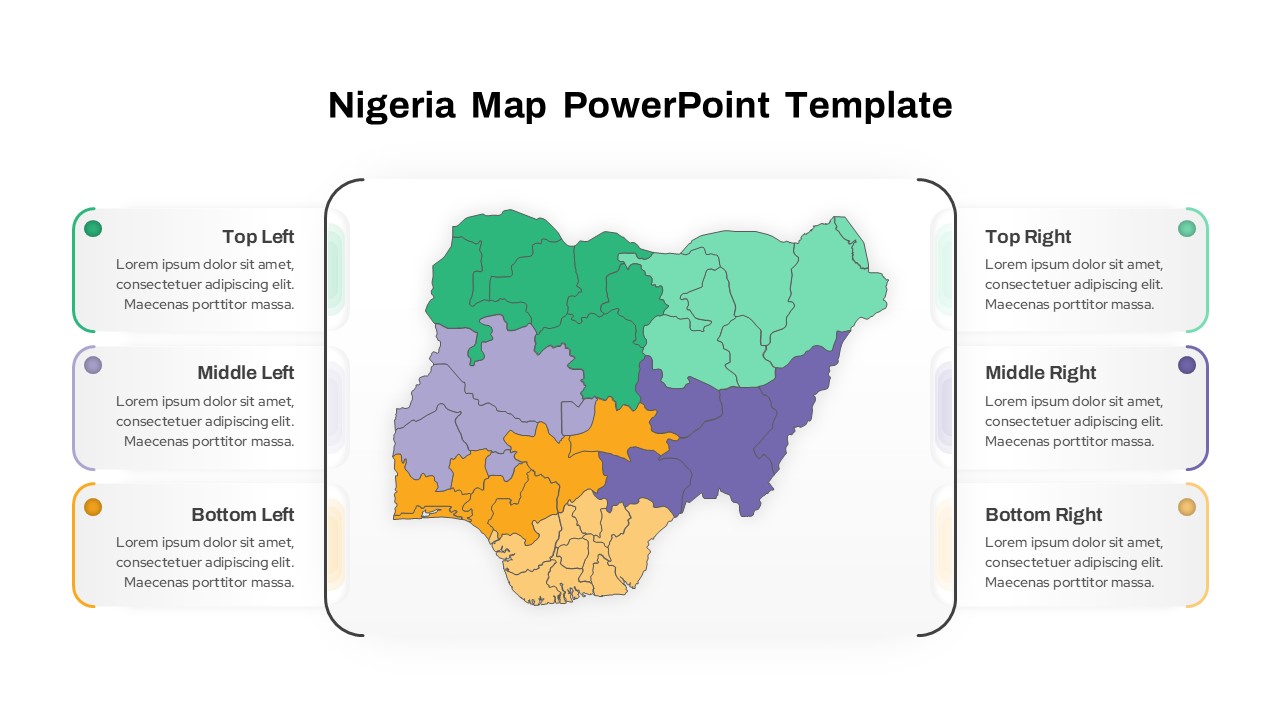
Nigeria Regional Callout Map Diagram Template for PowerPoint & Google Slides
Maps
China Map Infographic Regional Stats Template for PowerPoint & Google Slides
World Maps
Northeastern United States Regional Map for PowerPoint & Google Slides
World Maps
Regional Revenue Comparison Overview Template for PowerPoint & Google Slides
Comparison
Asia Map with KPI Metrics and Legend Template for PowerPoint & Google Slides
World Maps
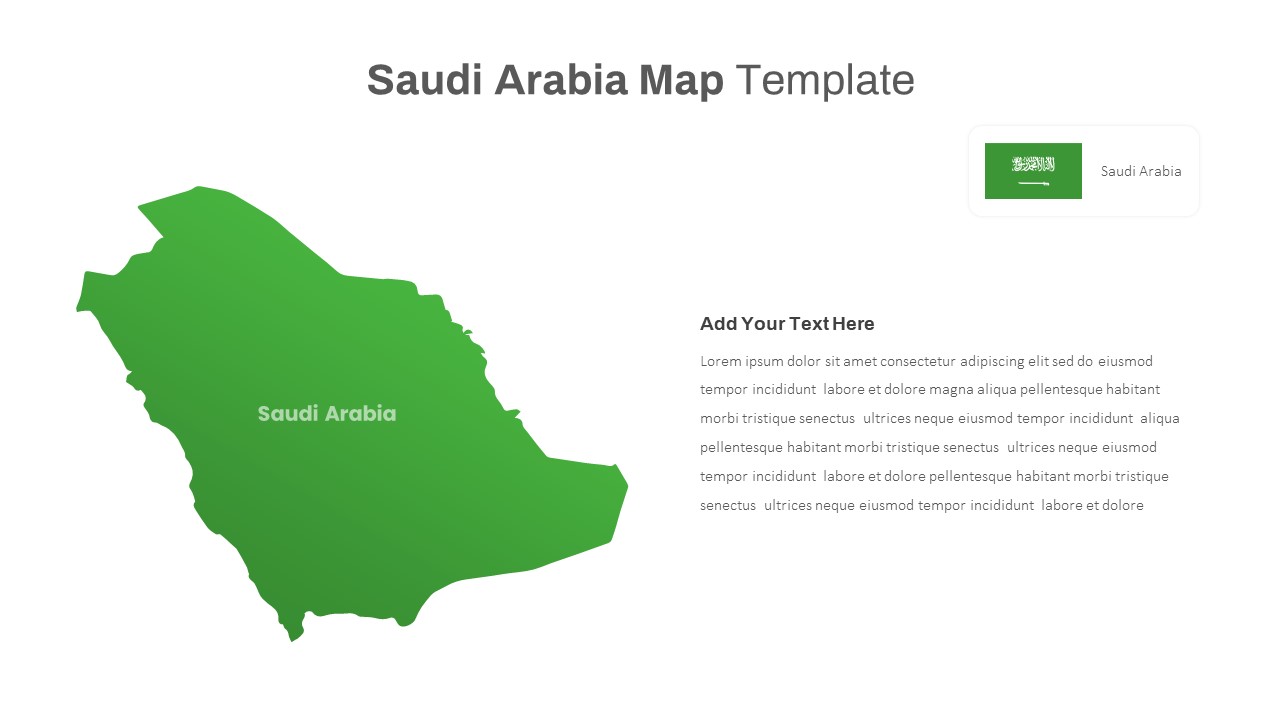
Free Editable Saudi Arabia Map Template for PowerPoint & Google Slides
World Maps
Editable Colombia Map PowerPoint Template for PowerPoint & Google Slides
Business Models
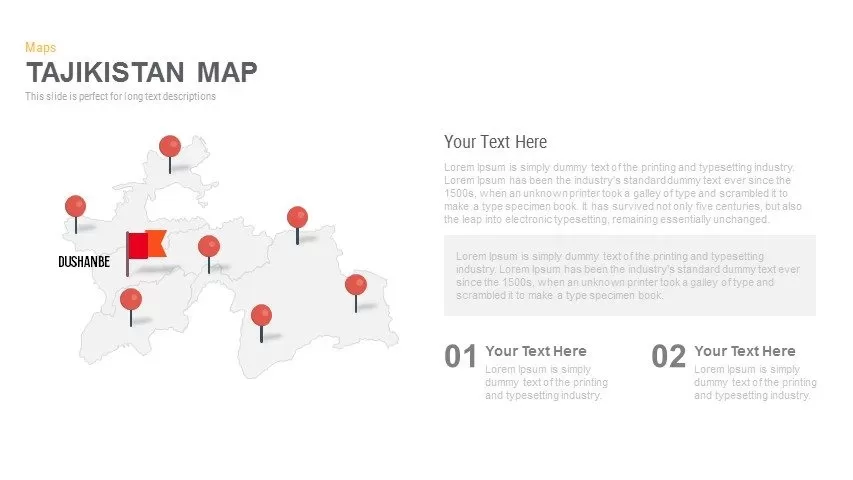
Editable Tajikistan Provinces Map Pack Template for PowerPoint & Google Slides
Maps
Fully Editable World Map Infographic Template for PowerPoint & Google Slides
World Maps
Editable World Map Callout Infographic Template for PowerPoint & Google Slides
World Maps
Editable World Map Callout Infographic Template for PowerPoint & Google Slides
World Maps
Editable Africa Map Infographic Data Template for PowerPoint & Google Slides
World Maps
Editable Ireland Map Infographic Slide Template for PowerPoint & Google Slides
World Maps
Free
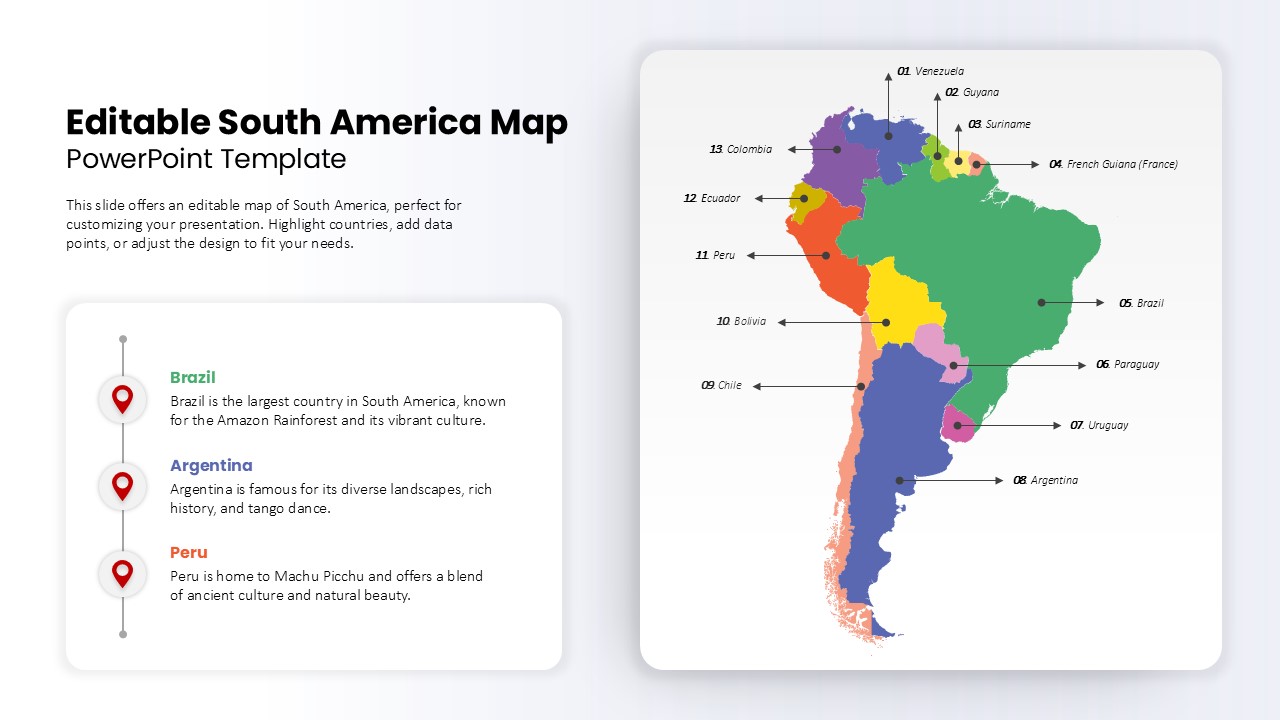
Editable South America Map Diagram Template for PowerPoint & Google Slides
Maps
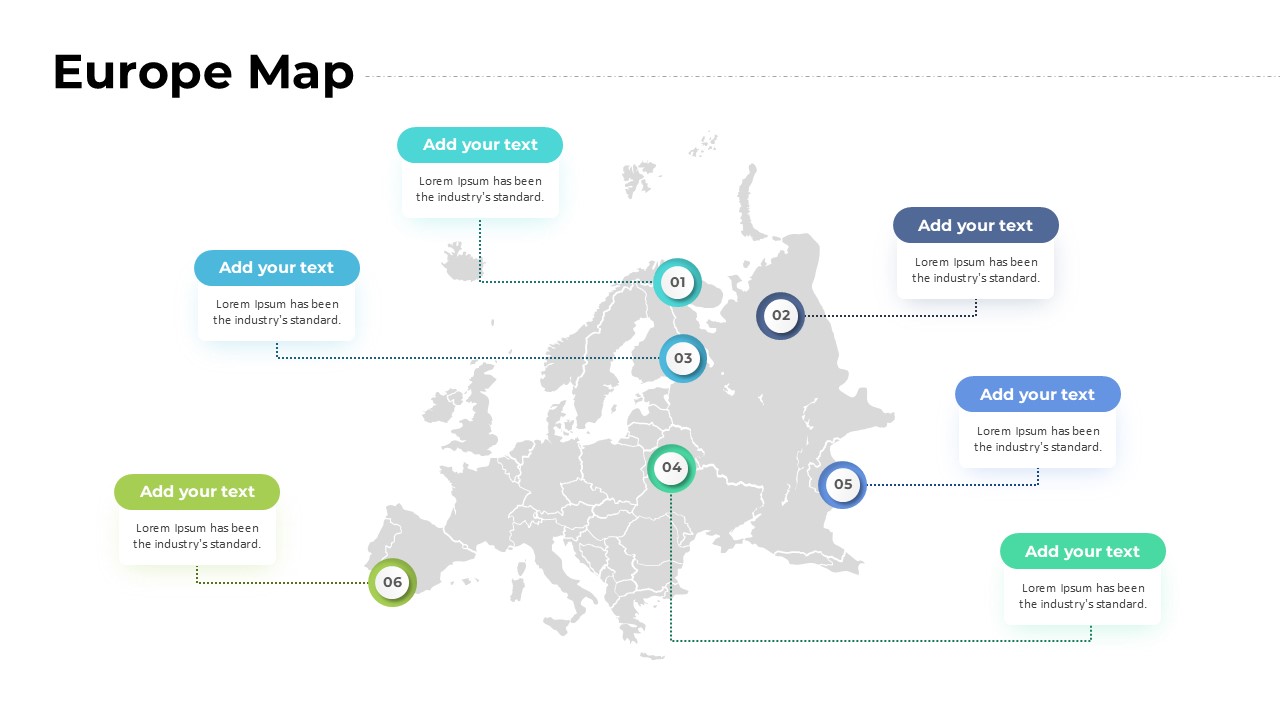
Europe Map with Six Editable Points Template for PowerPoint & Google Slides
World Maps
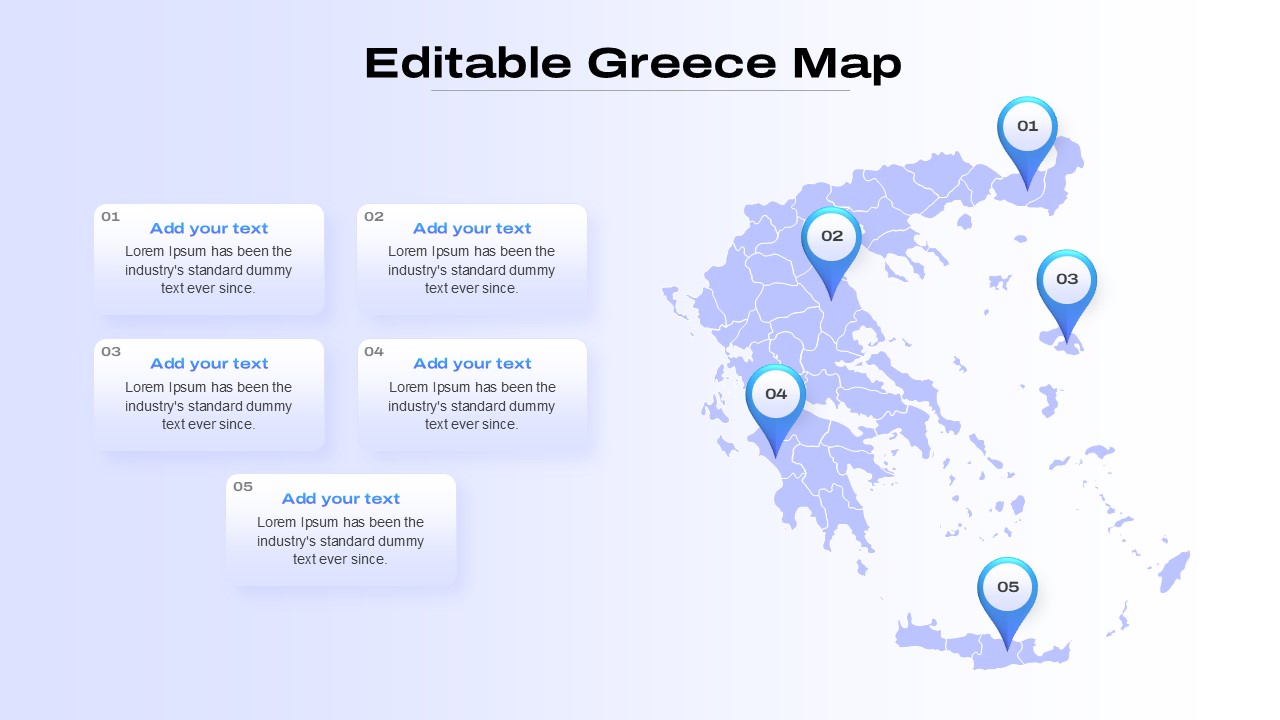
Editable Greece Map for PowerPoint & Google Slides
Maps
iPad App Mockup with Progress Metrics Template for PowerPoint & Google Slides
Bar/Column
Bubble Head Metrics Infographic Template for PowerPoint & Google Slides
Circular
Circle Segment Sales Metrics Infographic Template for PowerPoint & Google Slides
Circular
Social Media Metrics template for PowerPoint & Google Slides
Comparison Chart
Mobile Usage Metrics template for PowerPoint & Google Slides
Comparison Chart

Scale Metaphor Metrics Comparison Template for PowerPoint & Google Slides
Charts
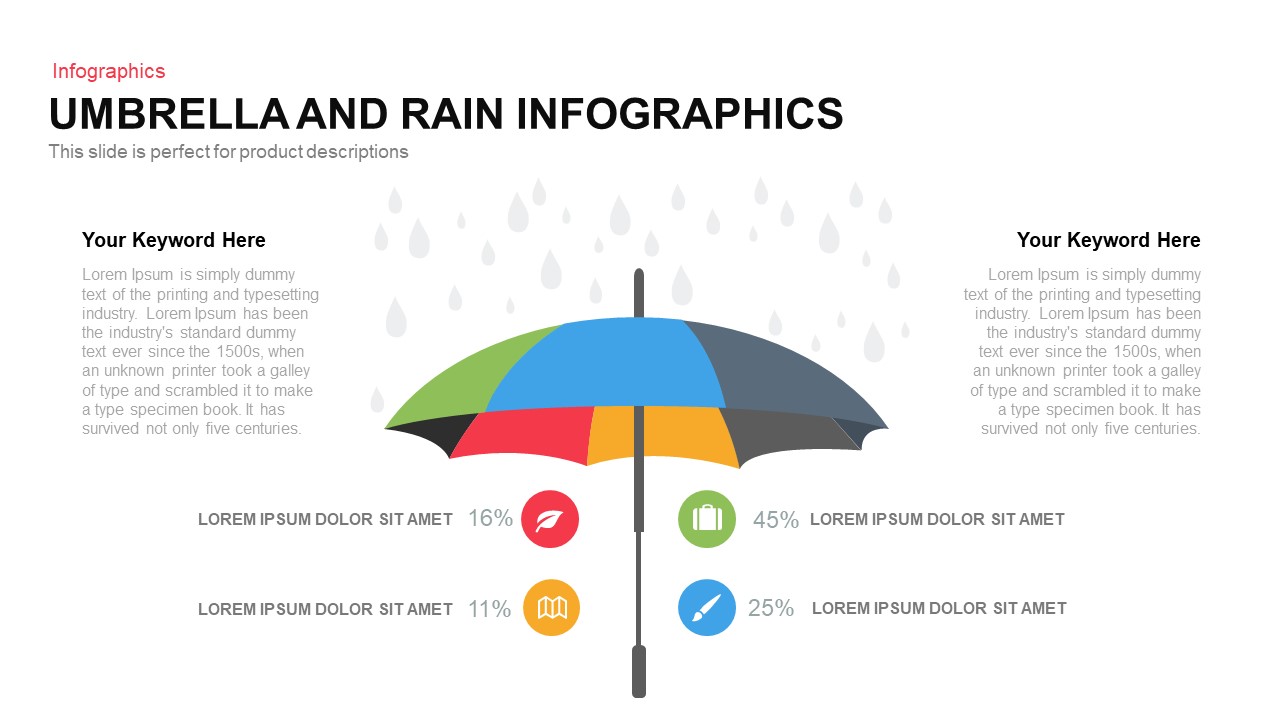
Umbrella and Rain Infographic Metrics Template for PowerPoint & Google Slides
Comparison
Comprehensive Recruitment Metrics Report Template for PowerPoint & Google Slides
Recruitment
Colorful Block Infographic Metrics Slide Template for PowerPoint & Google Slides
Infographics
Benchmarking Metrics Comparison Slide Template for PowerPoint & Google Slides
Pie/Donut
Project Status Dashboard with Metrics Template for PowerPoint & Google Slides
Project Status
Circular Image Gallery & KPI Metrics Template for PowerPoint & Google Slides
Pie/Donut
Statistics & Global Metrics Infographic Template for PowerPoint & Google Slides
Bar/Column
Agriculture Infographics Slide with Progress Rings & Metrics Template for PowerPoint & Google Slides
Pie/Donut
Annual Recurring Revenue Metrics Template for PowerPoint & Google Slides
Bar/Column
Social Media Analysis Metrics Slide Deck Template for PowerPoint & Google Slides
Digital Marketing
LinkedIn Metrics Infographic Slide Template for PowerPoint & Google Slides
Digital Marketing
Facebook Social Metrics Infographic Template for PowerPoint & Google Slides
Graphics
Instagram Infographic Metrics Slide Template for PowerPoint & Google Slides
Marketing
Mastodon Metrics Infographic Dashboard Template for PowerPoint & Google Slides
Business Report
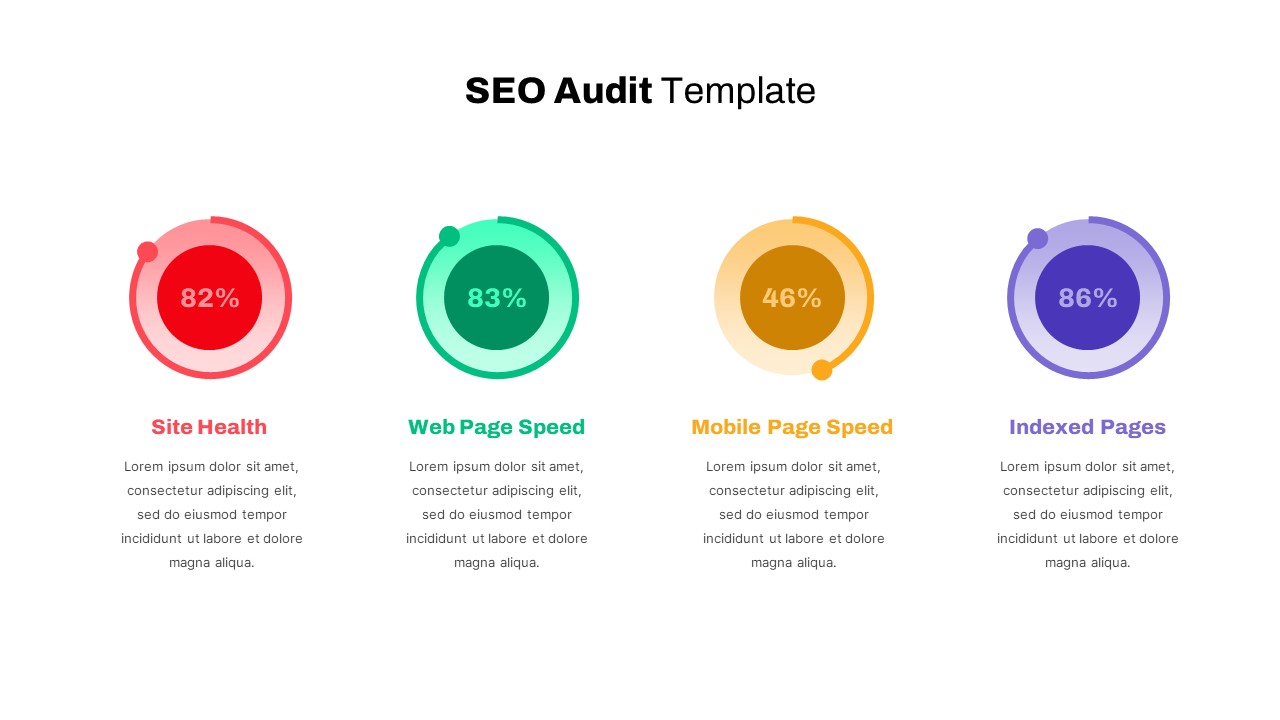
Detailed SEO Audit Metrics Overview Template for PowerPoint & Google Slides
Circular
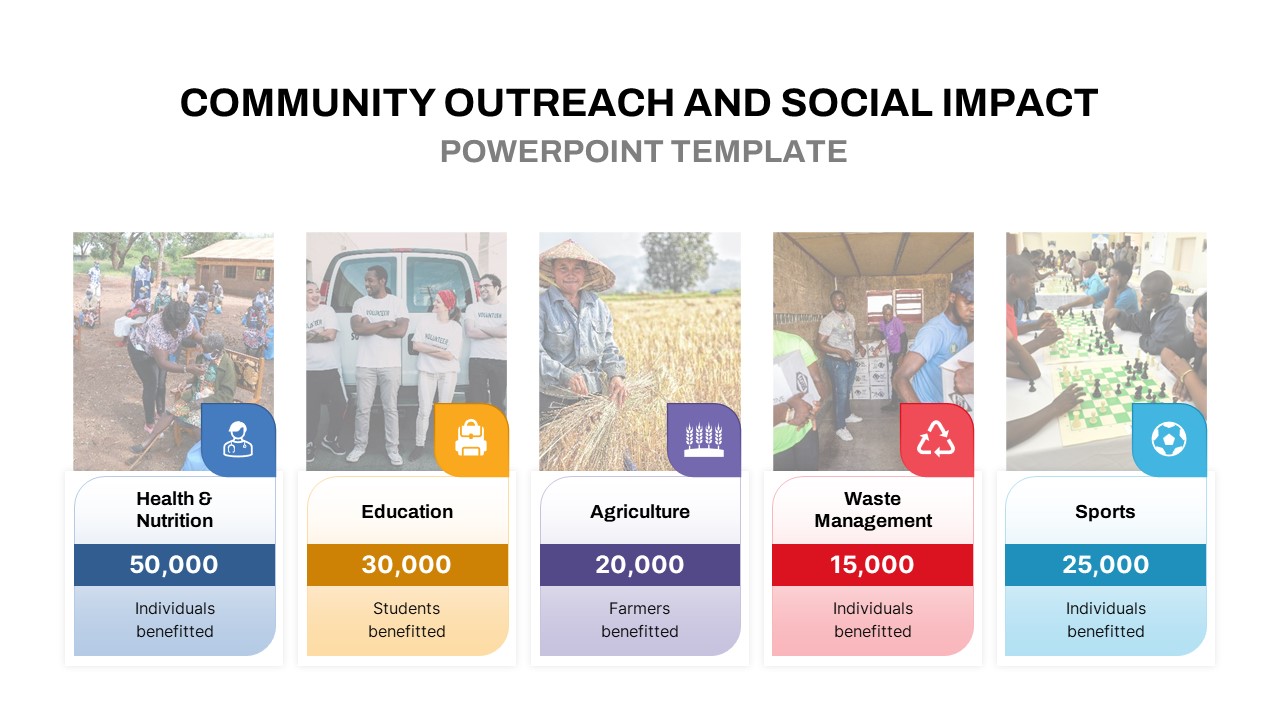
Community Outreach Impact Metrics Template for PowerPoint & Google Slides
Accomplishment
DevOps KPI Dashboard Performance Metrics Template for PowerPoint & Google Slides
Software Development
Purchasing KPI Metrics Dashboard Template for PowerPoint & Google Slides
Business Report
Financial Snapshot & Metrics Overview Template for PowerPoint & Google Slides
Finance
Procurement KPI Dashboard & Metrics Template for PowerPoint & Google Slides
Business Report
Market Validation Metrics Overview Template for PowerPoint & Google Slides
Business
Employee Performance Metrics Dashboard Template for PowerPoint & Google Slides
Employee Performance
Pirate Metrics AARRR Funnel Framework Template for PowerPoint & Google Slides
Funnel
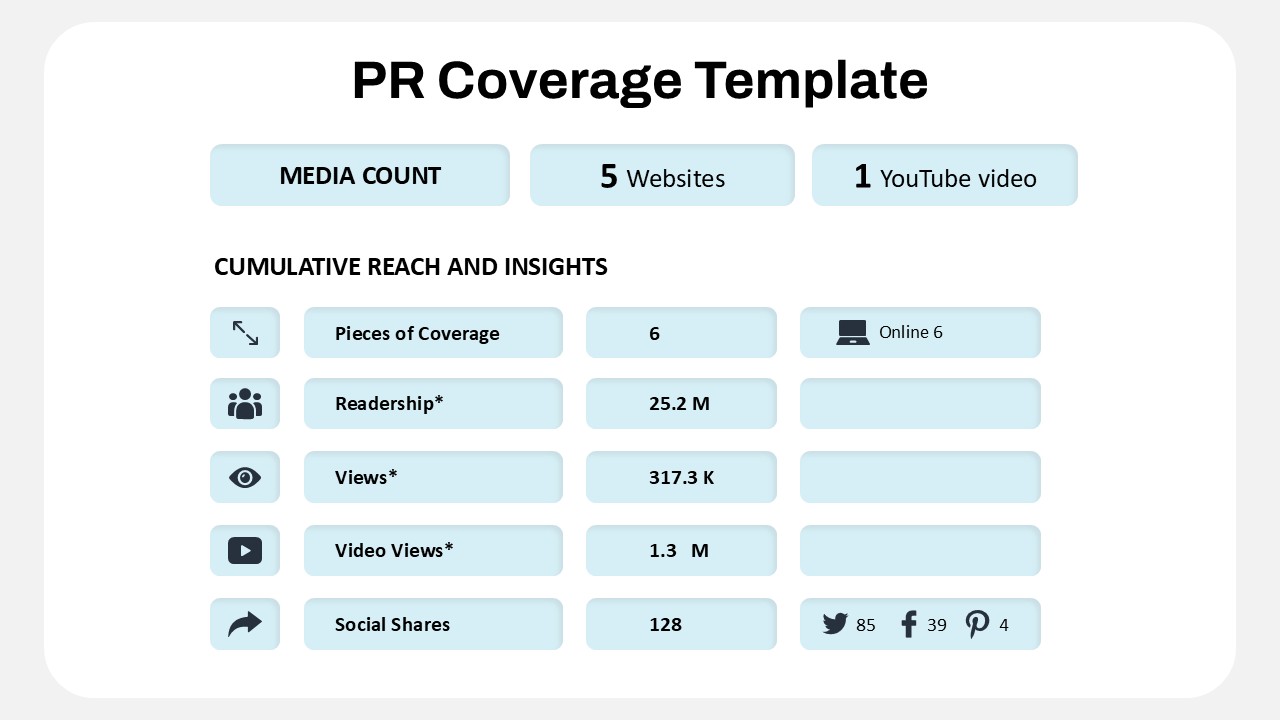
Public Relations Coverage Metrics Template for PowerPoint & Google Slides
Business Report
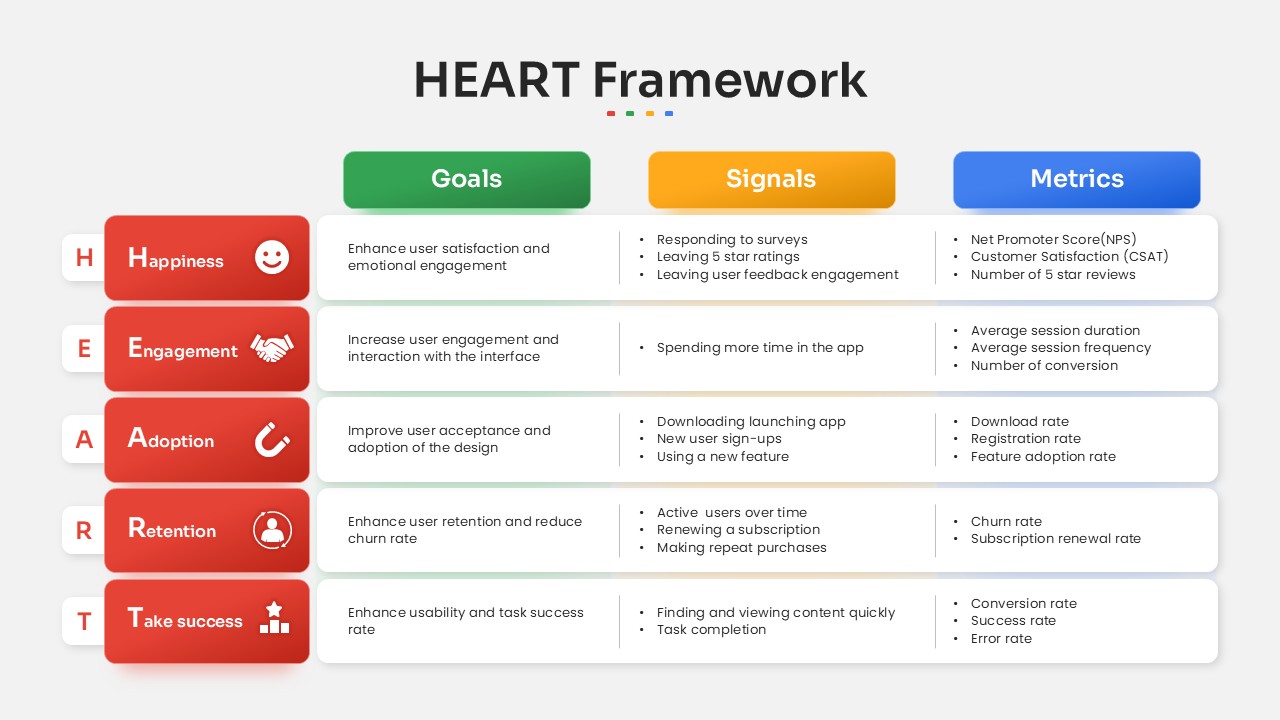
HEART Framework Goals, Signals & Metrics Template for PowerPoint & Google Slides
Process
Free Editable Check Box Icon Set Presentation Template for PowerPoint & Google Slides
Infographics
Free
Free Editable Simple Column Chart Slide Template for PowerPoint & Google Slides
Bar/Column
Free
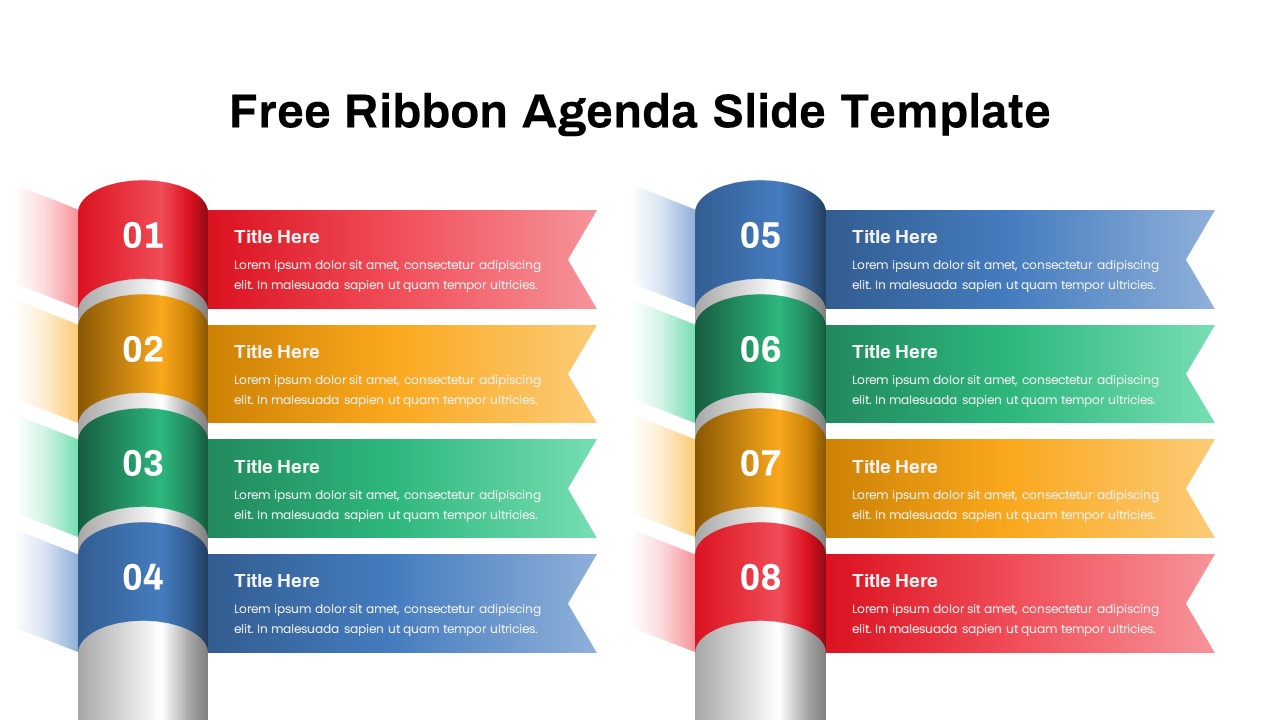
Free Editable Multi-Step Ribbon Agenda Slide Template for PowerPoint & Google Slides
Agenda
Free
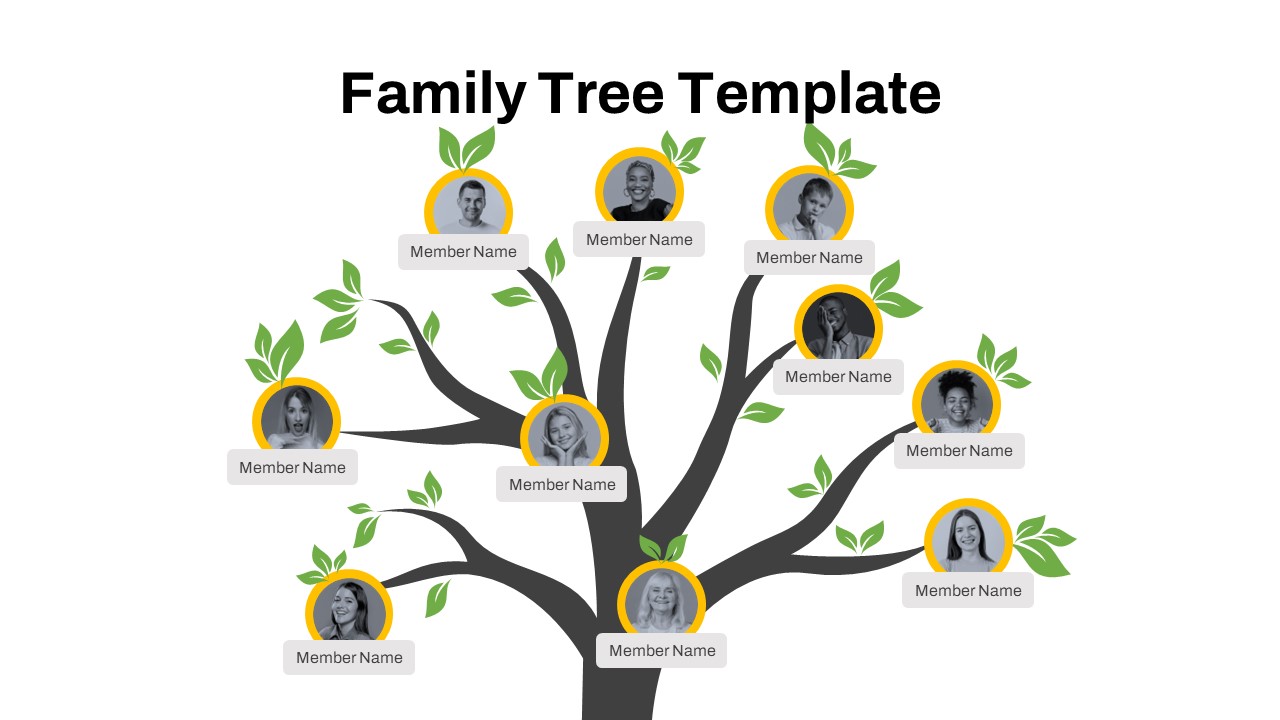
Free Editable Family Tree Genealogy Diagram Template for PowerPoint & Google Slides
Org Chart
Free
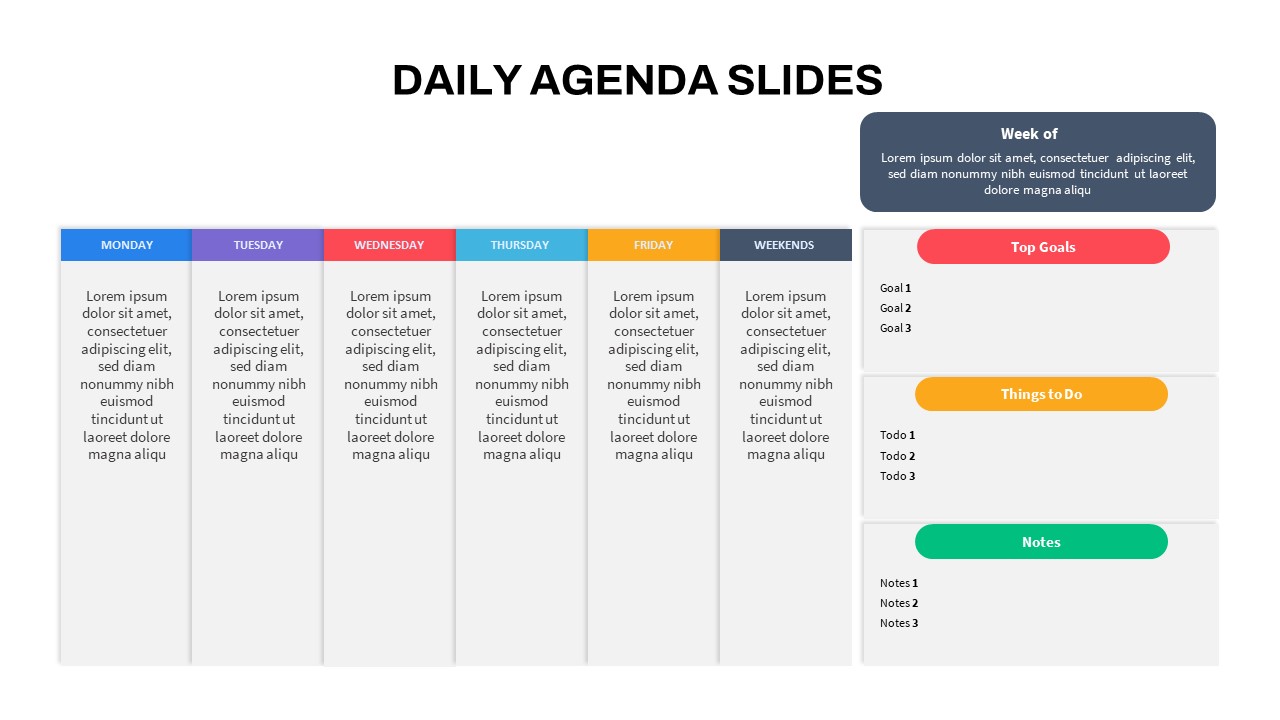
Editable Colorful Daily Agenda Slides Template for PowerPoint & Google Slides
Agenda

Fully Editable Gantt Chart Timeline template for PowerPoint & Google Slides
Gantt Chart
Editable Hierarchical Tree Diagram Template for PowerPoint & Google Slides
Decision Tree
Editable Twin Circle Process Diagram Template for PowerPoint & Google Slides
Process
Editable Force Field Analysis Diagram Template for PowerPoint & Google Slides
Business Plan
Editable Six-Level 3D Pyramid Diagram Template for PowerPoint & Google Slides
Pyramid
Editable Four-Section 3D Shape Diagram Template for PowerPoint & Google Slides
Comparison
Editable Four-Point Timeline Agenda Template for PowerPoint & Google Slides
Agenda
Editable Six-Step Bubble Process Diagram Template for PowerPoint & Google Slides
Process
Editable Plant Growth Stages Diagram Template for PowerPoint & Google Slides
Process
Editable Pillars Infographics Pack Template for PowerPoint & Google Slides
Infographics

Editable SIPOC Process Diagram Deck Template for PowerPoint & Google Slides
Pitch Deck
Editable Four-Quadrant TOWS Matrix Template for PowerPoint & Google Slides
Opportunities Challenges
Editable Buyer Persona Profile Slide Template for PowerPoint & Google Slides
Customer Journey

Editable 2024 Calendar Yearly Overview Template for PowerPoint & Google Slides
Decks
Editable One-Pager Business Plan Slide Template for PowerPoint & Google Slides
Business Plan
Weekly Social Media Calendar Editable Template for PowerPoint & Google Slides
Digital Marketing
Editable Monthly Timeline Infographic Template for PowerPoint & Google Slides
Timeline
Professional Editable 6 Month Timeline Template for PowerPoint & Google Slides
Timeline
Editable C-Suite Organizational Chart Template for PowerPoint & Google Slides
Org Chart
Editable Sales Pitch Deck Presentation Template for PowerPoint & Google Slides
Pitch Deck
Editable Multi-Series Peak Line Chart Template for PowerPoint & Google Slides
Comparison Chart
Arrow Types Shape Library Editable Template for PowerPoint & Google Slides
Arrow
Fully Editable Retro Vintage Theme Deck Template for PowerPoint & Google Slides
Company Profile
Fully Editable Career Journey Roadmap Template for PowerPoint & Google Slides
Customer Journey
Free
Fully Editable Watercolor Theme Deck Template for PowerPoint & Google Slides
Pitch Deck
Editable 3D Spiral Strategy Diagram Template for PowerPoint & Google Slides
Process
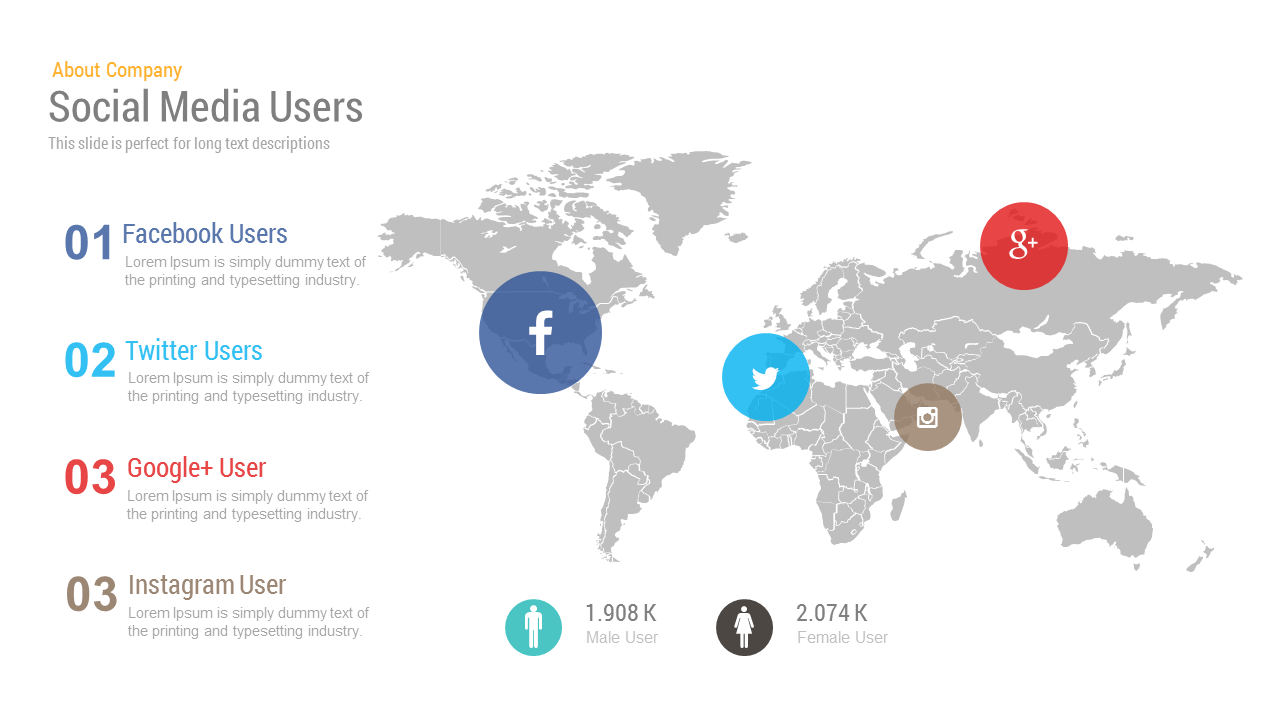
Free Social Media Users Map template for PowerPoint & Google Slides
World Maps
Free
Free Global Market Distribution Map Template for PowerPoint & Google Slides
World Maps
Free
Mind Map PowerPoint template for PowerPoint & Google Slides
Mind Maps

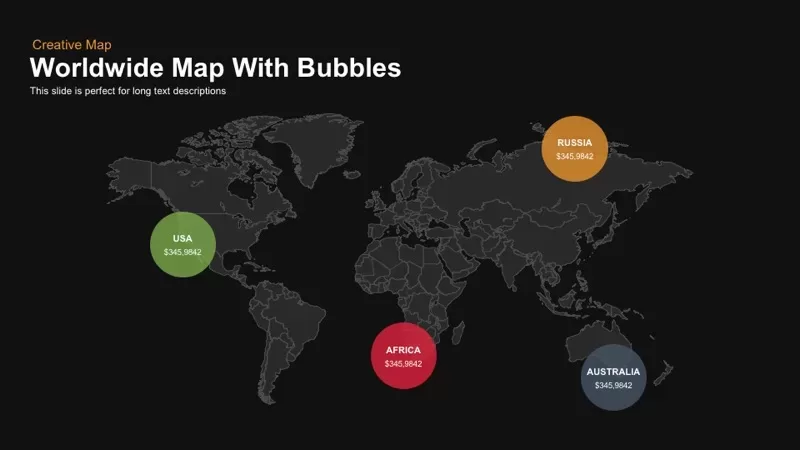
Worldwide Map with Bubbles template for PowerPoint & Google Slides
World Maps
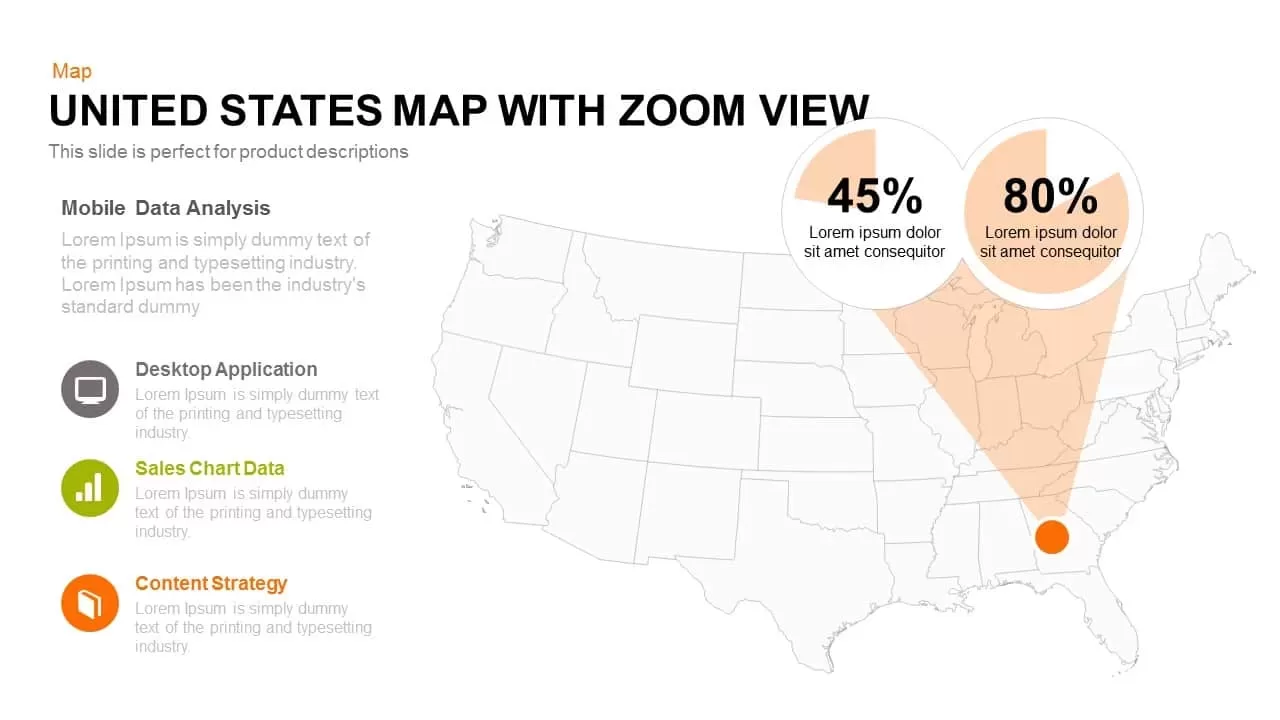
United States Map with Zoom View template for PowerPoint & Google Slides
World Maps
Cameroon Map with Regions Slide Pack Template for PowerPoint & Google Slides
World Maps
Four Staged Road Map template for PowerPoint & Google Slides
Roadmap

Emotional Customer Journey Map Template for PowerPoint & Google Slides
Customer Journey
Versatile Mind Map Infographic Template for PowerPoint & Google Slides
Mind Maps
Modern Custom Eight-Branch Mind Map Template for PowerPoint & Google Slides
Mind Maps
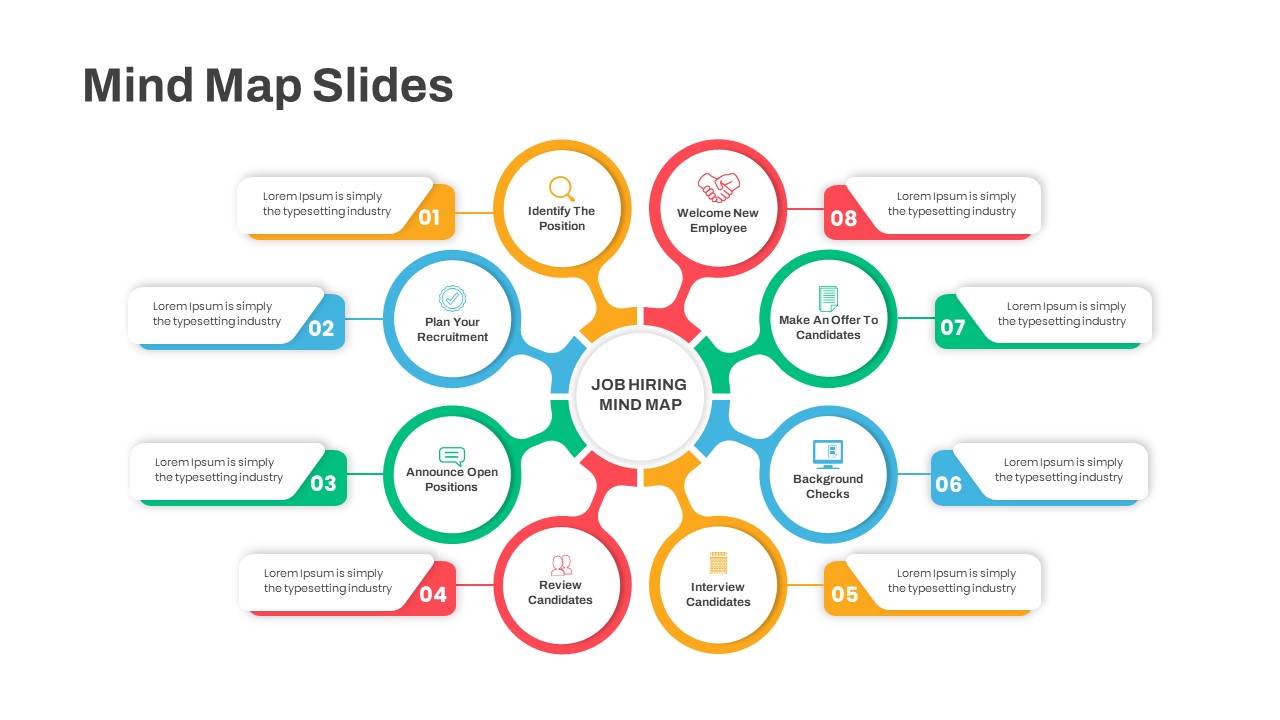
Eight-Step Job Hiring Mind Map Template for PowerPoint & Google Slides
Mind Maps
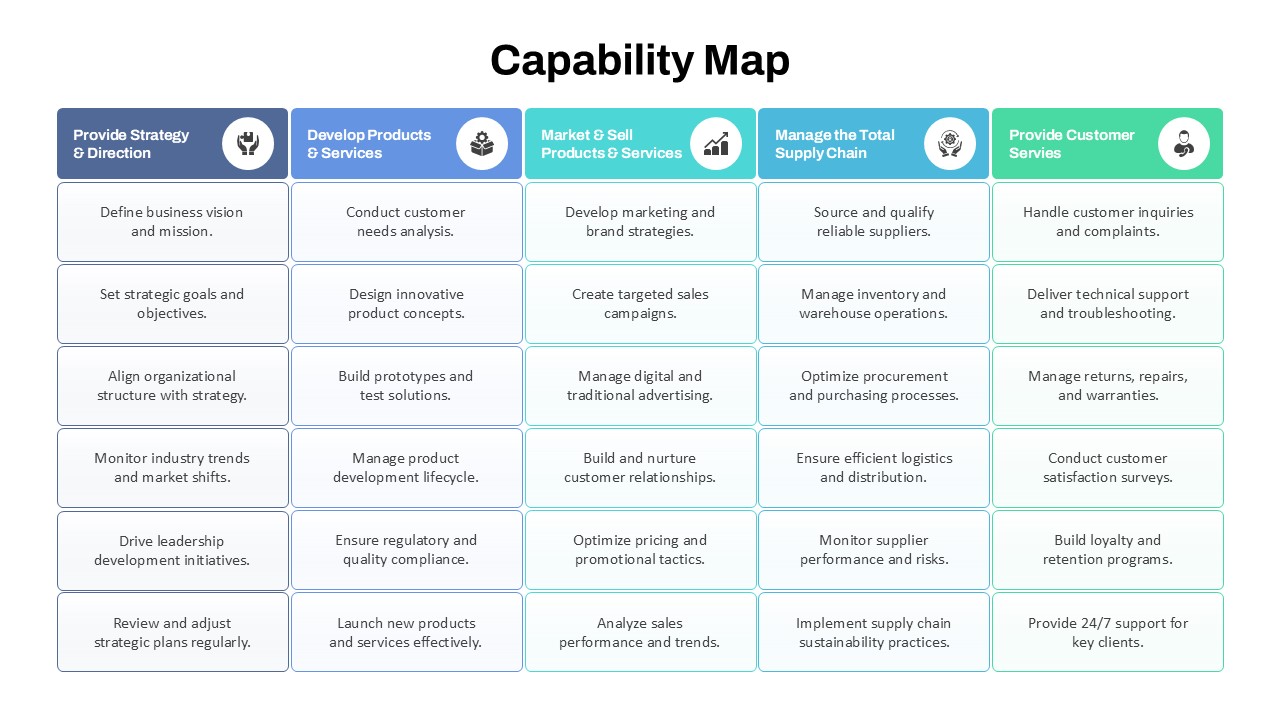
Capability Map Overview Template for PowerPoint & Google Slides
Business Strategy
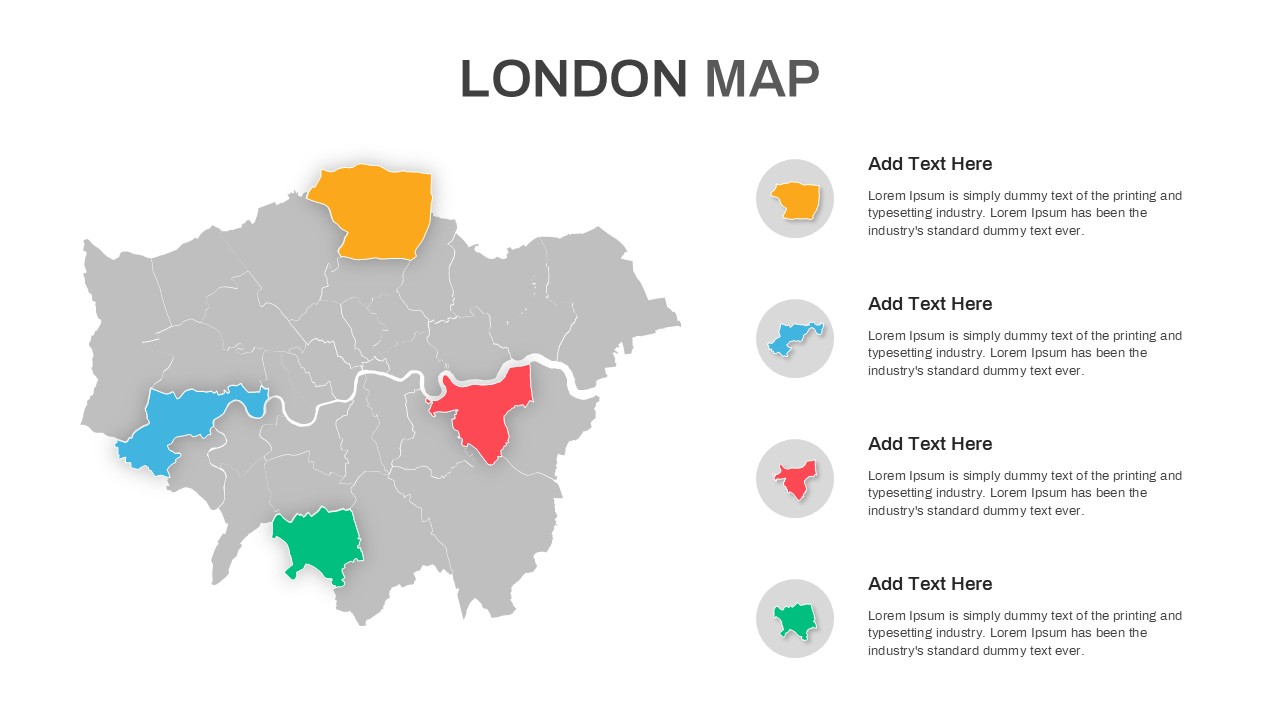
London Map with Highlighted Boroughs Template for PowerPoint & Google Slides
World Maps