Free Nutrition Infographic Slide Template for PowerPoint & Google Slides

Description
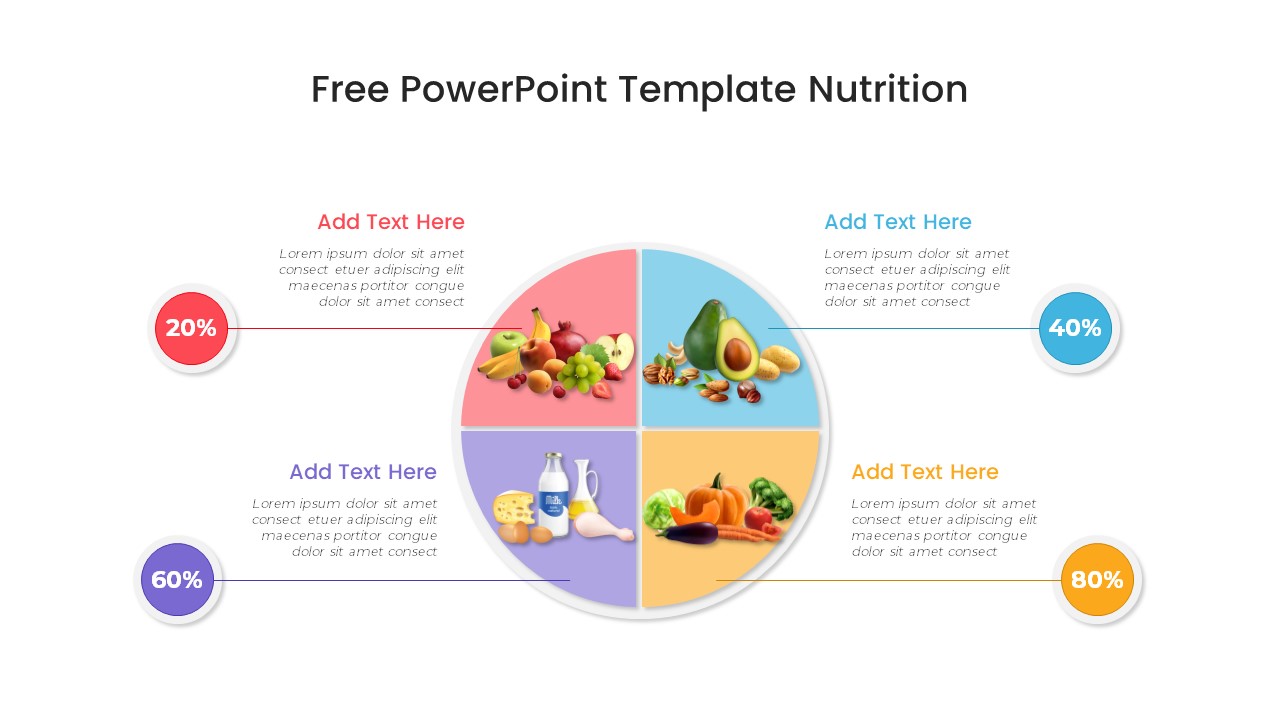
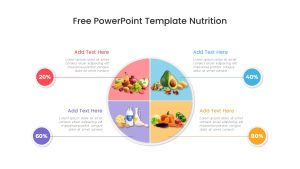
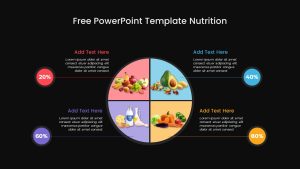
Engage your audience with this dynamic circular nutrition infographic slide designed to showcase balanced diet components with clarity and visual appeal. The slide features a central pie diagram divided into four equal quadrants, each dedicated to a key food group—fruits, healthy fats, dairy & protein, and vegetables—represented by crisp, high-resolution icons. Vibrant color-coding in red, blue, purple, and orange not only distinguishes each quadrant but also aligns with percentage callouts—20%, 40%, 60%, and 80%—located in corresponding outer circles and connected via fine leader lines to editable text placeholders. The modern flat design, accented by a subtle drop shadow, ensures a clean, professional aesthetic that seamlessly integrates with corporate branding or nutrition-focused presentations.
Built on master slides with fully editable shapes, fonts, and colors, this slide empowers presenters to adjust content effortlessly—update labels, swap icons, or refine percentage values in seconds. The radial arrangement promotes intuitive data comprehension, guiding viewers through dietary proportions at a glance. Optimized for both PowerPoint and Google Slides, this template maintains full-resolution clarity across devices, eliminating compatibility issues and saving valuable preparation time. Additionally, the slide supports custom legend insertion and percentage scaling for advanced nutritional analysis, making it ideal for research presentations or academic lectures. Leverage the modular vector graphics to adapt the diagram for enzyme ratios, meal-distribution planning, or macro-nutrient comparisons effortlessly.
Who is it for
Nutritionists, dietitians, health coaches, wellness consultants, and fitness trainers will benefit from this slide when presenting balanced meal plans, dietary assessments, or nutrition workshops. Marketing teams and corporate wellness managers can also leverage its clarity to drive employee health initiatives and wellness programs.
Other Uses
Beyond nutrition-focused contexts, repurpose this circular infographic to illustrate budget breakdowns, market segmentation, project milestone distributions, or quarterly performance summaries. The editable quadrants can be relabeled for resource allocation, strategic priority mapping, or team role distribution, making this slide a versatile asset across business, education, and training presentations.
Login to download this file

Item ID
SB04121
Related Templates

Diet and Nutrition PowerPoint Template for PowerPoint & Google Slides
Decks

Free Colorful Infographic Slide Pack Template for PowerPoint & Google Slides
Roadmap
Free
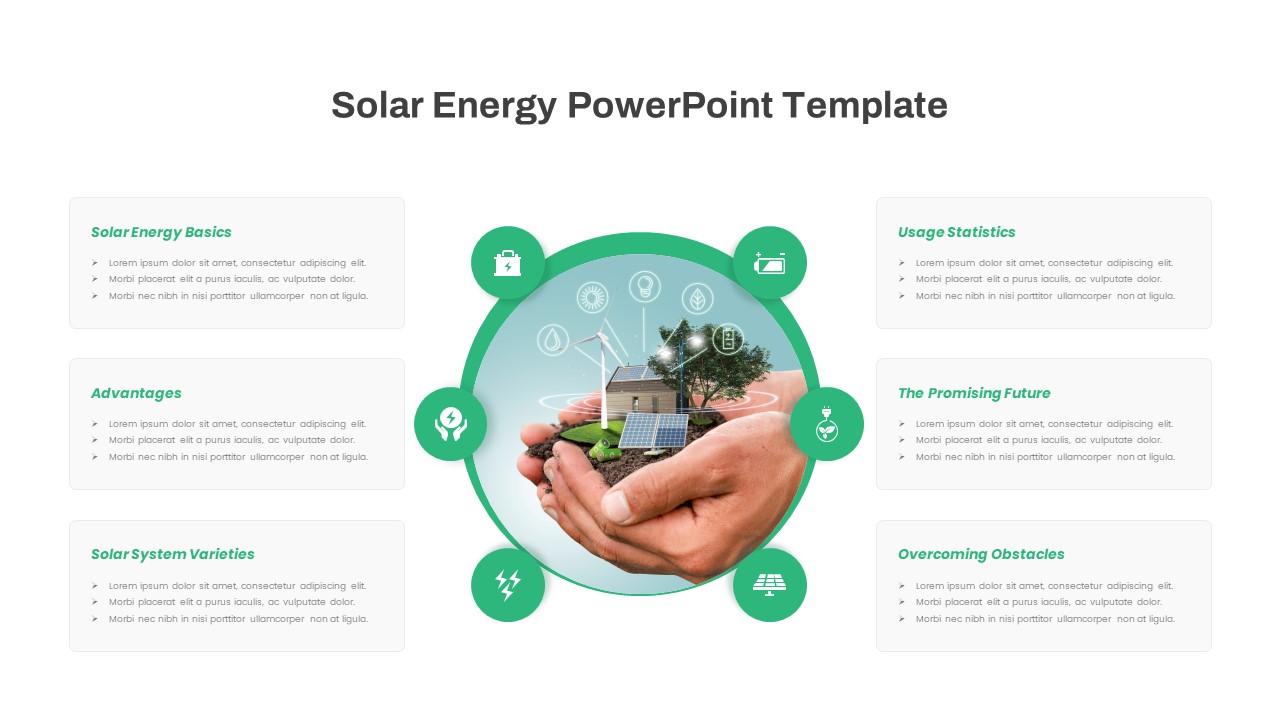
Free Solar Energy Infographic Slide Template for PowerPoint & Google Slides
Circular
Free
Free Multi-Step Funnel Infographic Slide Pack Template for PowerPoint & Google Slides
Funnel
Free
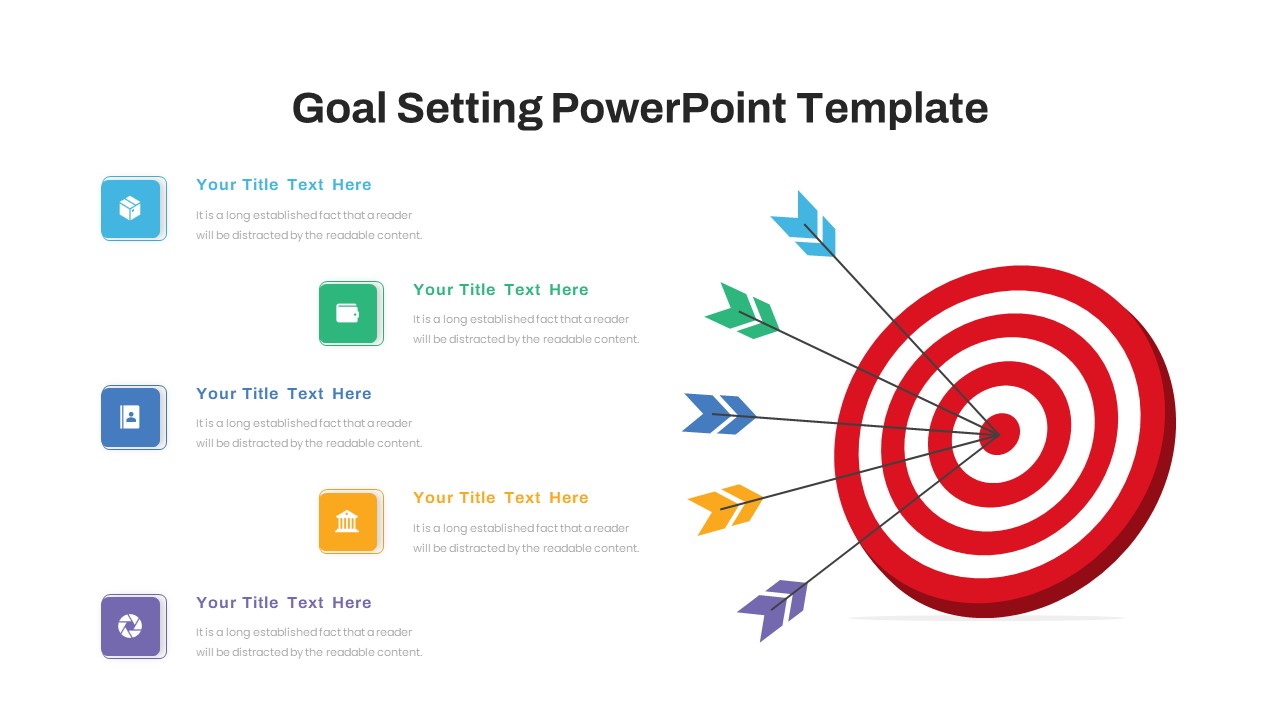
Free Goal Setting Target Infographic Slide Template for PowerPoint & Google Slides
Goals
Free
Free Online Shopping 3-Slide Infographic Template for PowerPoint & Google Slides
Digital Marketing
Free
Free Infographic Statistics Dashboard Slide for PowerPoint & Google Slides
Bar/Column
Free

Free Infographic Deck PowerPoint Pack for PowerPoint & Google Slides
Infographics
Free
Free Application Mockup Screens Infographic Template for PowerPoint & Google Slides
Comparison
Free

Free Multi-Year Arrow Timeline Infographic Template for PowerPoint & Google Slides
Timeline
Free
Free Five-Step Circular Timeline Infographic Template for PowerPoint & Google Slides
Timeline
Free
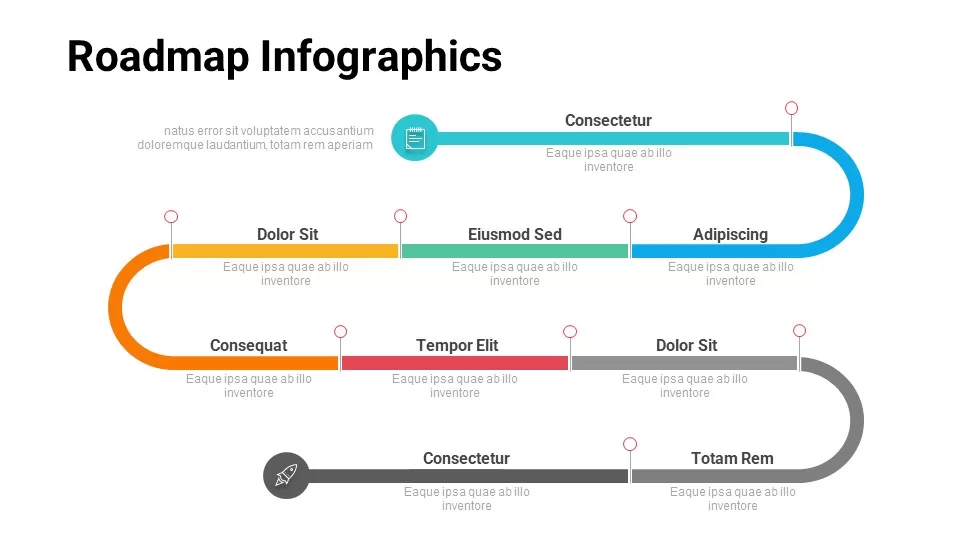
Free Multi-Level Roadmap Infographic Template for PowerPoint & Google Slides
Roadmap
Free
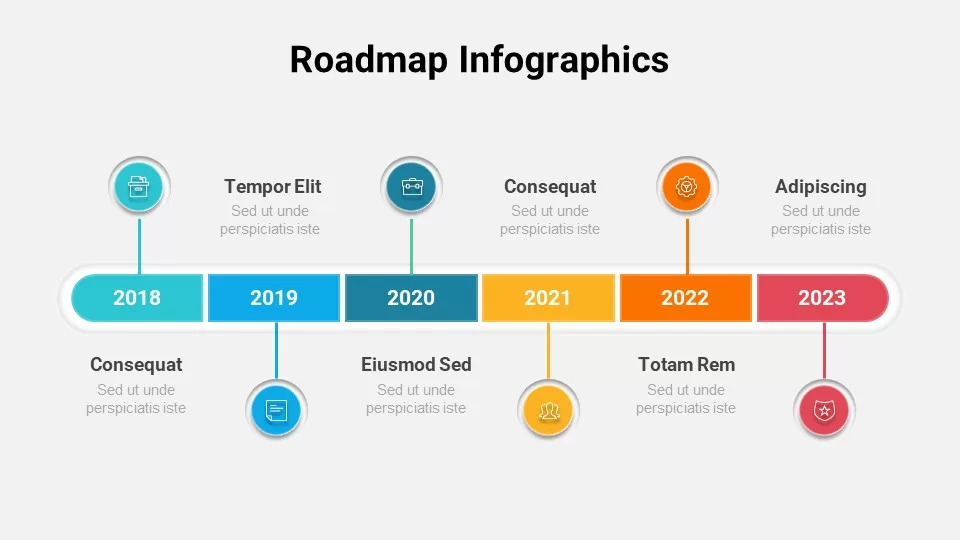
Free Colorful Roadmap Timeline Infographic Template for PowerPoint & Google Slides
Roadmap
Free
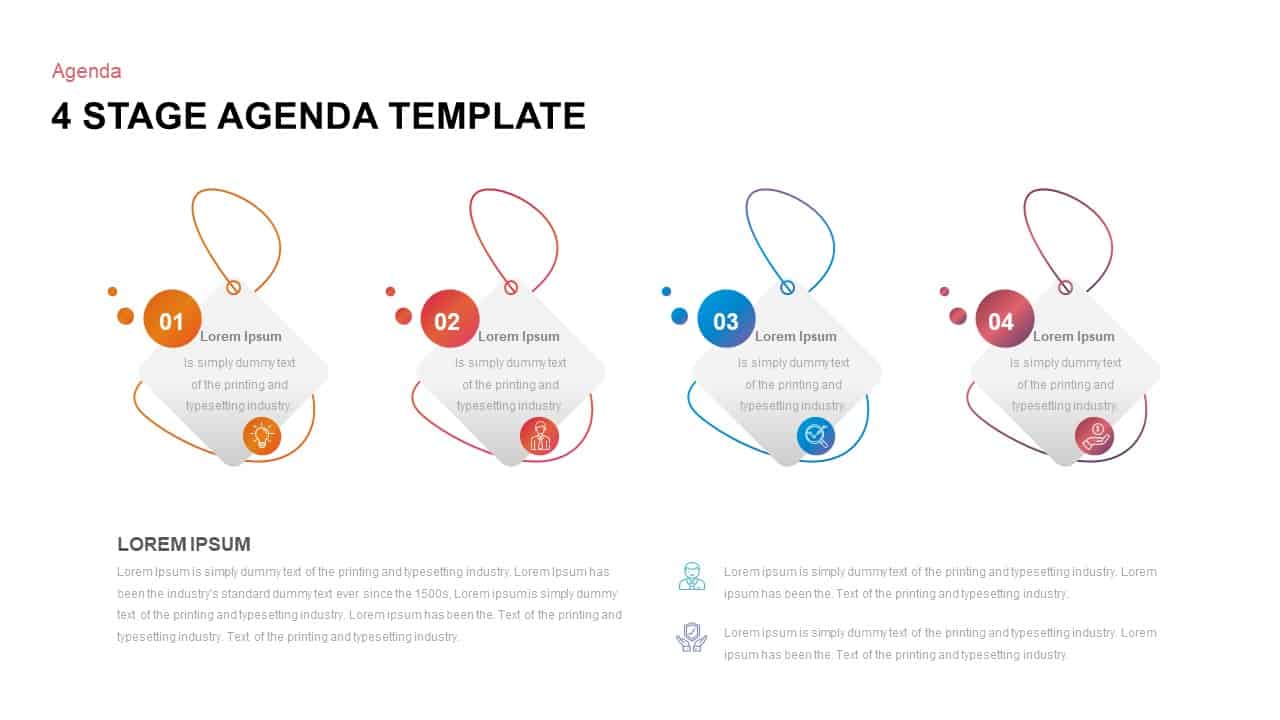
Free Modern Four-Step Agenda Infographic Template for PowerPoint & Google Slides
Agenda
Free
Free Curved Arrow Infographic Diagram Template for PowerPoint & Google Slides
Arrow
Free
Free Five-Part Hexagon Infographic Cluster Template for PowerPoint & Google Slides
Infographics
Free
Free Metro UI Dashboard Infographic Template for PowerPoint & Google Slides
Business Report
Free
Free Mental Models Infographic Diagrams Template for PowerPoint & Google Slides
Process
Free
Free Traffic Signs Infographic Template for PowerPoint & Google Slides
Infographics
Free
Free ChatGPT Infographic Presentation Template for PowerPoint & Google Slides
Pitch Deck
Free
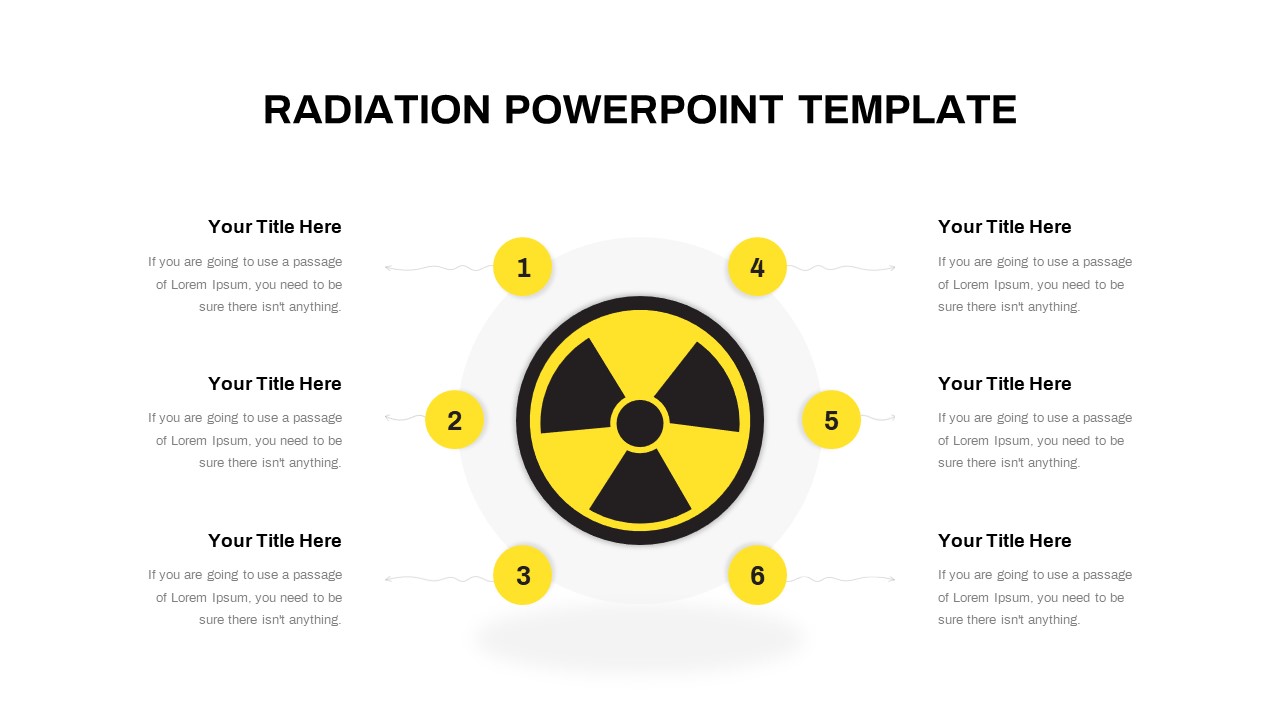
Free Radiation Hub and Spoke Infographic Template for PowerPoint & Google Slides
Circular
Free
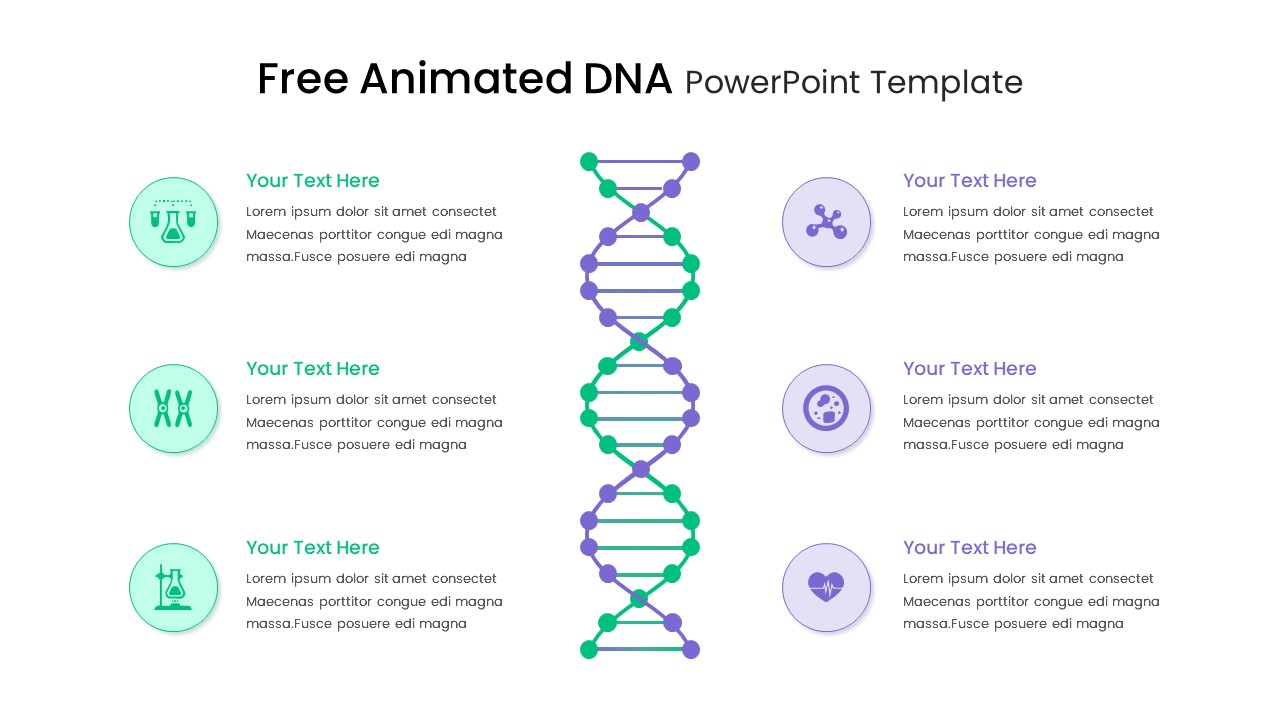
Free Animated DNA Infographic Diagram Template for PowerPoint & Google Slides
Infographics
Free
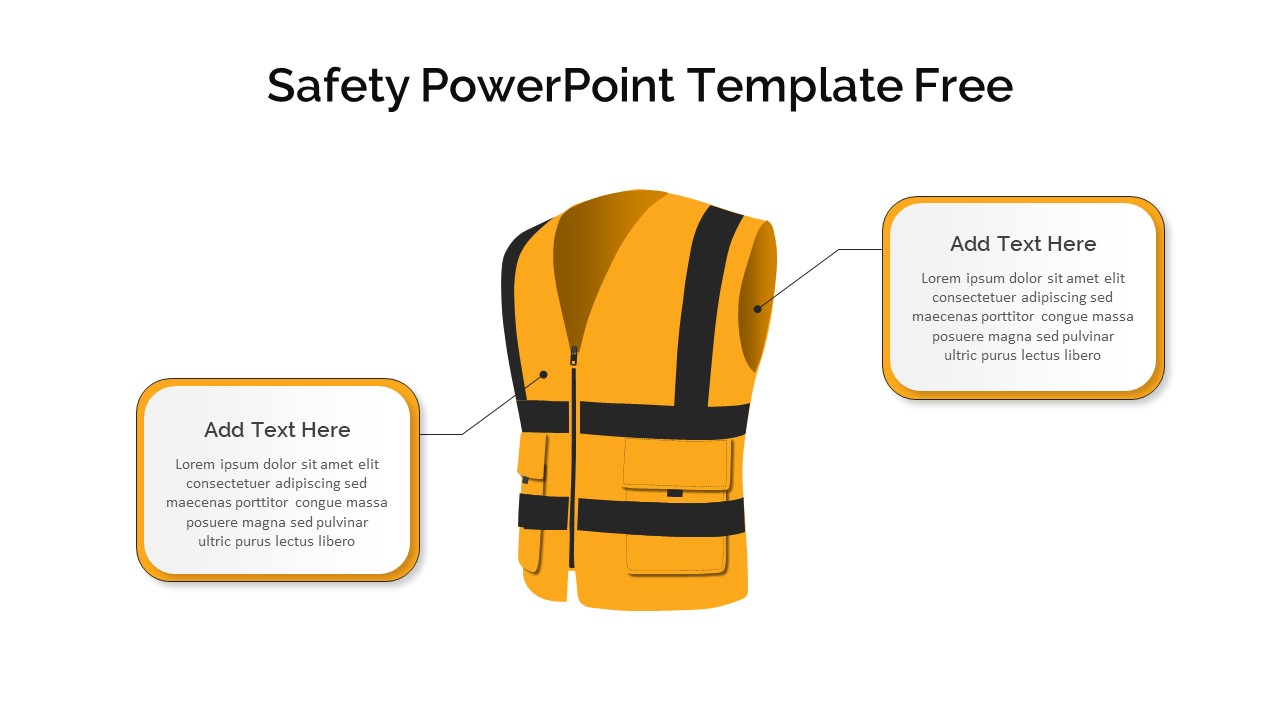
Free 4 Safety Equipment Infographic Pack Template for PowerPoint & Google Slides
Pitch Deck
Free
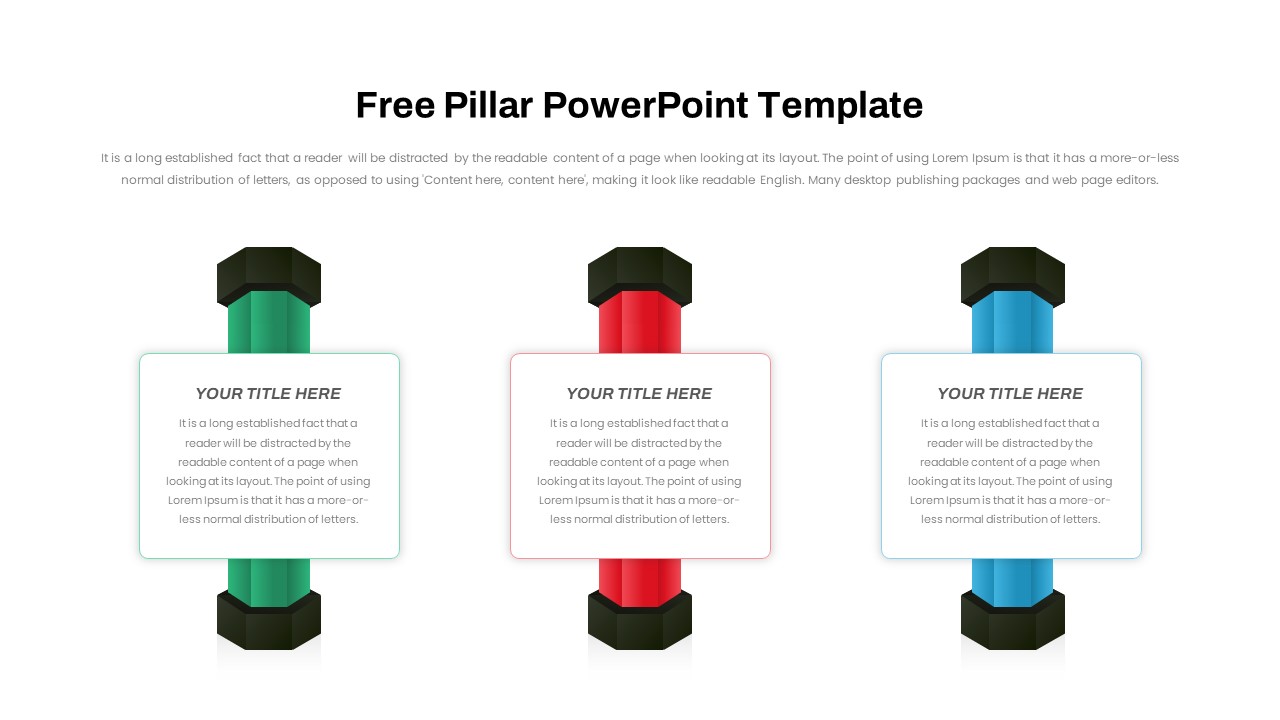
Free Three and Four Pillar Infographic Pack Template for PowerPoint & Google Slides
Process
Free
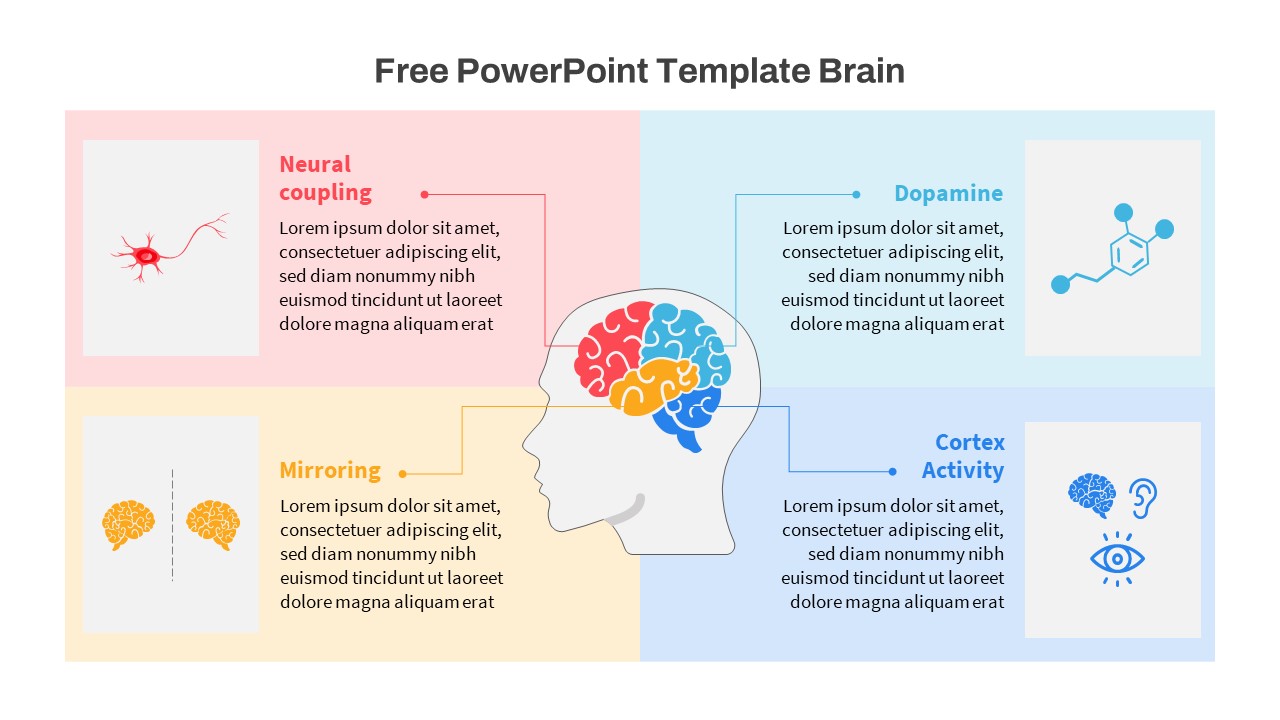
Free Brain Function Diagram Infographic Template for PowerPoint & Google Slides
Process
Free
Free Global Warming Infographic Comparison Template for PowerPoint & Google Slides
Comparison Chart
Free
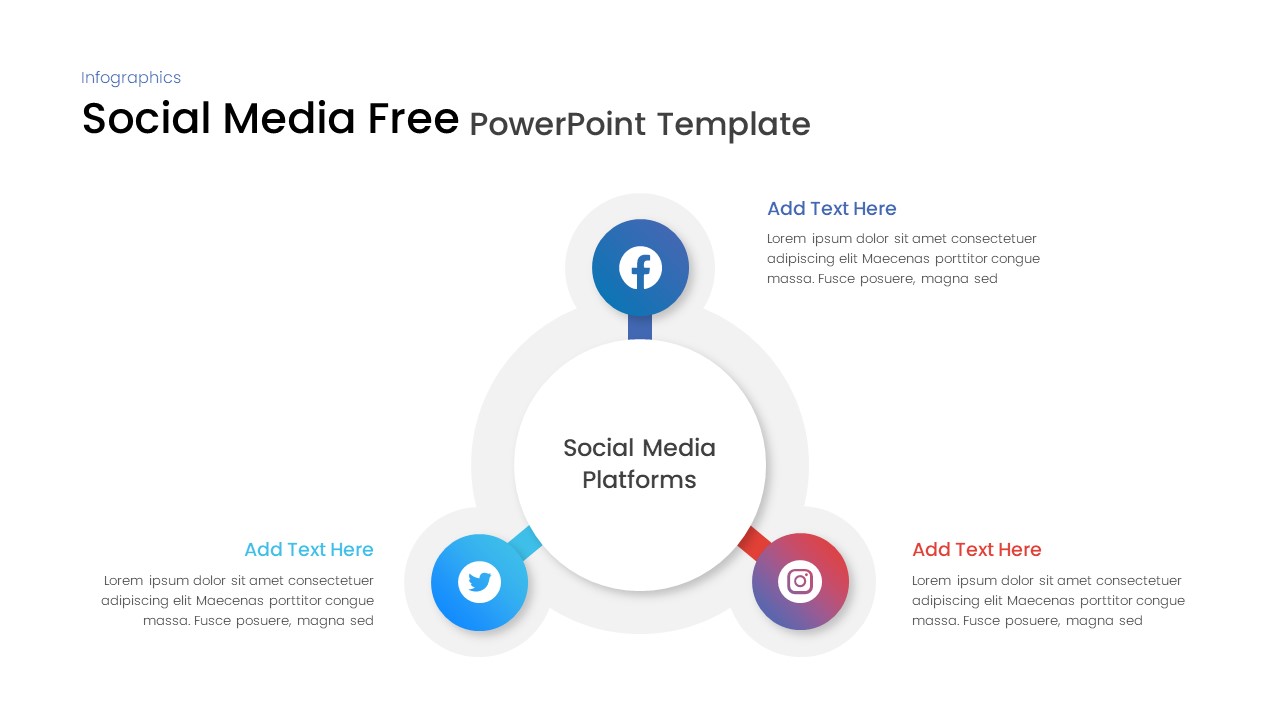
Free Social Media Hub-and-Spoke Infographic Template for PowerPoint & Google Slides
Circular
Free
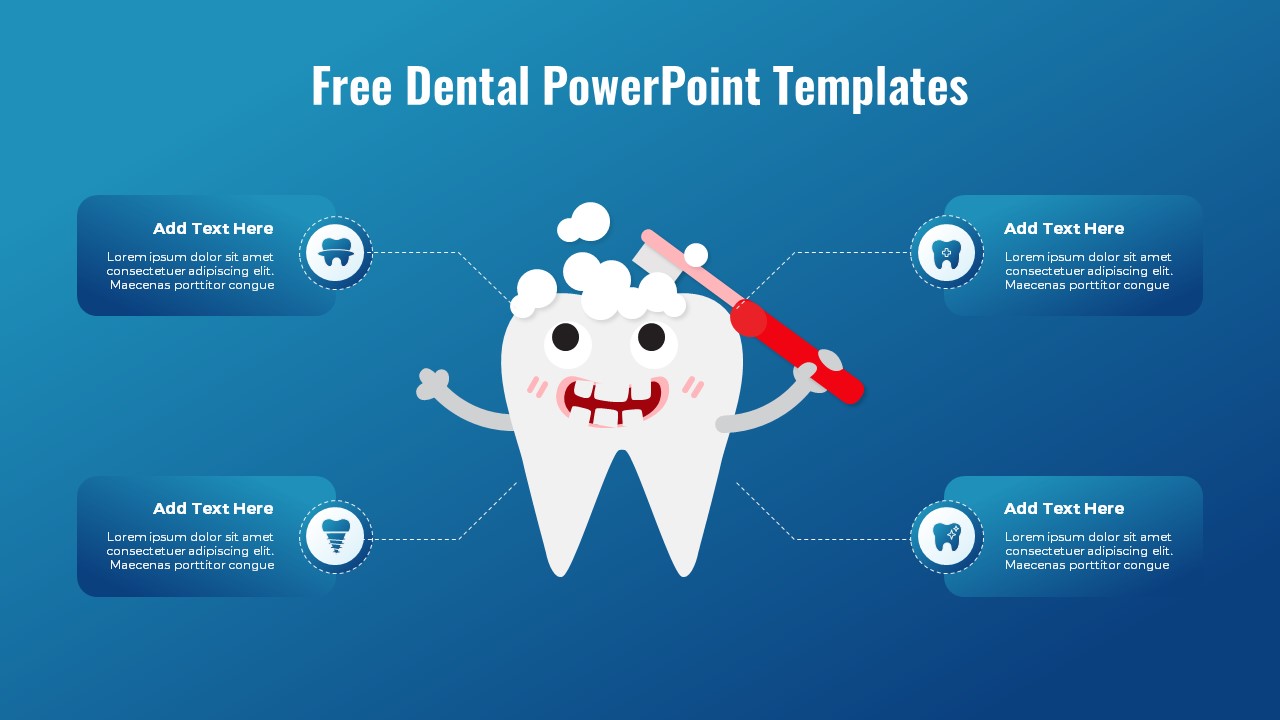
Free Cute Dental Health Infographic Layout for PowerPoint & Google Slides
Health
Free
Five 3D Growth Arrow Infographic Slide Template for PowerPoint & Google Slides
Arrow
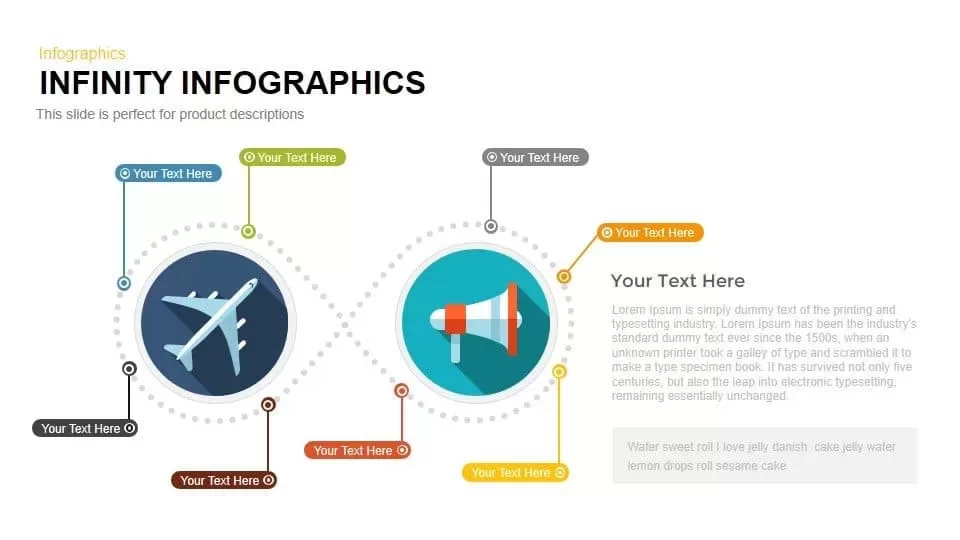
Looped Infinity Infographic Slide Template for PowerPoint & Google Slides
Process
Key Metaphor Infographic Slide Template for PowerPoint & Google Slides
Process
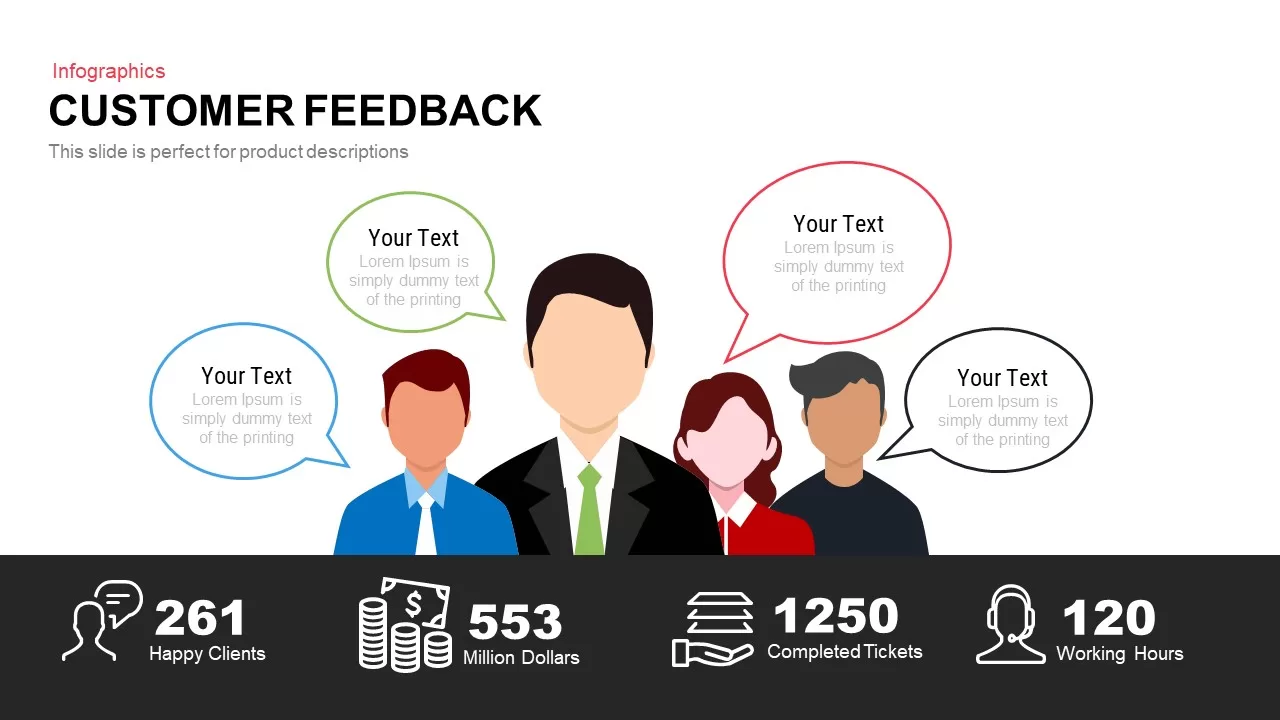
Customer Feedback Infographic Slide Template for PowerPoint & Google Slides
Customer Experience
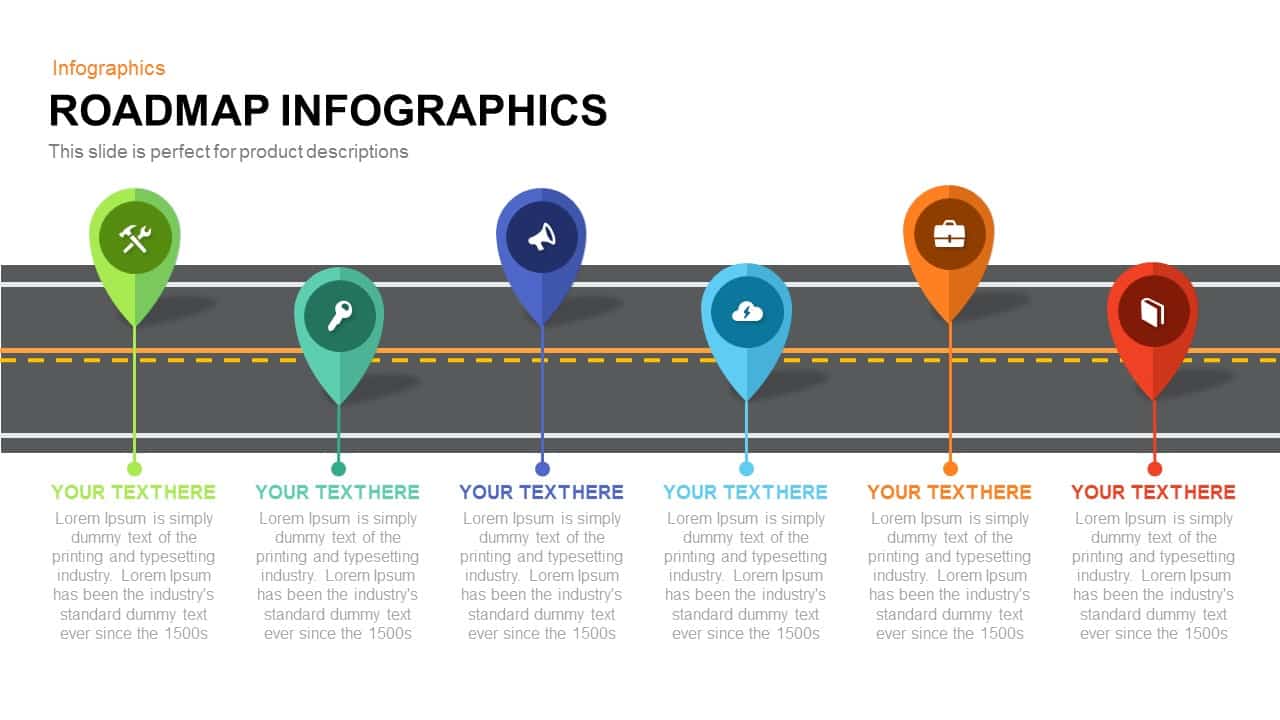
Roadmap Infographic Timeline Slide Template for PowerPoint & Google Slides
Roadmap
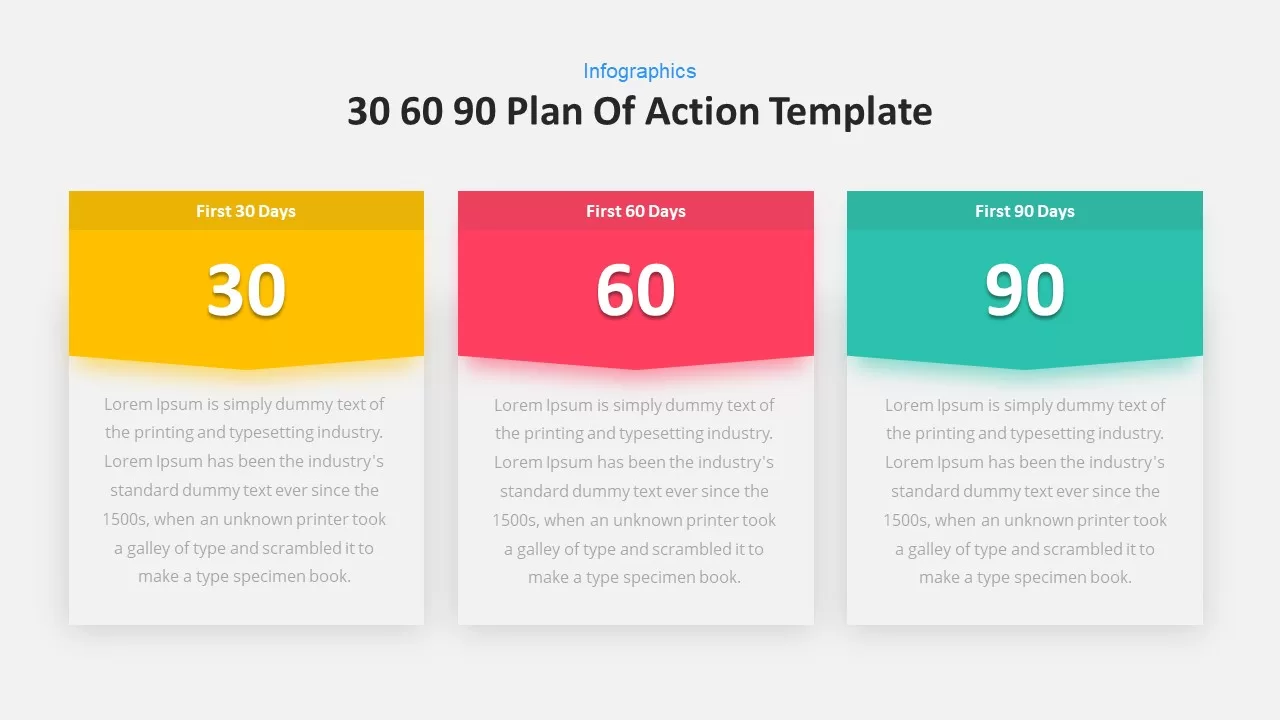
30 60 90-Day Plan Infographic Slide Template for PowerPoint & Google Slides
Business
Arrow Timeline Infographic Slide Template for PowerPoint & Google Slides
Timeline
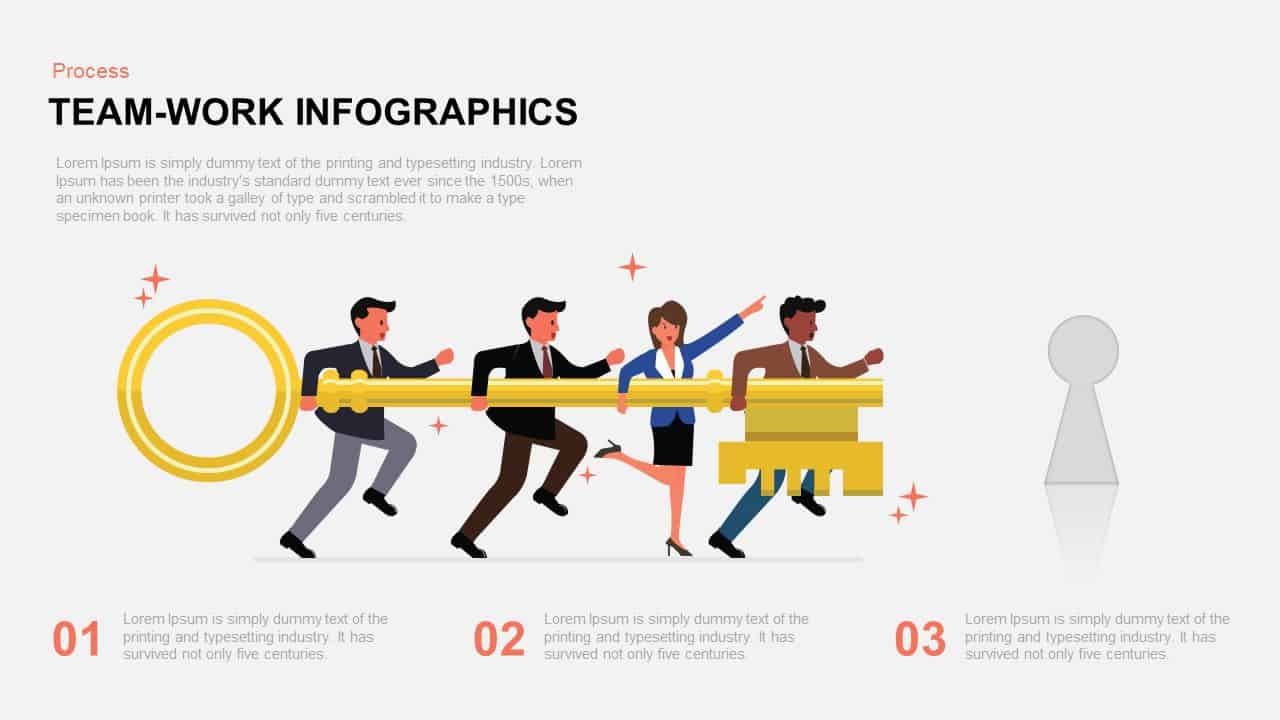
Teamwork Key Infographic Slide Template for PowerPoint & Google Slides
Process
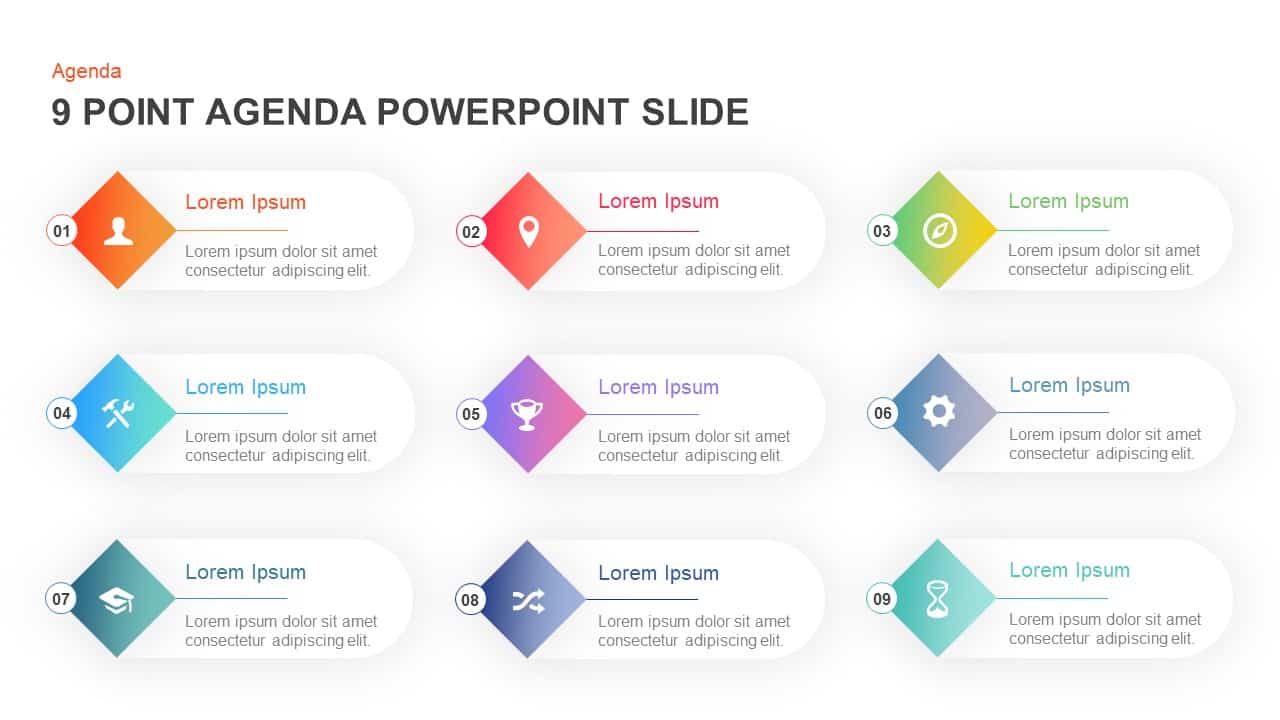
Nine-Point Agenda Infographic Slide Template for PowerPoint & Google Slides
Agenda
Five-Step Growth Infographic Slide Template for PowerPoint & Google Slides
Process
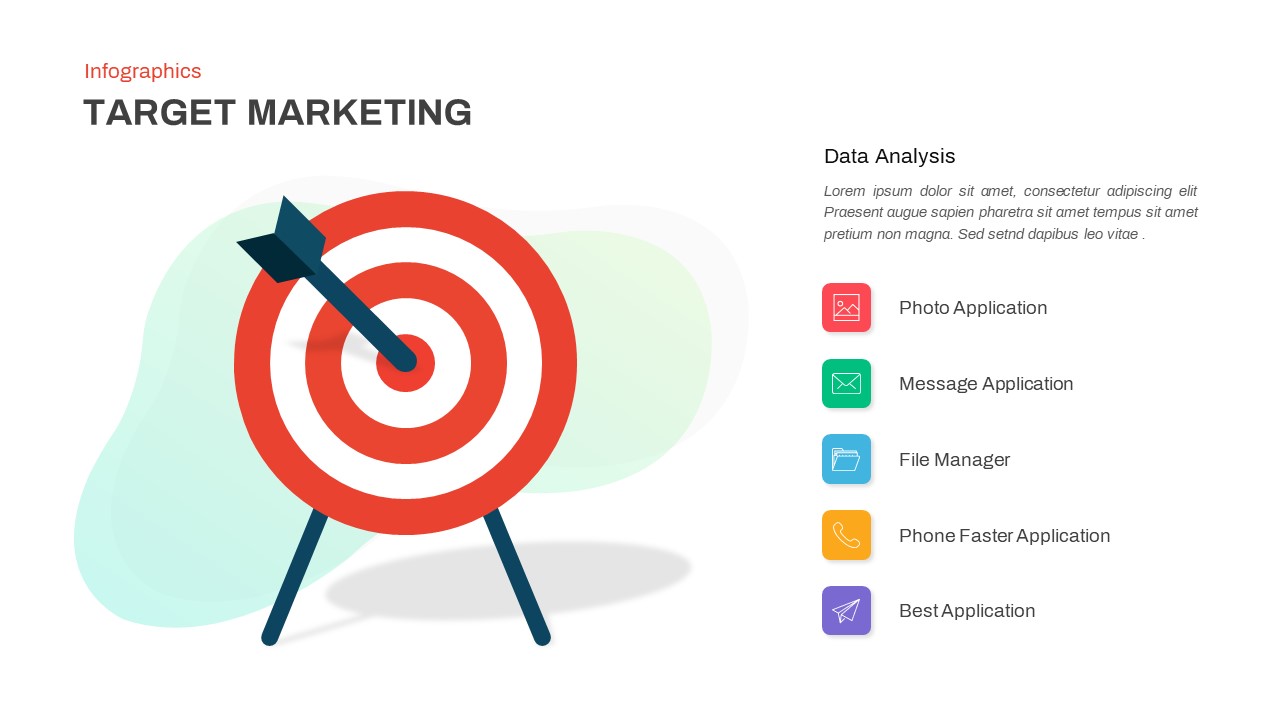
Target Marketing Infographic Slide Pack Template for PowerPoint & Google Slides
Infographics
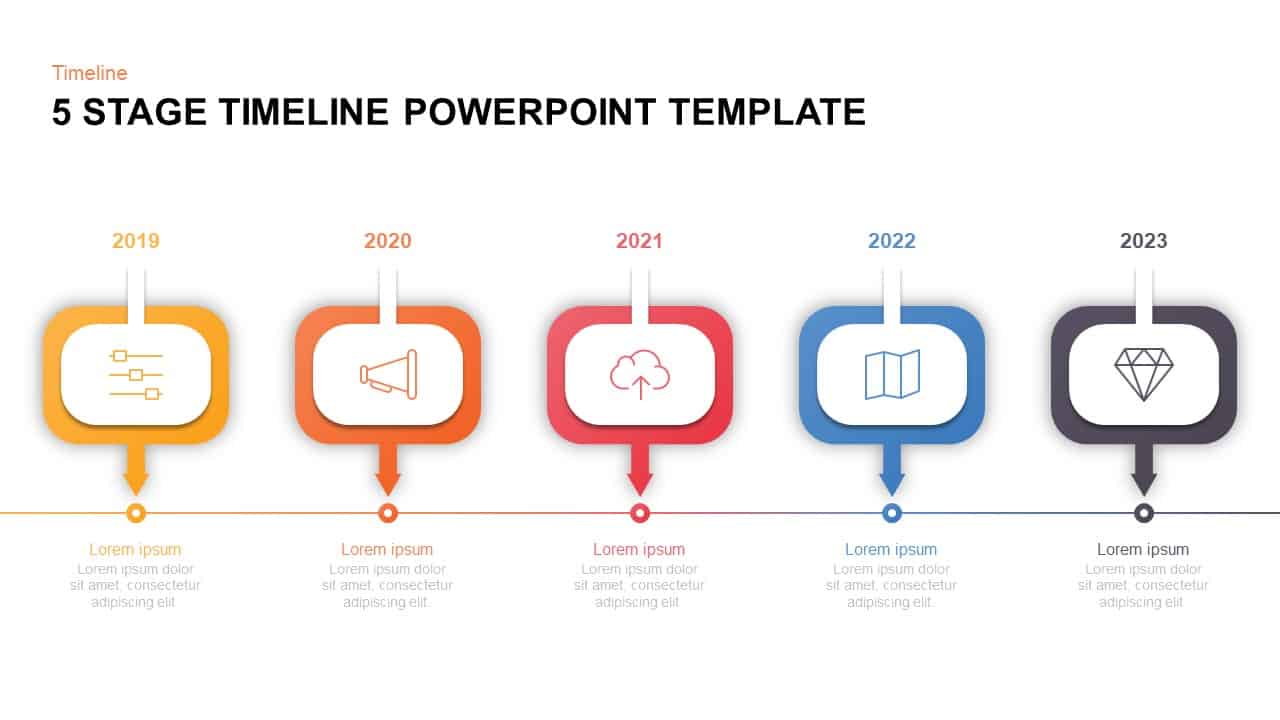
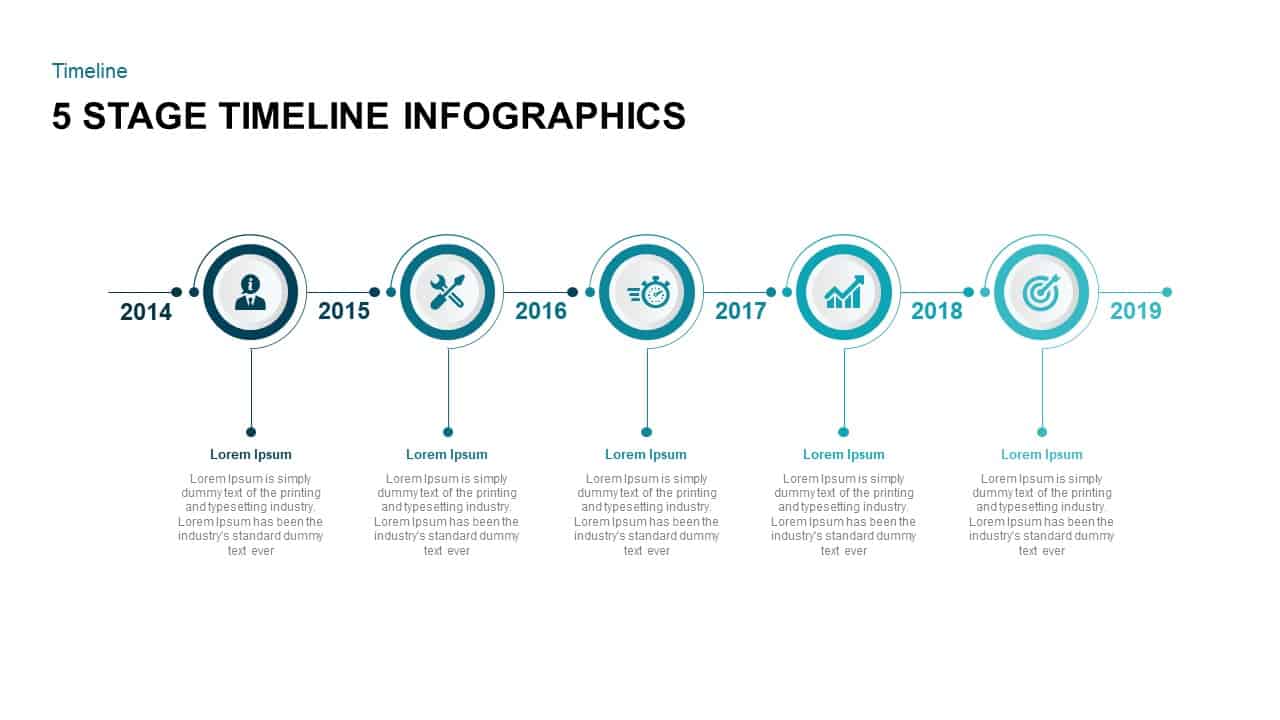
5 Stage Timeline Infographic Slide Template for PowerPoint & Google Slides
Timeline
Two-Column Comparison Infographic Slide Template for PowerPoint & Google Slides
Comparison

Team Achievements Infographic Slide Template for PowerPoint & Google Slides
Accomplishment
Shape Loop Four-Step Infographic Slide Template for PowerPoint & Google Slides
Process
Four-Stage Agenda Infographic Slide Template for PowerPoint & Google Slides
Agenda
5-Stage Timeline Infographic Slide Template for PowerPoint & Google Slides
Timeline
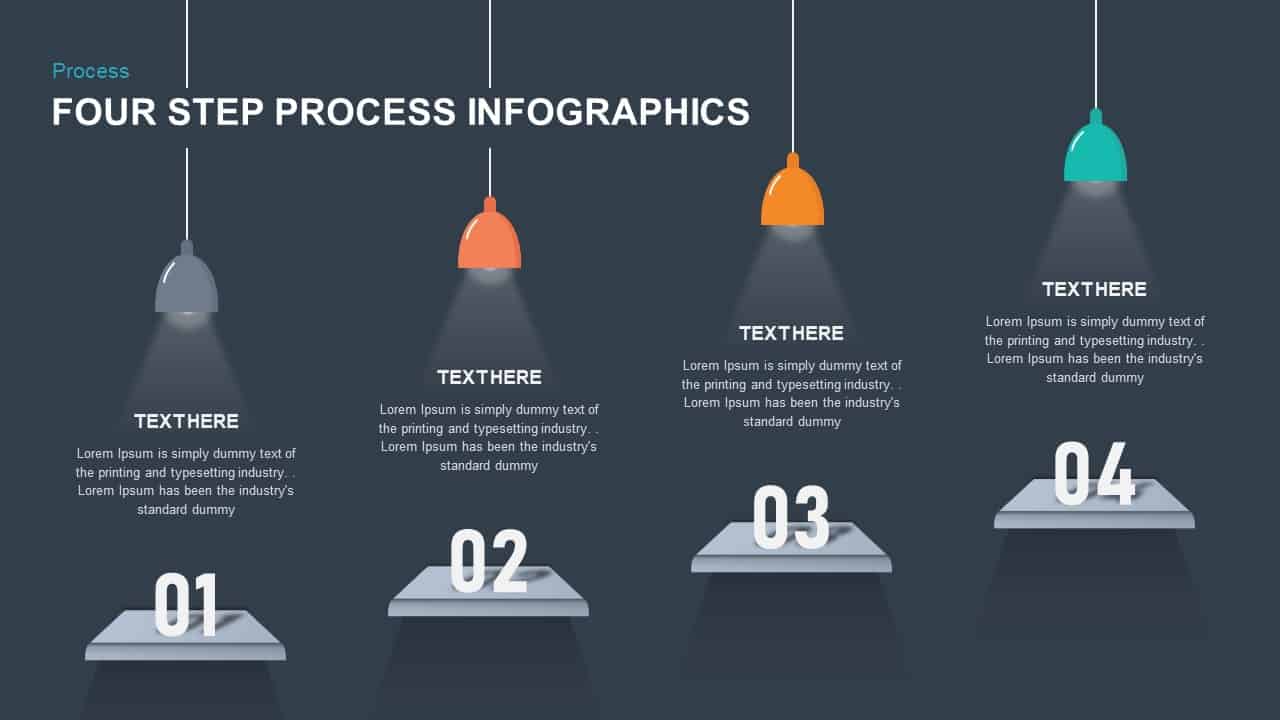
Four Step Process Infographic Slide Template for PowerPoint & Google Slides
Process
Target Goals Infographic Slide Template for PowerPoint & Google Slides
Goals
Mind Map Infographic Slide Template for PowerPoint & Google Slides
Mind Maps

Bulb Idea Concept Infographic Slide Template for PowerPoint & Google Slides
Process
Table of Contents Infographic Slide template for PowerPoint & Google Slides
Agenda
Multi-Style Flow Infographic Slide template for PowerPoint & Google Slides
Process
North America Map Infographic Slide Template for PowerPoint & Google Slides
World Maps
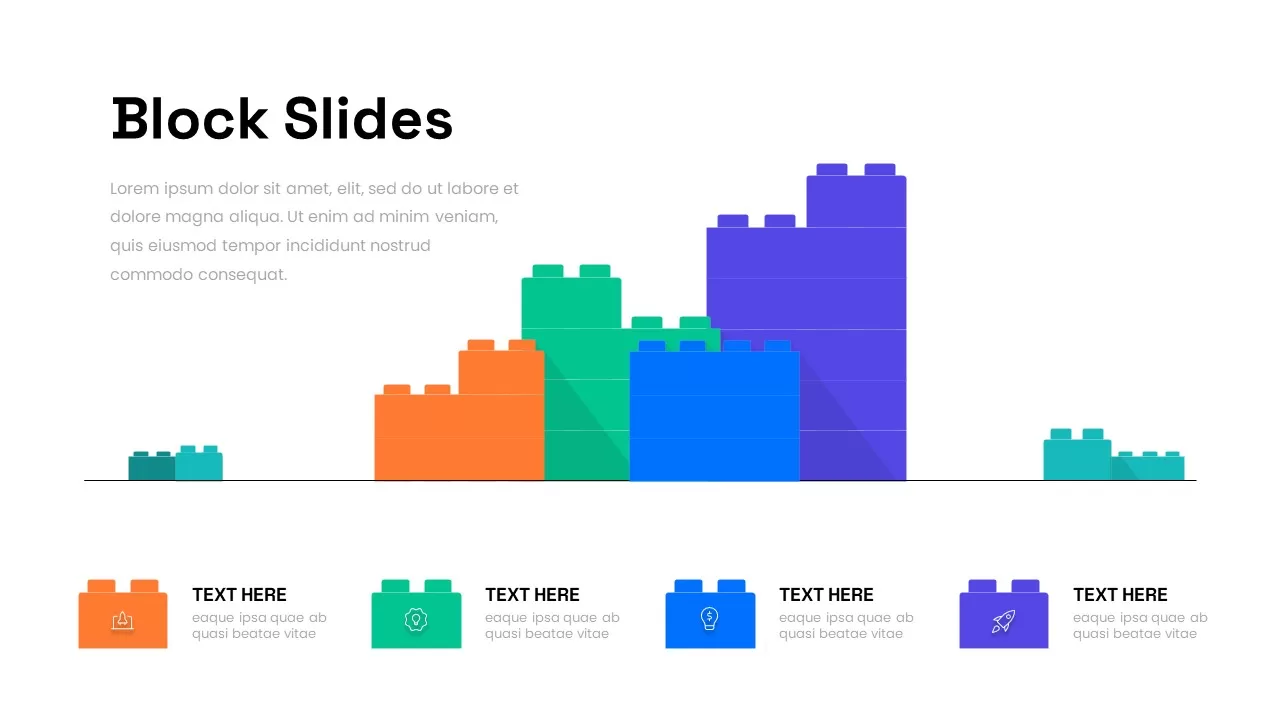
Modular Block Infographic Slide Template for PowerPoint & Google Slides
Infographics
Colorful Block Infographic Metrics Slide Template for PowerPoint & Google Slides
Infographics
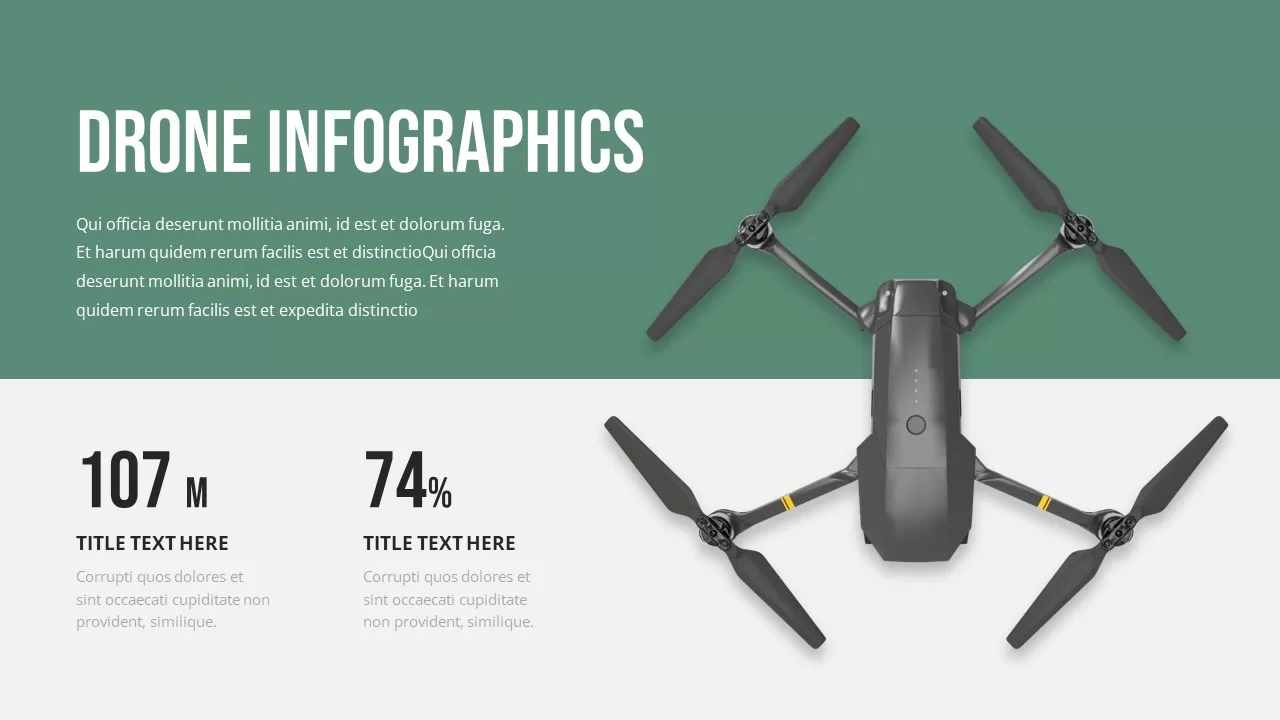
Professional Drone Infographic Slide Template for PowerPoint & Google Slides
Infographics
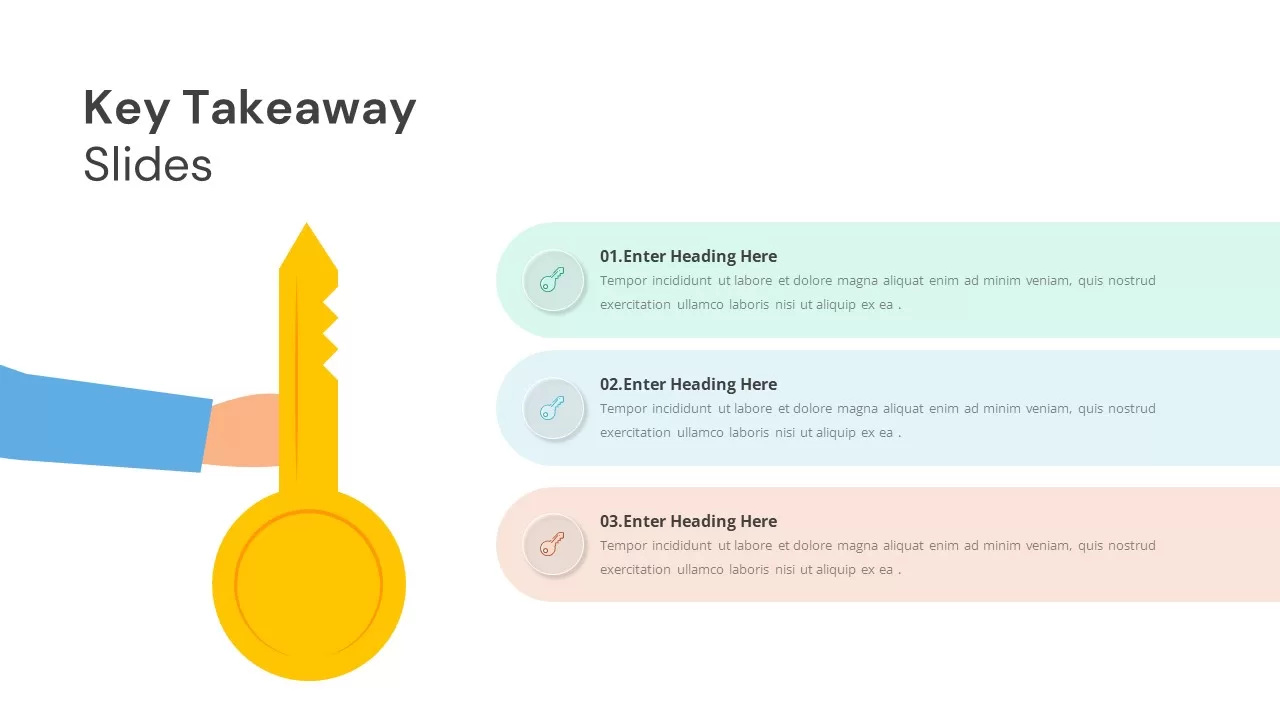
Key Takeaway Slide Infographic Template for PowerPoint & Google Slides
Process
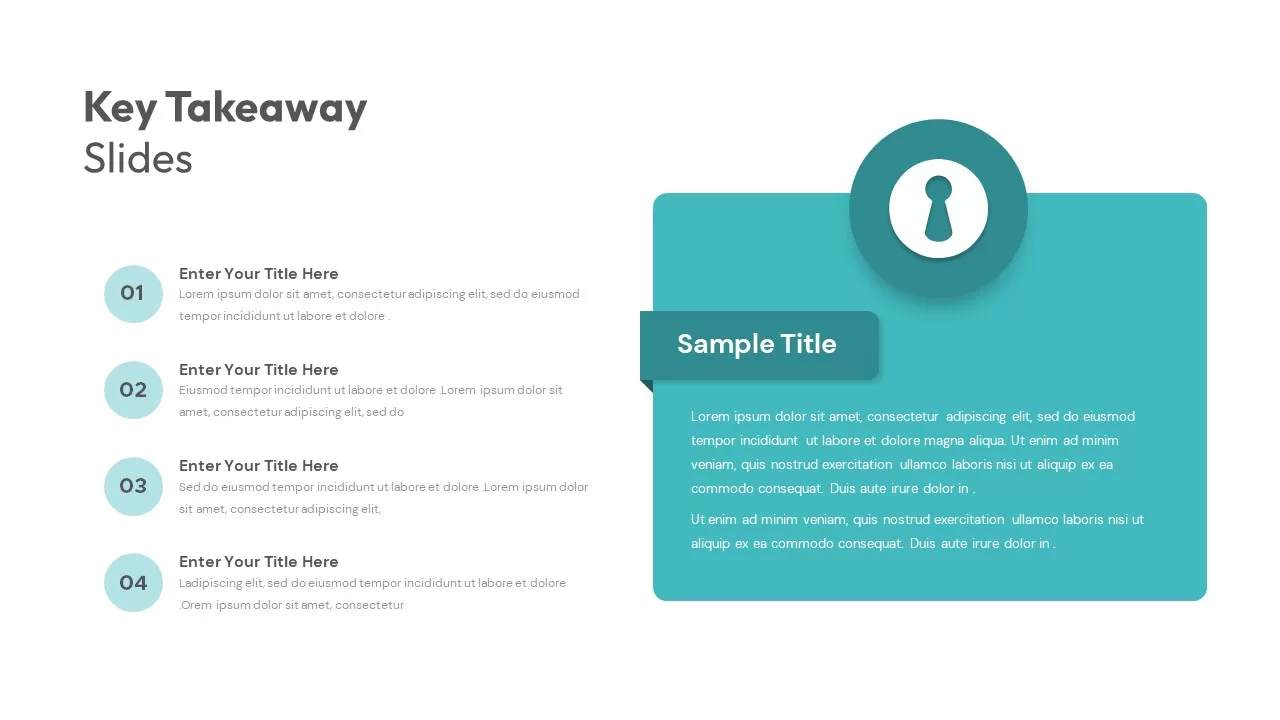
Key Takeaway Infographic Slide Deck Template for PowerPoint & Google Slides
Process
Key Takeaway Keyhole Infographic Slide Template for PowerPoint & Google Slides
Process
Animated 3D Dice Infographic Slide Template for PowerPoint & Google Slides
Process
Core Values Infographic Slide Template for PowerPoint & Google Slides
Comparison
8-Bell Curve Infographic Slide Template for PowerPoint & Google Slides
Comparison Chart
LinkedIn Metrics Infographic Slide Template for PowerPoint & Google Slides
Digital Marketing
Instagram Infographic Metrics Slide Template for PowerPoint & Google Slides
Marketing
Bow and Arrow Goal Infographic Slide Template for PowerPoint & Google Slides
Goals
Triangle Infographic Slide Collection Template for PowerPoint & Google Slides
Decks
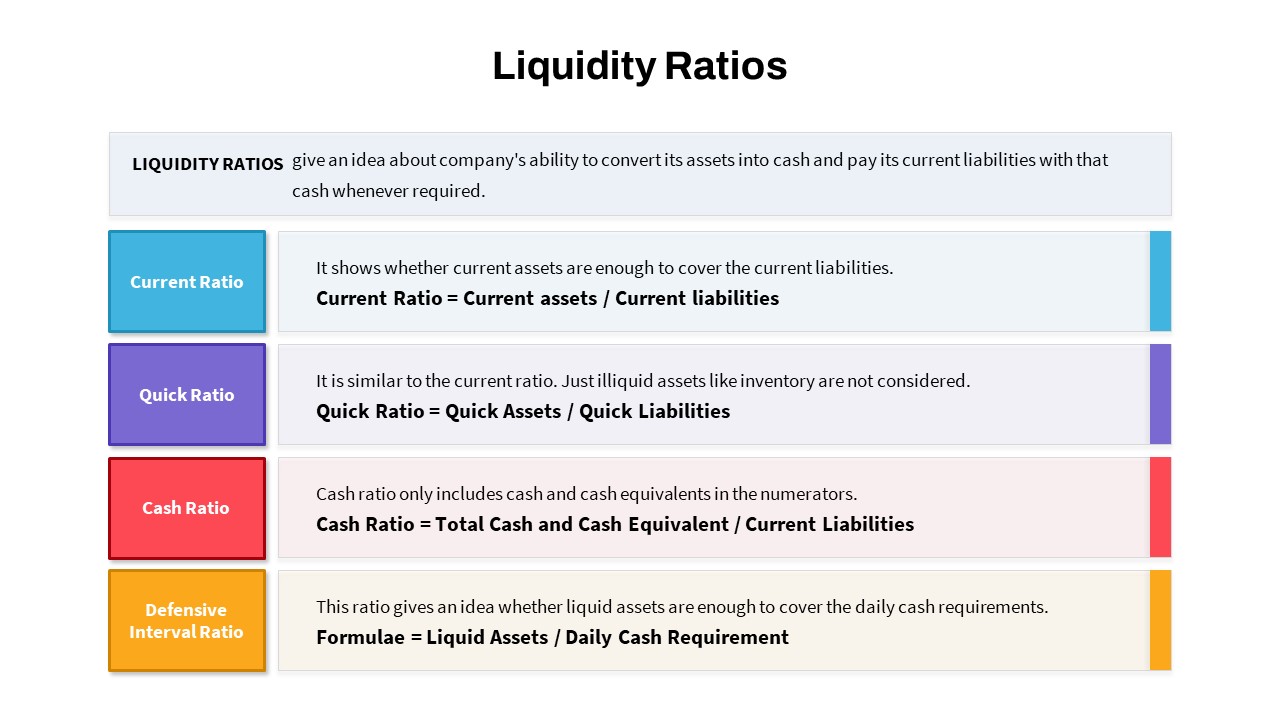
Liquidity Ratios Infographic Slide Template for PowerPoint & Google Slides
Finance
Editable Ireland Map Infographic Slide Template for PowerPoint & Google Slides
World Maps
Free
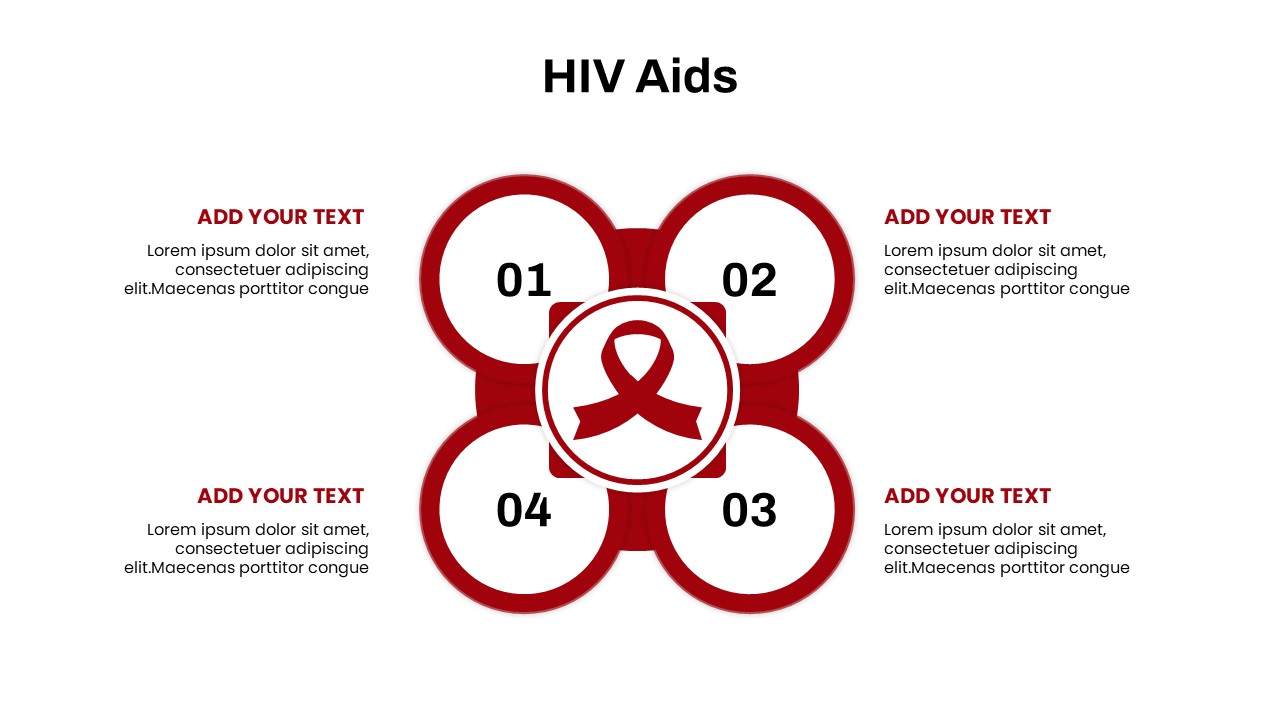
HIV AIDS Infographic Diagram Slide Deck Template for PowerPoint & Google Slides
Graphics
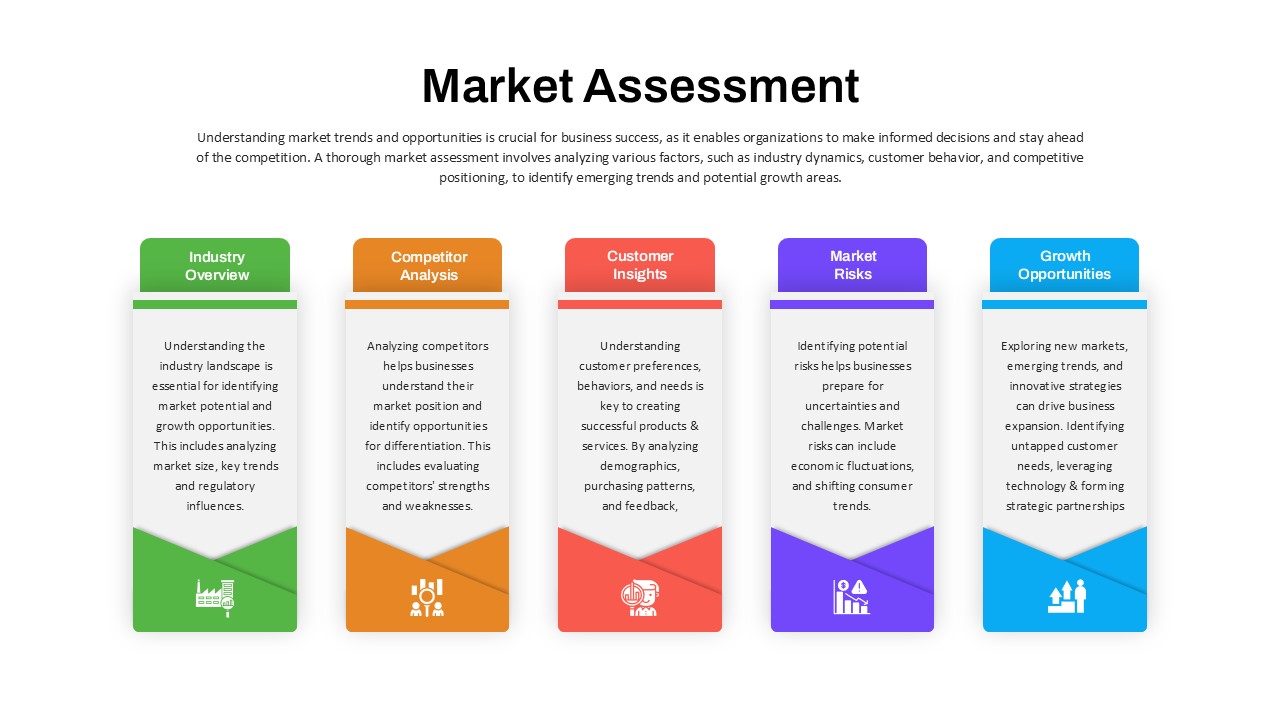
Market Assessment Infographic Slide Template for PowerPoint & Google Slides
Process
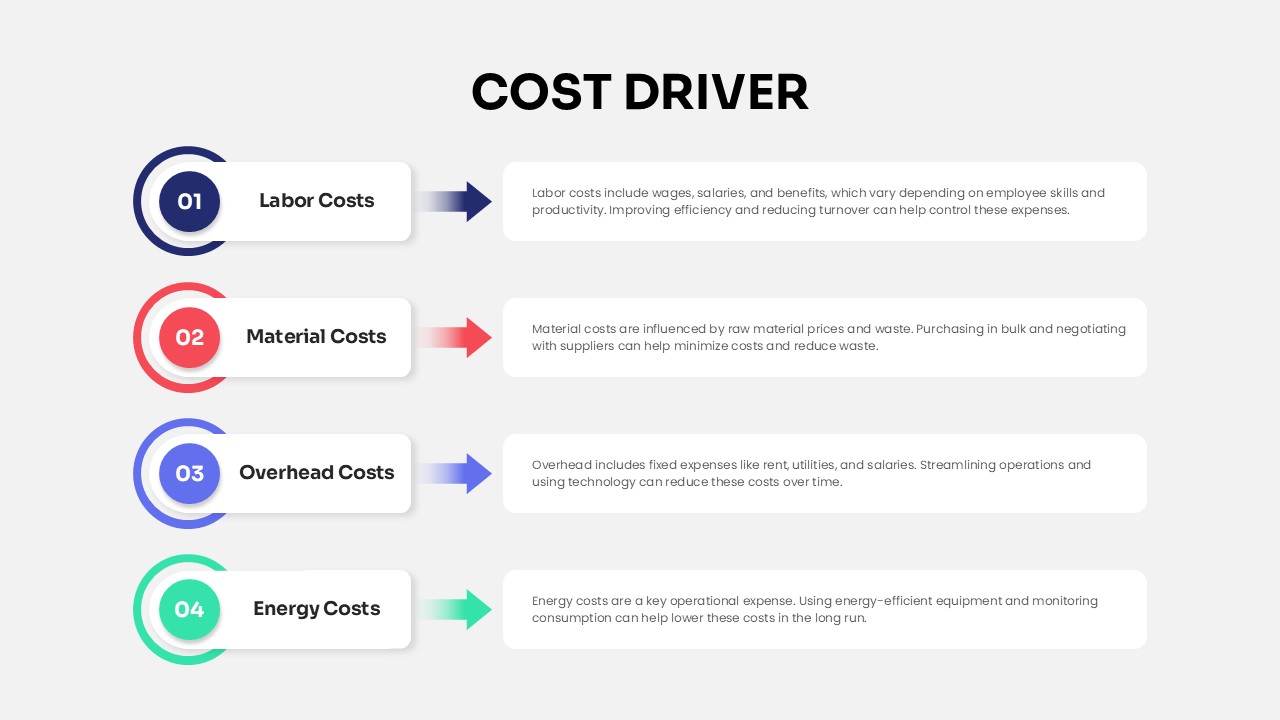
Cost Driver Infographic Slide Pack Template for PowerPoint & Google Slides
Process
Community Building Infographic Slide Template for PowerPoint & Google Slides
Leadership
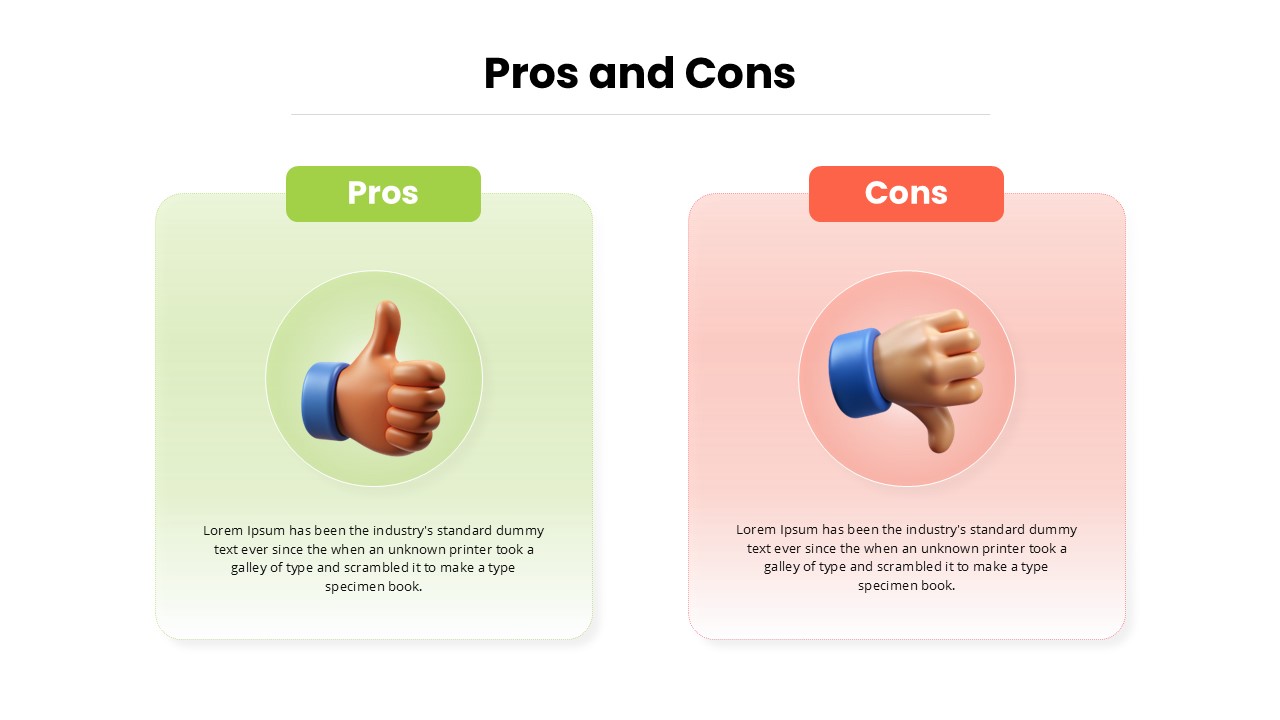
Pros and Cons Infographic Slide Pack Template for PowerPoint & Google Slides
Comparison
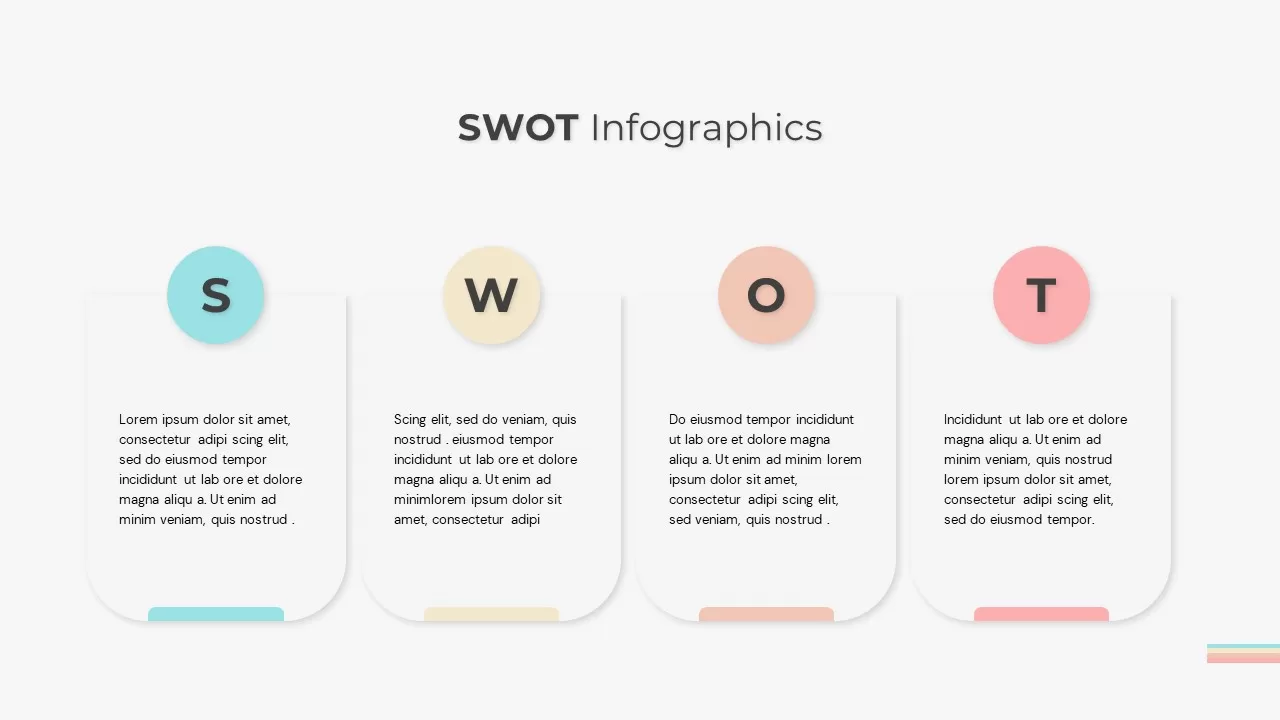
SWOT Analysis Infographic Slide for PowerPoint & Google Slides
SWOT
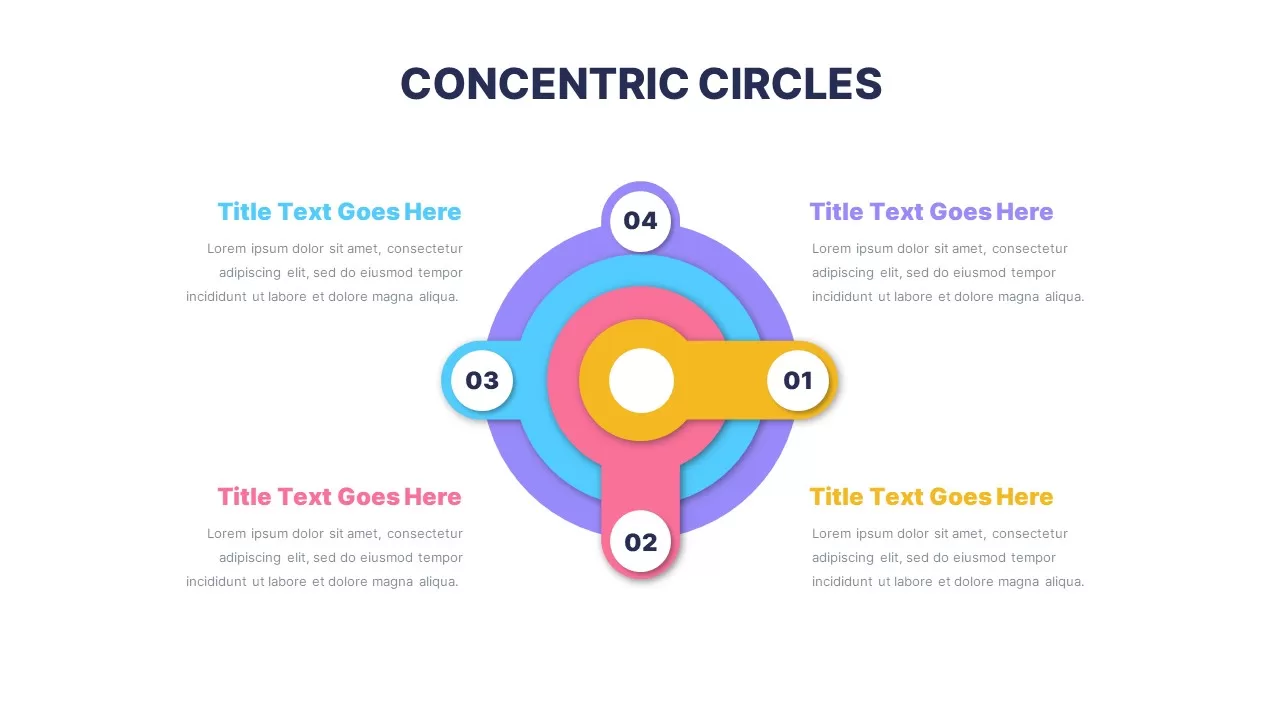
Colorful Concentric Circles Infographic Slide for PowerPoint & Google Slides
Process
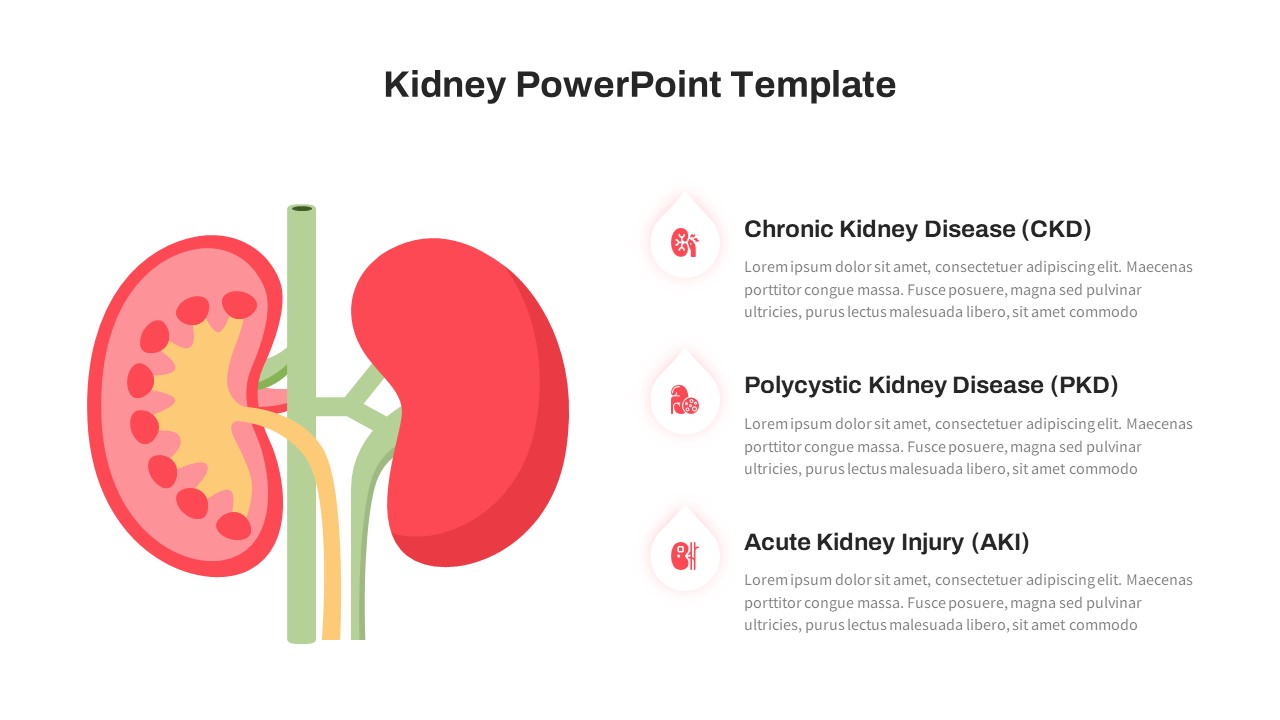
Kidney Disease Infographic Slide for PowerPoint & Google Slides
Health
Google Ads Optimization & Performance Infographic Template for PowerPoint & Google Slides
Digital Marketing
SQ3R Study Strategy Infographic Slides Template for PowerPoint & Google Slides
Business Strategy
Six Double Diamond Infographic Slides Template for PowerPoint & Google Slides
Process
Sales Process Infographic Slides Pack Template for PowerPoint & Google Slides
Process
Casino/Poker Chips Infographic Slides template for PowerPoint & Google Slides
Business Strategy
Agenda Infographic Pack of 2 Slides Template for PowerPoint & Google Slides
Agenda
Quad Chart Infographic Pack of 8 Slides Template for PowerPoint & Google Slides
Comparison Chart
Four Options Infographic Slides Template for PowerPoint & Google Slides
Comparison
Game Plan Infographic Slides Pack Template for PowerPoint & Google Slides
Infographics
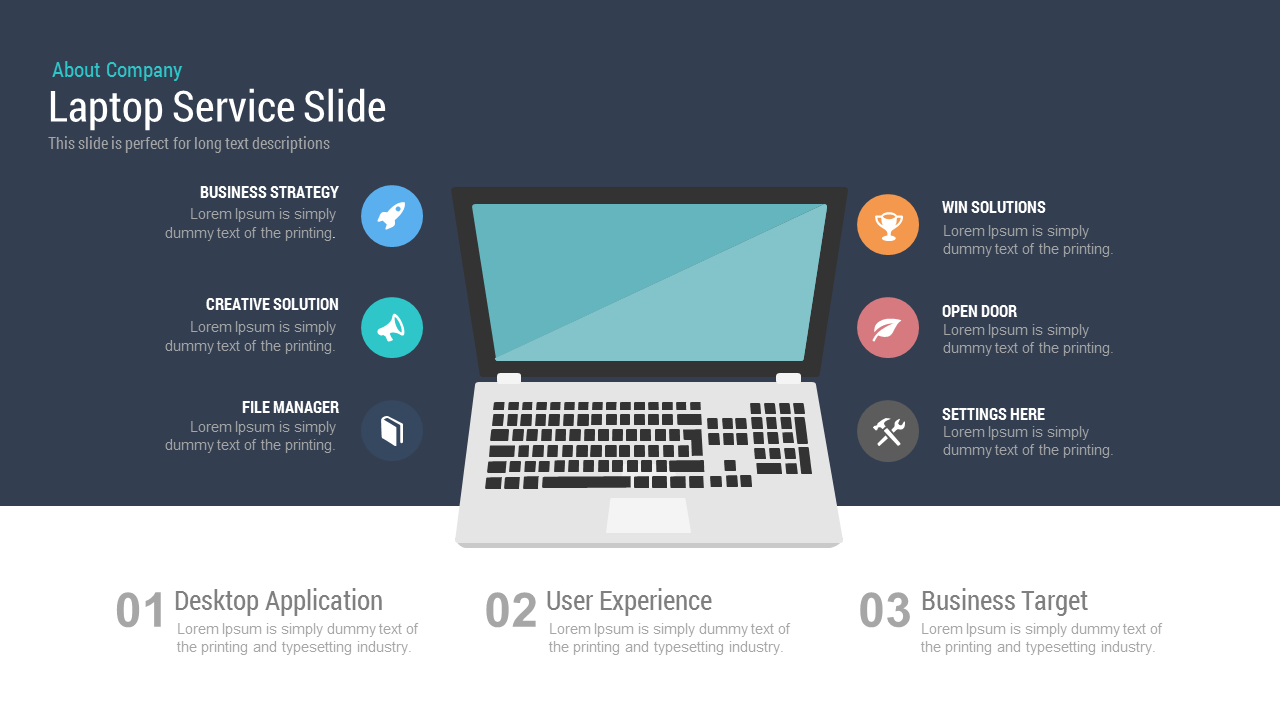
Free Laptop Service Slide template for PowerPoint & Google Slides
Business
Free
Free Thank You Slide Template for PowerPoint & Google Slides
Graphics
Free
Free Veterans Day Patriotic Slide Pack Template for PowerPoint & Google Slides
Graphics
Free

Free Chocolate Company Profile Slide Template for PowerPoint & Google Slides
Company Profile
Free
Free Editable Simple Column Chart Slide Template for PowerPoint & Google Slides
Bar/Column
Free
Free World UFO Day Slide Template for PowerPoint & Google Slides
Business
Free
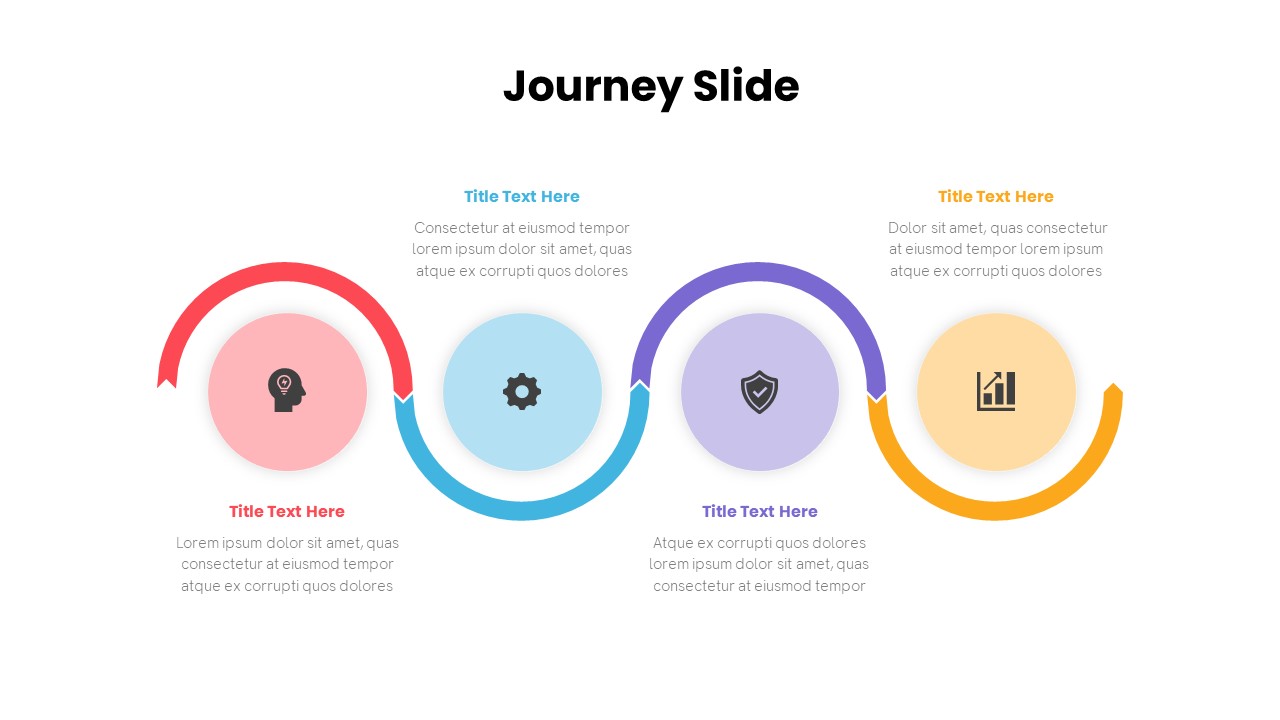
Free Journey Slide with Four Icons Diagram Template for PowerPoint & Google Slides
Process
Free
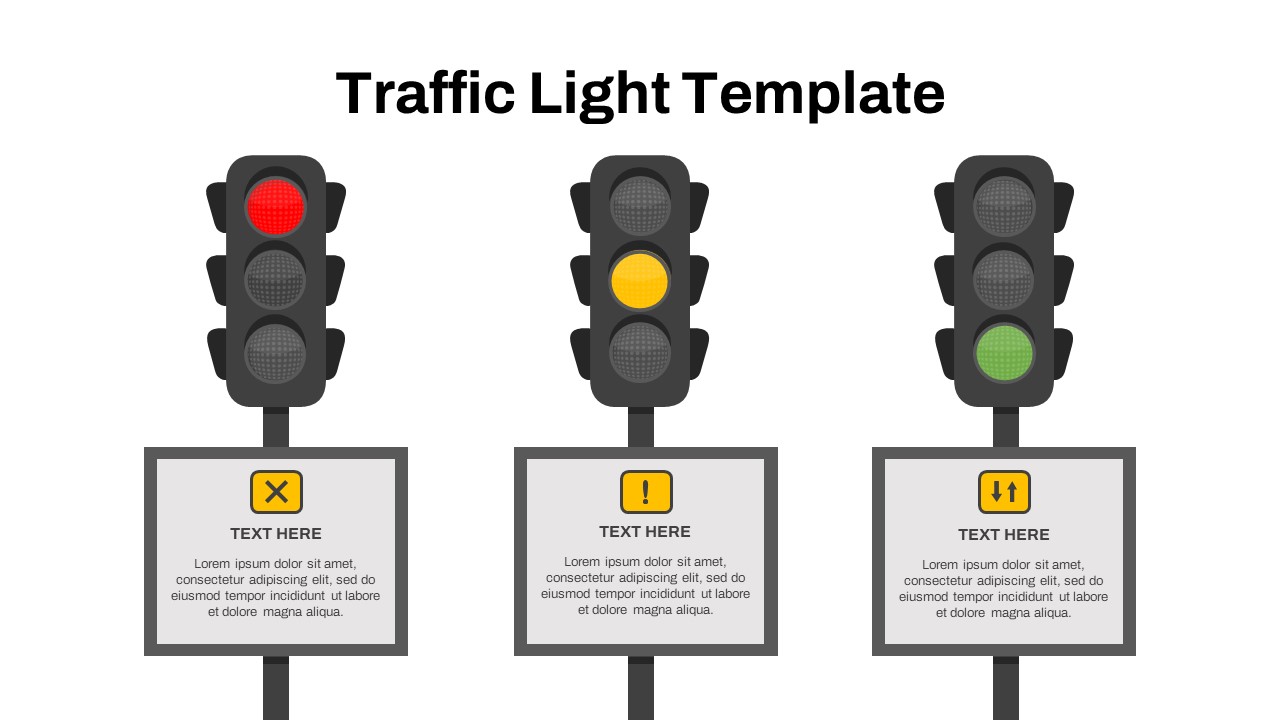
Free Traffic Light Status Indicator Slide Template for PowerPoint & Google Slides
Project Status
Free
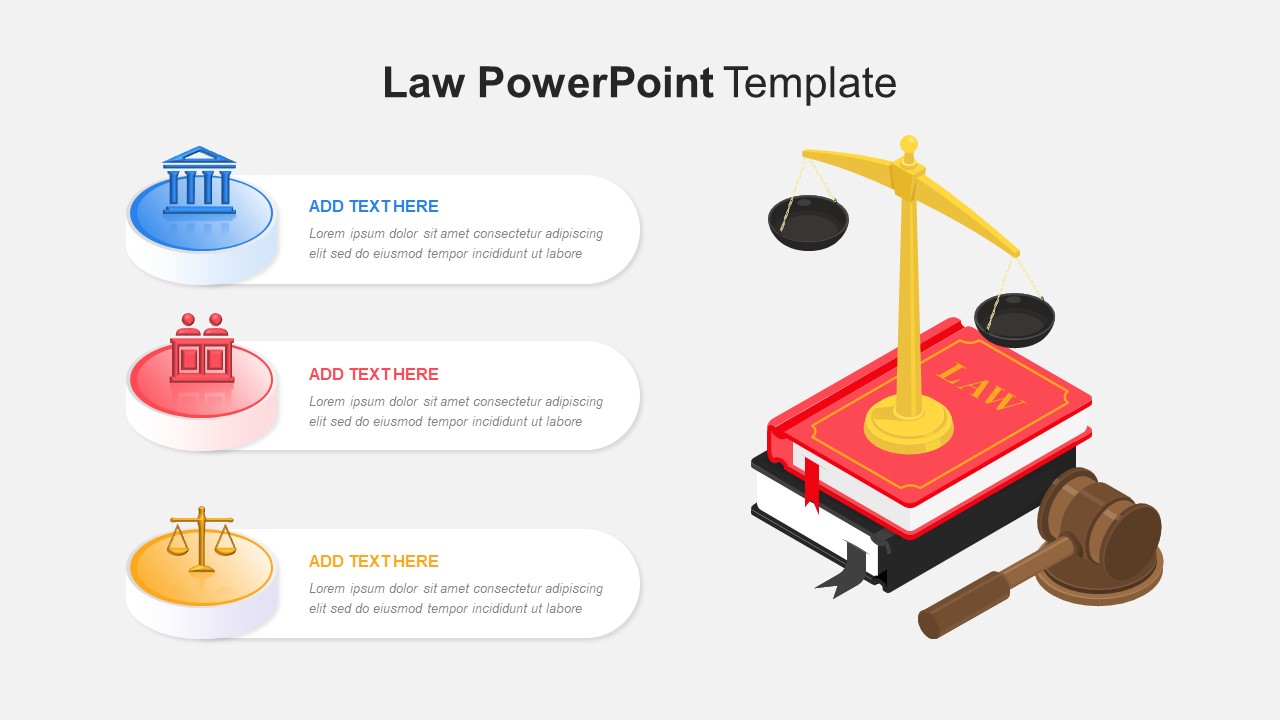
Free Law Infographics Slide Pack Collection Template for PowerPoint & Google Slides
Infographics
Free
Free Festive Birthday Celebration Slide Template for PowerPoint & Google Slides
Graphics
Free
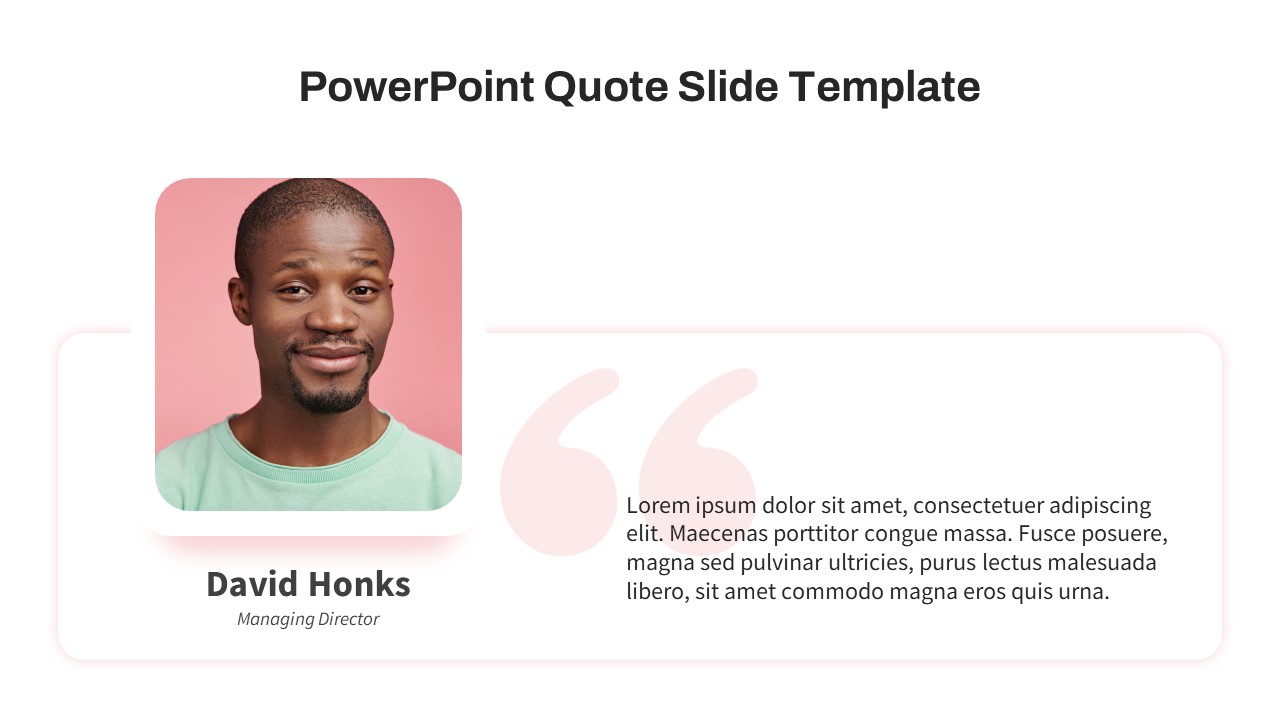
Free Elegant Executive Quote Slide Layout Template for PowerPoint & Google Slides
Our Team
Free
Free Thank You Slide Template for PowerPoint & Google Slides
Graphics
Free
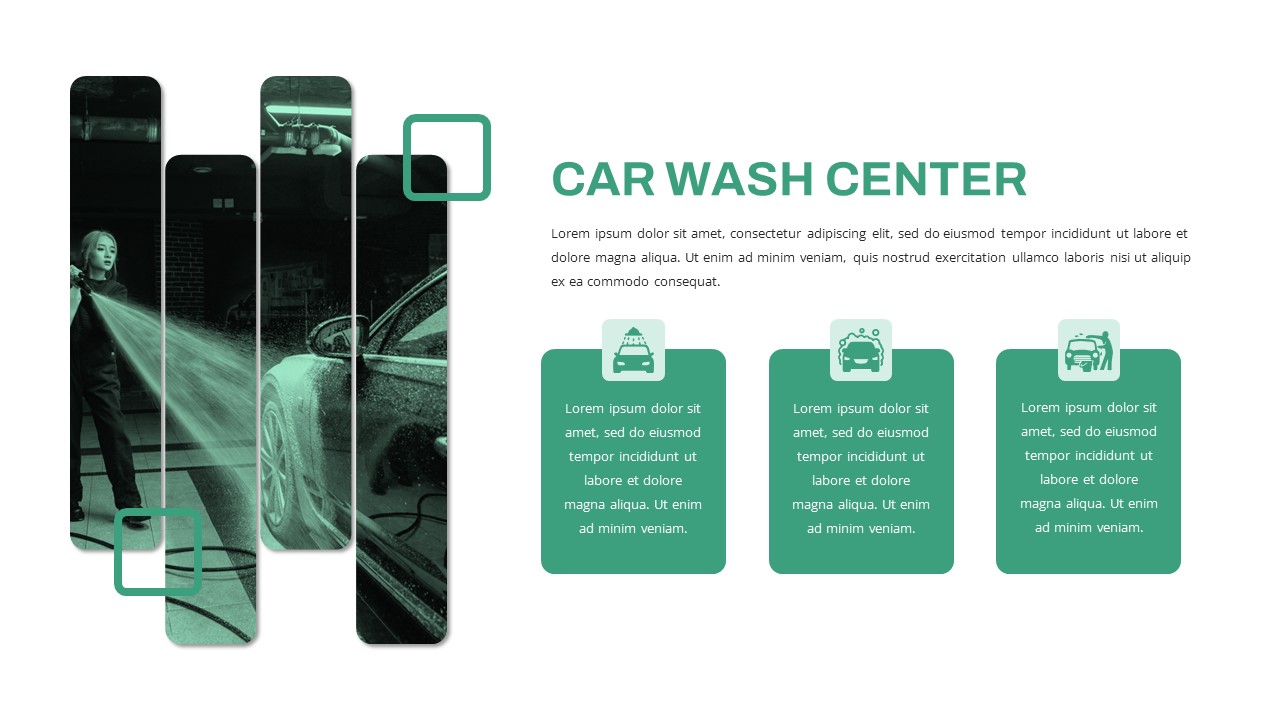
Free Car Wash Center Service Features Slide Template for PowerPoint & Google Slides
Business Proposal
Free
Free Meeting Agenda Slide Template for PowerPoint & Google Slides
Agenda
Free
Free Teacher Introduction Slide Template for PowerPoint & Google Slides
Our Team
Free
Free Machine Learning Concept Slide Template for PowerPoint & Google Slides
Machine Learning
Free