Four-Phase Maturity Model Diagram Template for PowerPoint & Google Slides


Description
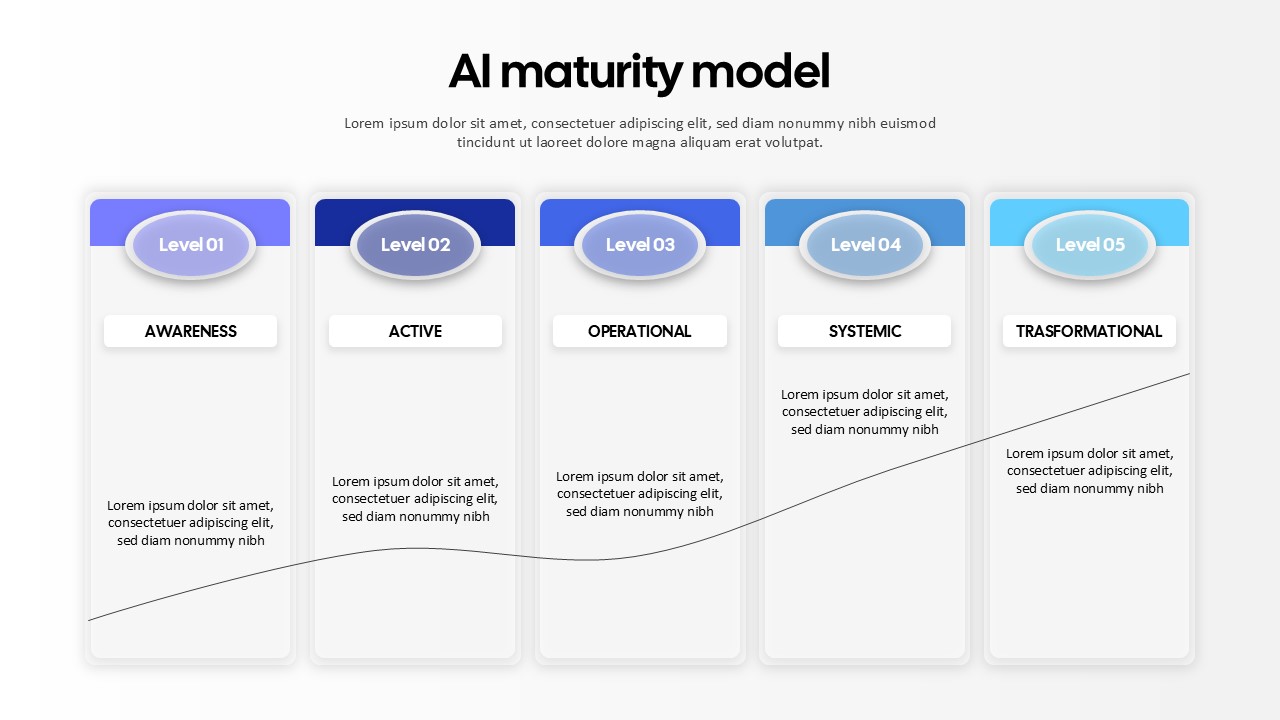
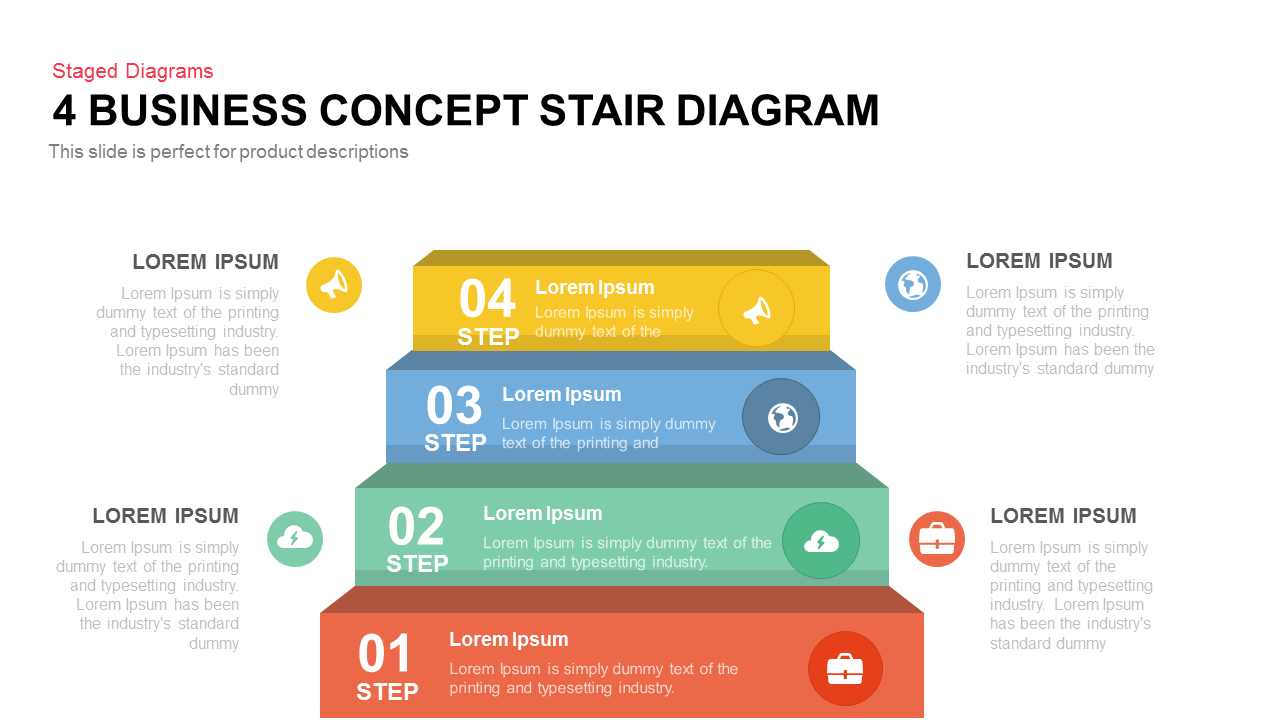
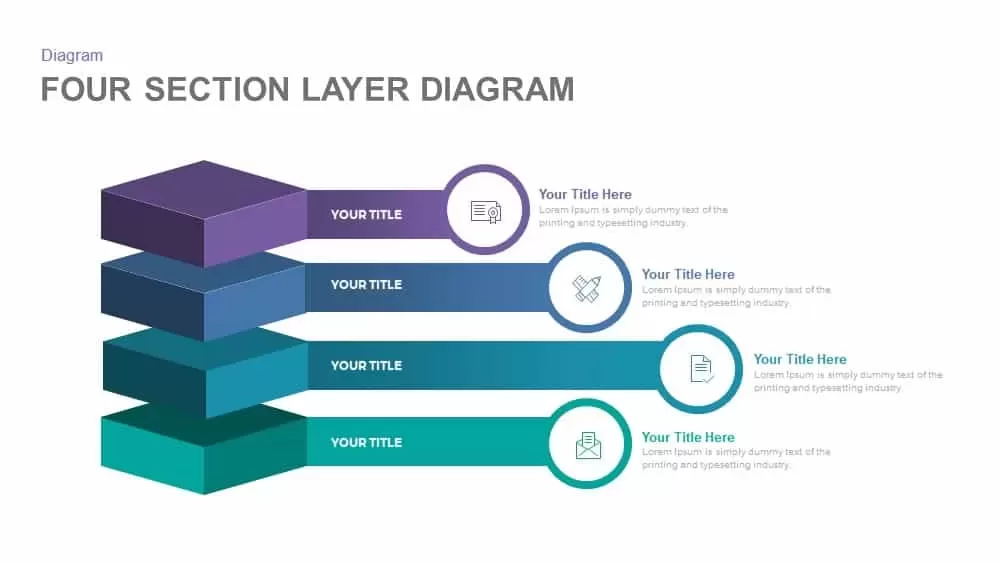
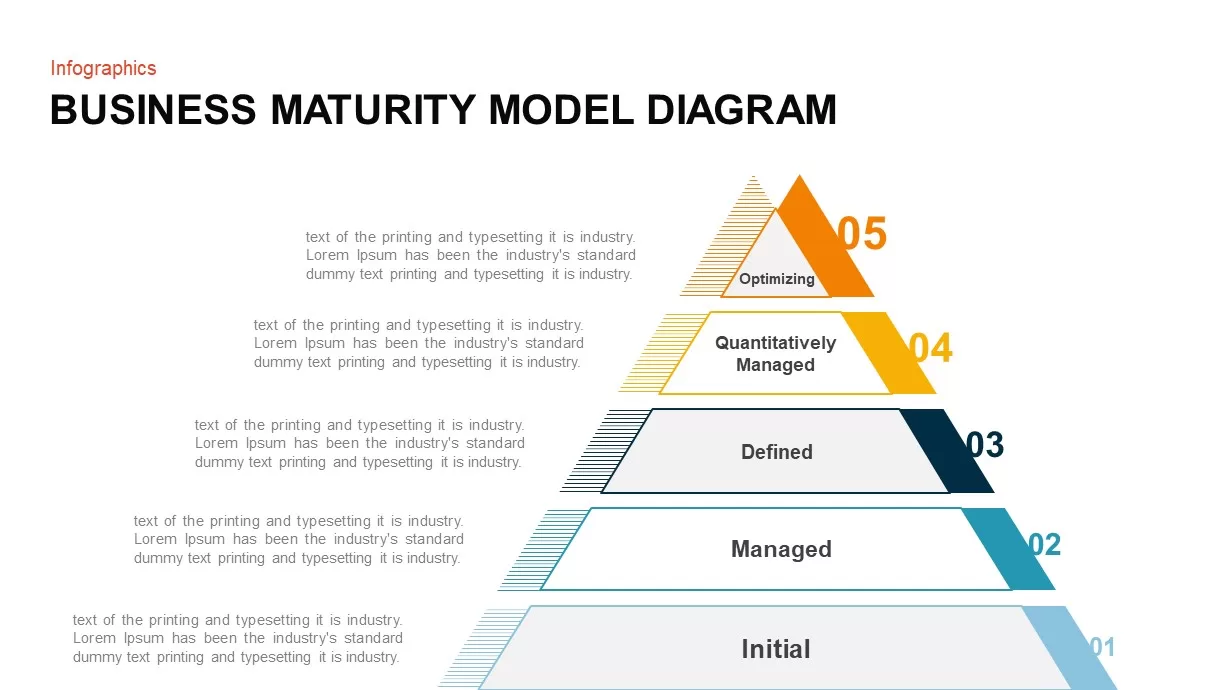
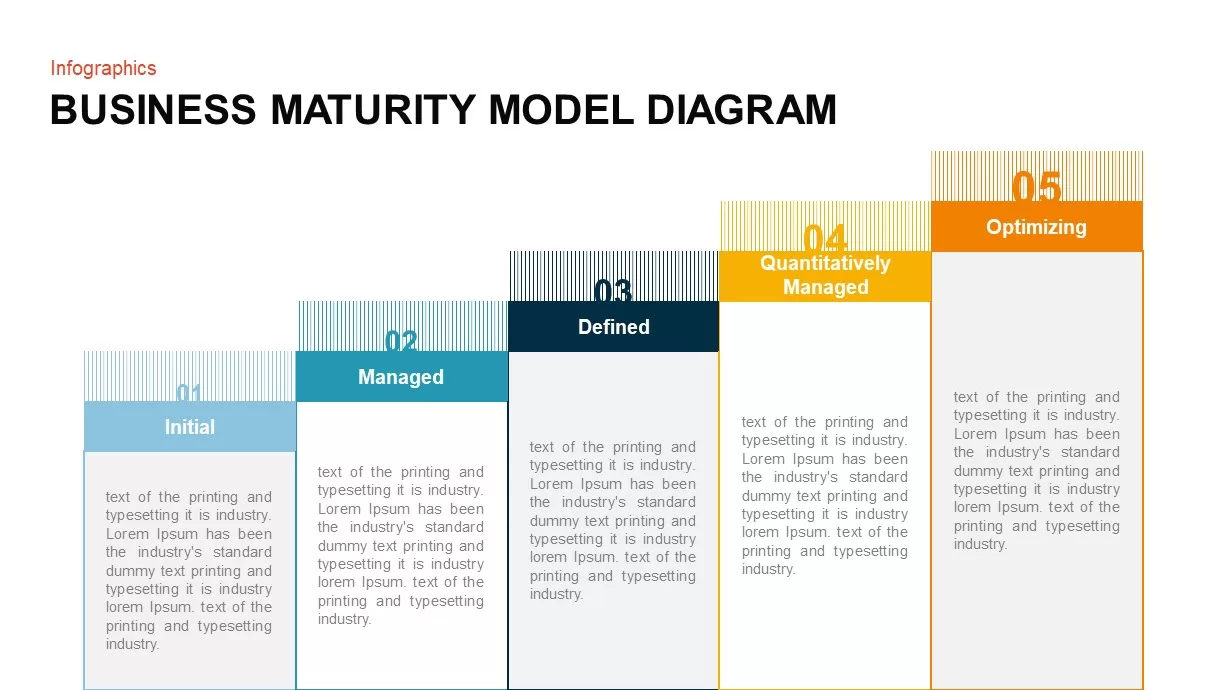
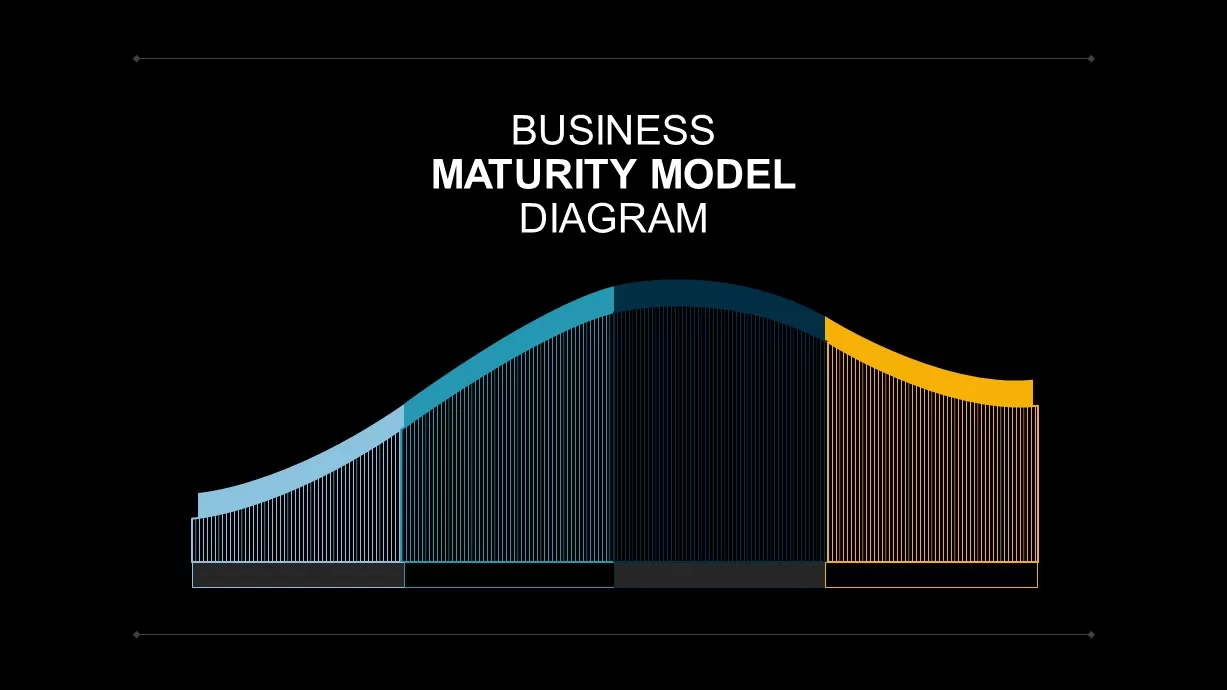
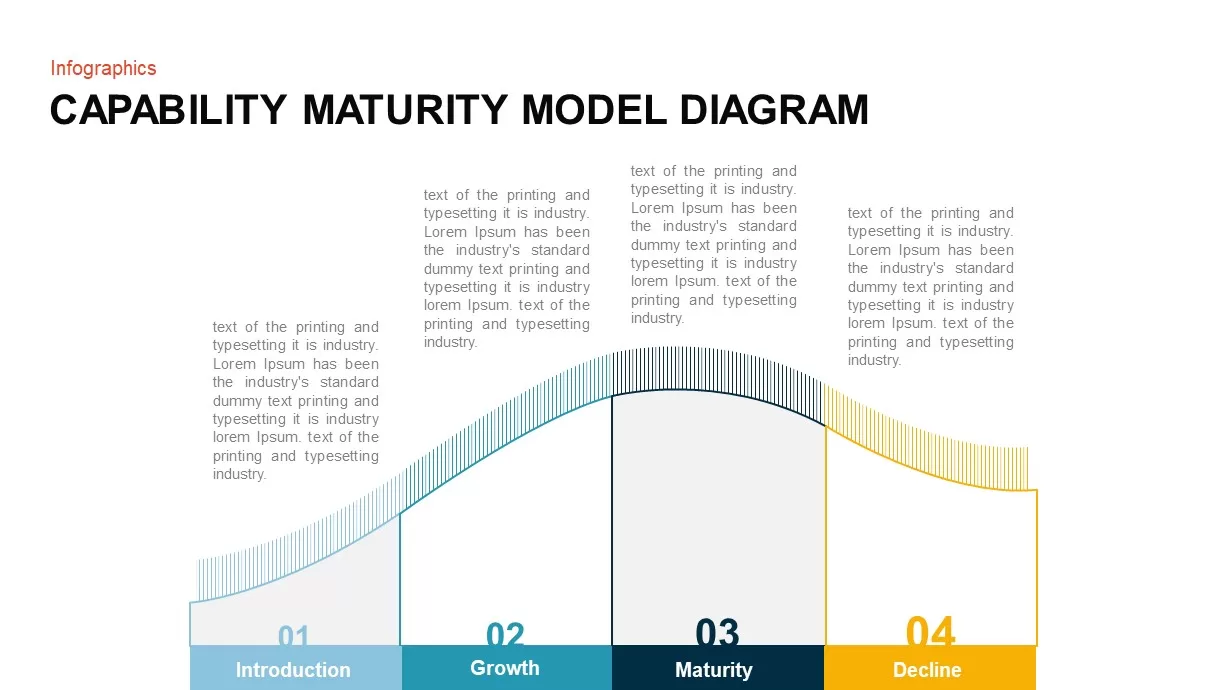
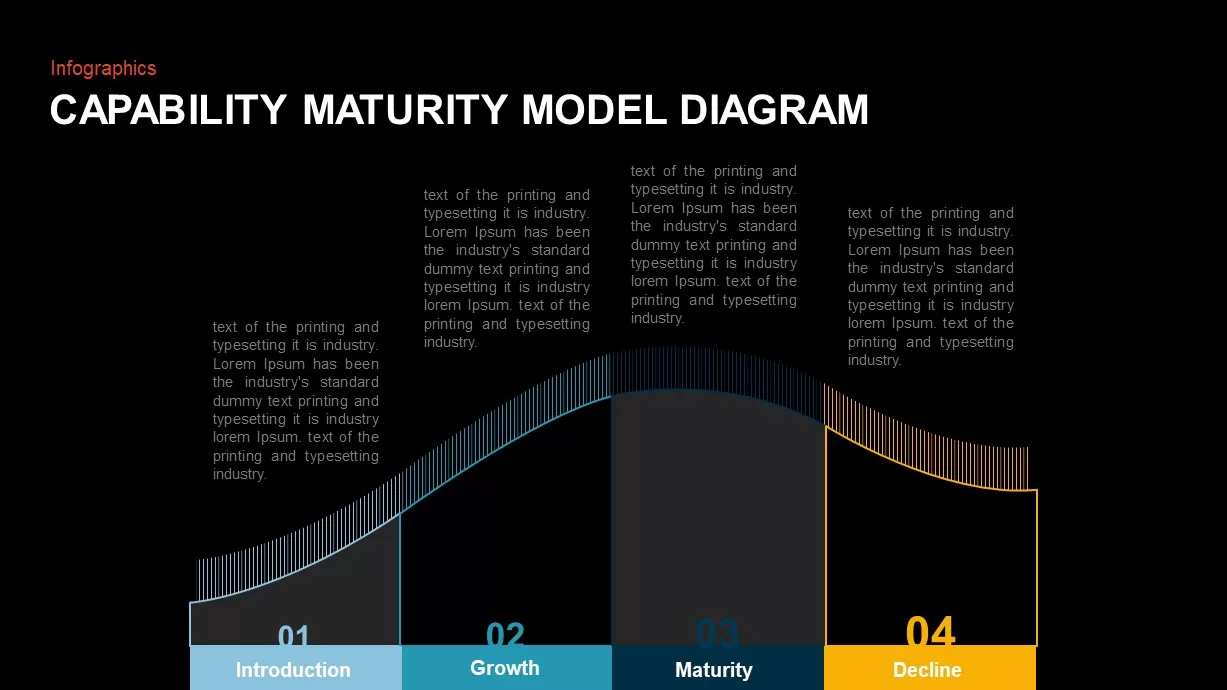
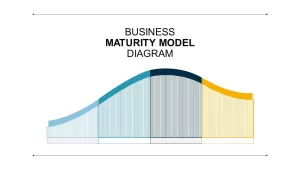
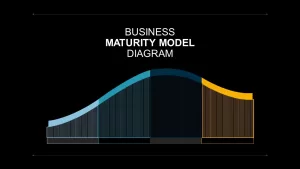
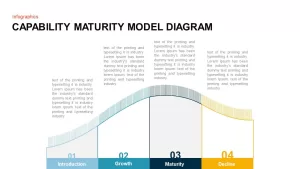
This versatile four-phase maturity model diagram presents a professional, wave-inspired layout that maps Introduction, Growth, Maturity, and Decline stages across a single continuum. Each stage is displayed as a vertical bar segment paired with a smooth, gradient curve—progressing from light cyan to deep navy and culminating in a vibrant yellow accent. Numbered labels atop each segment ensure clear identification, while adjacent text blocks allow for concise descriptions of objectives, key activities, and performance metrics.
Built on fully editable master slides, this infographic features vector-based shapes and gradient fills, guaranteeing crisp rendering at any size or aspect ratio. Swap colors, adjust segment widths, or incorporate custom icons in seconds using the drag-and-drop placeholders. The neutral background and minimal grid lines focus attention on your maturity data, while subtle drop shadows and reflective mirroring add depth without clutter.
Optimized for both PowerPoint and Google Slides, this slide eliminates formatting headaches, maintains consistent spacing, and enforces brand guidelines through theme-aware elements. Whether showcasing product lifecycle planning, process improvement stages, or talent development frameworks, the intuitive structure streamlines stakeholder alignment and drives data-driven decision-making.
Leverage built-in alignment guides, smart objects, and preconfigured slide layouts for rapid copy-and-paste workflows. The design’s clean sans-serif typography and consistent color palette enhance readability, making complex maturity concepts instantly digestible for audiences across departments.
For added flexibility, duplicate and reorder segments to visualize non-linear processes, overlay percentage indicators on each phase, or extend the model with custom color stops. The modular design allows you to adapt the diagram for one-off project statuses, portfolio roadmaps, or strategic roadmapping sessions—supporting both high-level executive overviews and detailed operational deep dives.
Who is it for
Product managers, business analysts, process improvement specialists, and corporate strategists will use this maturity model to benchmark organizational capabilities, plan roadmap milestones, and communicate stage-gate criteria to stakeholders. Educators and consultants can also leverage it to teach lifecycle theory and facilitate interactive workshops on organizational development.
Other Uses
Repurpose this slide to illustrate technology adoption curves, service maturity assessments, academic research phases, or change management roadmaps. Extend the diagram for talent competency growth, quality management cycles, or strategic planning sessions, ensuring a consistent visual framework across presentations.
Login to download this file

Item ID
SB01723
Related Templates

Five-Phase and Three-Phase Phases Chart Template for PowerPoint & Google Slides
Charts
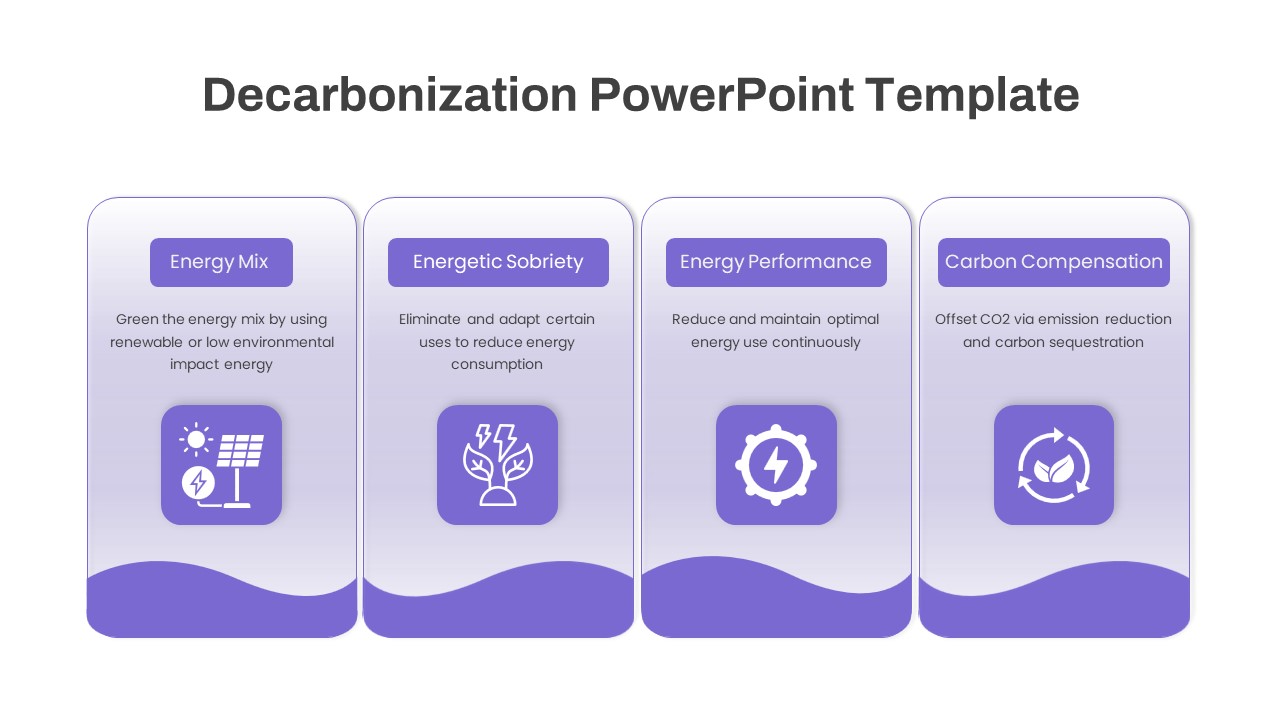
Four-Phase Decarbonization Diagram Template for PowerPoint & Google Slides
Process
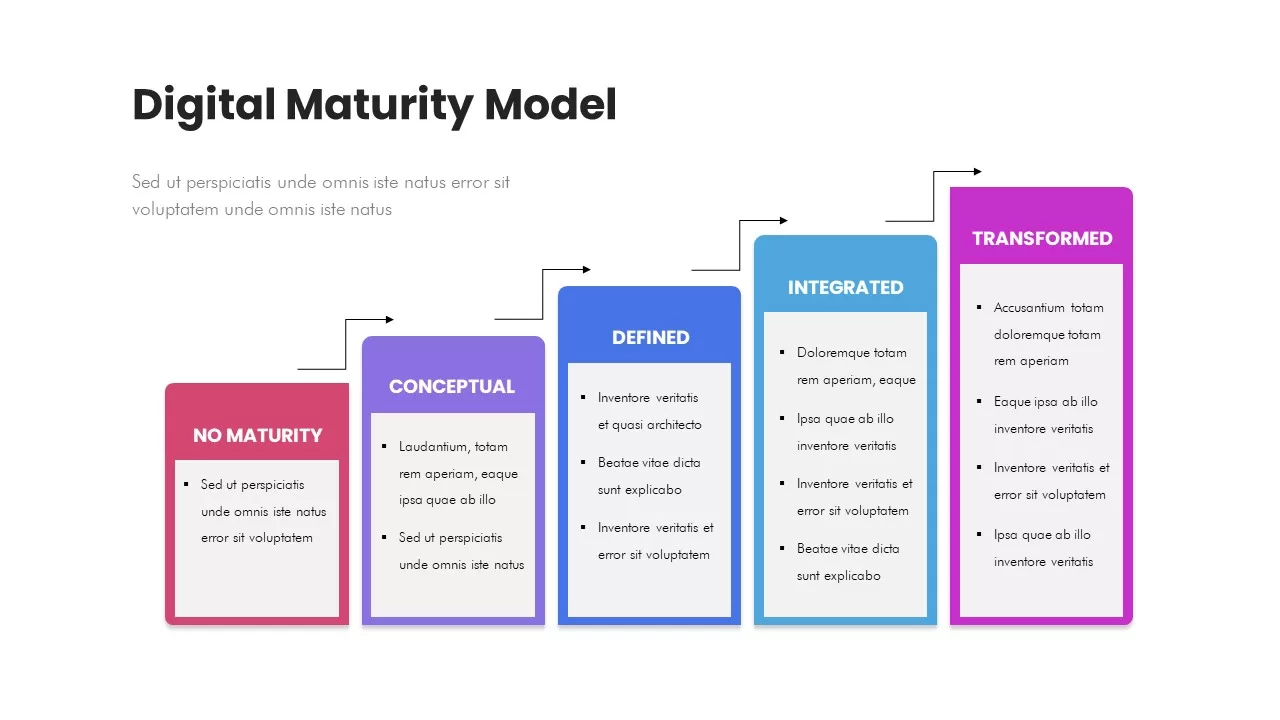
Digital Maturity Model Stages Diagram Template for PowerPoint & Google Slides
Process
Five-Stage Digital Maturity Model Diagram Template for PowerPoint & Google Slides
Process
Organizational Maturity Model Diagram Template for PowerPoint & Google Slides
Process
Greiner Growth Model Six-Phase Diagram Template for PowerPoint & Google Slides
Business Models
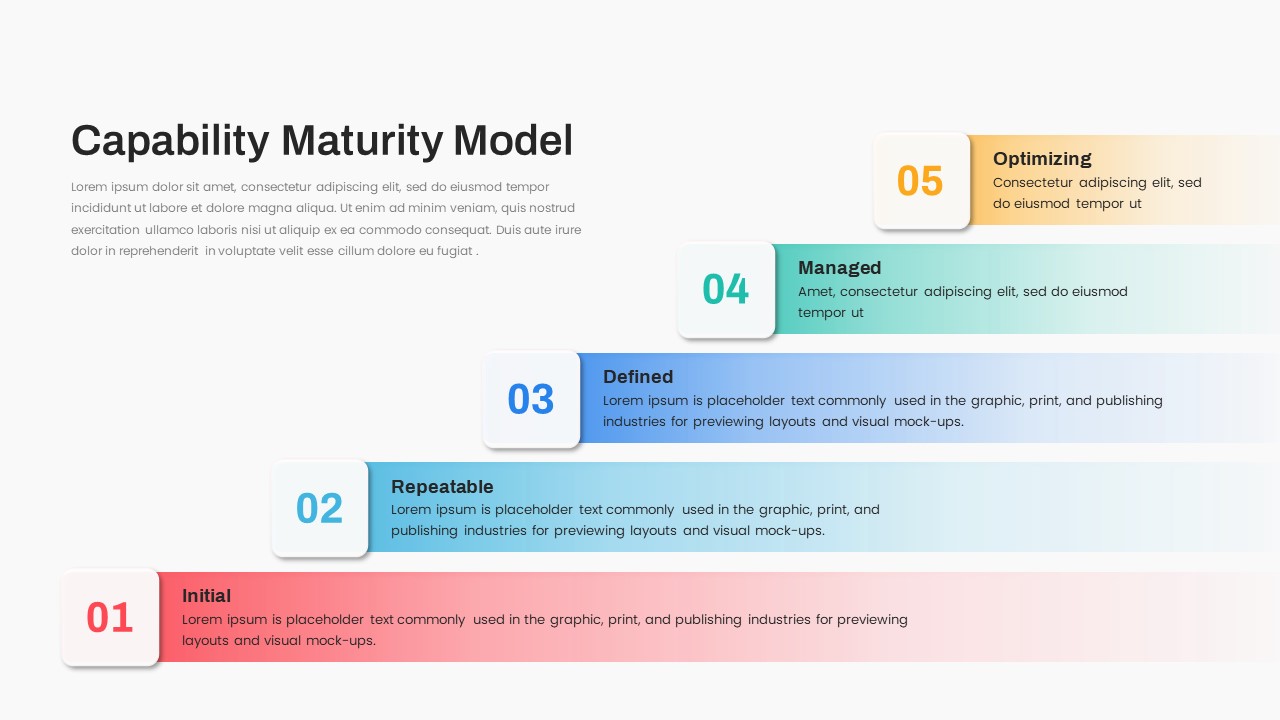
Capability Maturity Model Infographic Template for PowerPoint & Google Slides
Software Development
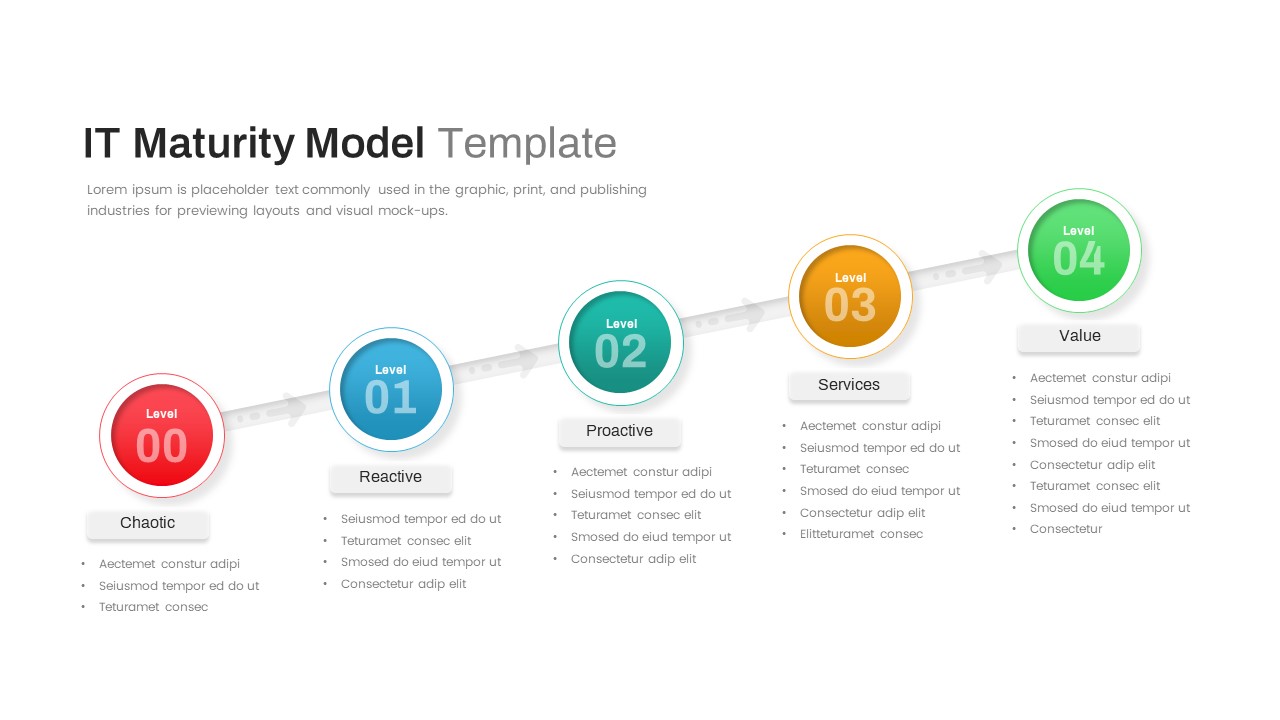
IT Maturity Model with Five Stages Template for PowerPoint & Google Slides
Timeline
Layered Data Governance Maturity Model Template for PowerPoint & Google Slides
Process
AI Maturity Model Levels template for PowerPoint & Google Slides
Technology
CMMI Process Maturity Model Infographic Template for PowerPoint & Google Slides
Process
AI Capability Maturity Model Overview for PowerPoint & Google Slides
Technology
Gear Process Phase Diagram template for PowerPoint & Google Slides
Process
Five-Phase Strategy Timeline Diagram Template for PowerPoint & Google Slides
Timeline
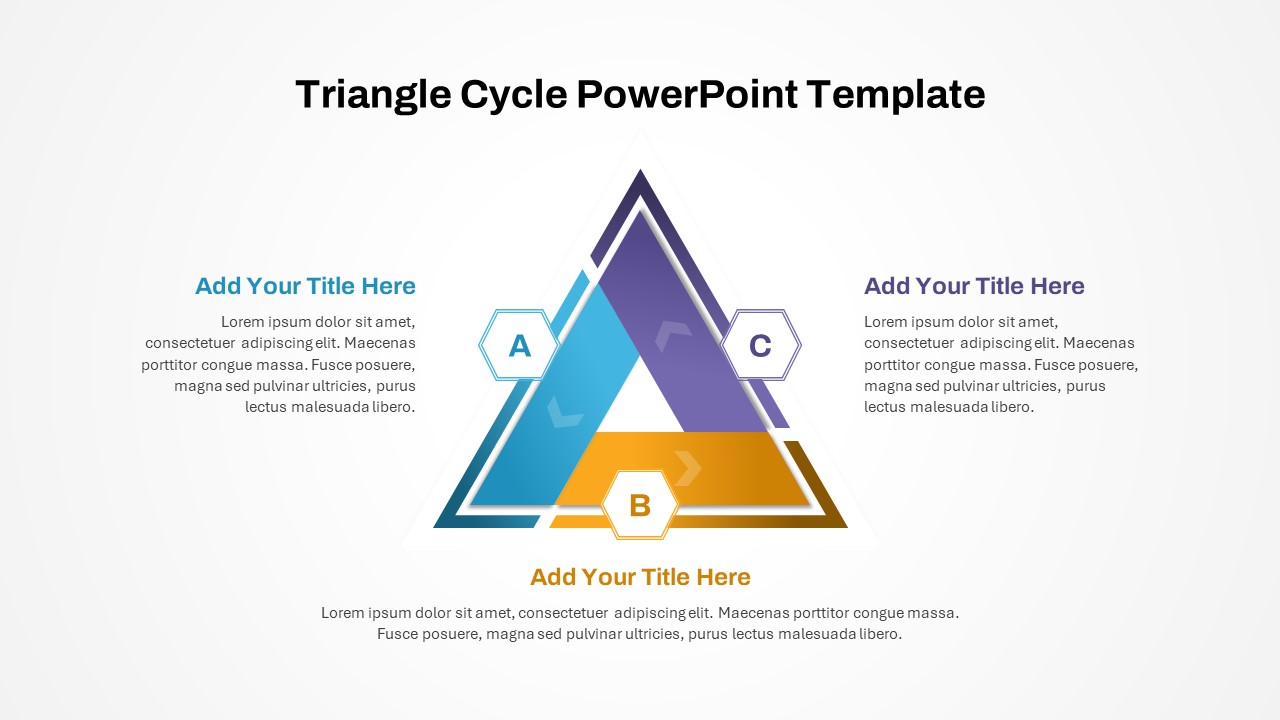
Three-Phase Triangle Cycle Diagram Template for PowerPoint & Google Slides
Infographics
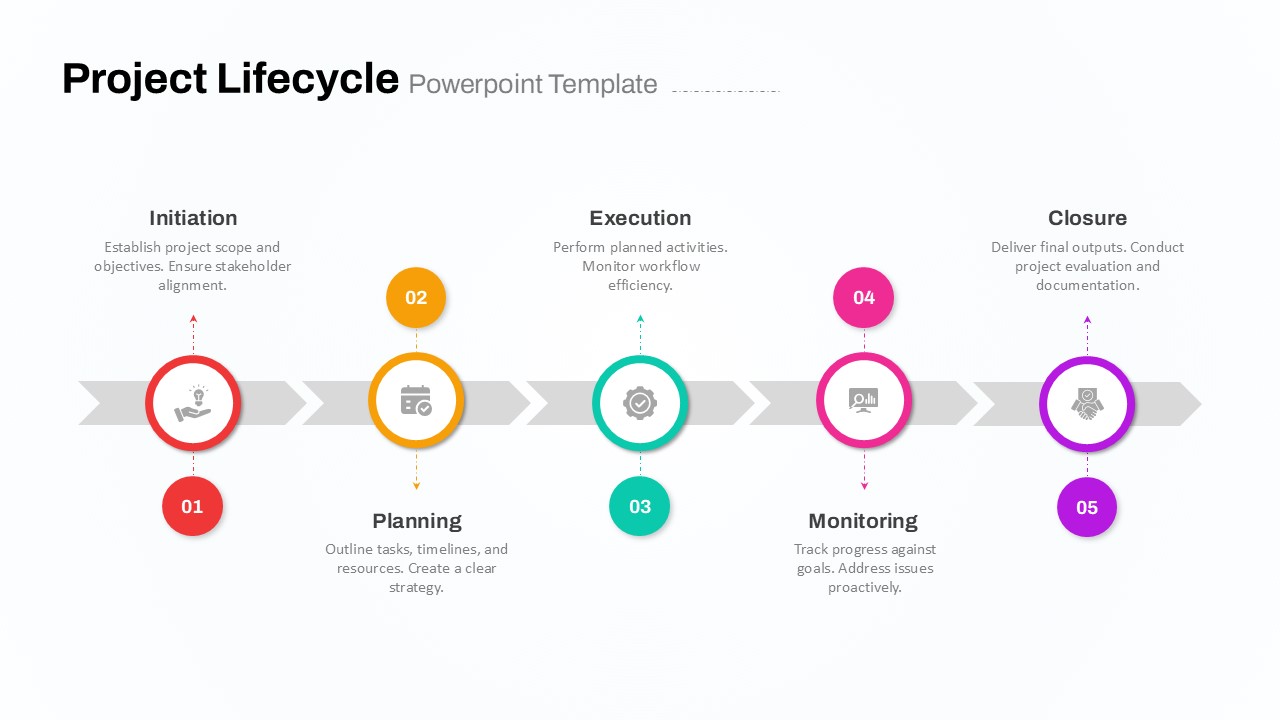
Five-Phase Project Lifecycle Diagram Template for PowerPoint & Google Slides
Infographics
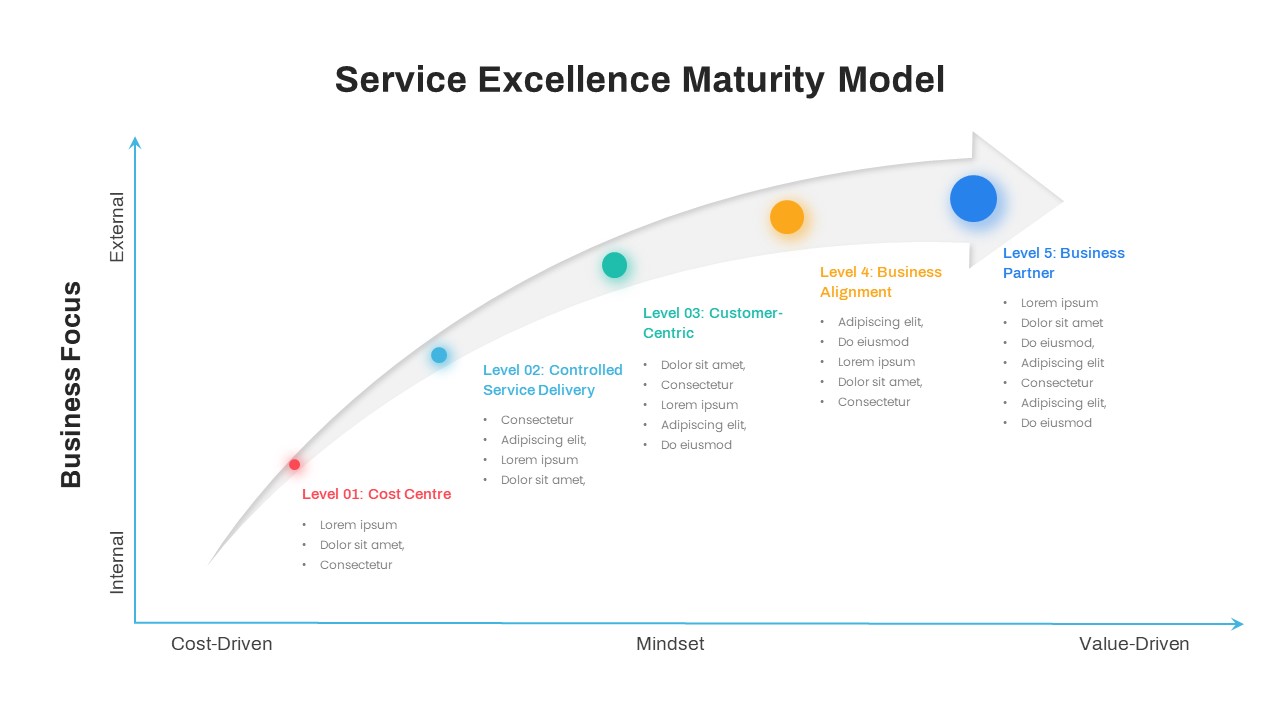
Service Excellence Maturity 5-Stage Template for PowerPoint & Google Slides
Process

Three-Phase Planning Gear Infographic Template for PowerPoint & Google Slides
Process
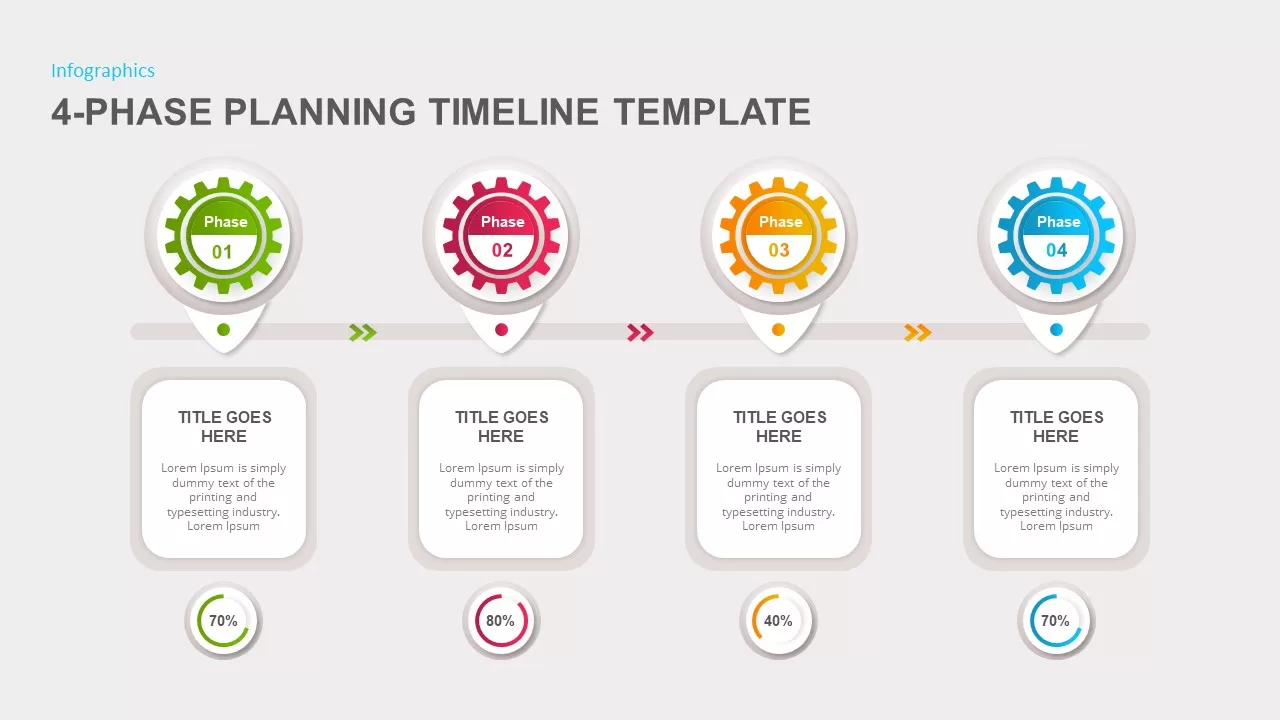
4-Phase Planning Timeline template for PowerPoint & Google Slides
Infographics
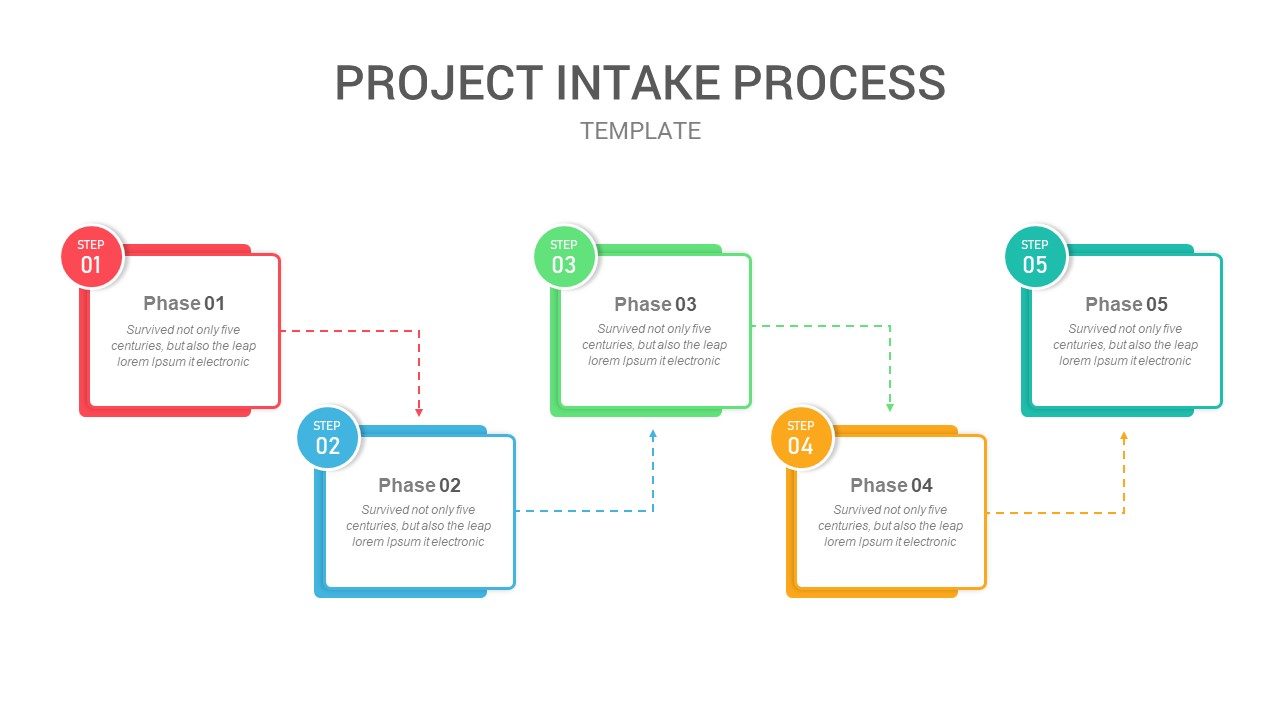
Five-Phase Project Intake Process Flow Template for PowerPoint & Google Slides
Process
Five-Phase Horizontal Timeline Chart Template for PowerPoint & Google Slides
Timeline
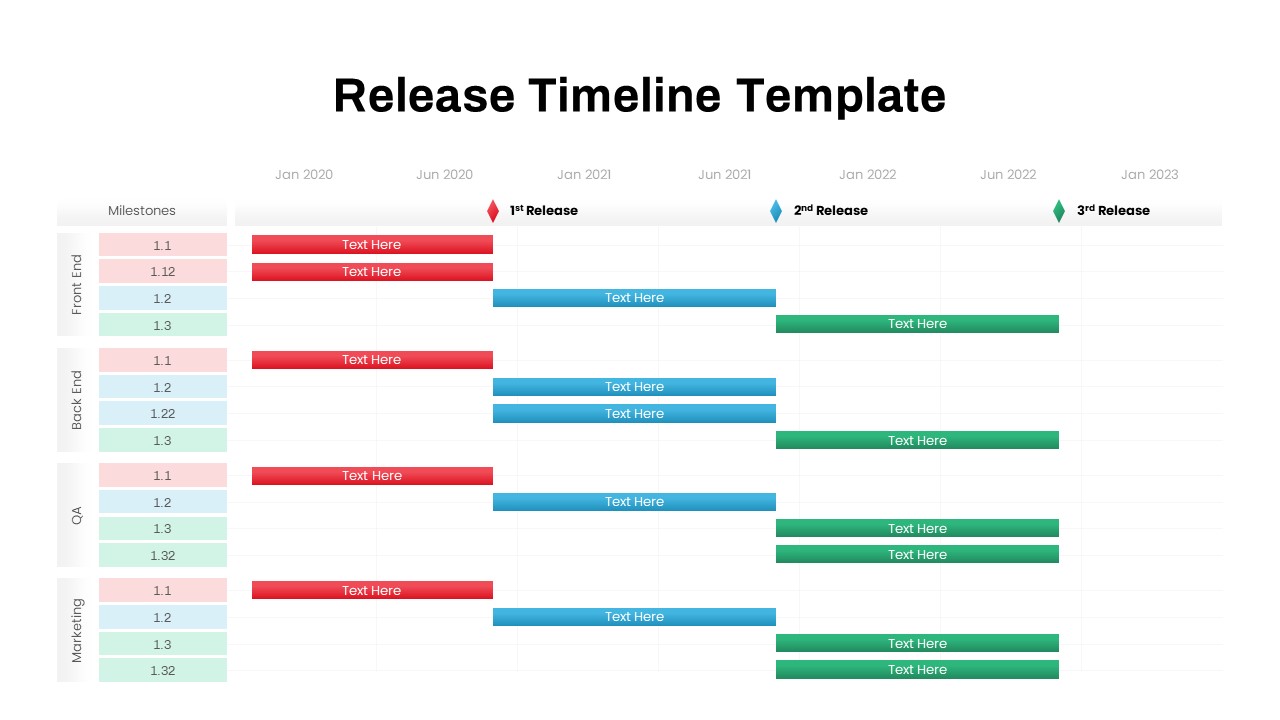
Multi-Team Multi-Phase Release Timeline Template for PowerPoint & Google Slides
Timeline
Multi-Phase Research Roadmap Infographic Template for PowerPoint & Google Slides
Roadmap
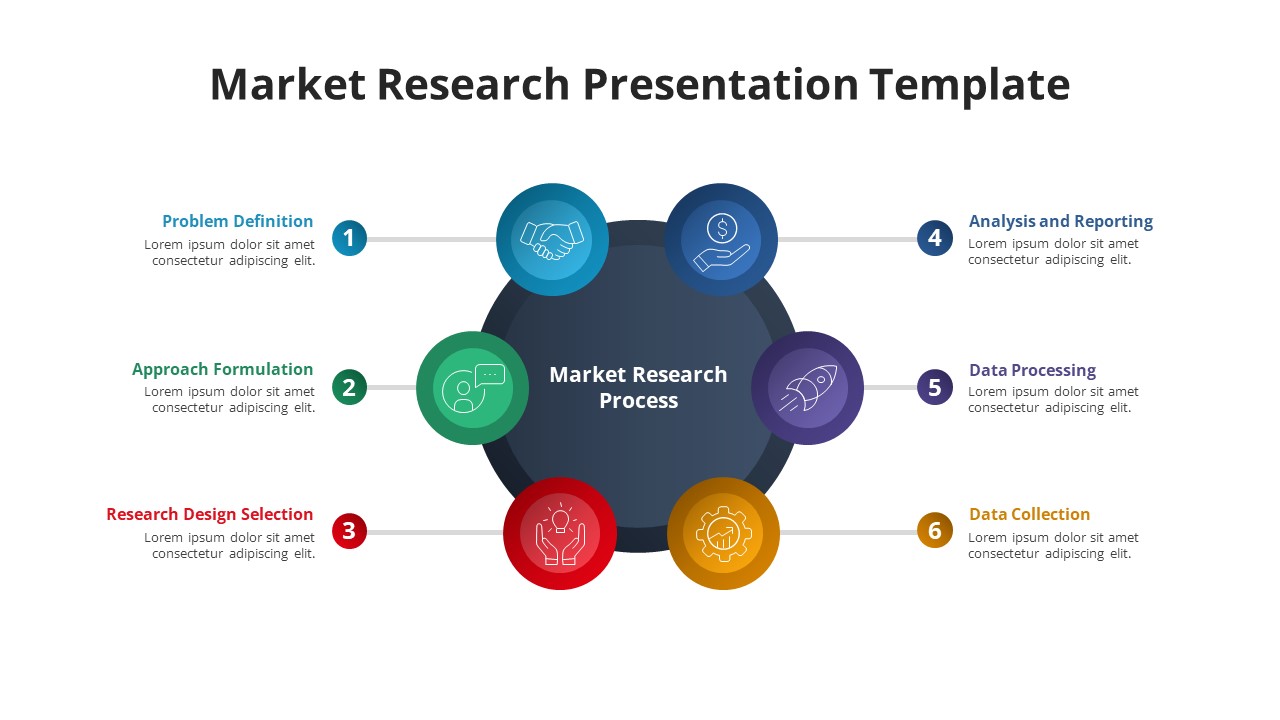
Free Six-Phase Market Research Process Template for PowerPoint & Google Slides
Process
Free
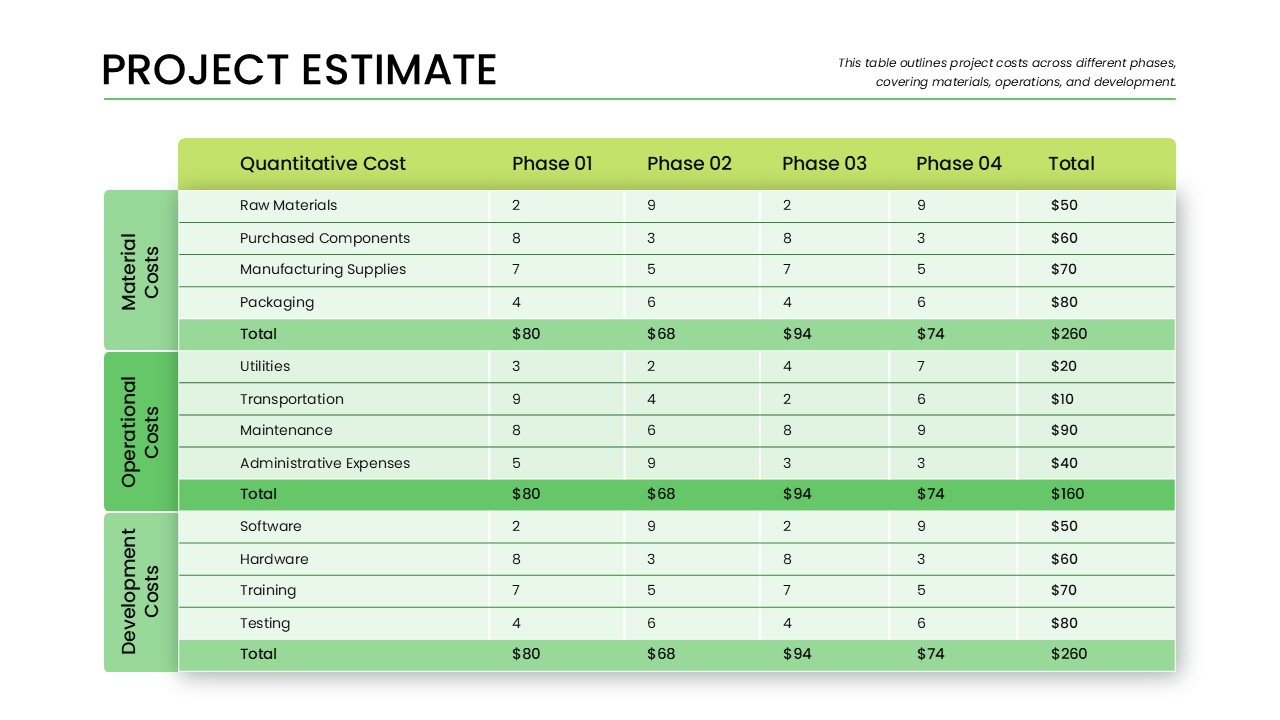
Phase-Wise Project Estimate Table Template for PowerPoint & Google Slides
Business Report
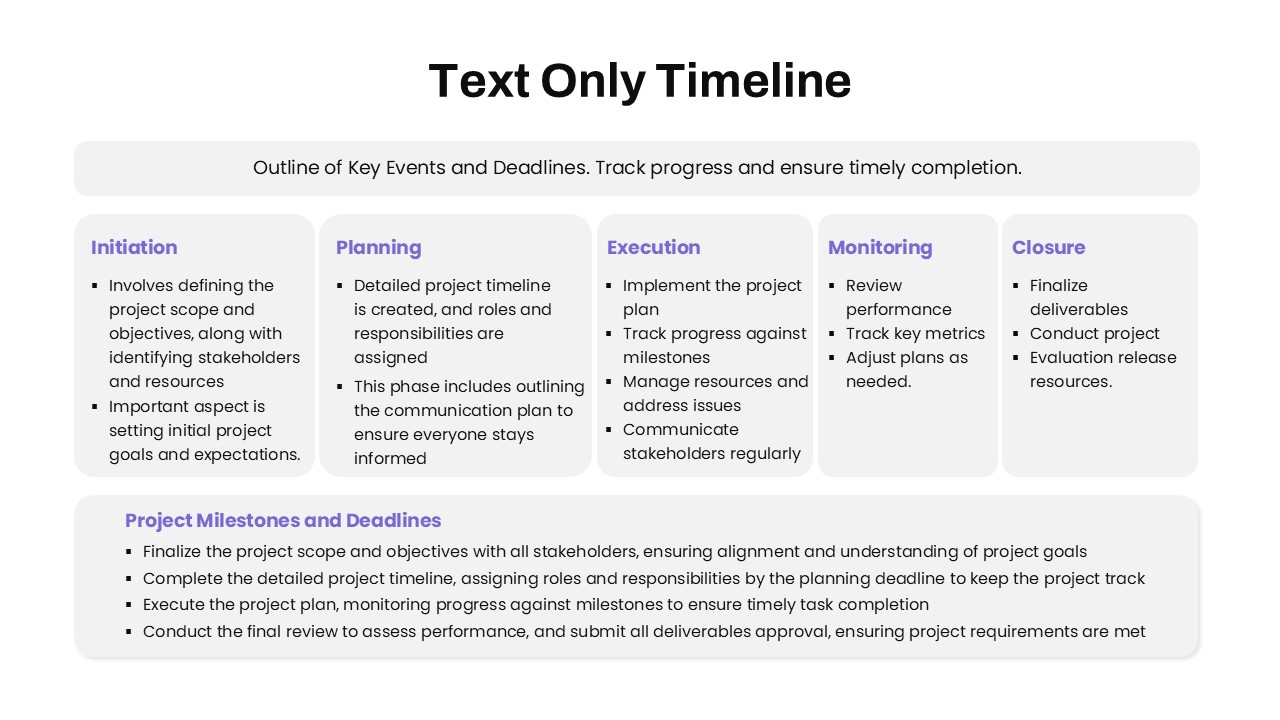
Text-Only Five-Phase Timeline Template for PowerPoint & Google Slides
Timeline

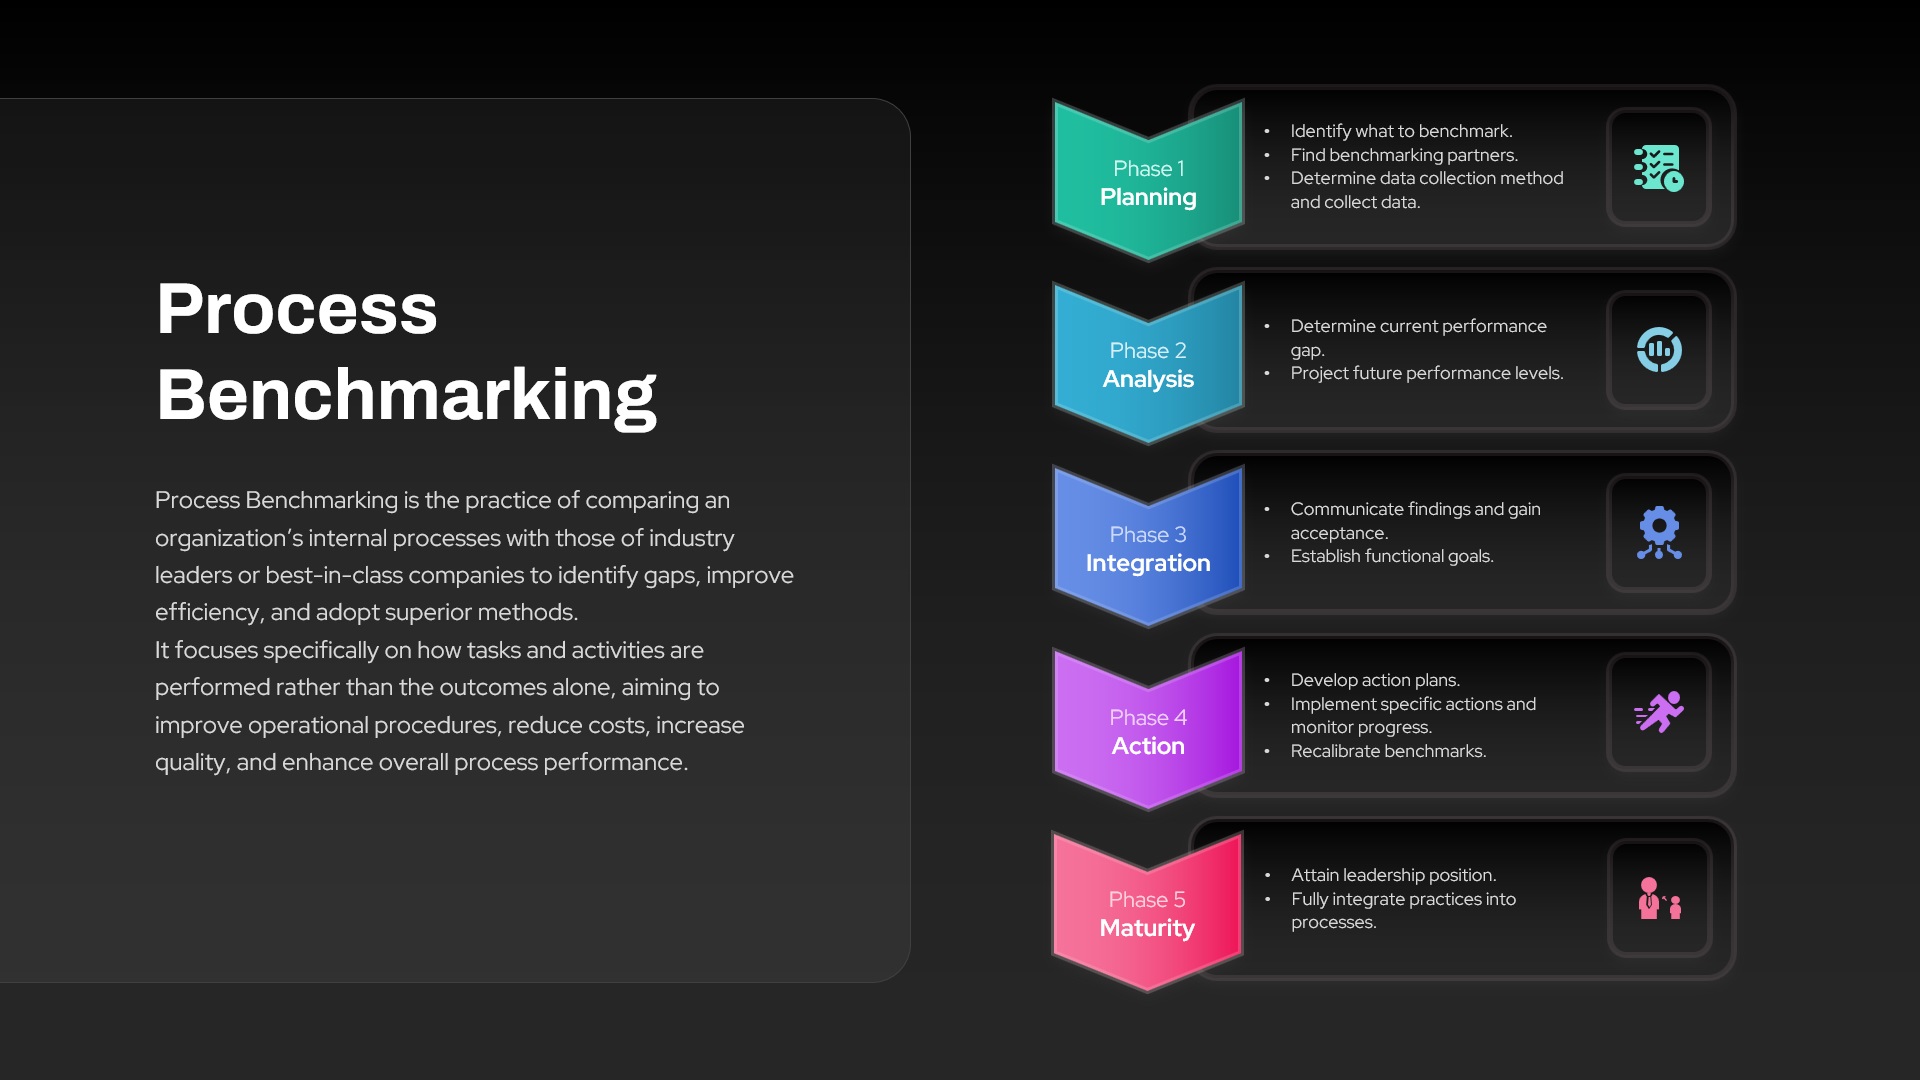
Process Benchmarking Five-Phase Framework Template for PowerPoint & Google Slides
Process
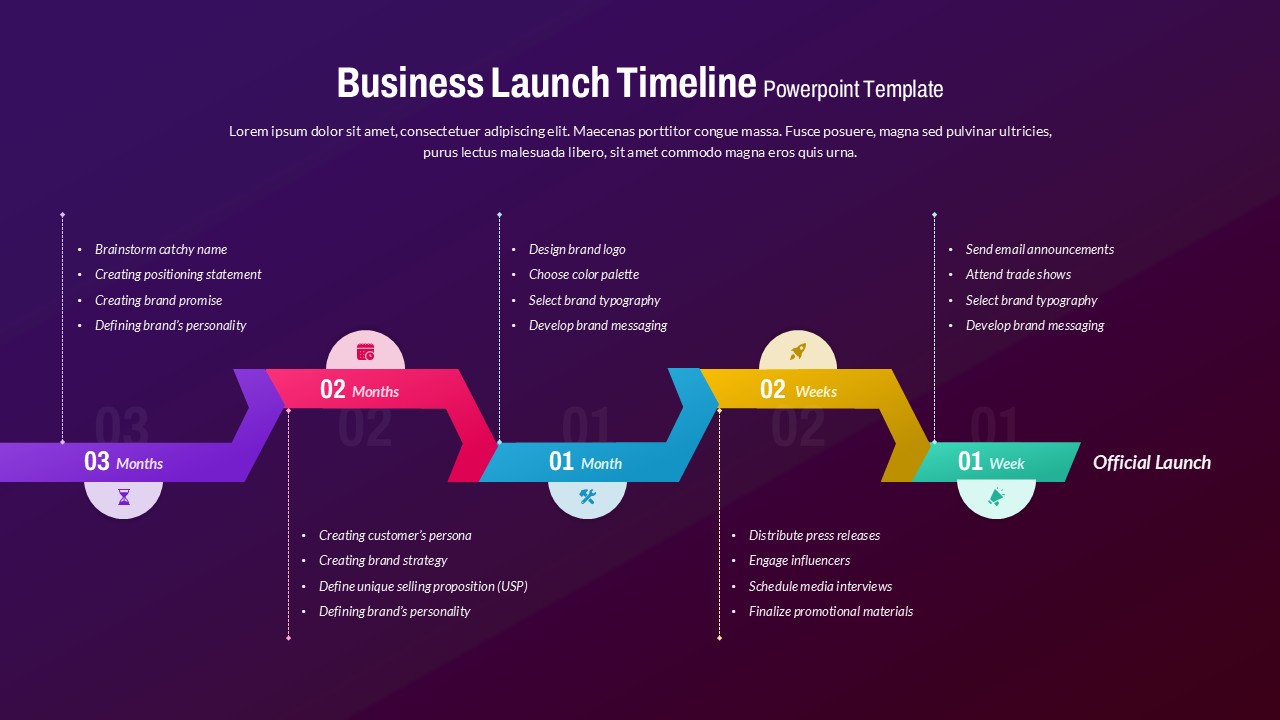
Business Launch Timeline Roadmap 5-Phase Template for PowerPoint & Google Slides
Business
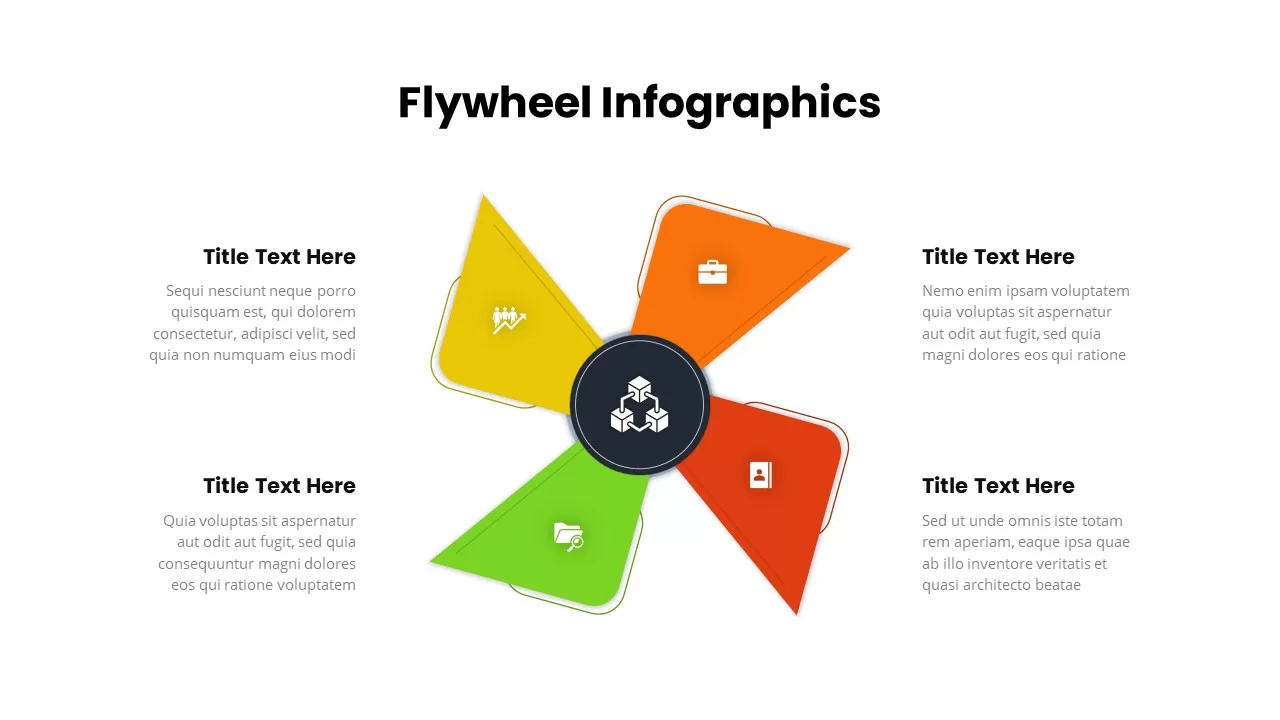
Four-Segment Flywheel Infographic Model Template for PowerPoint & Google Slides
Process
3D Four Arrow Infographics Diagram Template for PowerPoint & Google Slides
Arrow
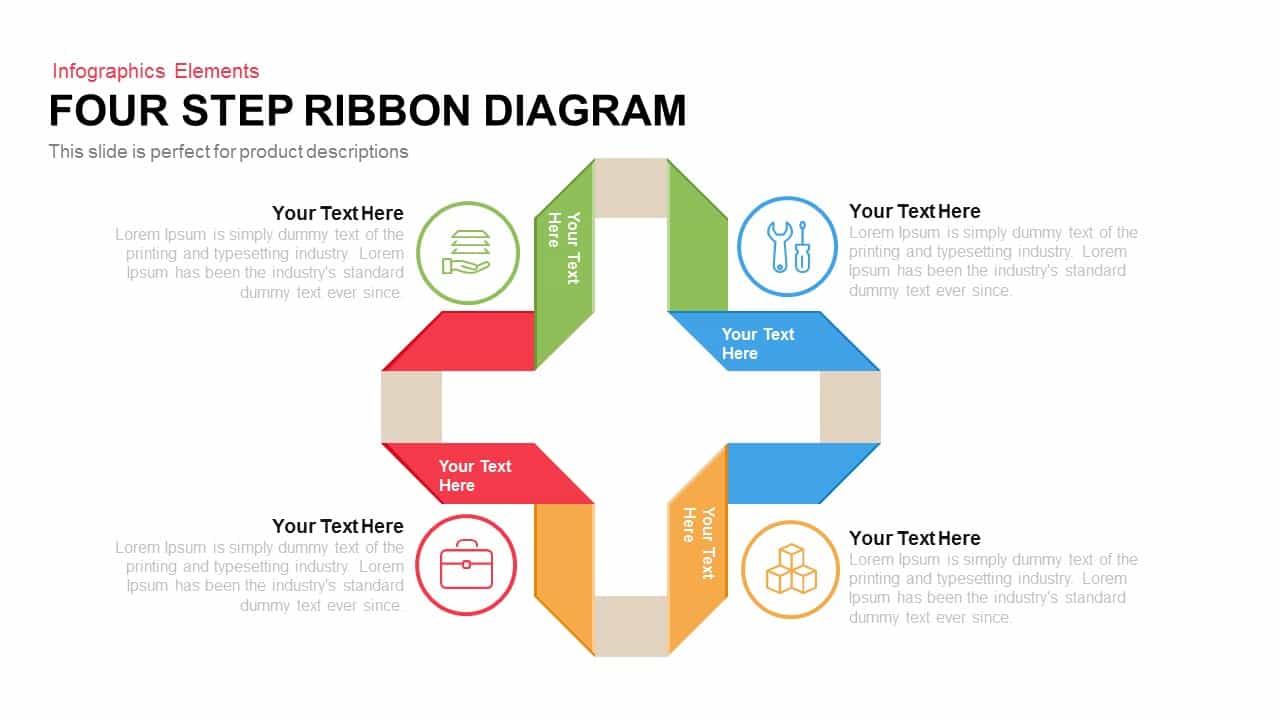
Four Step Ribbon Diagram Template for PowerPoint & Google Slides
Infographics
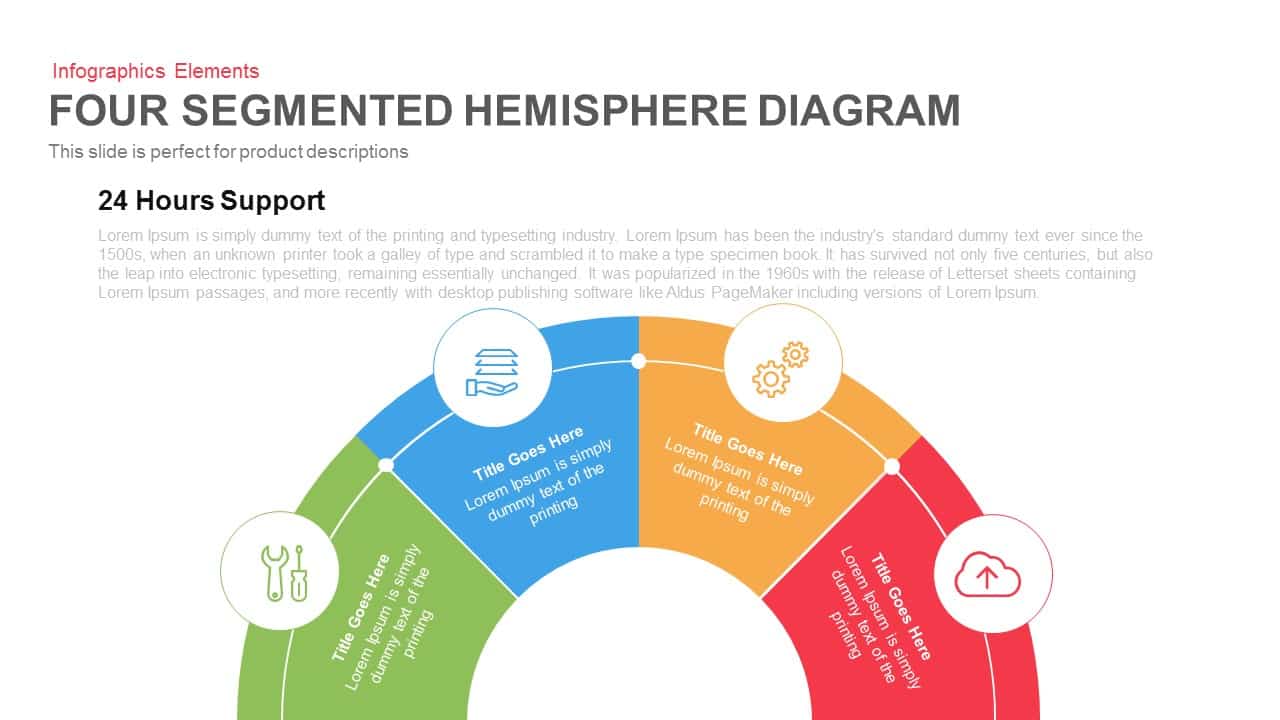
Four Segmented Hemisphere Diagram Template for PowerPoint & Google Slides
Process
Diamond Mind Map Diagram Four Branches Template for PowerPoint & Google Slides
Mind Maps
Four Section Comparison Chart Diagram Template for PowerPoint & Google Slides
Infographics
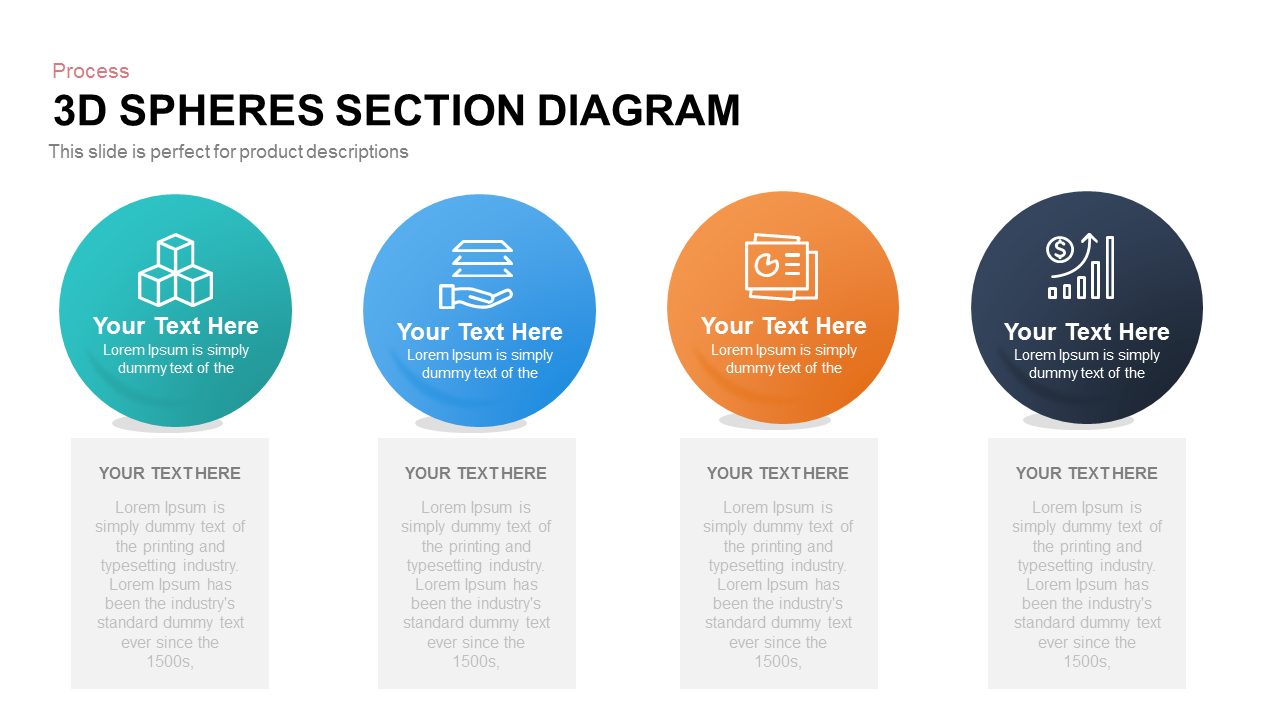
Four-Part 3D Spheres Section Diagram template for PowerPoint & Google Slides
Process
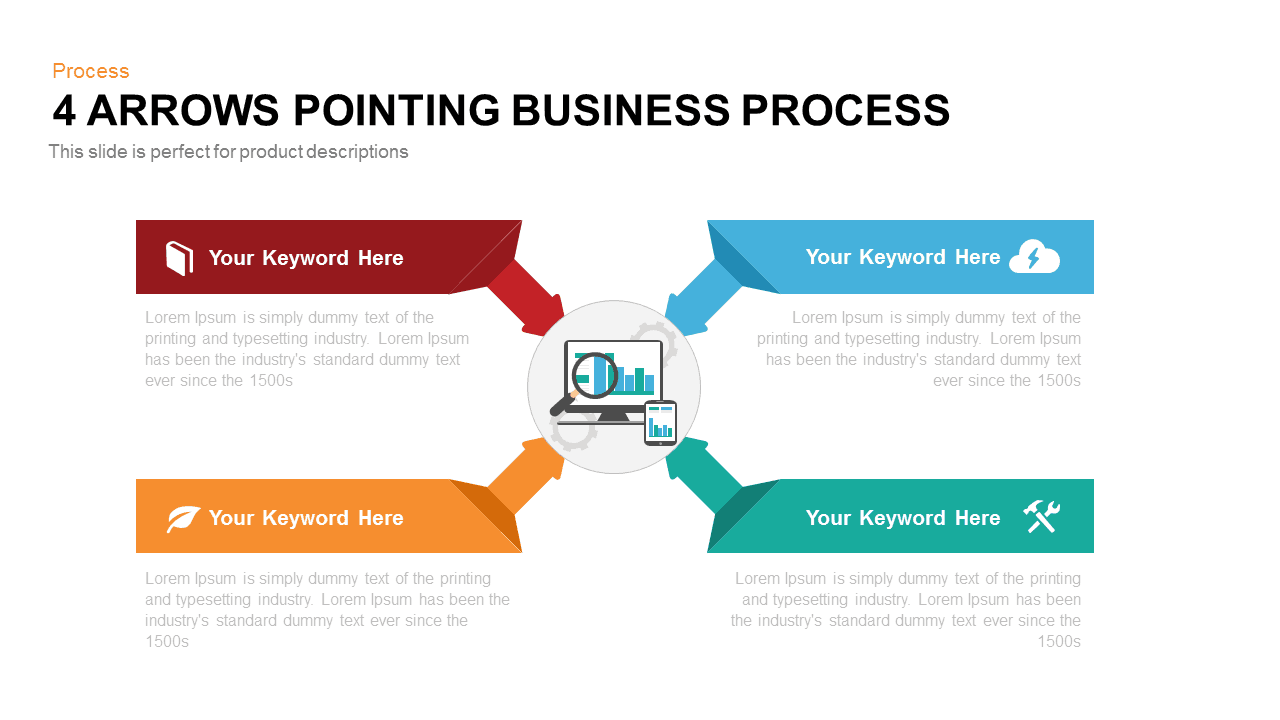
Four Arrows Business Process Diagram template for PowerPoint & Google Slides
Process
Four-Step Business Staircase Diagram template for PowerPoint & Google Slides
Process

Four Gear Section Diagram Template for PowerPoint & Google Slides
Circular

Four-Circle Venn Process Diagram template for PowerPoint & Google Slides
Process
Four-Stage Business Circular Diagram Template for PowerPoint & Google Slides
Process
Pie Segment Diagram Four-Step Process Template for PowerPoint & Google Slides
Pie/Donut
Professional Four-Stage Funnel Diagram Template for PowerPoint & Google Slides
Funnel
Four-Stage Linear Infographic Diagram Template for PowerPoint & Google Slides
Process
Four-Cross Text Box Diagram Template for PowerPoint & Google Slides
Comparison
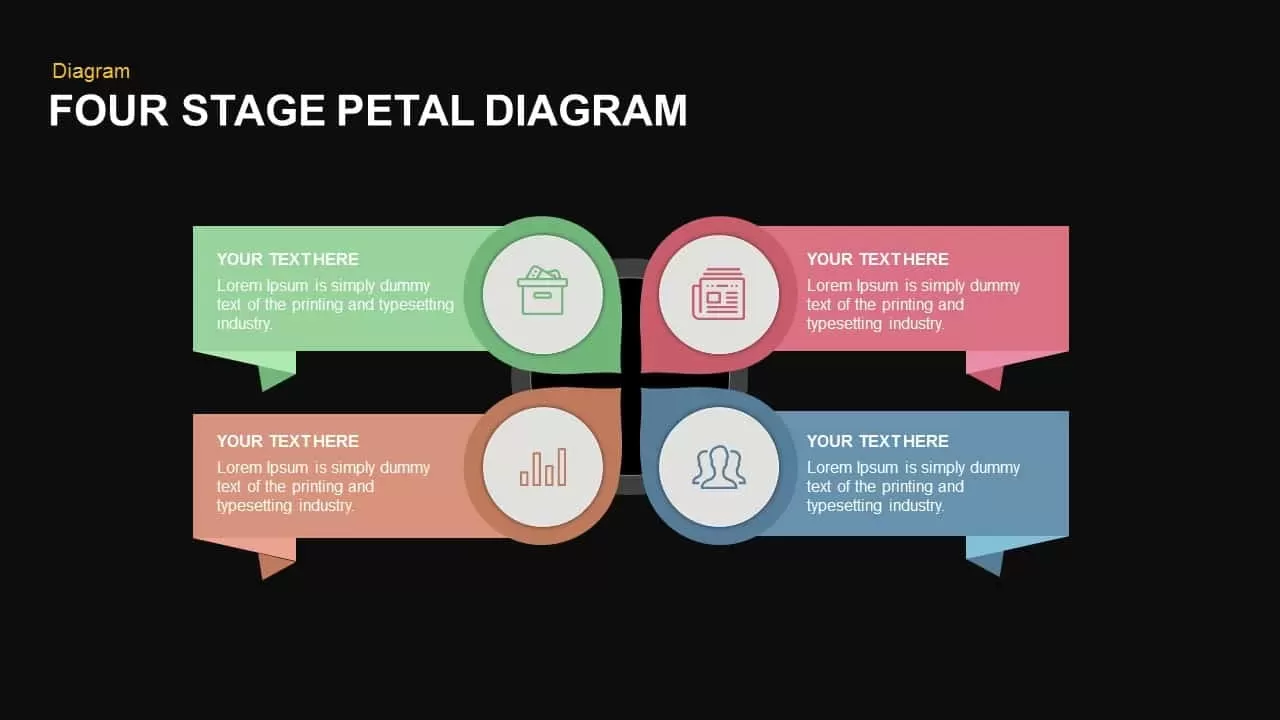
Modern Four-Stage Petal Diagram Template for PowerPoint & Google Slides
Circular
Four and Five-Stage Funnel Diagram Template for PowerPoint & Google Slides
Funnel
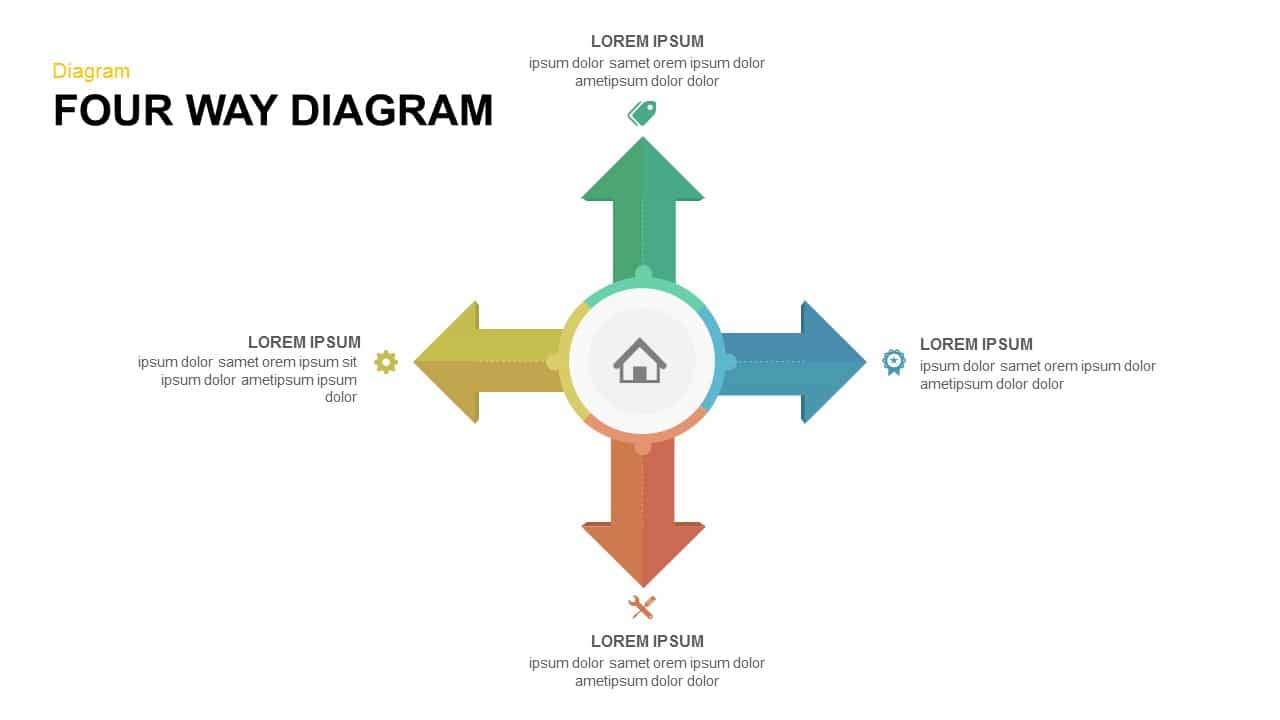
Four-Way Directional Arrow Diagram Template for PowerPoint & Google Slides
Arrow
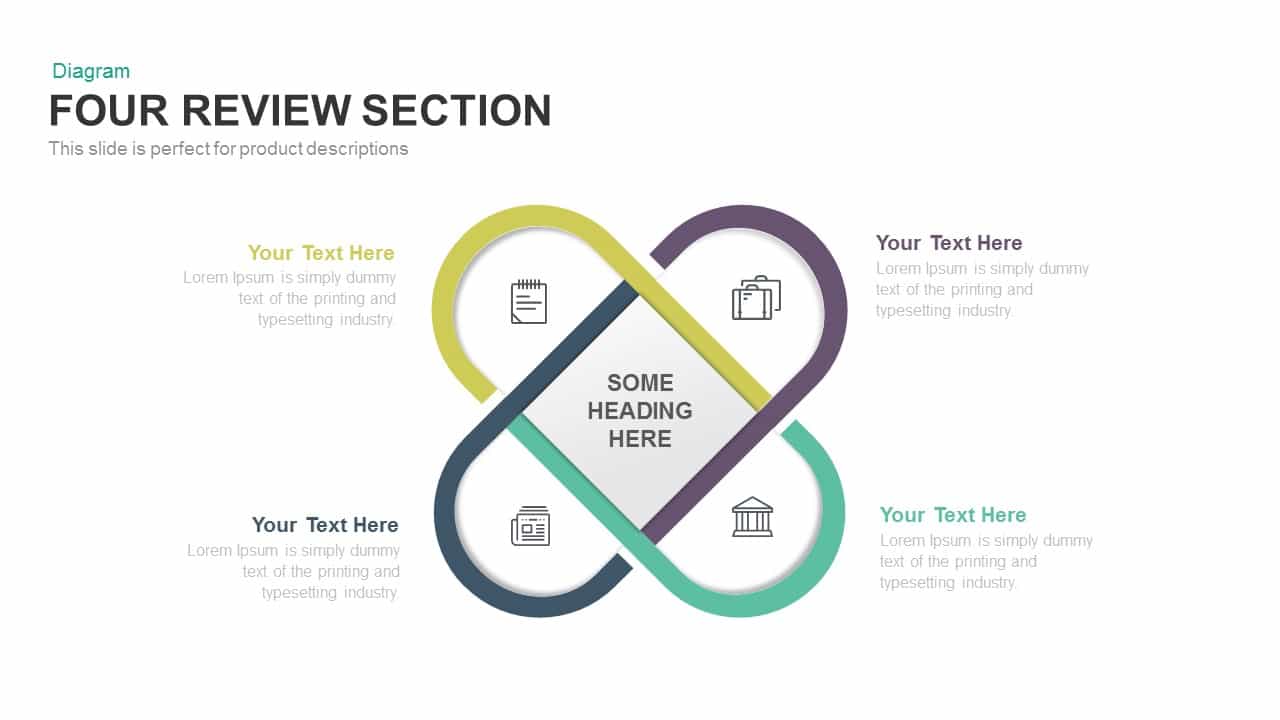
Clean Four-Section Review Diagram Template for PowerPoint & Google Slides
Agenda
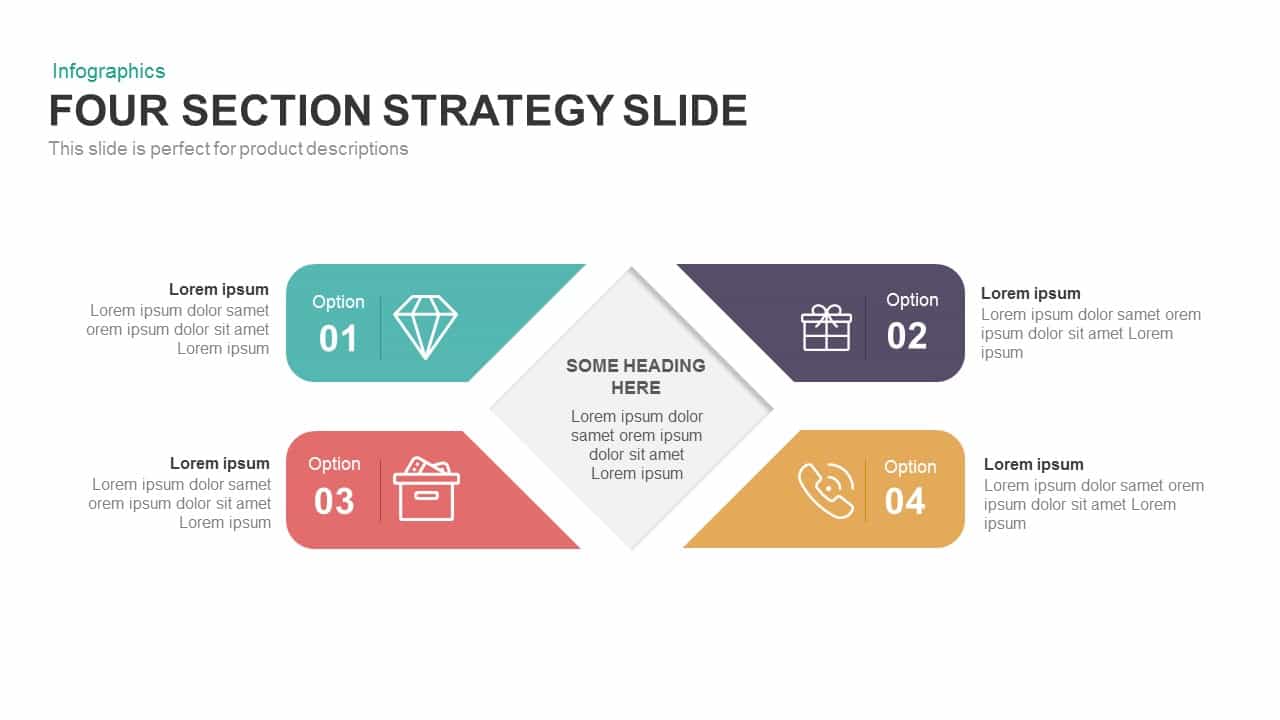
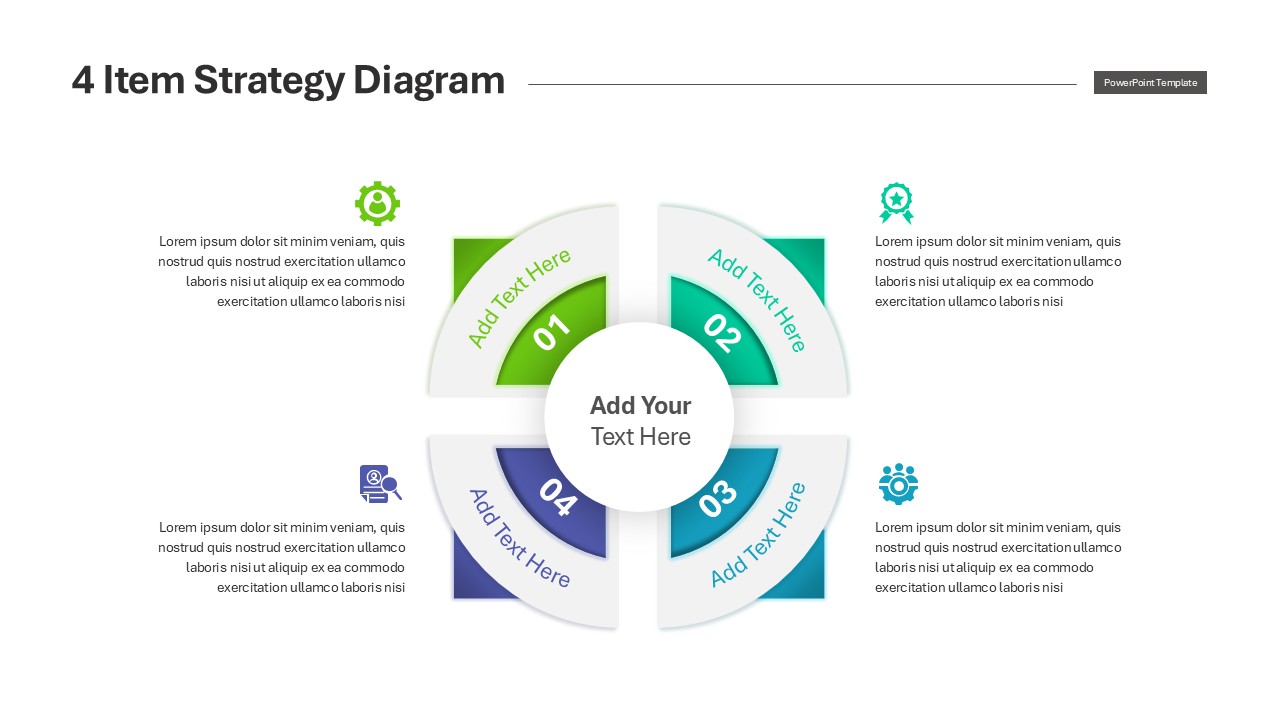
Four-Section Strategy Diagram Slide Template for PowerPoint & Google Slides
Business Strategy
Four-Arrows Rectangular Factors Diagram Template for PowerPoint & Google Slides
Process
Editable Four-Section 3D Shape Diagram Template for PowerPoint & Google Slides
Comparison
Four-Circle Hub and Spoke Diagram Template for PowerPoint & Google Slides
Process

Flat Four-Box Business Layout Diagram Template for PowerPoint & Google Slides
Process
Four-Section Arrow Infographic Diagram Template for PowerPoint & Google Slides
Arrow
Four-Point Arrow Cycle Diagram Template for PowerPoint & Google Slides
Arrow

Four-Level Business Pyramid Diagram Template for PowerPoint & Google Slides
Pyramid
Four Section Circular Text Boxes Diagram Template for PowerPoint & Google Slides
Circular
Four-Staged Business Arrow Diagram Template for PowerPoint & Google Slides
Process
Four-Staged Puzzle Diagram Slide Template for PowerPoint & Google Slides
Process

Four-Plus Process Flow Diagram Template for PowerPoint & Google Slides
Process
Modern Four Stage Gear Diagram Template for PowerPoint & Google Slides
Process
Professional Four-Section Layer Diagram Template for PowerPoint & Google Slides
Process
Four-Piece Jigsaw Puzzle Diagram Template for PowerPoint & Google Slides
Process
Four-Step Textbox Layout Diagram Template for PowerPoint & Google Slides
Business Report
Four-Step Speech Bubble Diagram Template for PowerPoint & Google Slides
Process
Four-Stage Agenda Circle Diagram Slide Template for PowerPoint & Google Slides
Agenda
Four-Stage Circular Diagram Infographic Template for PowerPoint & Google Slides
Circular
Four-Stage Gear Process Diagram Template for PowerPoint & Google Slides
Process
Four-Stage Cycle Process Diagram Template for PowerPoint & Google Slides
Process
Concentric Four-Layer Core Diagram Template for PowerPoint & Google Slides
Circular
Four-Stage Linear Process Flow Diagram Template for PowerPoint & Google Slides
Process
Four-Stage Circular Flow Diagram Template for PowerPoint & Google Slides
Circular
Hand-Held Four-Step Process Diagram Template for PowerPoint & Google Slides
Process
Four-Stage Start-Up Plan Arc Diagram Template for PowerPoint & Google Slides
Process
Four-Stage Funnel Diagram Infographic Template for PowerPoint & Google Slides
Funnel
Four-Step Spiral Funnel Diagram Template for PowerPoint & Google Slides
Funnel
Four-Part SWOT Analysis Diagram Template for PowerPoint & Google Slides
SWOT
Four-Step Puzzle Diagram Infographic Template for PowerPoint & Google Slides
Process
Four-Stage Funnel Diagram Infographic Template for PowerPoint & Google Slides
Funnel
Four Section Diagram Infographics template for PowerPoint & Google Slides
Process
Four Business Structure Types Comparison Diagram Template for PowerPoint & Google Slides
Business Strategy
Four Section Infographic Diagram Template for PowerPoint & Google Slides
Circular
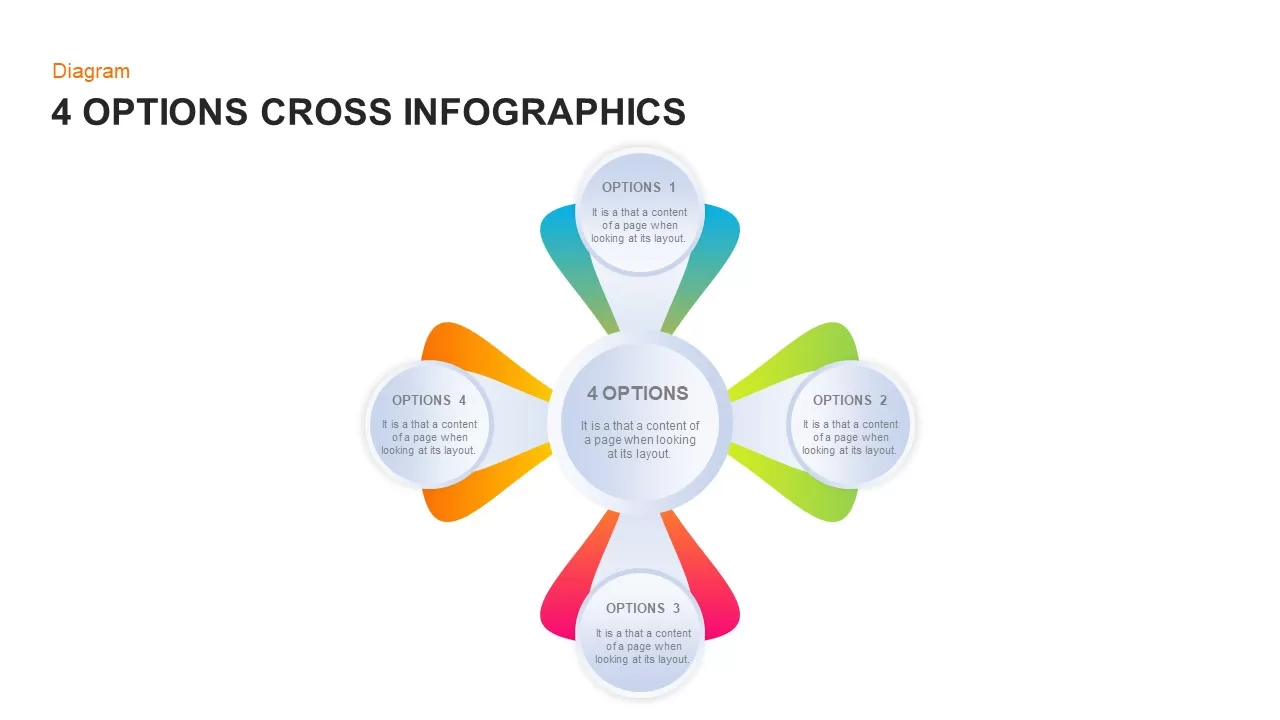
Four-Option Cross Infographic Diagram Template for PowerPoint & Google Slides
Comparison
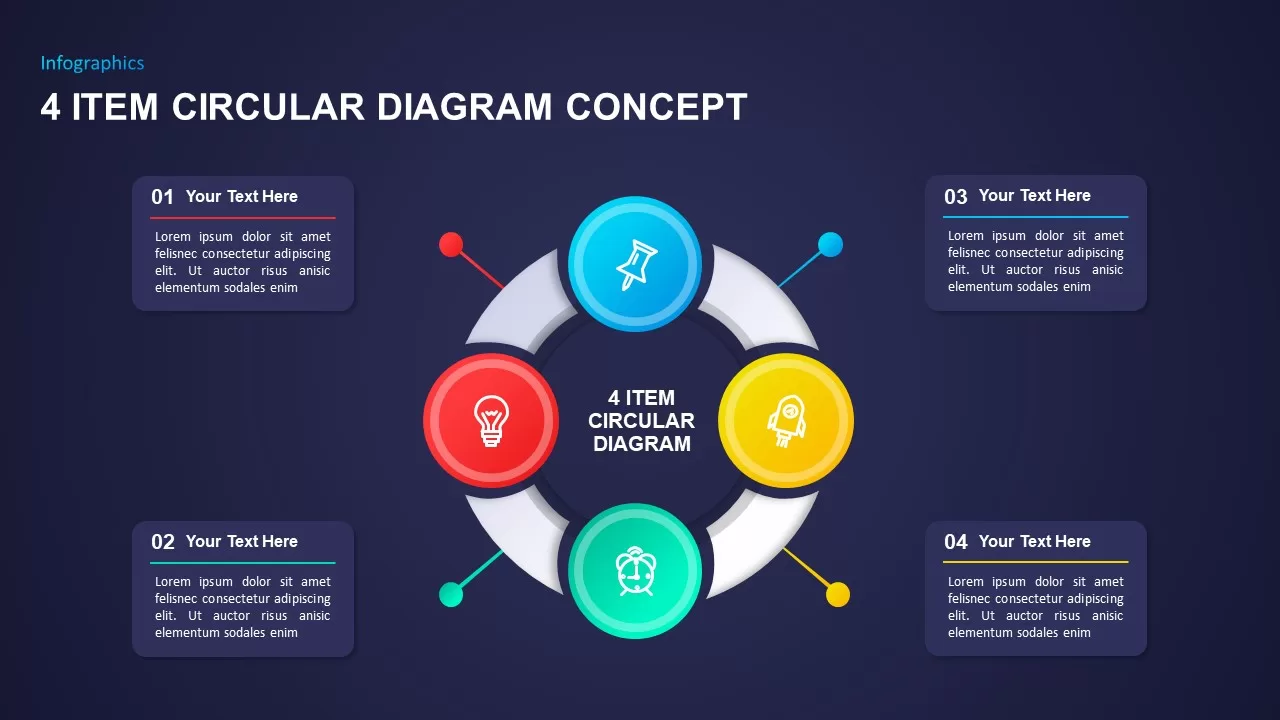
Four-Item Circular Diagram Concept Template for PowerPoint & Google Slides
Circular
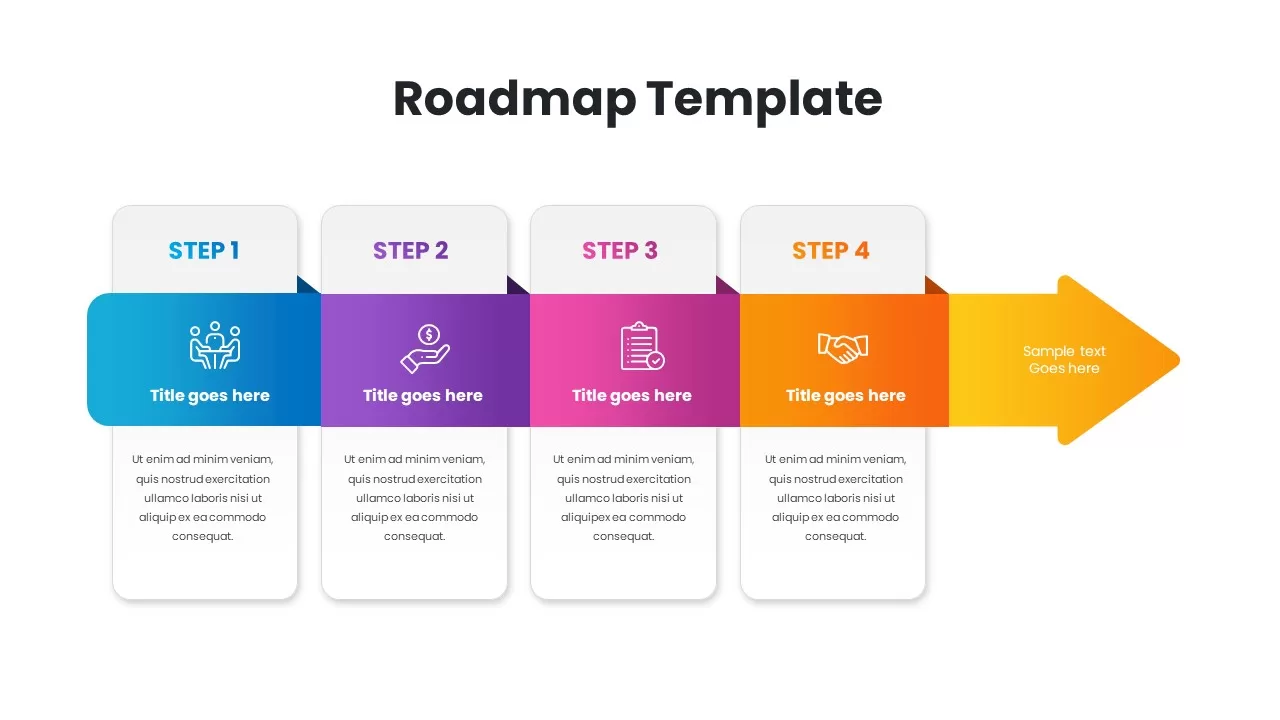
Gradient Four-Step Roadmap Diagram Template for PowerPoint & Google Slides
Roadmap
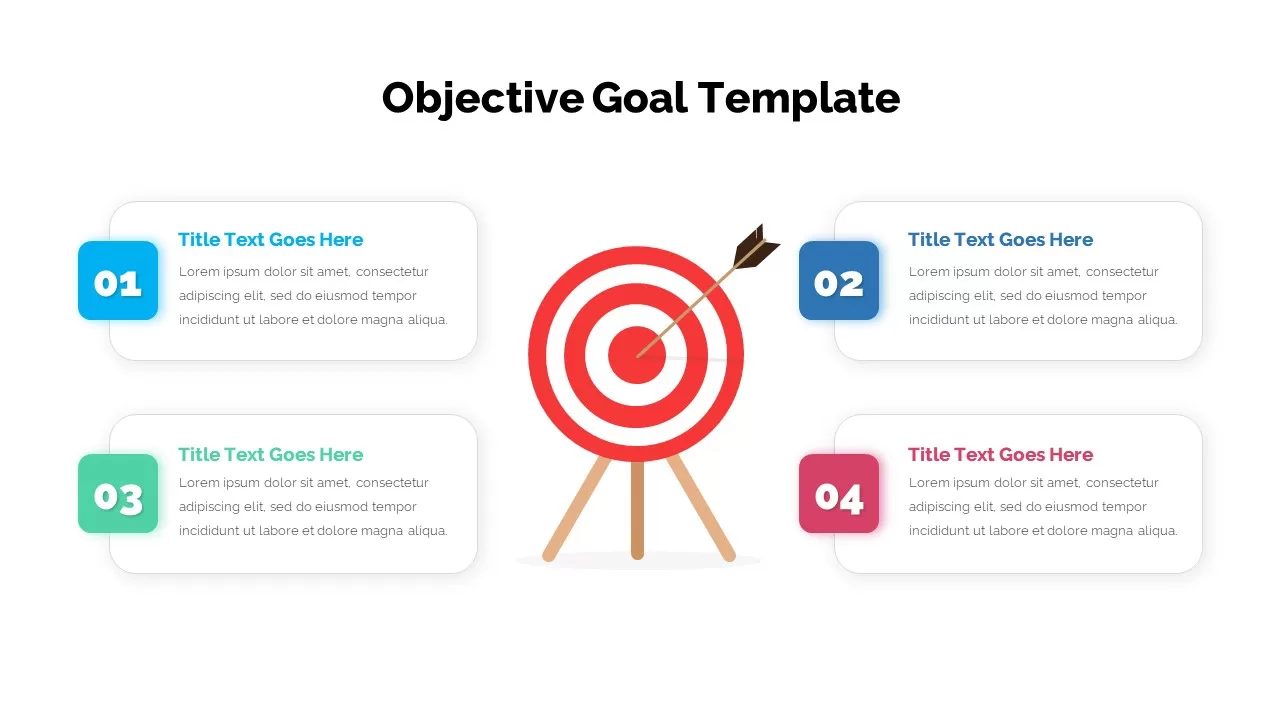
Four-Step Objective Goal Diagram Template for PowerPoint & Google Slides
Goals
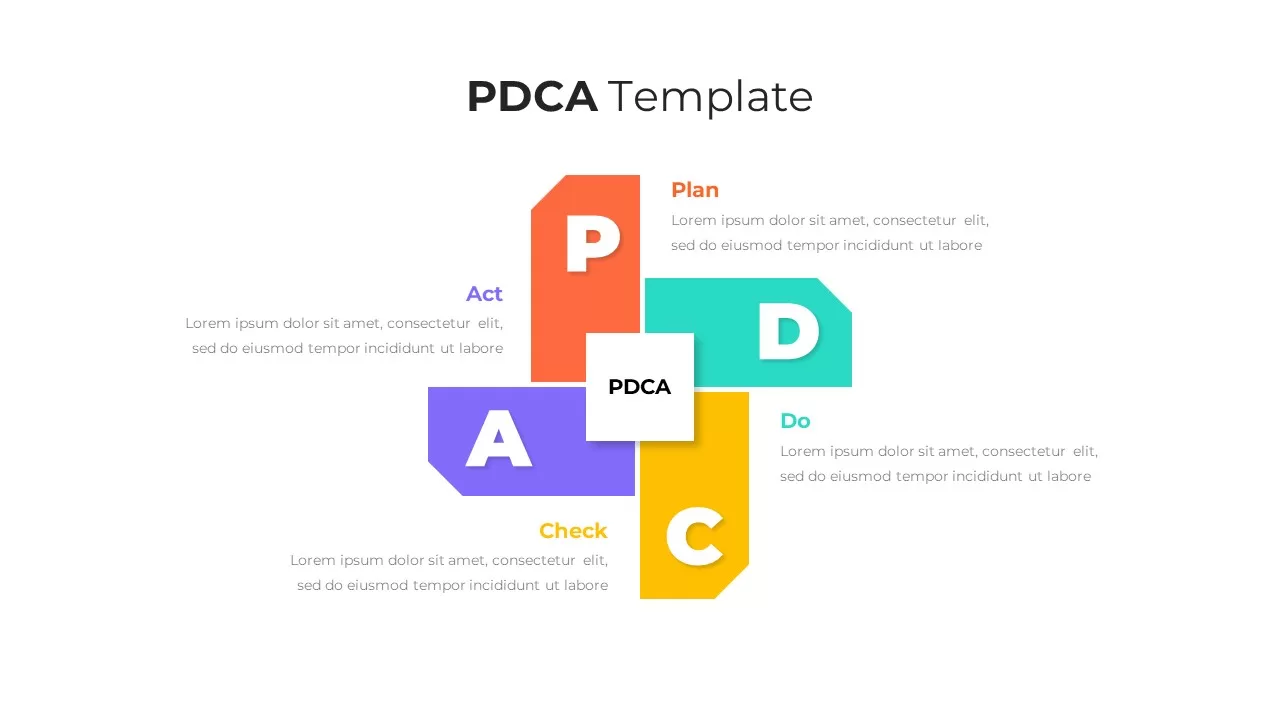
Elegant PDCA Four-Step Process Diagram Template for PowerPoint & Google Slides
Process
Four-Arrow Curved Hub-and-Spoke Diagram Template for PowerPoint & Google Slides
Arrow
Hand-Drawn Four-Step Curved Arrow Diagram Template for PowerPoint & Google Slides
Arrow
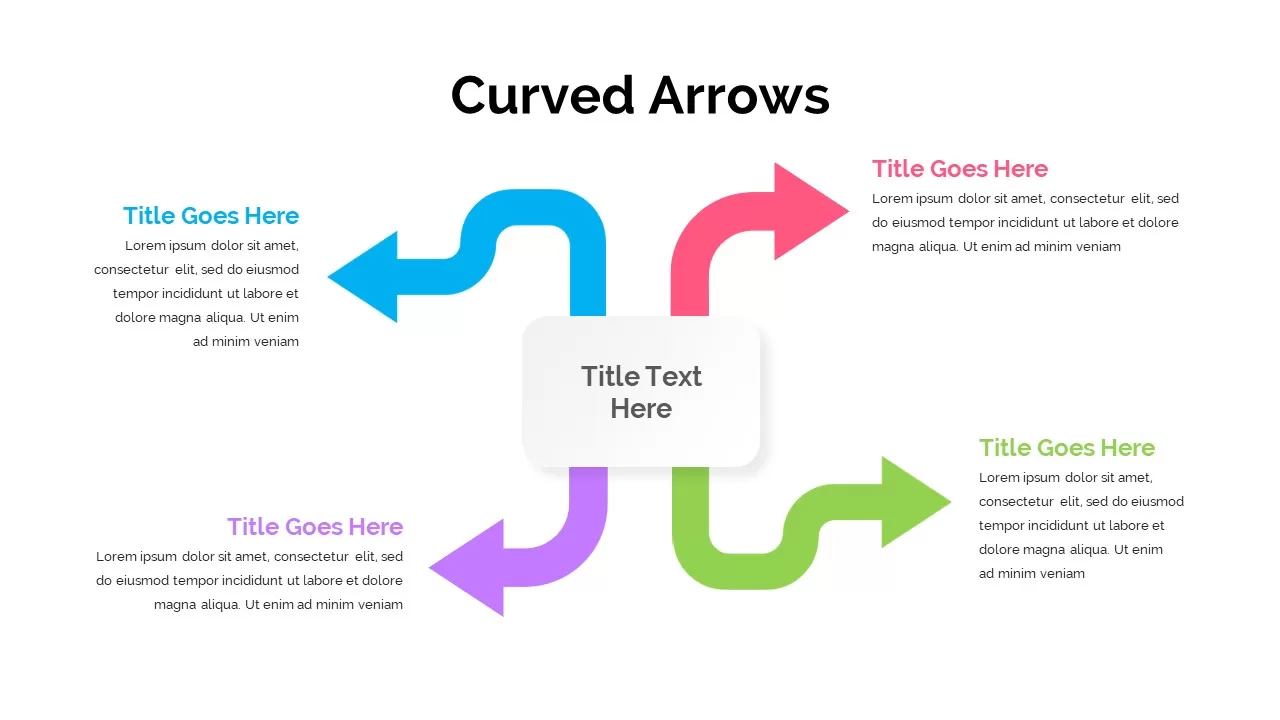
Four-Step Curved Arrow Diagram Template for PowerPoint & Google Slides
Arrow
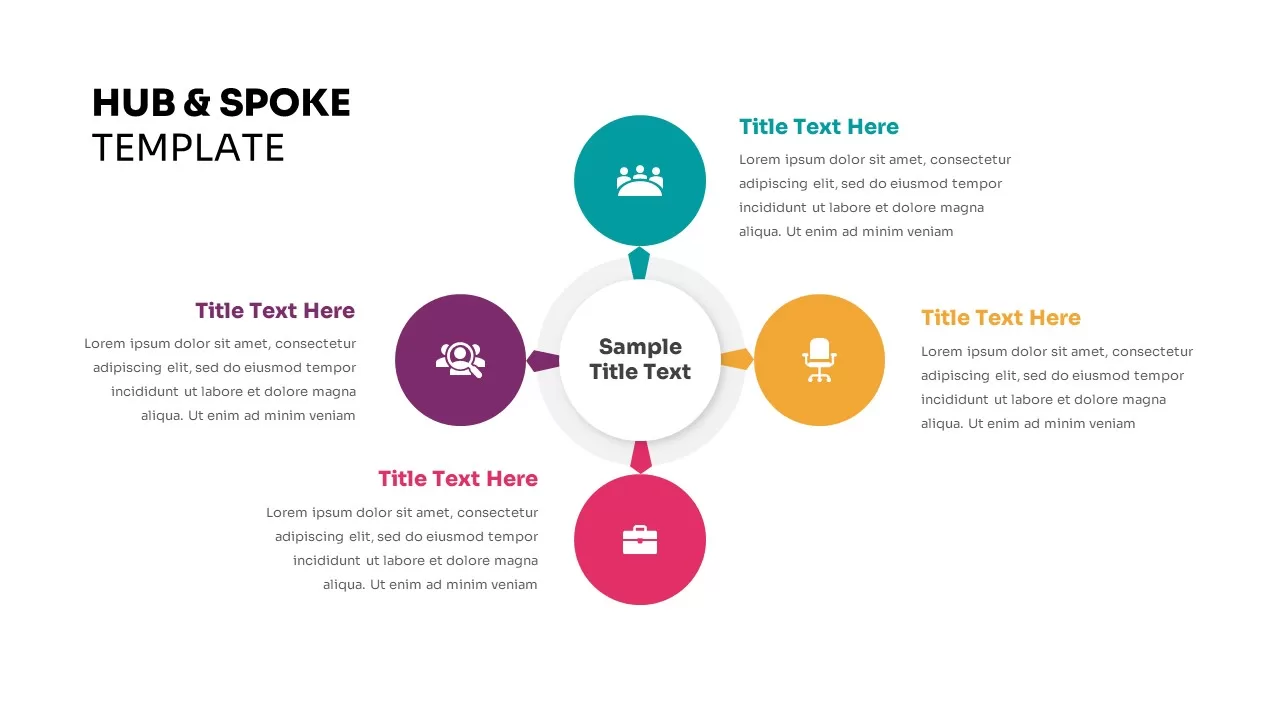
Four-Point Hub and Spoke Diagram Template for PowerPoint & Google Slides
Business Strategy
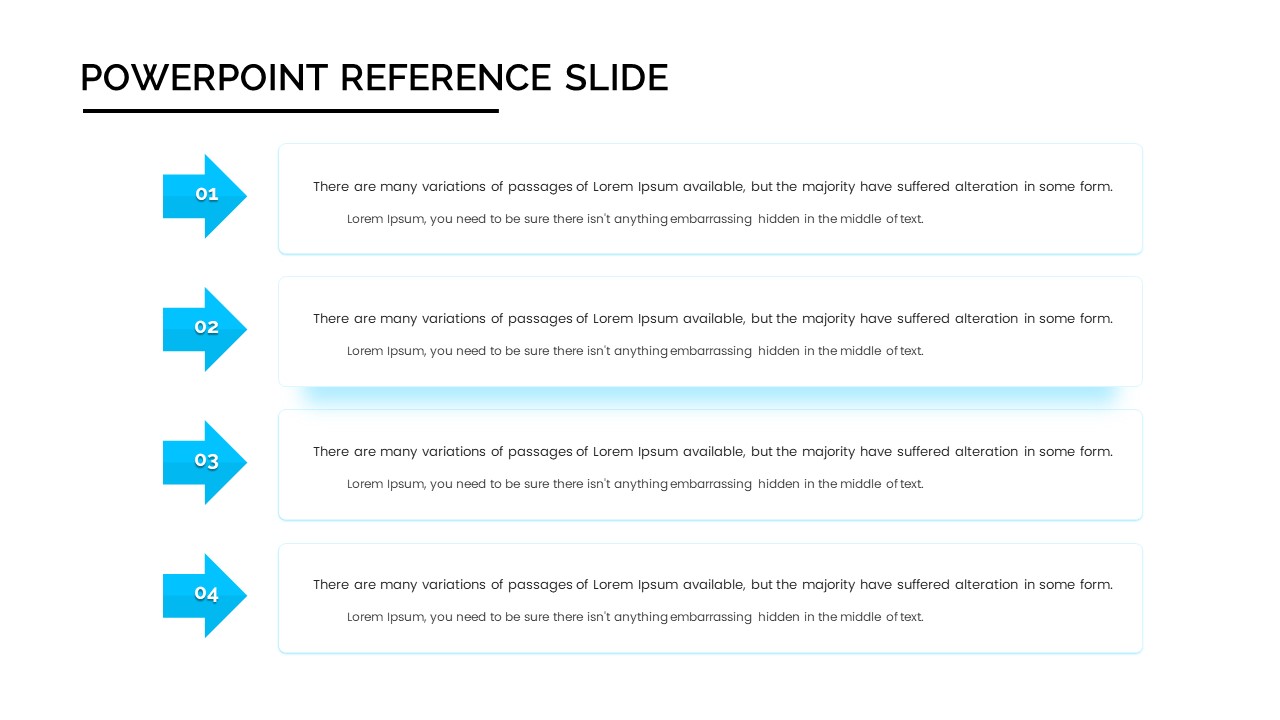
Four-Step Arrow Reference Diagram Slide Template for PowerPoint & Google Slides
Arrow
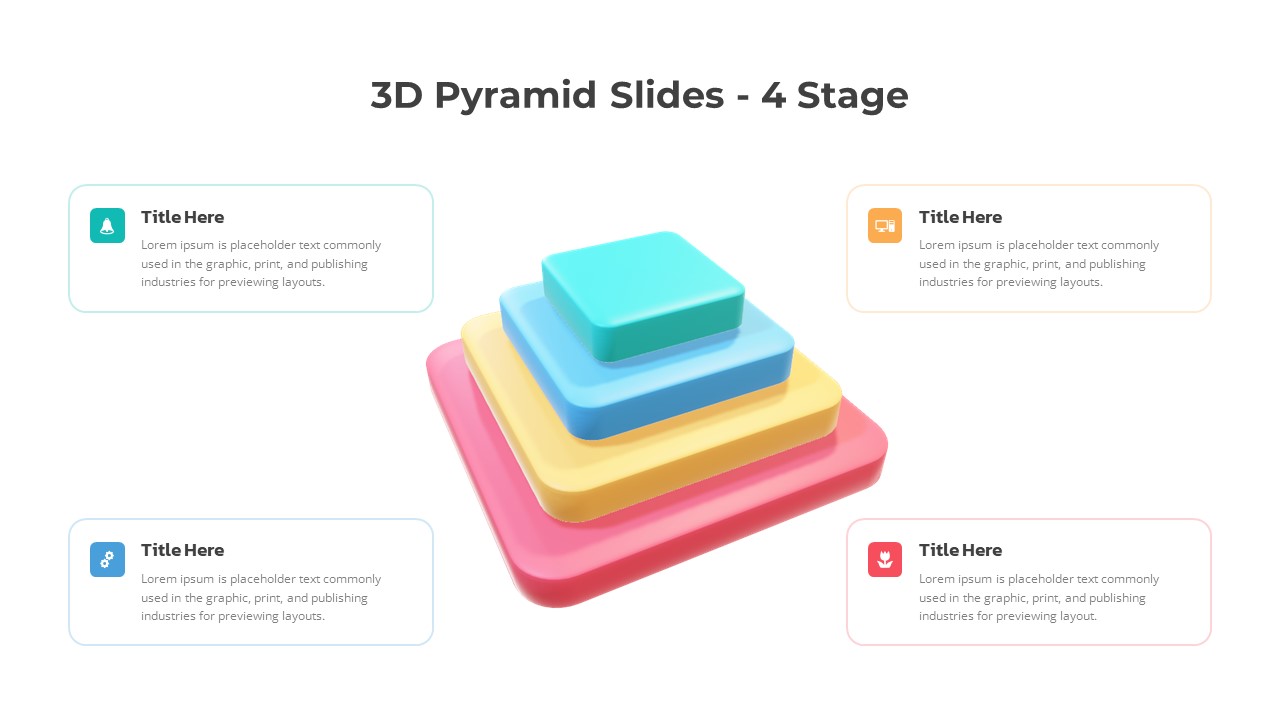
3D Four-Stage Pyramid Diagram Template for PowerPoint & Google Slides
Pyramid
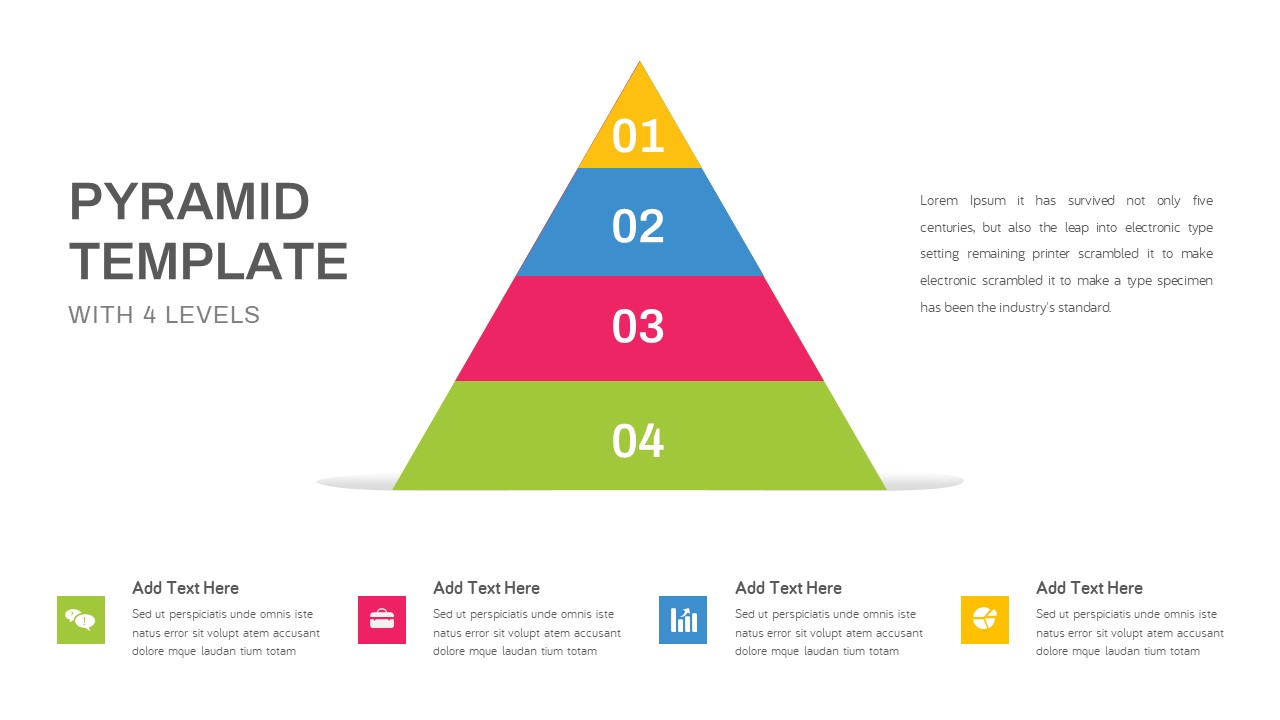
Four-Level Colorful Pyramid Diagram Template for PowerPoint & Google Slides
Pyramid
Modern Four-Level Pyramid Diagram Template for PowerPoint & Google Slides
Pyramid
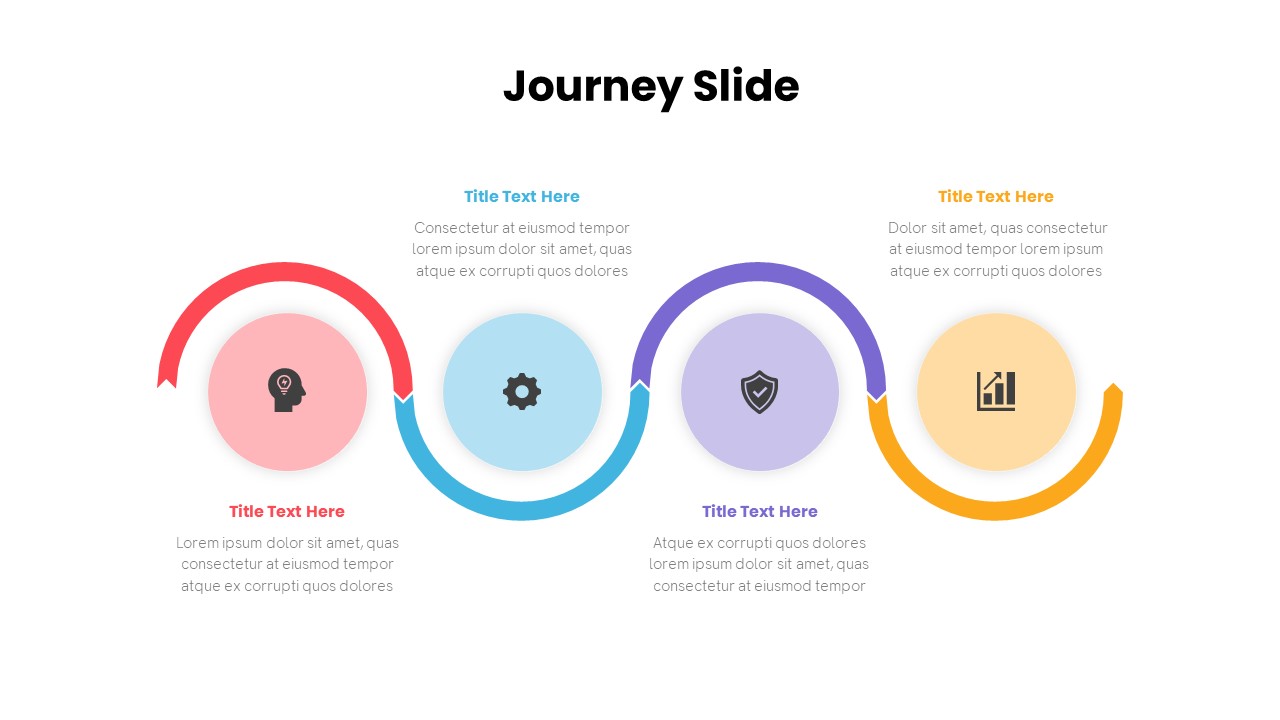
Free Journey Slide with Four Icons Diagram Template for PowerPoint & Google Slides
Process
Free
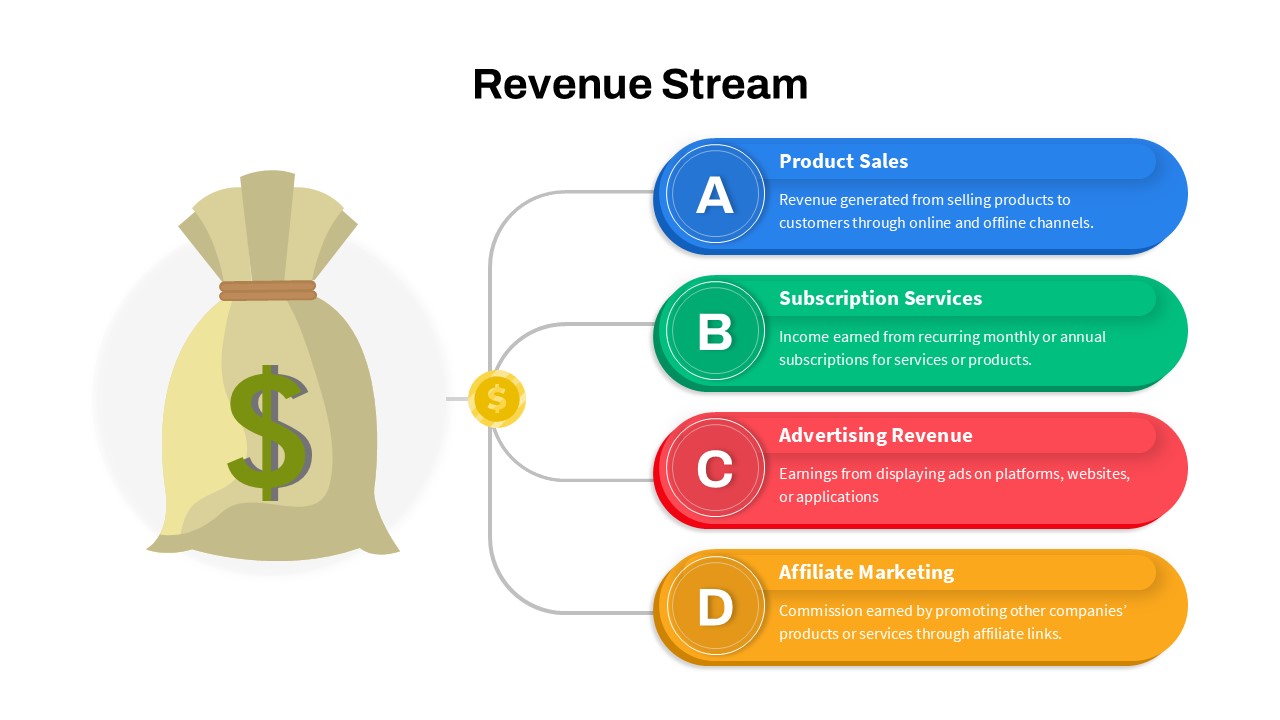
Revenue Streams: Four Channels Diagram Template for PowerPoint & Google Slides
Business Models
Engaging Four-Option Strategy Diagram Template for PowerPoint & Google Slides
Business Strategy
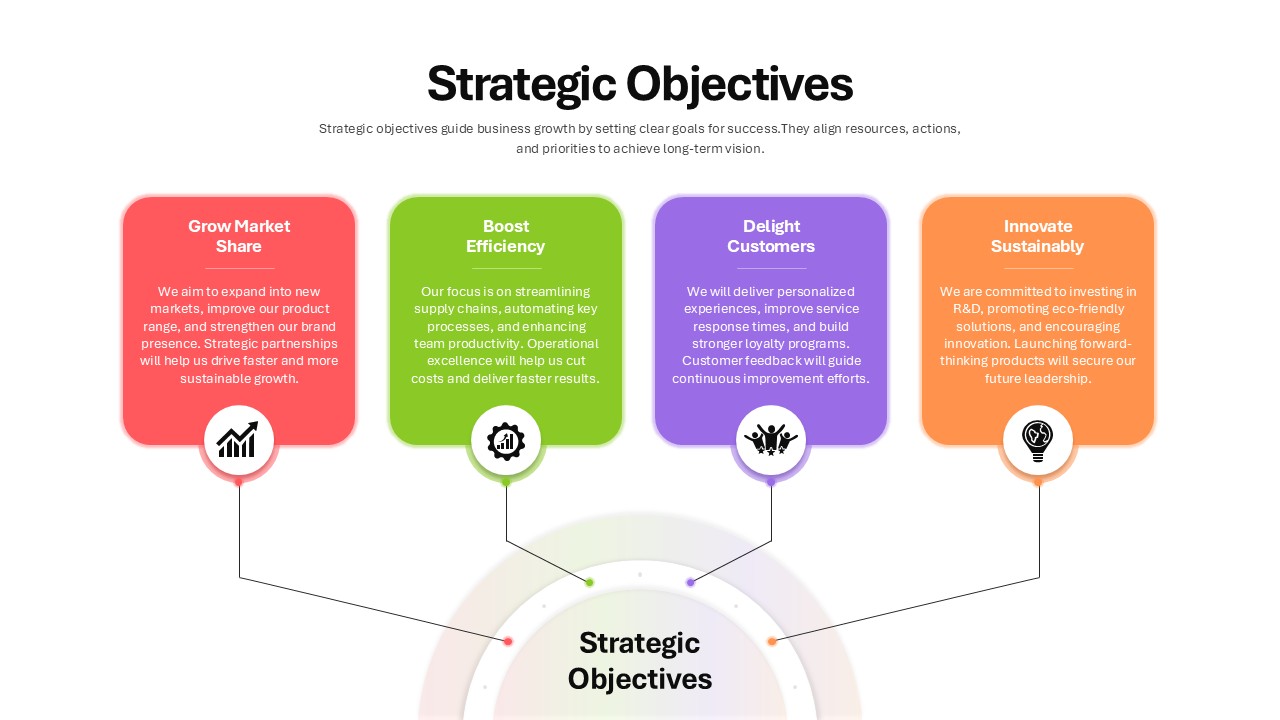
Four Strategic Objectives Radial Diagram Template for PowerPoint & Google Slides
Business Strategy
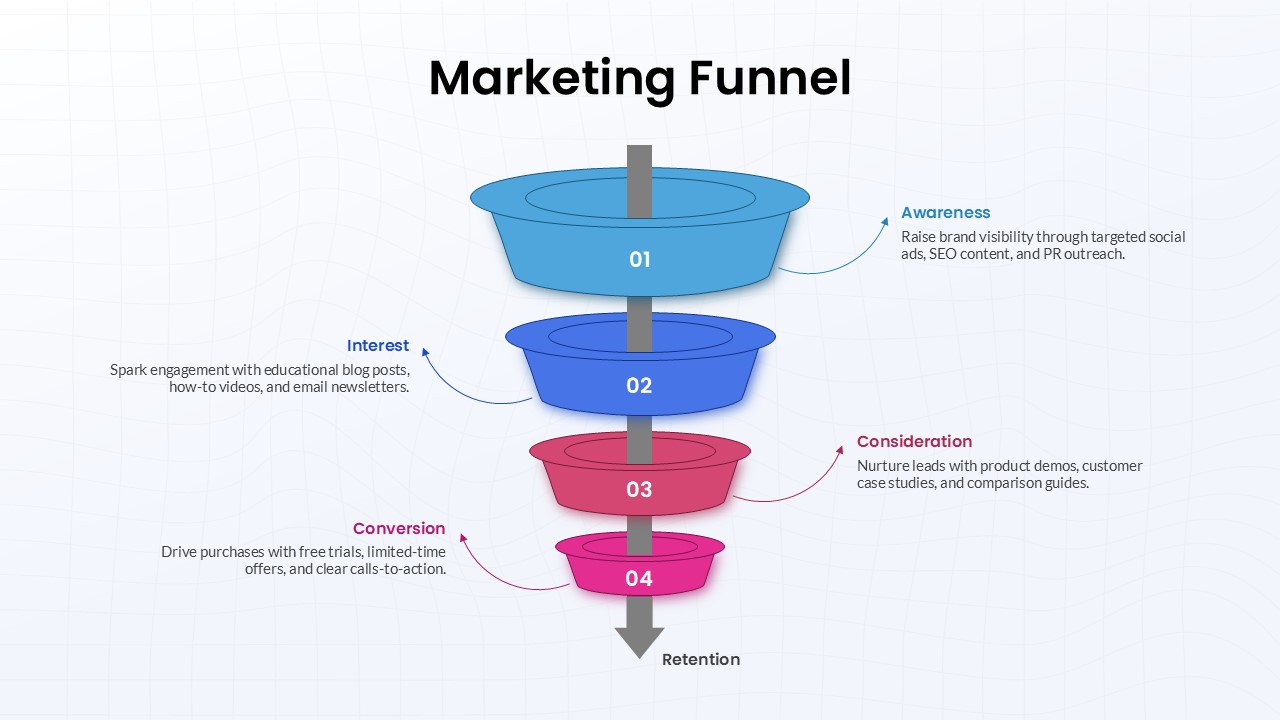
Four-Stage Marketing Funnel Diagram Template for PowerPoint & Google Slides
Marketing Funnel