Four-Phase Decarbonization Diagram Template for PowerPoint & Google Slides
Description
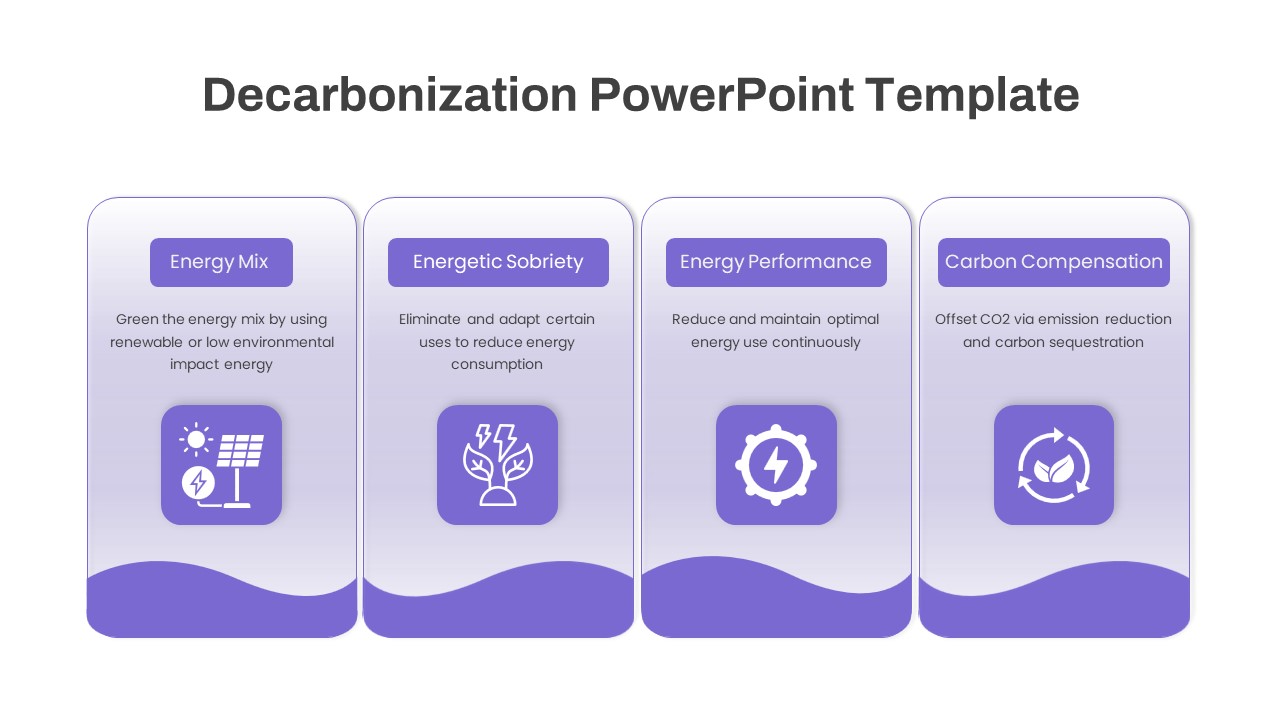
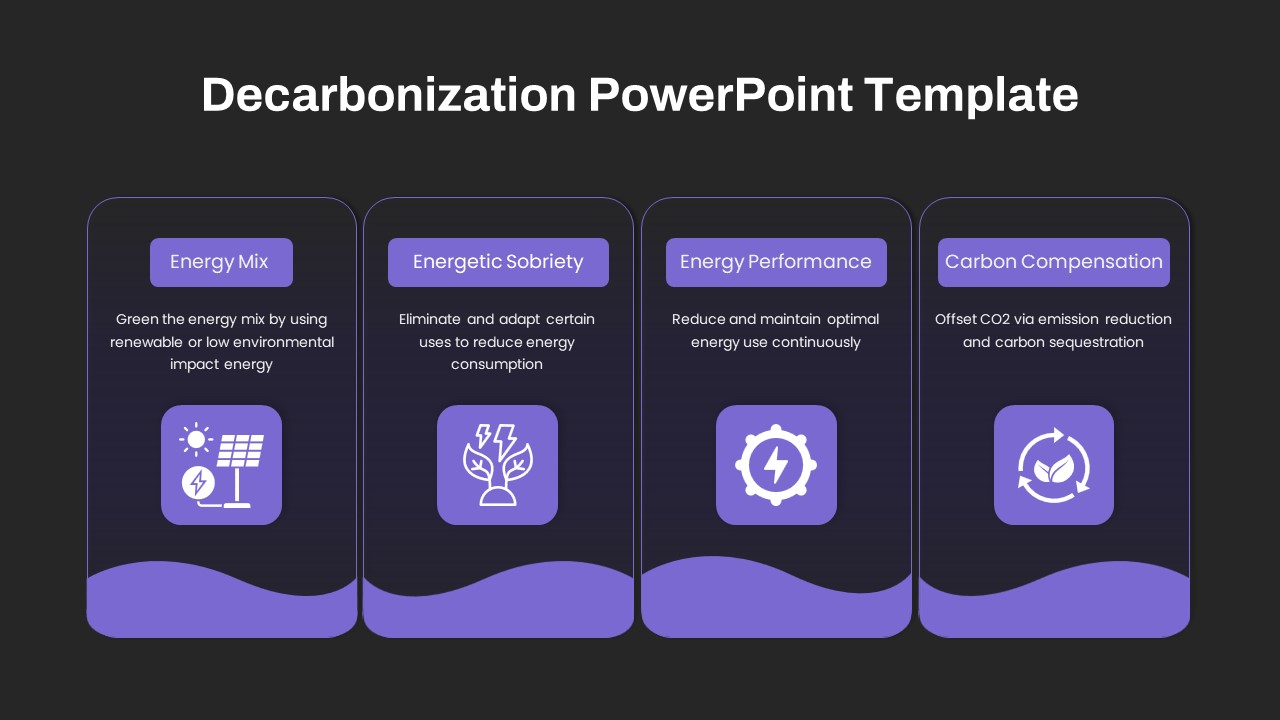
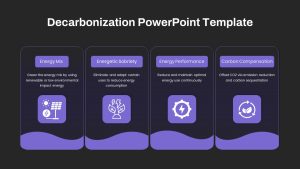
Showcase your organization’s decarbonization roadmap with this four-phase infographic diagram. Four side-by-side panels—Energy Mix, Energetic Sobriety, Energy Performance, and Carbon Compensation—are presented in a cohesive purple gradient scheme with custom icons. Each card includes a title bar, concise description area, and illustrative icon set against a wavy footer, delivering a striking visual hierarchy. Clean sans-serif typography and subtle shadows ensure a modern and professional aesthetic.
Built with PowerPoint and Google Slides in mind, this template leverages master slides, vector shapes, and intuitive placeholders for effortless customization. You can replace icons, adjust text boxes, change color gradients to match brand palettes, and resize panels without quality loss. Guides and alignment tools keep elements perfectly aligned as you edit. The fully editable structure supports dynamic content updates and collaborative workflows across teams.
This slide excels in executive briefings, sustainability workshops, and climate action presentations. Use it to illustrate renewable energy transitions, consumption-reduction initiatives, performance optimization strategies, or carbon offset frameworks. The balanced four-column layout fosters side-by-side comparisons, helping audiences grasp each phase at a glance. Since the design is optimized for high-resolution displays, your content maintains crisp clarity whether projected, shared online, or viewed on mobile devices.
Advanced features include optional entrance animations and grouped objects to lock layouts after editing. Duplicate or reorder cards to reflect different frameworks, such as circular flow models or risk assessments. Export to PDF or integrate seamlessly into larger pitch decks, ensuring consistent branding and formatting. With this versatile decarbonization diagram, you can engage stakeholders, support data-driven decisions, and drive alignment around your organization’s path to net-zero.
Who is it for
Sustainability managers, energy consultants, corporate strategists, and board-level executives will find this diagram invaluable for mapping decarbonization plans, outlining policy frameworks, and presenting climate action roadmaps.
Other Uses
Repurpose this slide for technology adoption roadmaps, process-optimization frameworks, risk assessments, or multi-stage project overviews. Simply update titles, icons, and descriptions to suit any four-step methodology.
Login to download this file

Item ID
SB04367
Related Templates

Five-Phase and Three-Phase Phases Chart Template for PowerPoint & Google Slides
Charts

Four-Phase Maturity Model Diagram Template for PowerPoint & Google Slides
Process
Gear Process Phase Diagram template for PowerPoint & Google Slides
Process
Greiner Growth Model Six-Phase Diagram Template for PowerPoint & Google Slides
Business Models
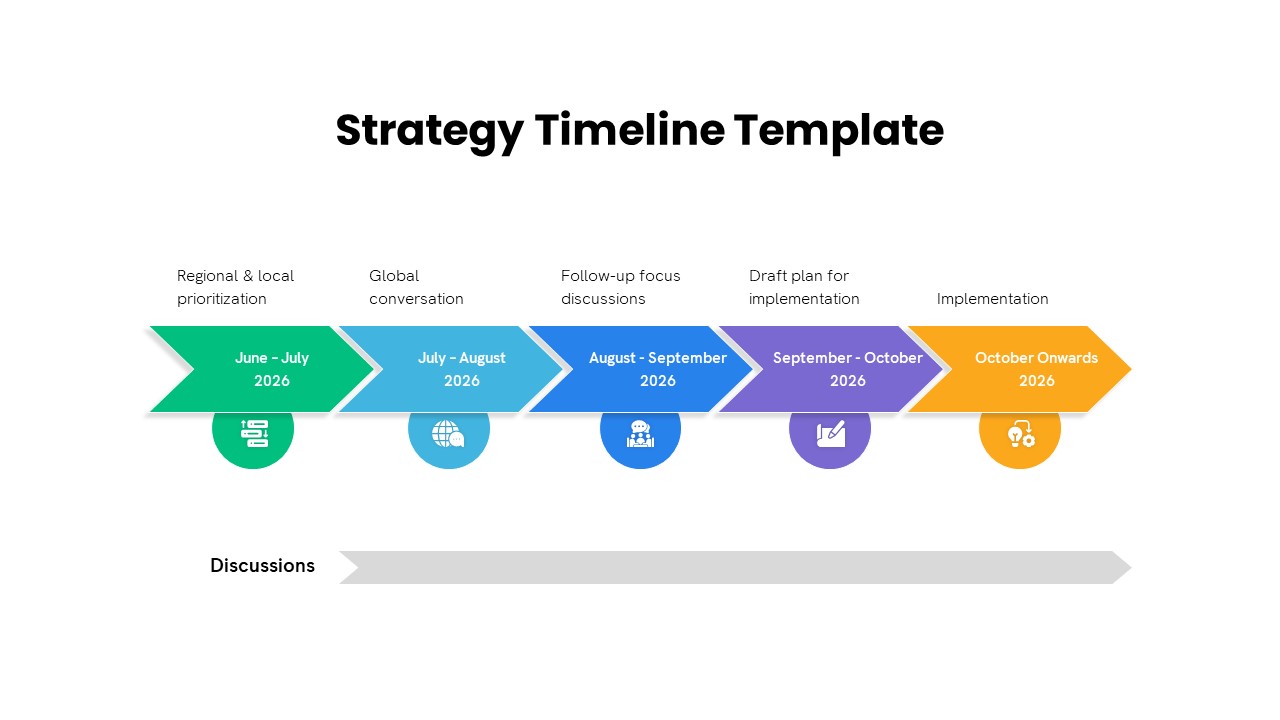
Five-Phase Strategy Timeline Diagram Template for PowerPoint & Google Slides
Timeline
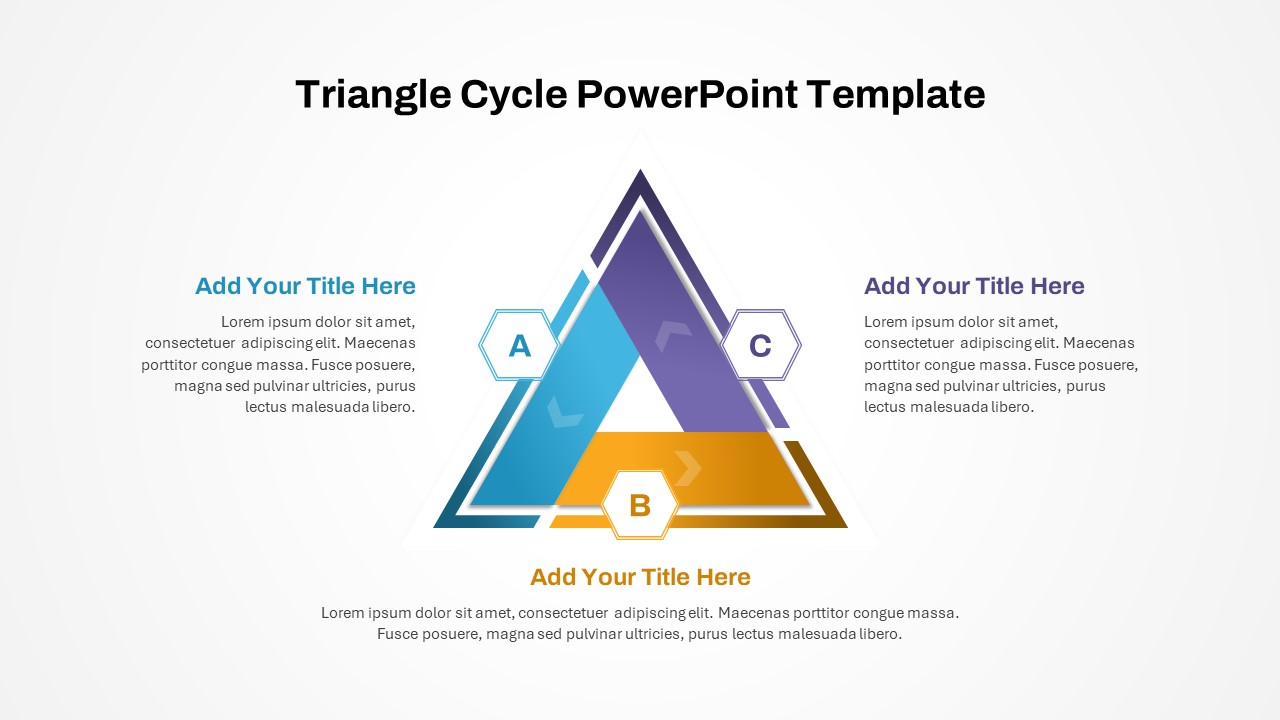
Three-Phase Triangle Cycle Diagram Template for PowerPoint & Google Slides
Infographics
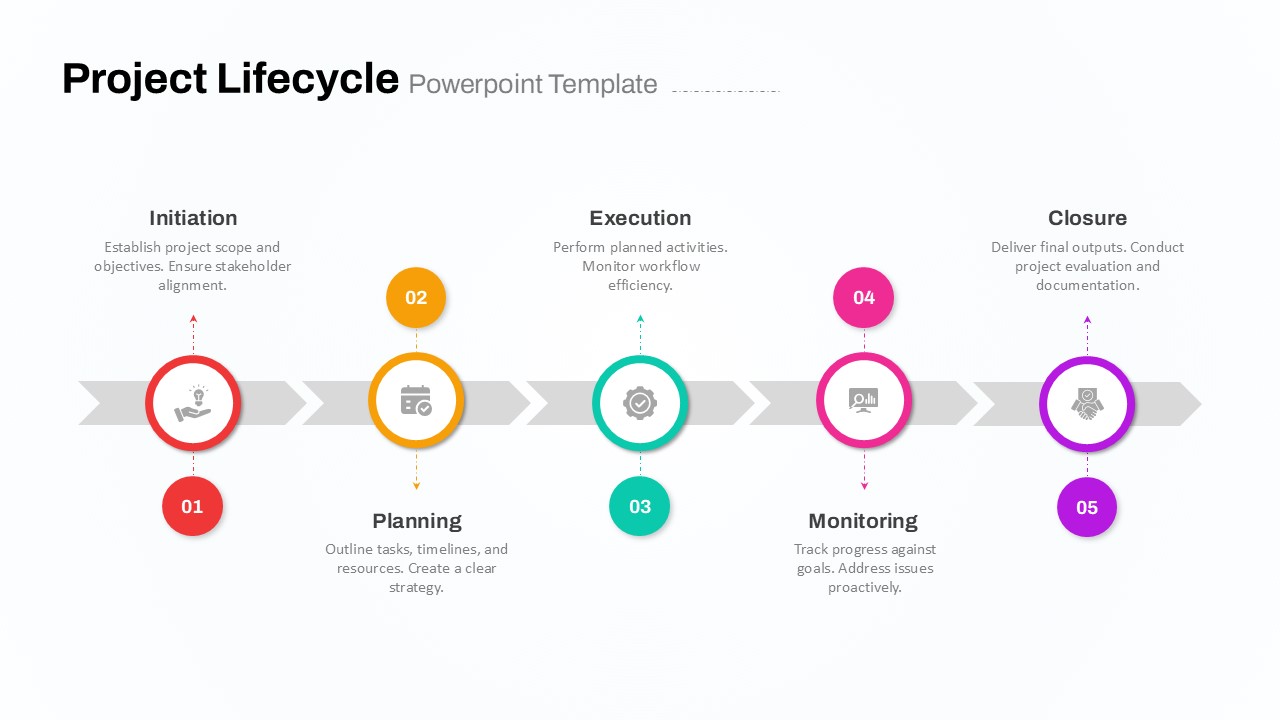
Five-Phase Project Lifecycle Diagram Template for PowerPoint & Google Slides
Infographics
Three-Phase Planning Gear Infographic Template for PowerPoint & Google Slides
Process
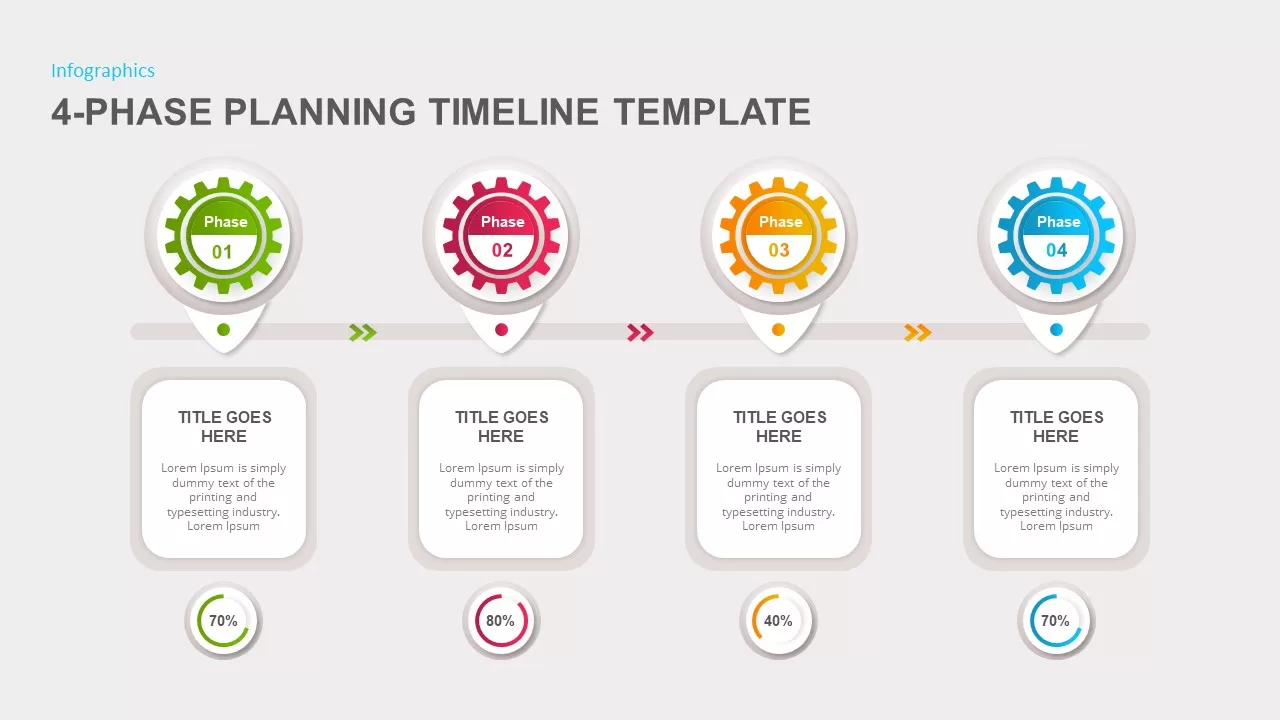
4-Phase Planning Timeline template for PowerPoint & Google Slides
Infographics
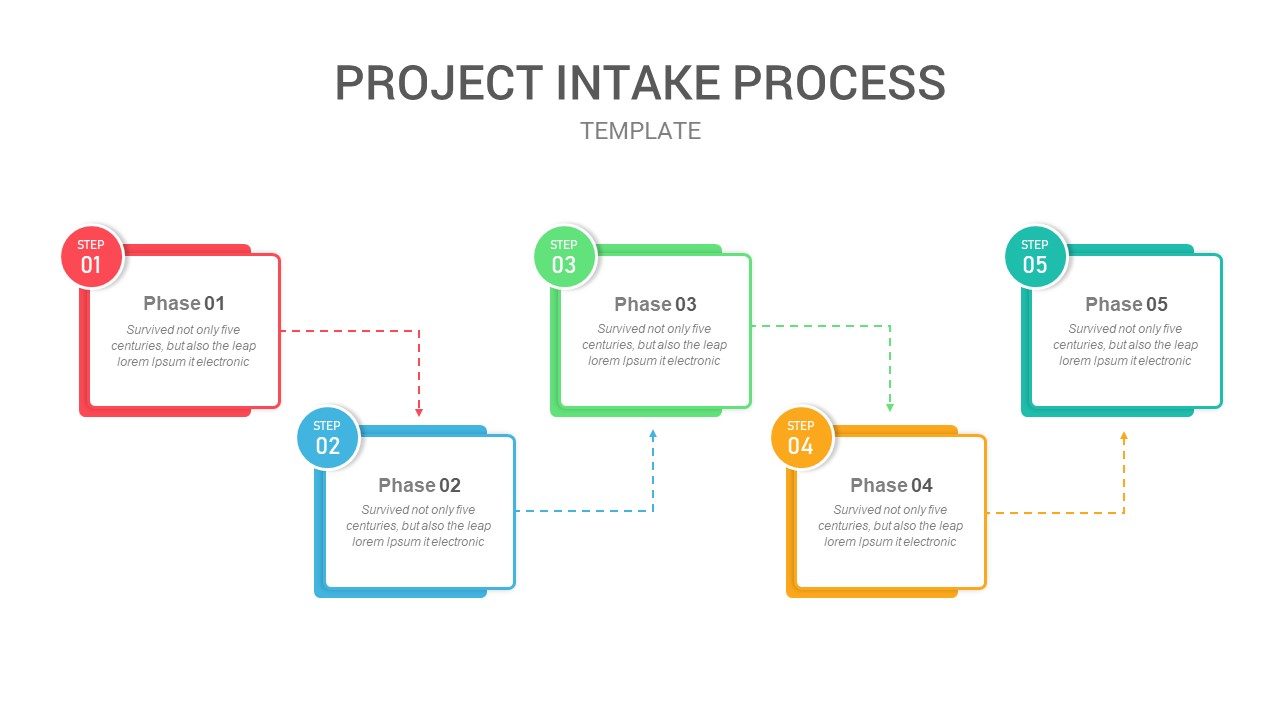
Five-Phase Project Intake Process Flow Template for PowerPoint & Google Slides
Process
Five-Phase Horizontal Timeline Chart Template for PowerPoint & Google Slides
Timeline
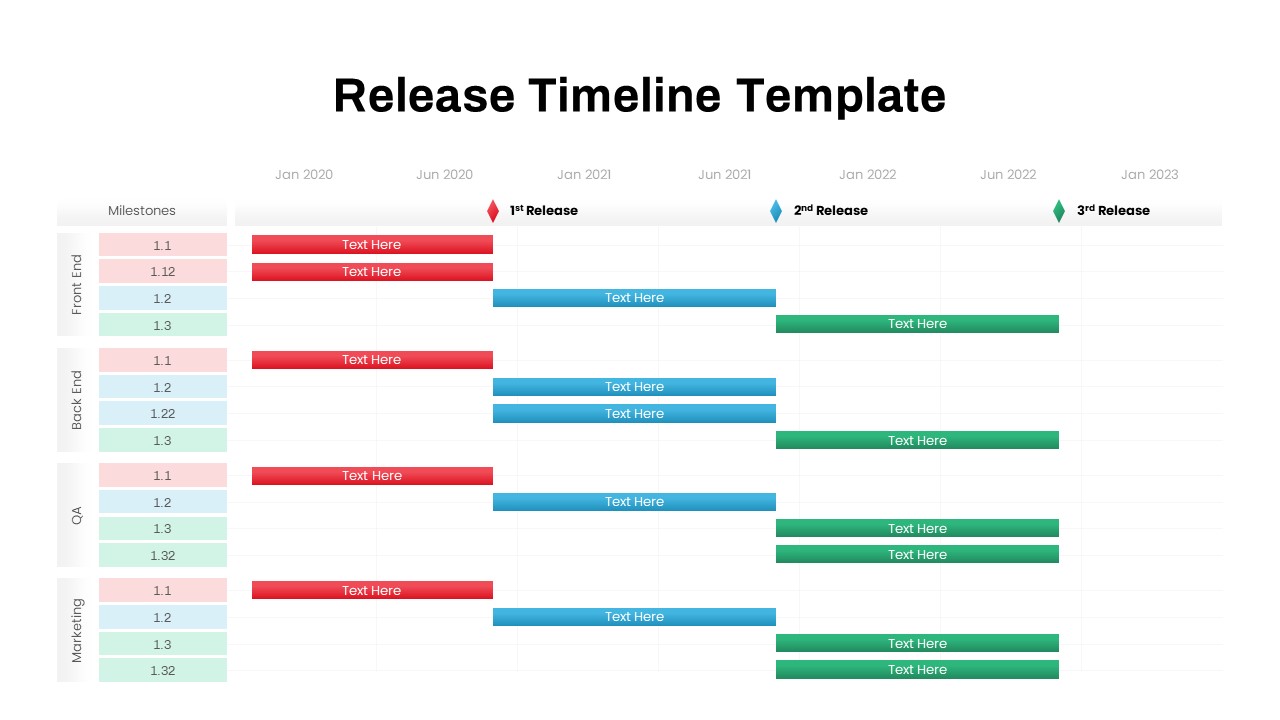
Multi-Team Multi-Phase Release Timeline Template for PowerPoint & Google Slides
Timeline
Multi-Phase Research Roadmap Infographic Template for PowerPoint & Google Slides
Roadmap
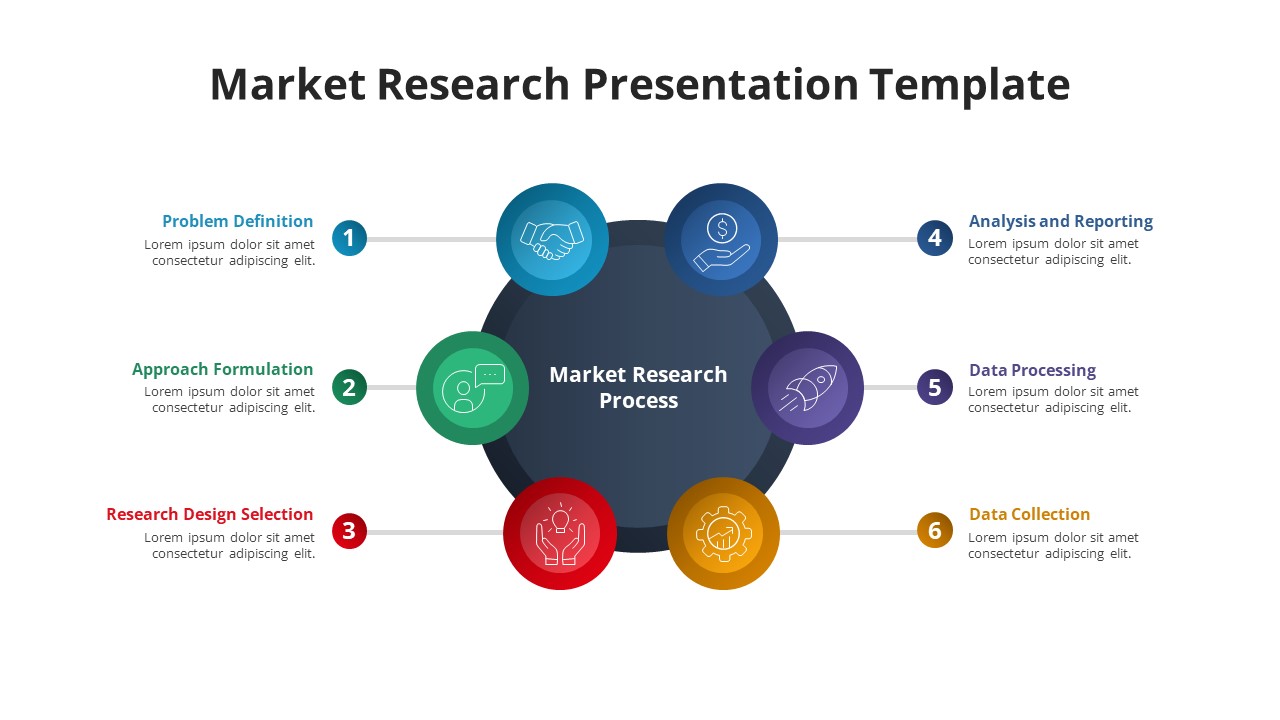
Free Six-Phase Market Research Process Template for PowerPoint & Google Slides
Process
Free
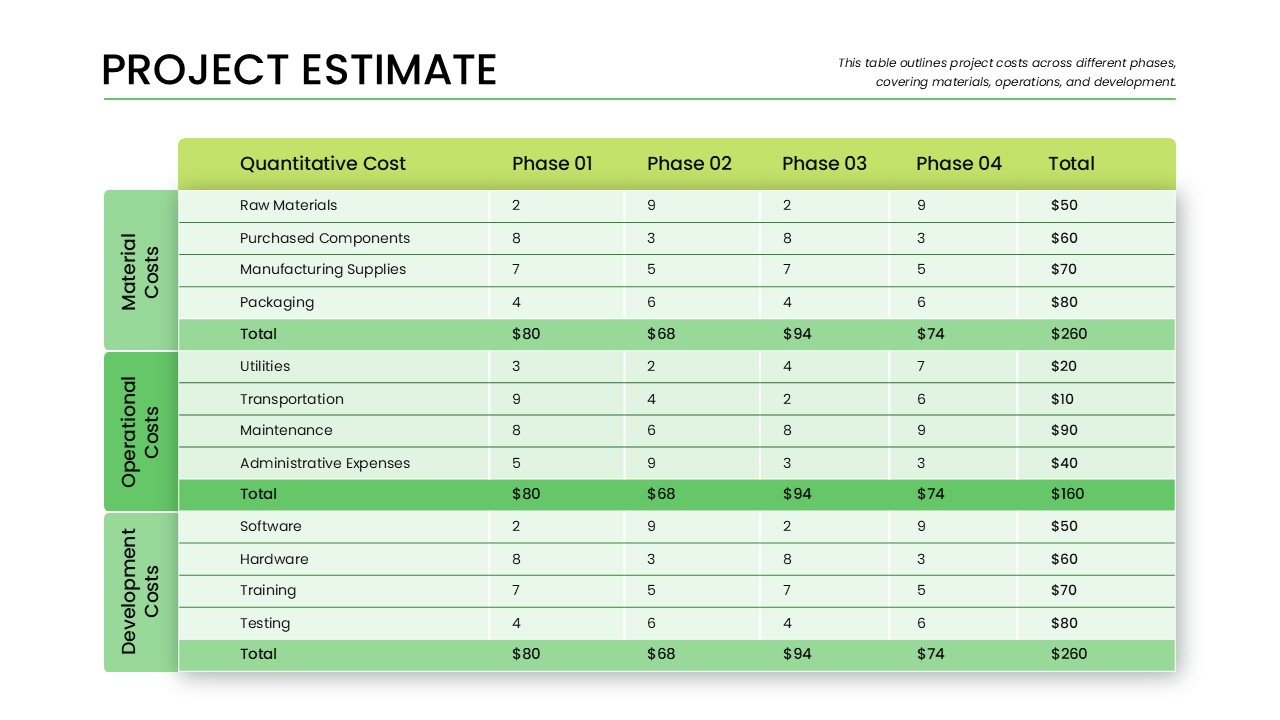
Phase-Wise Project Estimate Table Template for PowerPoint & Google Slides
Business Report
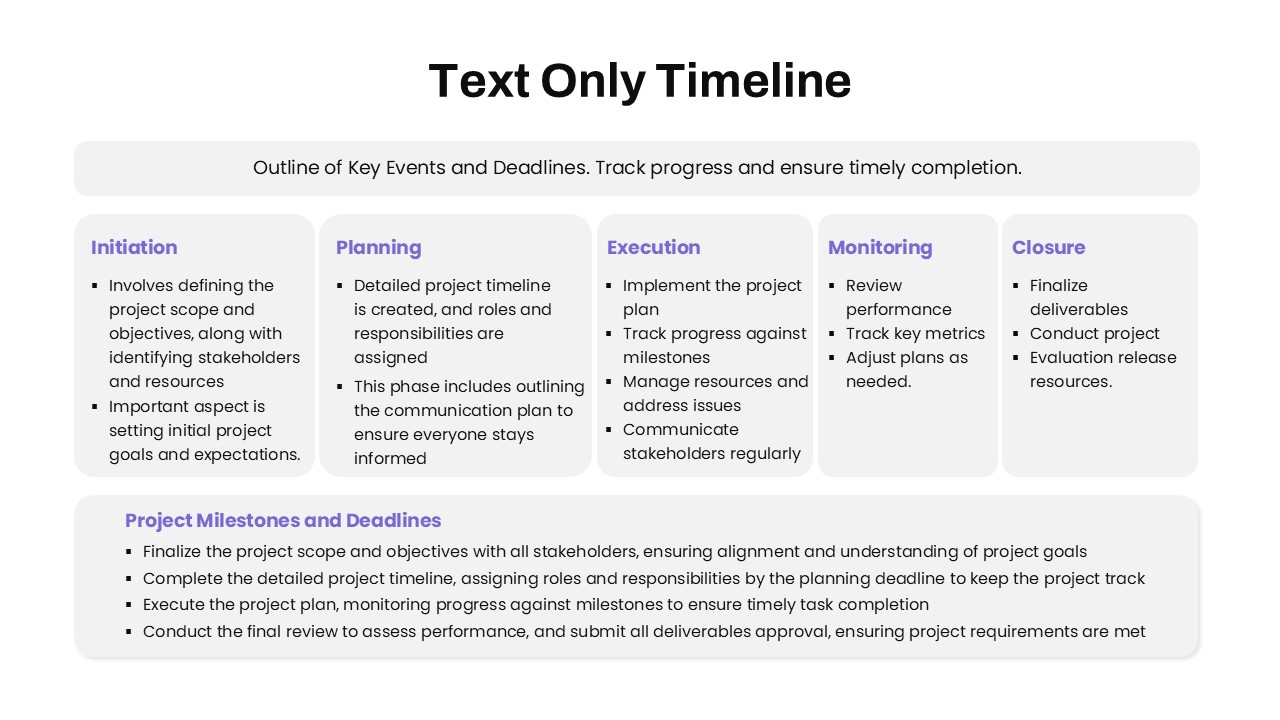
Text-Only Five-Phase Timeline Template for PowerPoint & Google Slides
Timeline

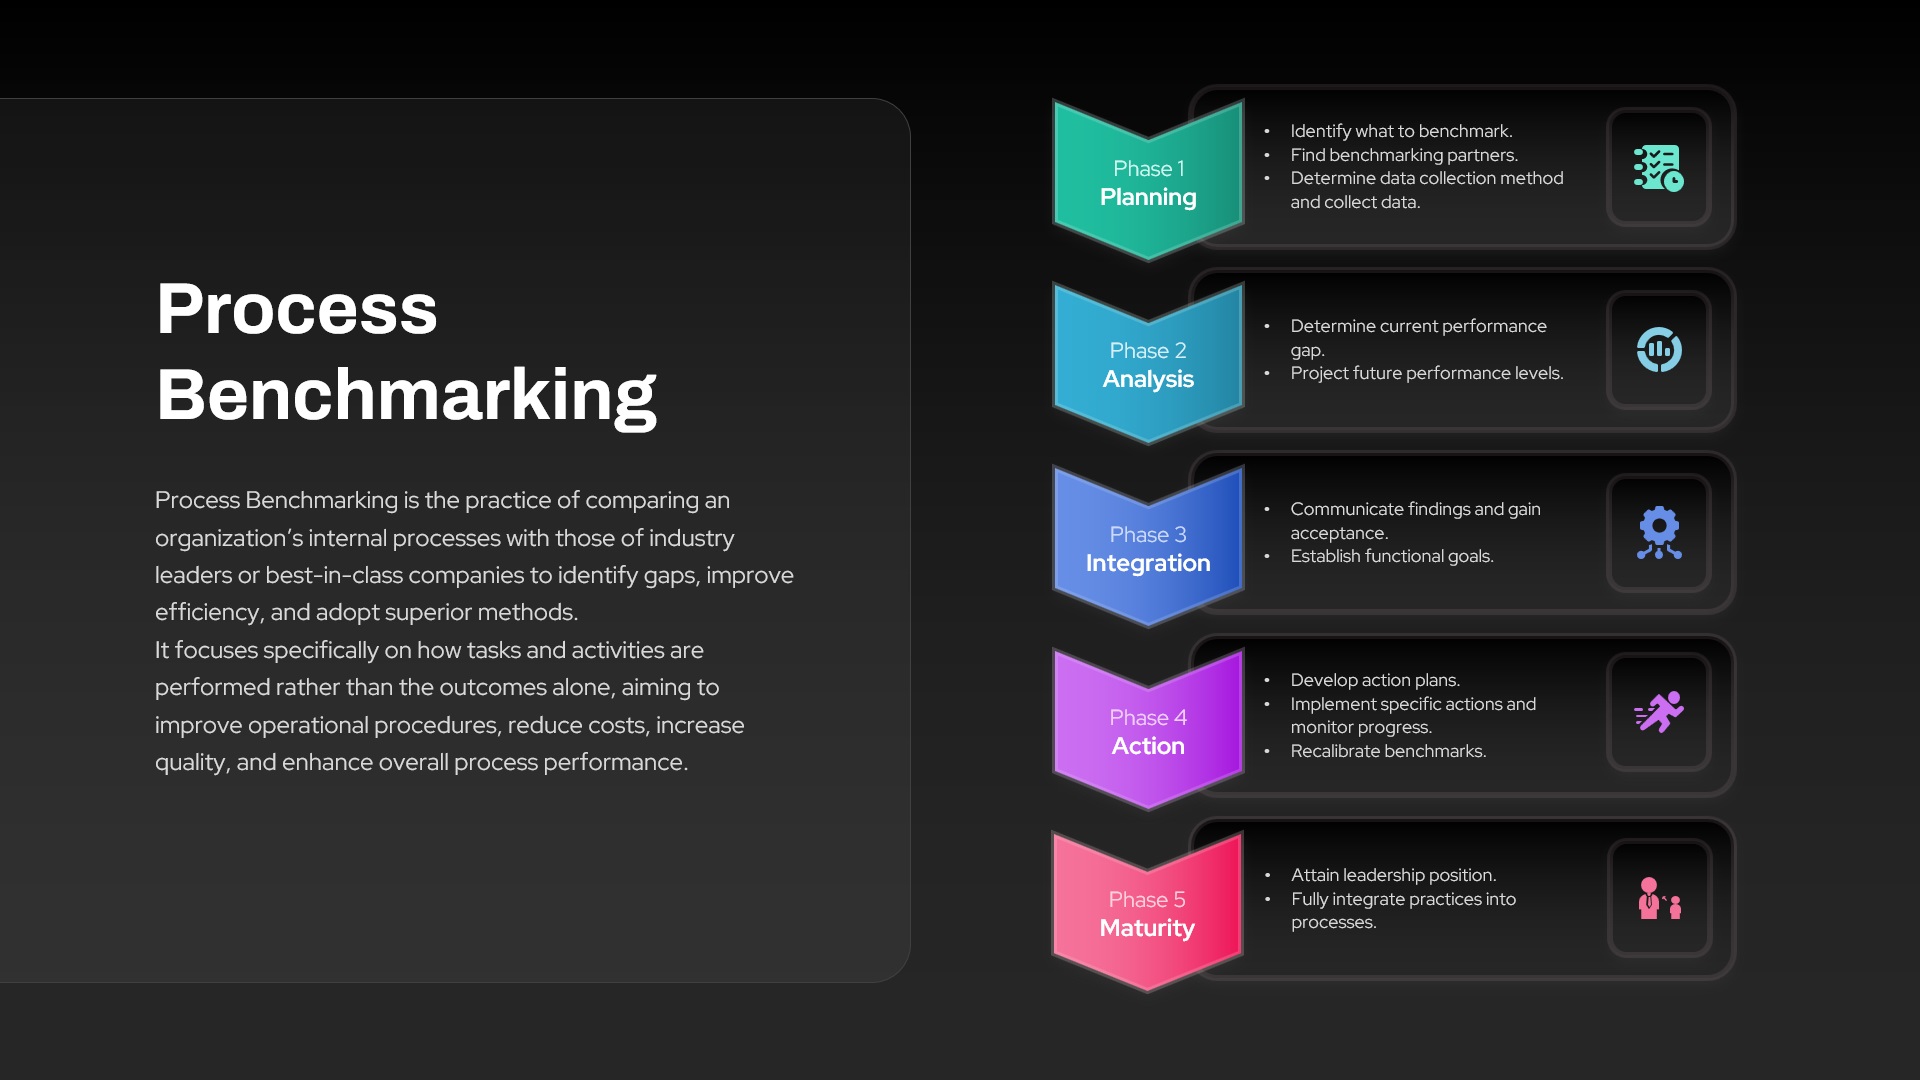
Process Benchmarking Five-Phase Framework Template for PowerPoint & Google Slides
Process
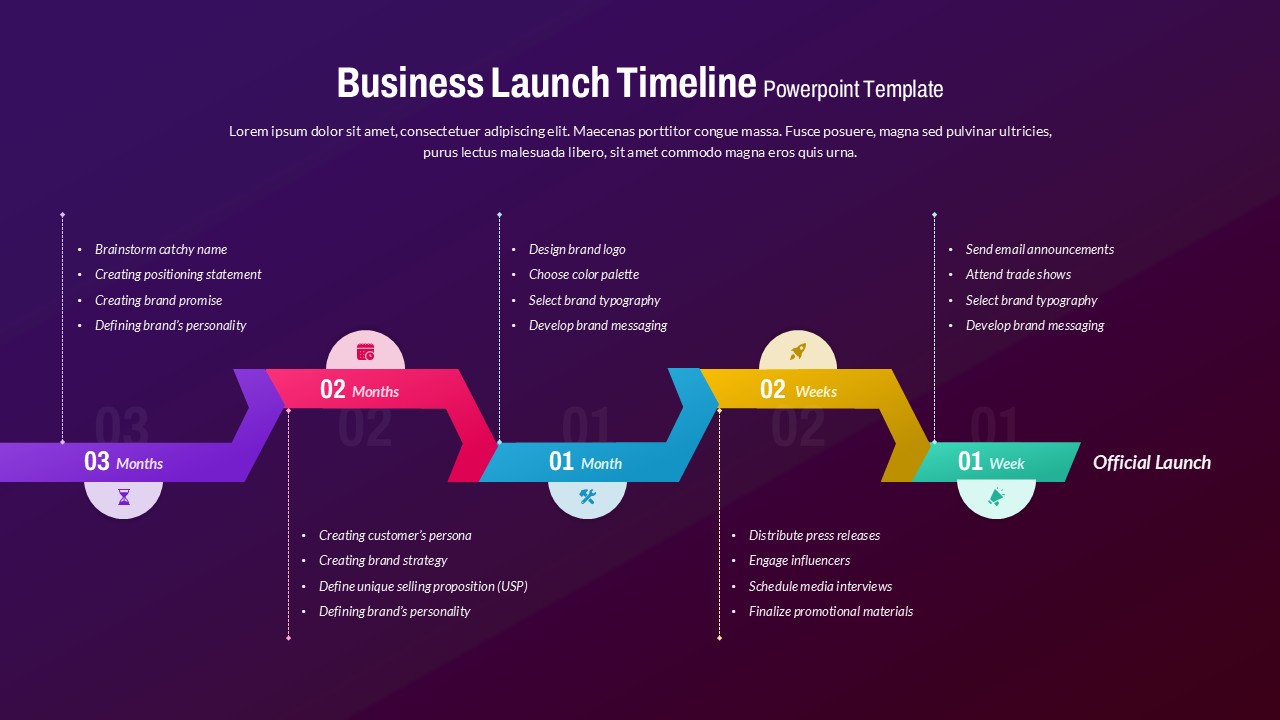
Business Launch Timeline Roadmap 5-Phase Template for PowerPoint & Google Slides
Business
3D Four Arrow Infographics Diagram Template for PowerPoint & Google Slides
Arrow
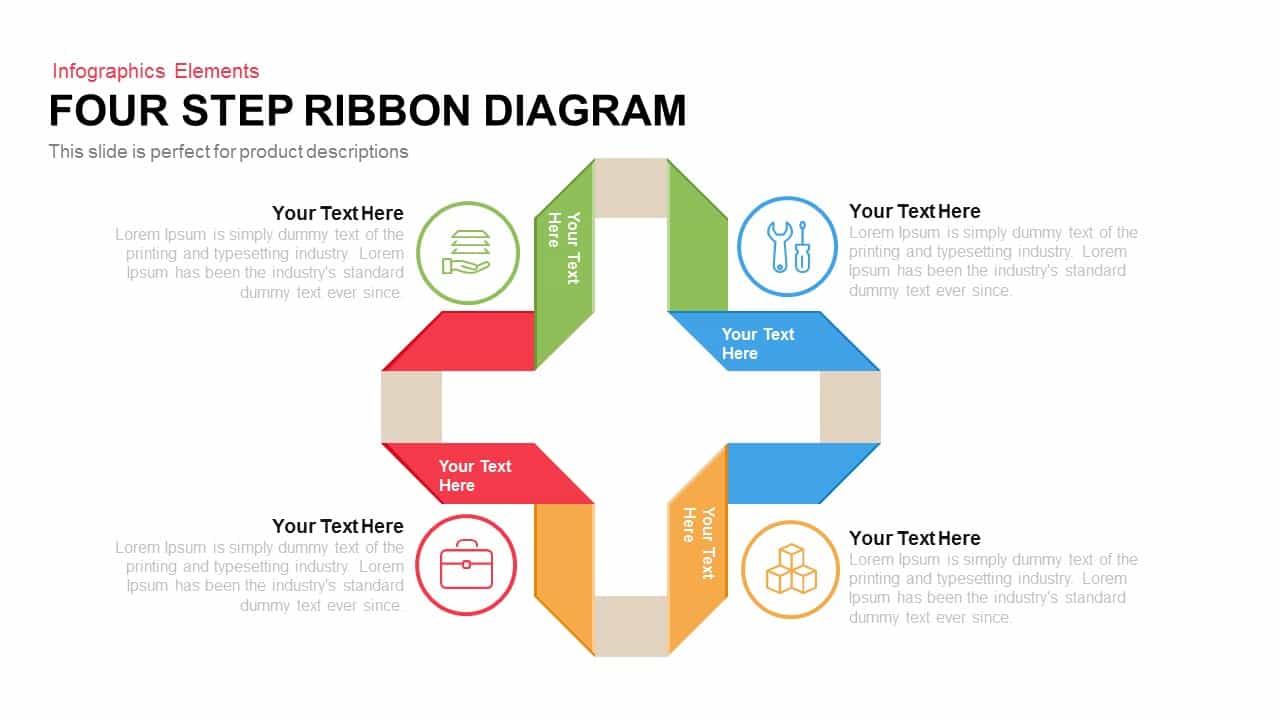
Four Step Ribbon Diagram Template for PowerPoint & Google Slides
Infographics
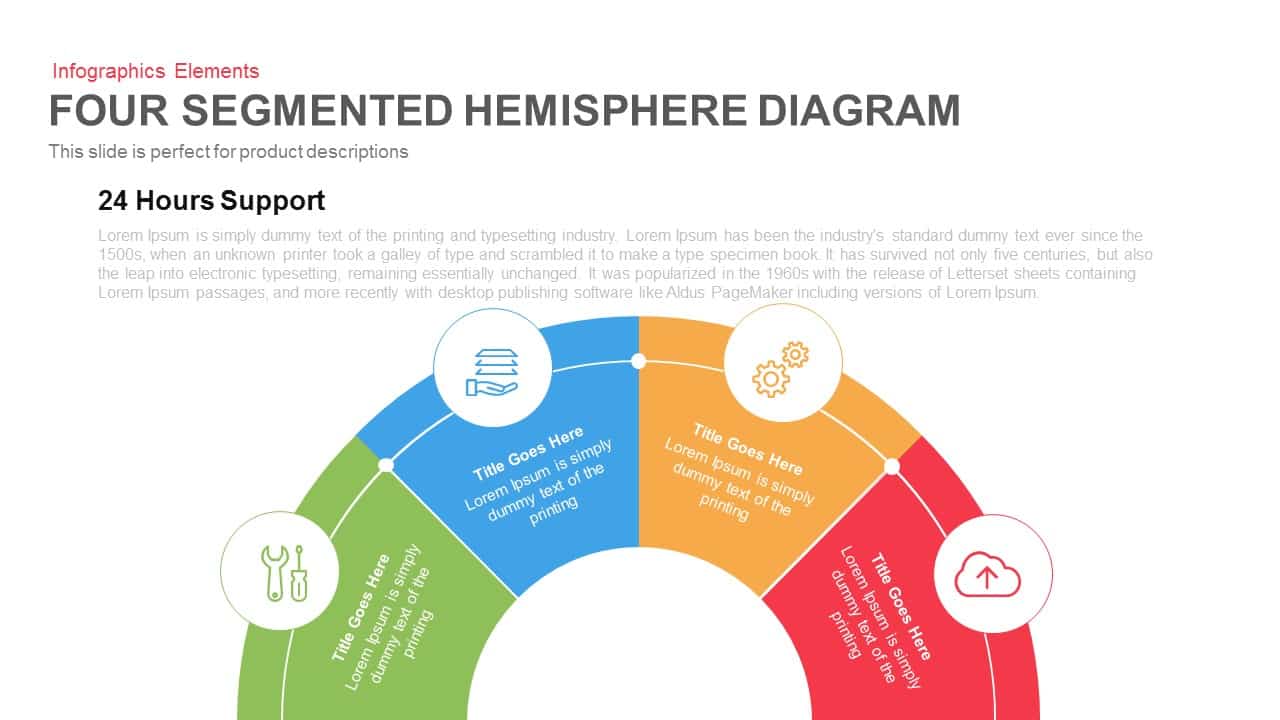
Four Segmented Hemisphere Diagram Template for PowerPoint & Google Slides
Process
Diamond Mind Map Diagram Four Branches Template for PowerPoint & Google Slides
Mind Maps
Four Section Comparison Chart Diagram Template for PowerPoint & Google Slides
Infographics
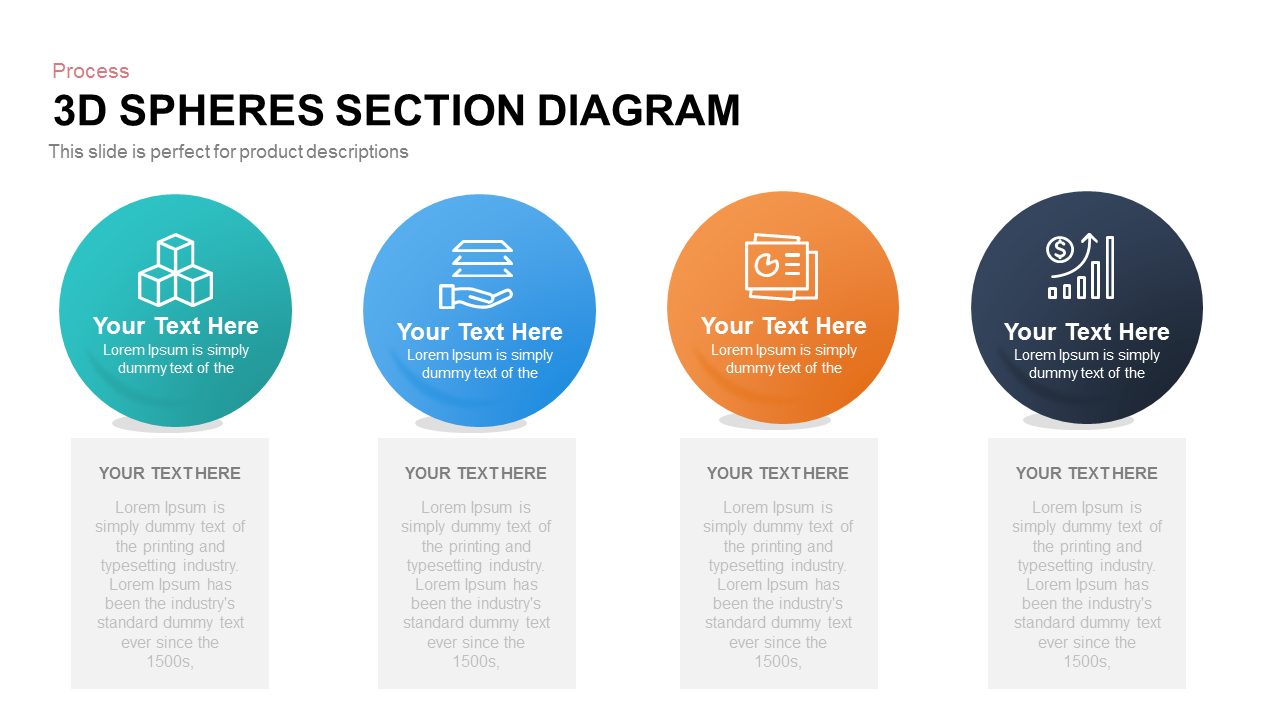
Four-Part 3D Spheres Section Diagram template for PowerPoint & Google Slides
Process
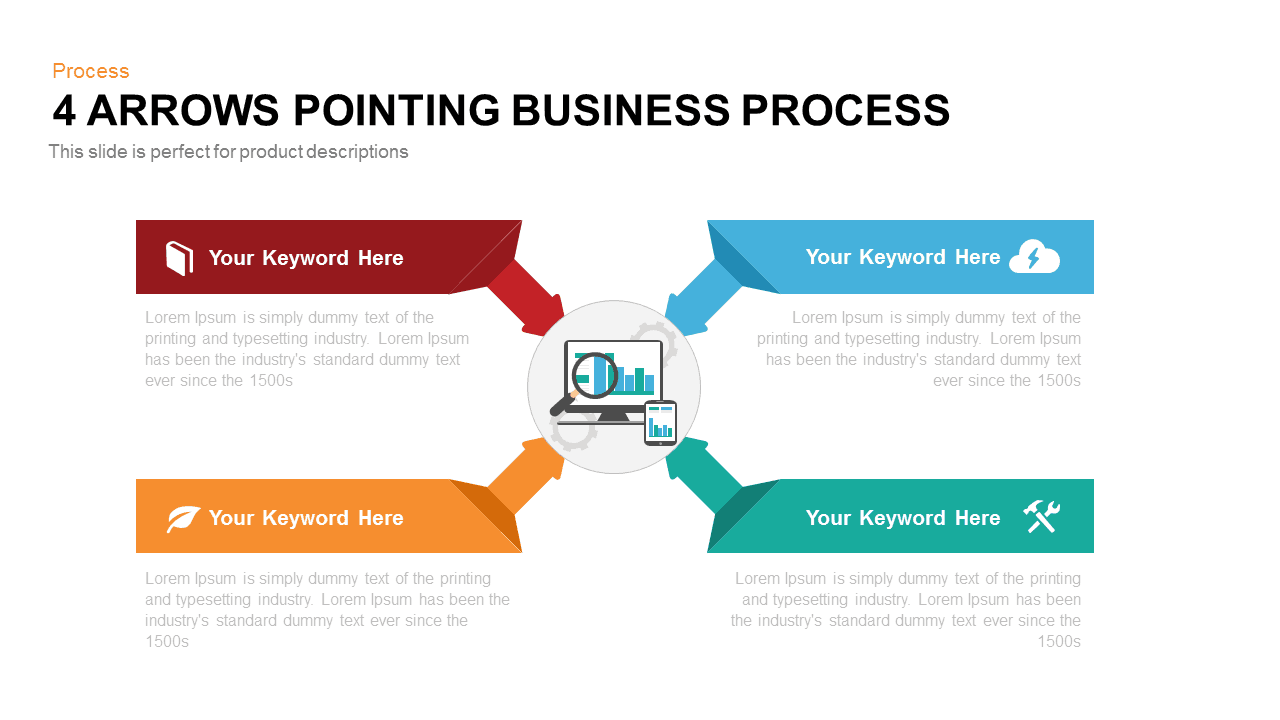
Four Arrows Business Process Diagram template for PowerPoint & Google Slides
Process
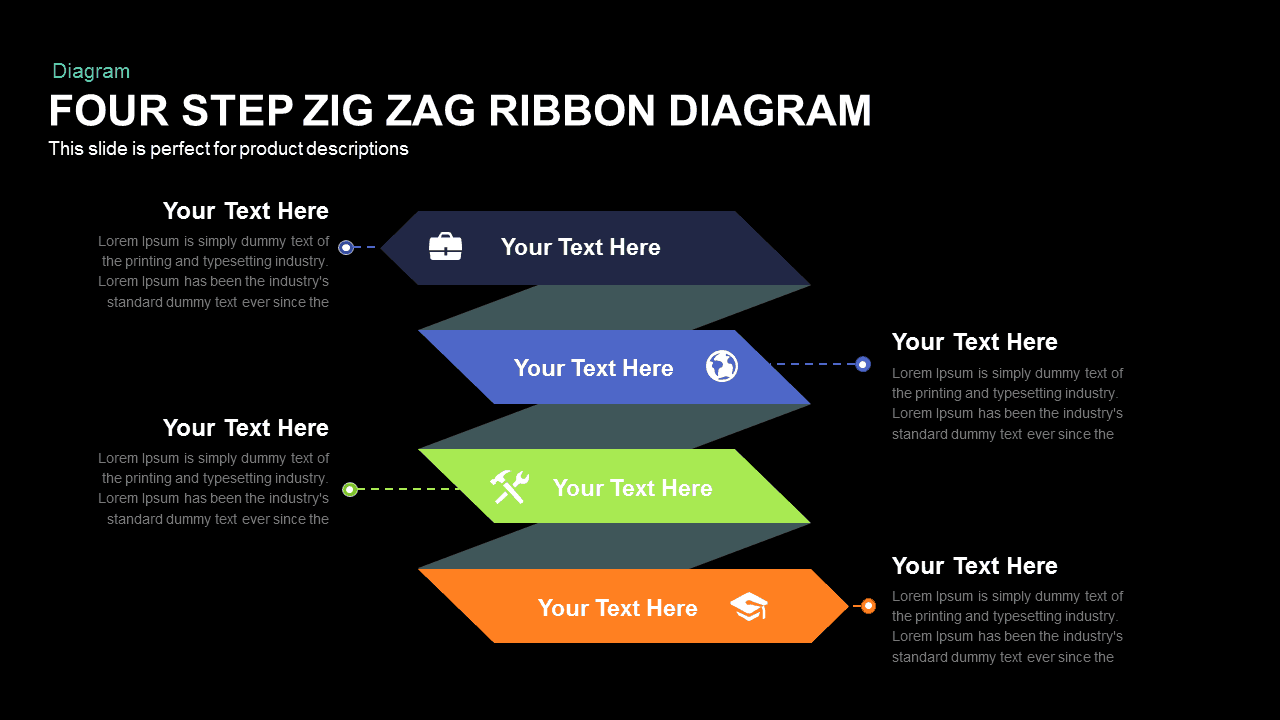
Four-Step Zigzag Ribbon Diagram template for PowerPoint & Google Slides
Arrow
Four-Step Business Staircase Diagram template for PowerPoint & Google Slides
Process

Four Gear Section Diagram Template for PowerPoint & Google Slides
Circular

Four-Circle Venn Process Diagram template for PowerPoint & Google Slides
Process
Four-Stage Business Circular Diagram Template for PowerPoint & Google Slides
Process
Pie Segment Diagram Four-Step Process Template for PowerPoint & Google Slides
Pie/Donut
Four Directional Arrow Diagram Template for PowerPoint & Google Slides
Arrow
Professional Four-Stage Funnel Diagram Template for PowerPoint & Google Slides
Funnel
Simple Four Connected Boxes Diagram Template for PowerPoint & Google Slides
Business Models
Four-Stage Linear Infographic Diagram Template for PowerPoint & Google Slides
Process
Four-Cross Text Box Diagram Template for PowerPoint & Google Slides
Comparison
Modern Four-Stage Petal Diagram Template for PowerPoint & Google Slides
Circular
Four and Five-Stage Funnel Diagram Template for PowerPoint & Google Slides
Funnel
Four-Way Directional Arrow Diagram Template for PowerPoint & Google Slides
Arrow
Clean Four-Section Review Diagram Template for PowerPoint & Google Slides
Agenda
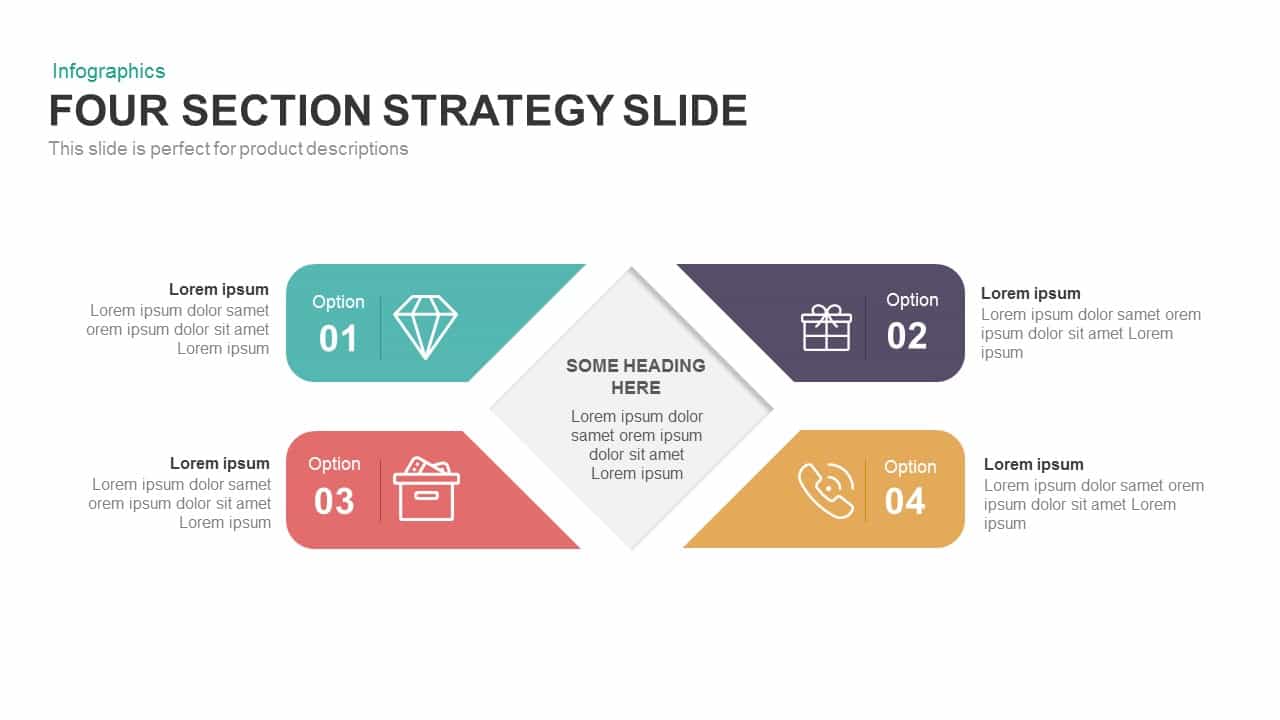
Four-Section Strategy Diagram Slide Template for PowerPoint & Google Slides
Business Strategy
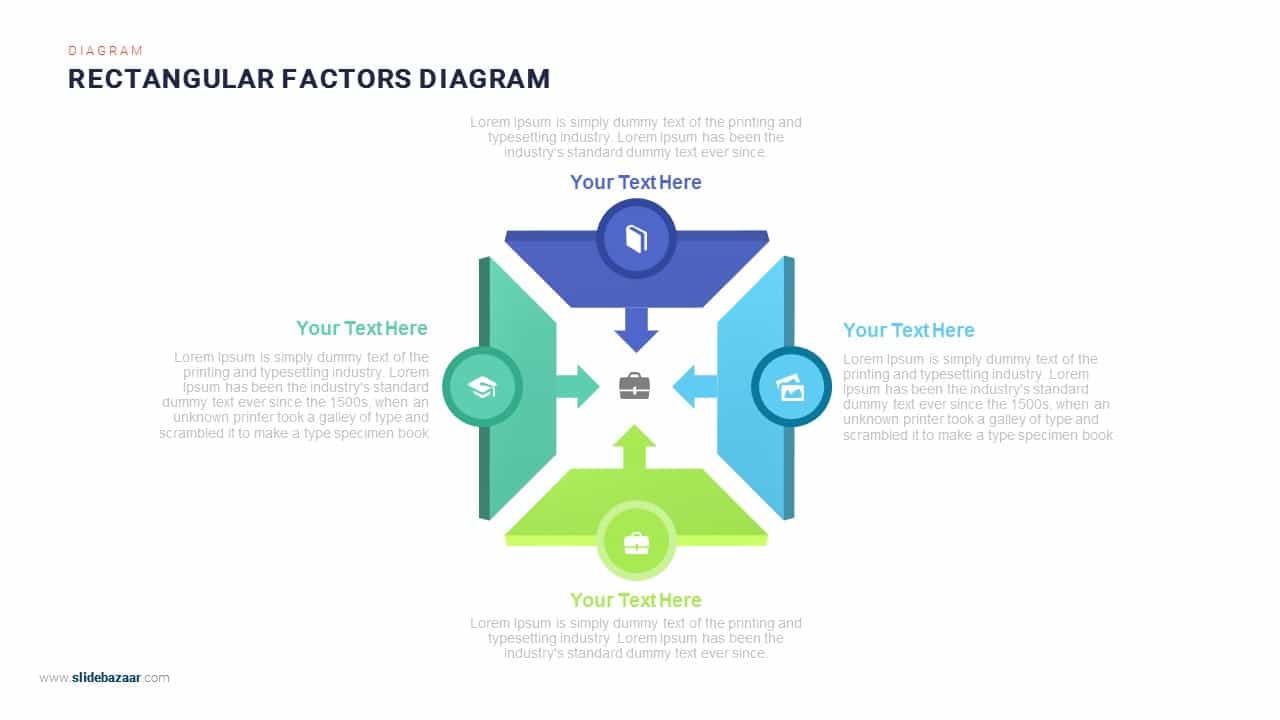
Four-Arrows Rectangular Factors Diagram Template for PowerPoint & Google Slides
Process
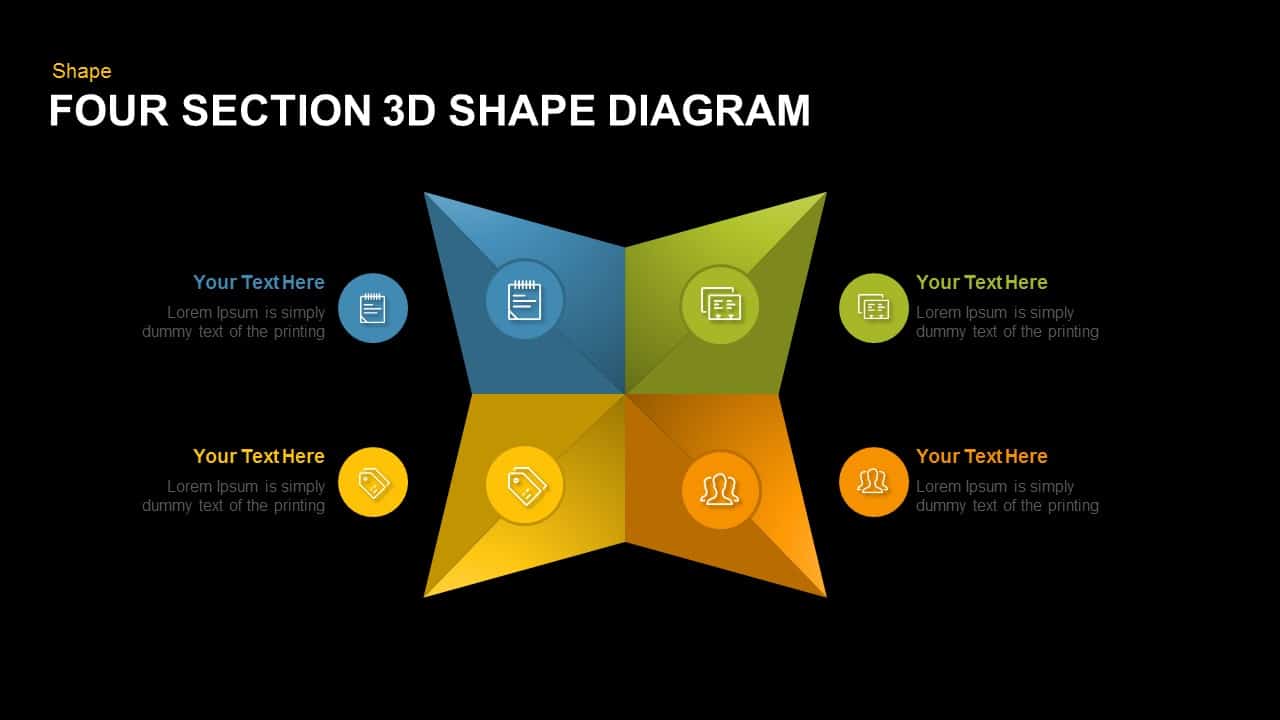
Editable Four-Section 3D Shape Diagram Template for PowerPoint & Google Slides
Comparison
Four-Circle Hub and Spoke Diagram Template for PowerPoint & Google Slides
Process

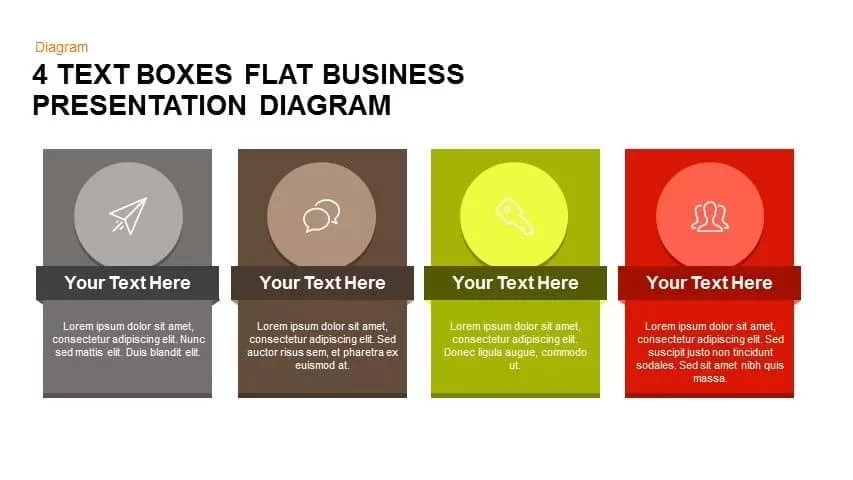
Flat Four-Box Business Layout Diagram Template for PowerPoint & Google Slides
Process
Four-Section Arrow Infographic Diagram Template for PowerPoint & Google Slides
Arrow
Four-Point Arrow Cycle Diagram Template for PowerPoint & Google Slides
Arrow

Four-Level Business Pyramid Diagram Template for PowerPoint & Google Slides
Pyramid
Four Section Circular Text Boxes Diagram Template for PowerPoint & Google Slides
Circular
Four-Staged Business Arrow Diagram Template for PowerPoint & Google Slides
Process
Four-Staged Puzzle Diagram Slide Template for PowerPoint & Google Slides
Process

Four-Plus Process Flow Diagram Template for PowerPoint & Google Slides
Process
Modern Four Stage Gear Diagram Template for PowerPoint & Google Slides
Process
Professional Four-Section Layer Diagram Template for PowerPoint & Google Slides
Process
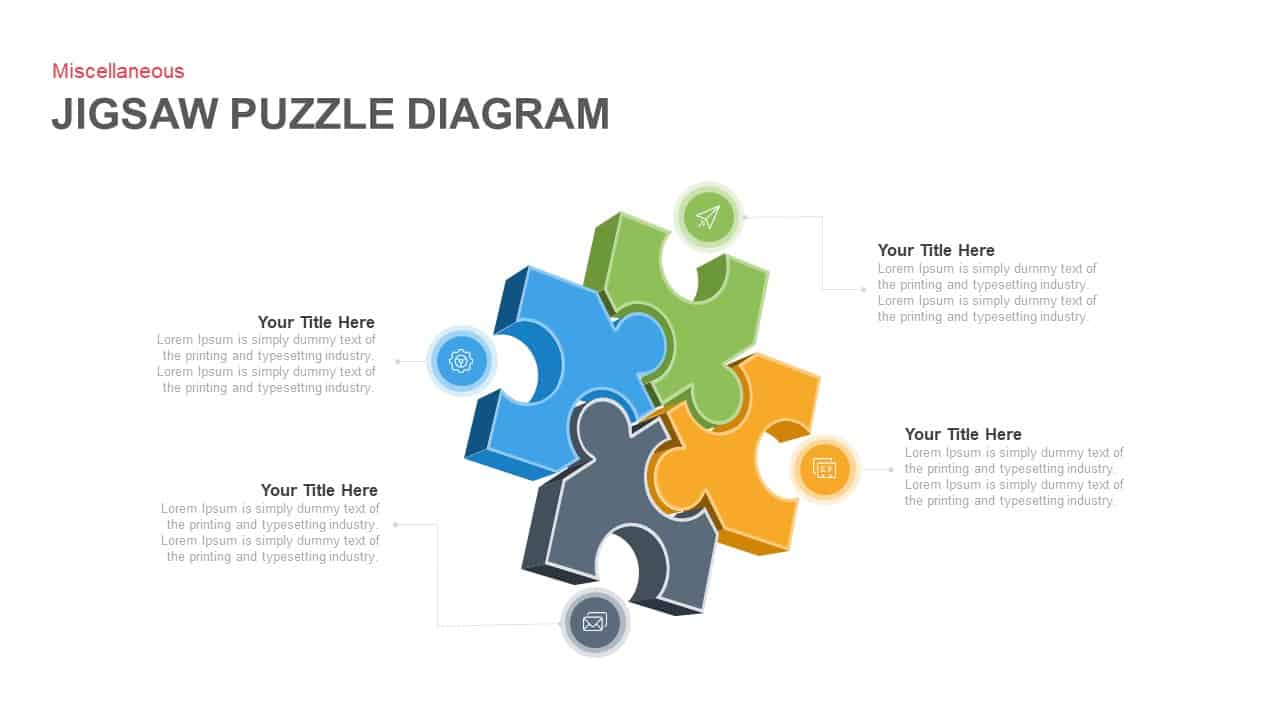
Four-Piece Jigsaw Puzzle Diagram Template for PowerPoint & Google Slides
Process
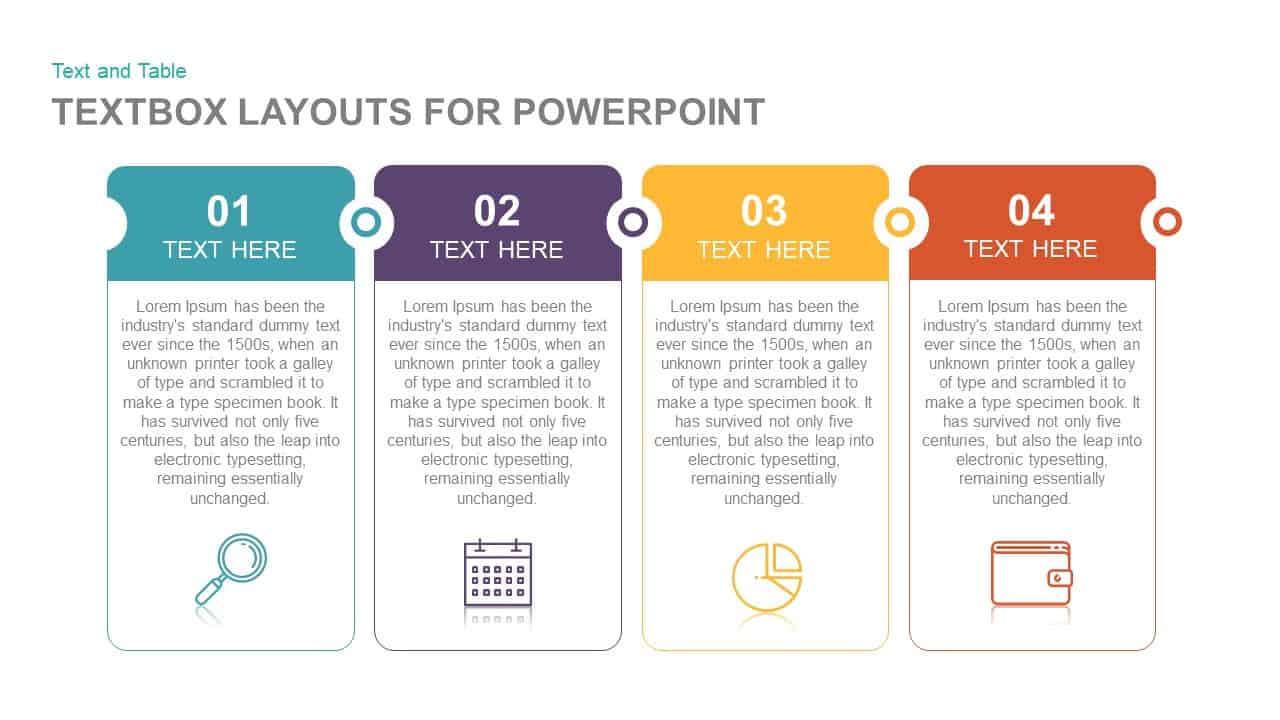
Four-Step Textbox Layout Diagram Template for PowerPoint & Google Slides
Business Report
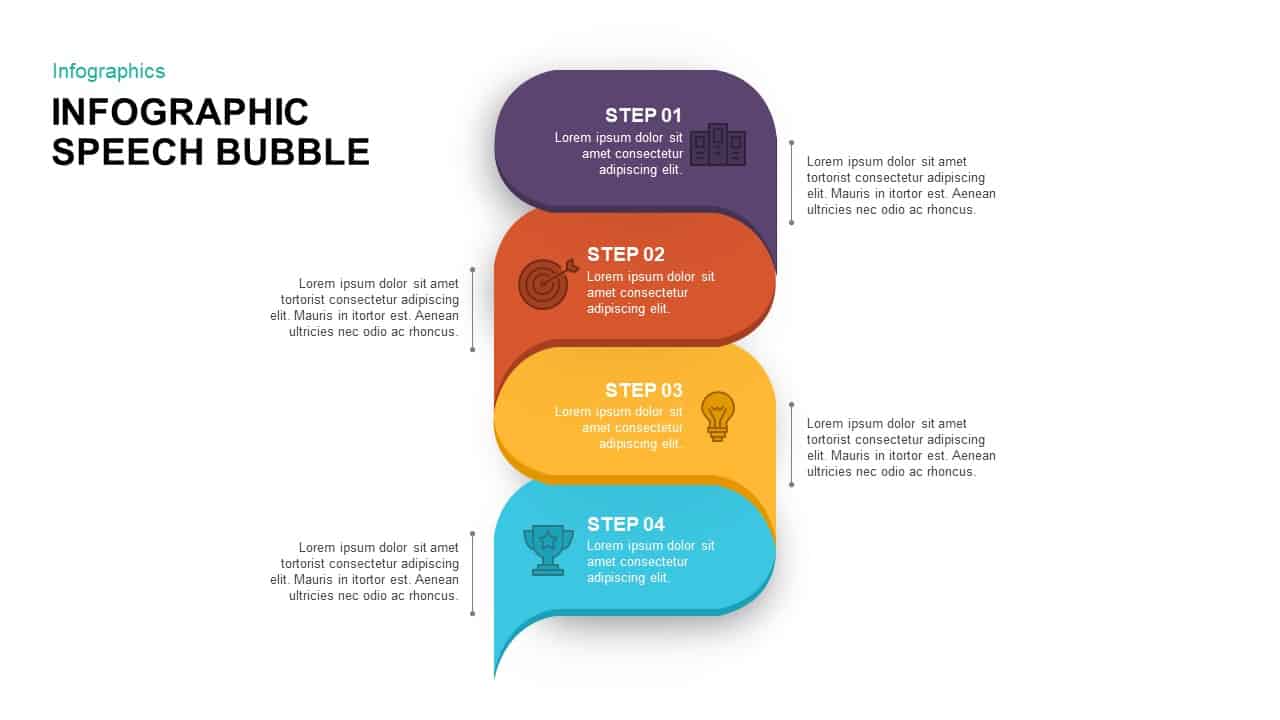
Four-Step Speech Bubble Diagram Template for PowerPoint & Google Slides
Process
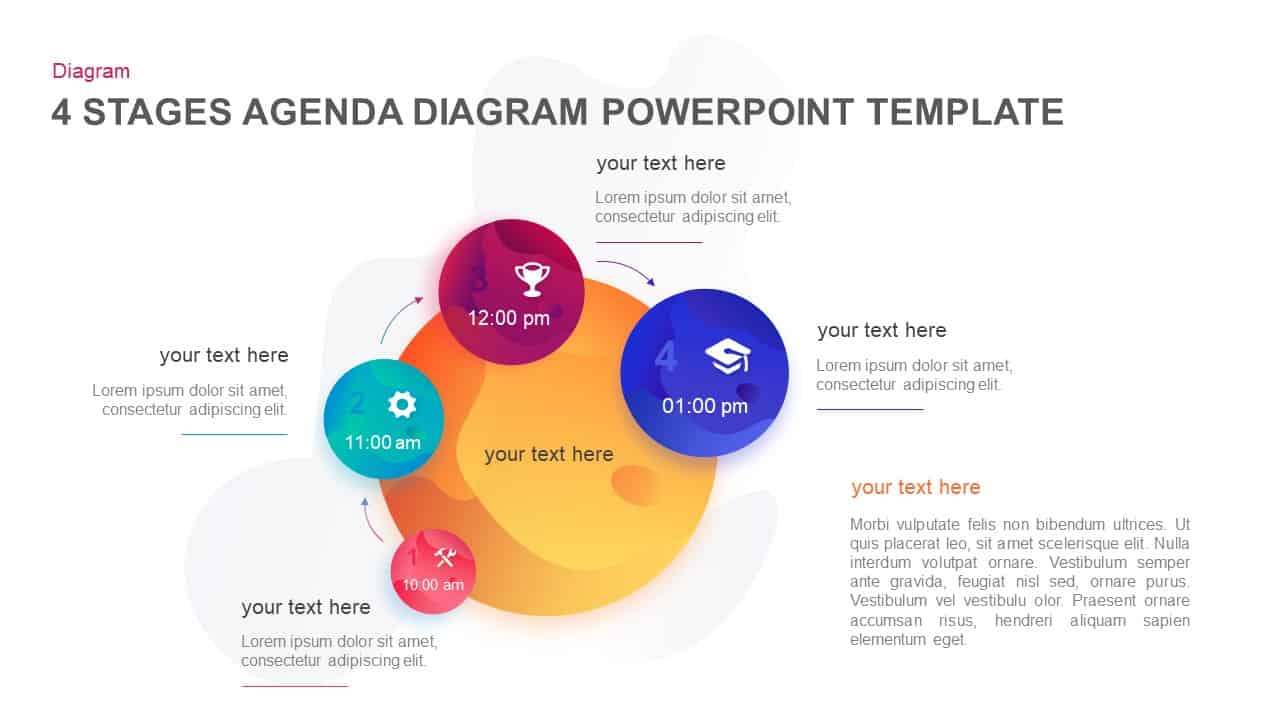
Four-Stage Agenda Circle Diagram Slide Template for PowerPoint & Google Slides
Agenda
Four-Stage Circular Diagram Infographic Template for PowerPoint & Google Slides
Circular
Four-Stage Gear Process Diagram Template for PowerPoint & Google Slides
Process
Four-Stage Cycle Process Diagram Template for PowerPoint & Google Slides
Process
Four-Quadrant SWOT Analysis Diagram Template for PowerPoint & Google Slides
SWOT
Concentric Four-Layer Core Diagram Template for PowerPoint & Google Slides
Circular
Four-Stage Linear Process Flow Diagram Template for PowerPoint & Google Slides
Process
Four-Stage Circular Flow Diagram Template for PowerPoint & Google Slides
Circular
Hand-Held Four-Step Process Diagram Template for PowerPoint & Google Slides
Process
Four-Stage Start-Up Plan Arc Diagram Template for PowerPoint & Google Slides
Process
Four-Stage Funnel Diagram Infographic Template for PowerPoint & Google Slides
Funnel
Four-Step Spiral Funnel Diagram Template for PowerPoint & Google Slides
Funnel
Four-Part SWOT Analysis Diagram Template for PowerPoint & Google Slides
SWOT
Four-Step Puzzle Diagram Infographic Template for PowerPoint & Google Slides
Process
Four-Stage Funnel Diagram Infographic Template for PowerPoint & Google Slides
Funnel
Four Section Diagram Infographics template for PowerPoint & Google Slides
Process
Four Business Structure Types Comparison Diagram Template for PowerPoint & Google Slides
Business Strategy
Four Section Infographic Diagram Template for PowerPoint & Google Slides
Circular
Four-Option Cross Infographic Diagram Template for PowerPoint & Google Slides
Comparison
Four-Item Circular Diagram Concept Template for PowerPoint & Google Slides
Circular
Gradient Four-Step Roadmap Diagram Template for PowerPoint & Google Slides
Roadmap
Four-Step Objective Goal Diagram Template for PowerPoint & Google Slides
Goals
Elegant PDCA Four-Step Process Diagram Template for PowerPoint & Google Slides
Process
Four-Arrow Curved Hub-and-Spoke Diagram Template for PowerPoint & Google Slides
Arrow
Hand-Drawn Four-Step Curved Arrow Diagram Template for PowerPoint & Google Slides
Arrow
Four-Step Curved Arrow Diagram Template for PowerPoint & Google Slides
Arrow
Four-Point Hub and Spoke Diagram Template for PowerPoint & Google Slides
Business Strategy
Four-Step Arrow Reference Diagram Slide Template for PowerPoint & Google Slides
Arrow
3D Four-Stage Pyramid Diagram Template for PowerPoint & Google Slides
Pyramid
Four-Level Colorful Pyramid Diagram Template for PowerPoint & Google Slides
Pyramid
Modern Four-Level Pyramid Diagram Template for PowerPoint & Google Slides
Pyramid
Free Journey Slide with Four Icons Diagram Template for PowerPoint & Google Slides
Process
Free
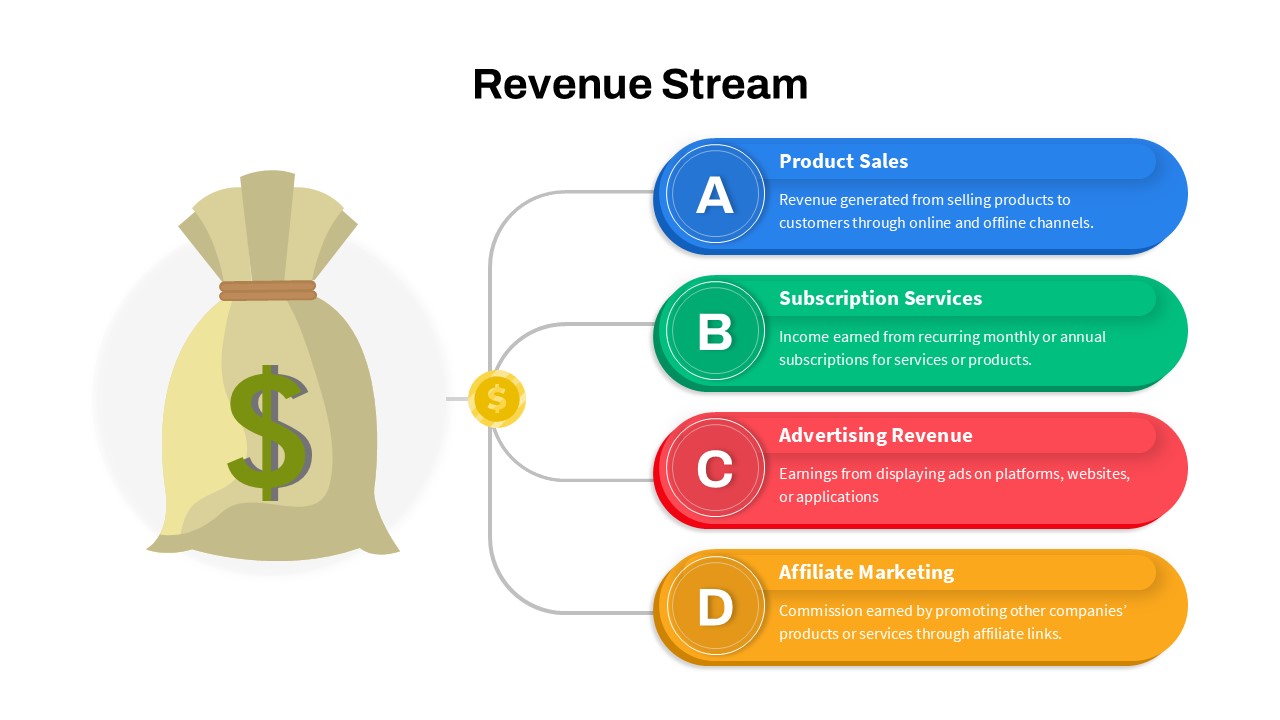
Revenue Streams: Four Channels Diagram Template for PowerPoint & Google Slides
Business Models
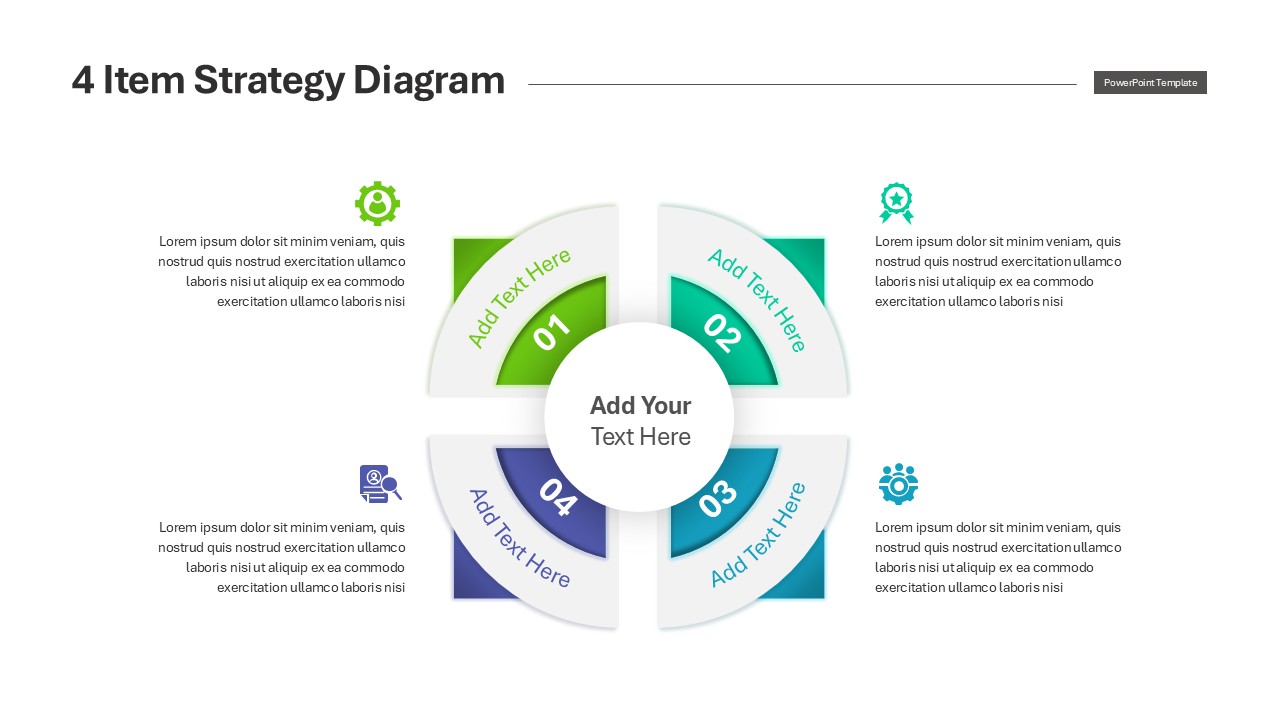
Engaging Four-Option Strategy Diagram Template for PowerPoint & Google Slides
Business Strategy
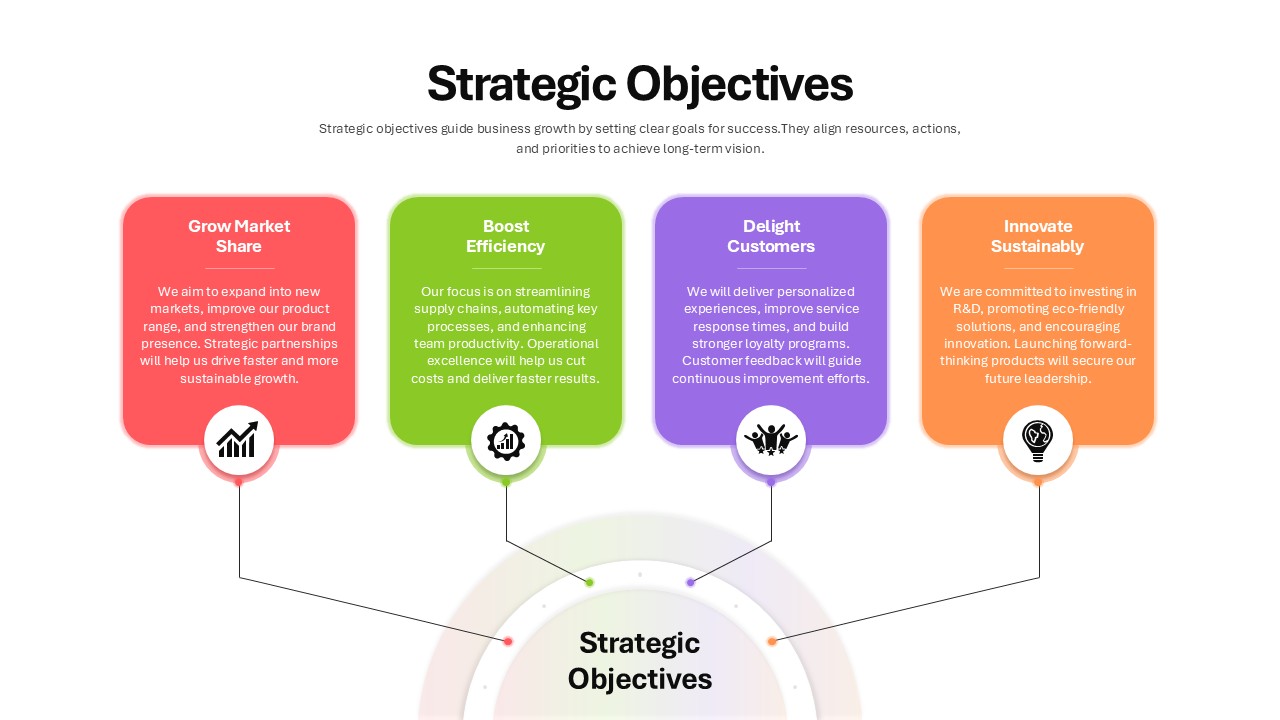
Four Strategic Objectives Radial Diagram Template for PowerPoint & Google Slides
Business Strategy
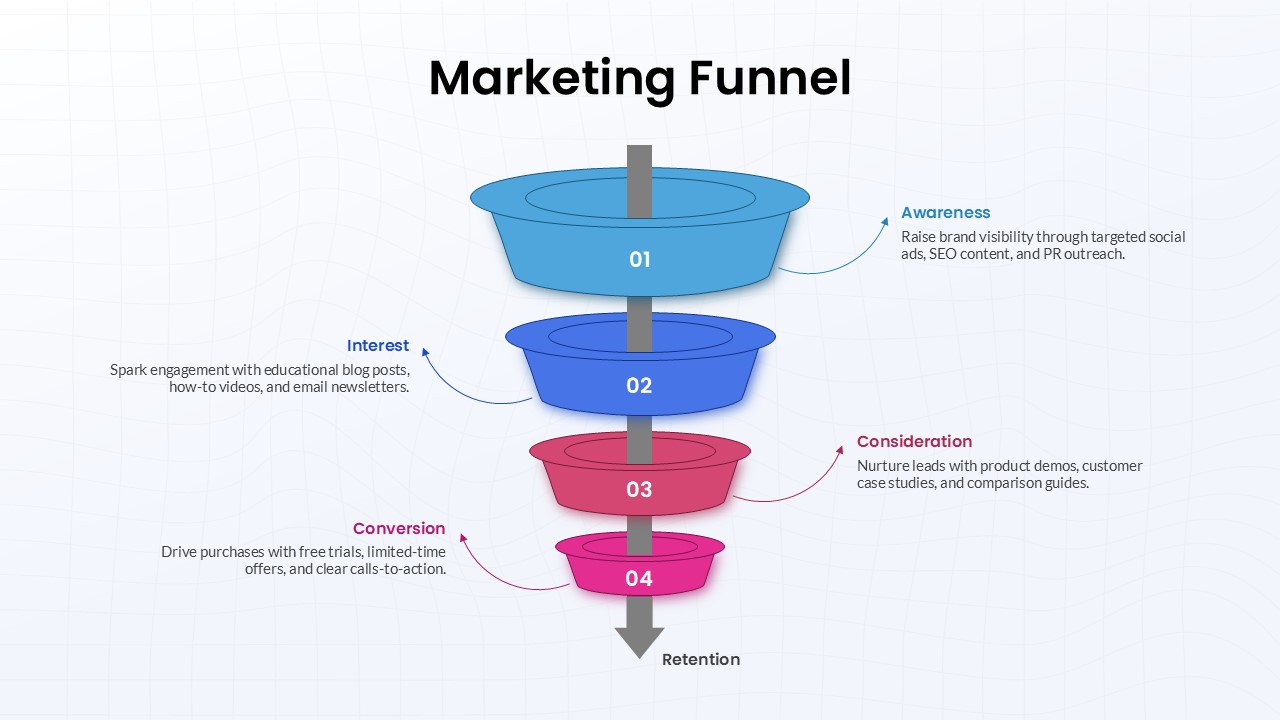
Four-Stage Marketing Funnel Diagram Template for PowerPoint & Google Slides
Marketing Funnel
Four-Level Colorful Pyramid Diagram Template for PowerPoint & Google Slides
Pyramid
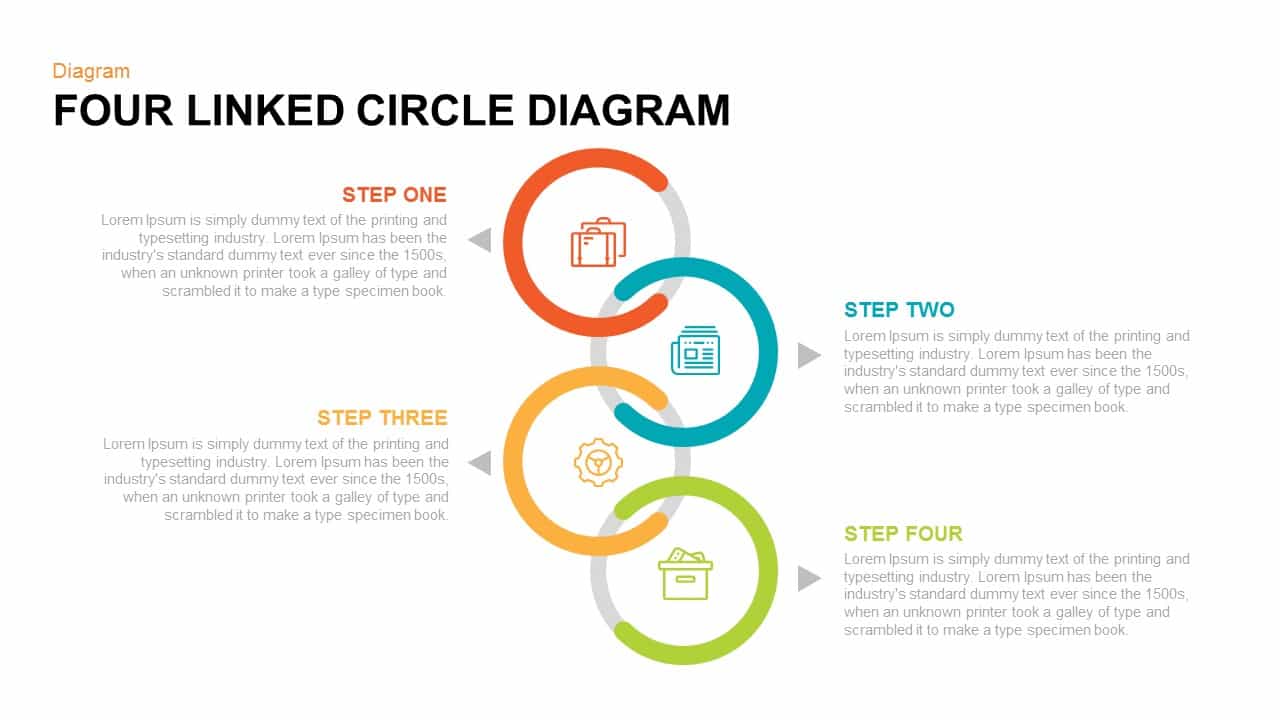
Four Linked Circle Diagram for PowerPoint & Google Slides
Process

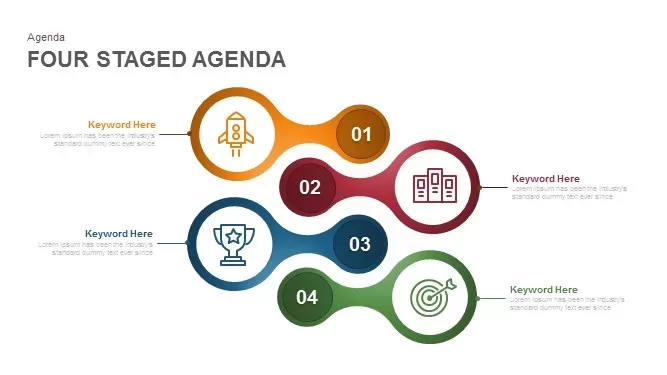
Four Staged Agenda Diagram for PowerPoint & Google Slides
Agenda
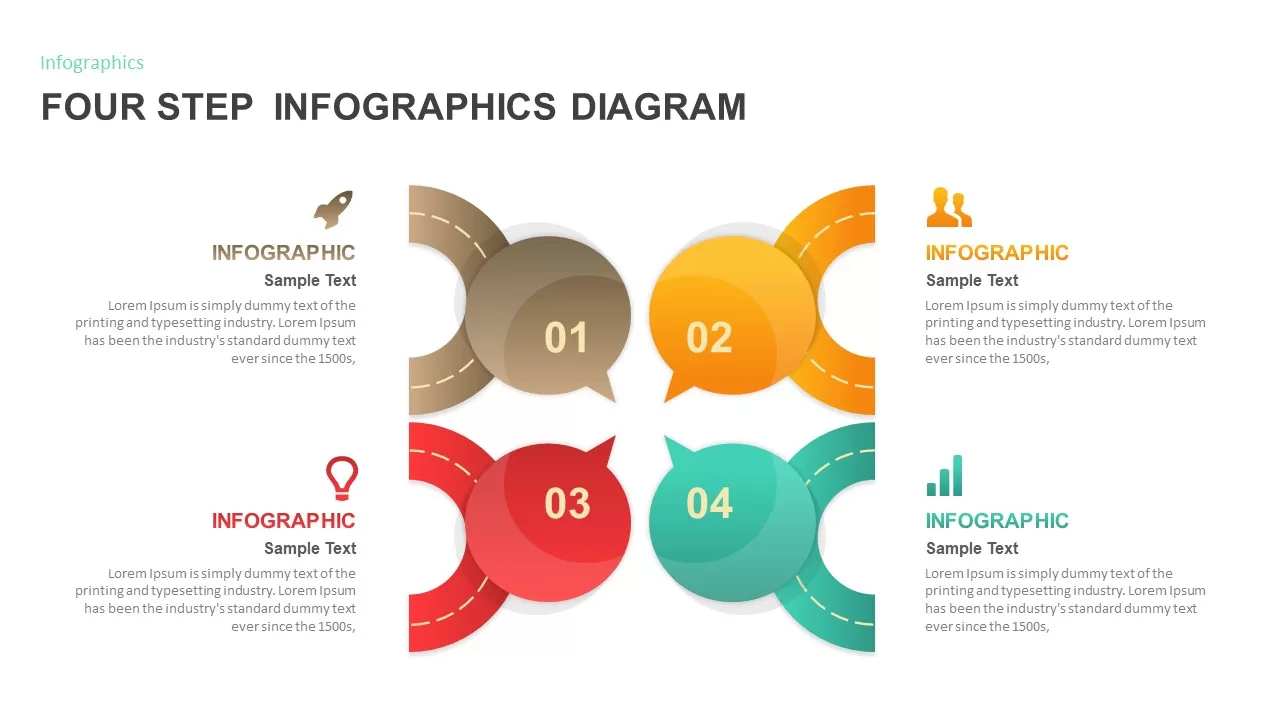
Four Step Infographics Diagram for PowerPoint & Google Slides
Process
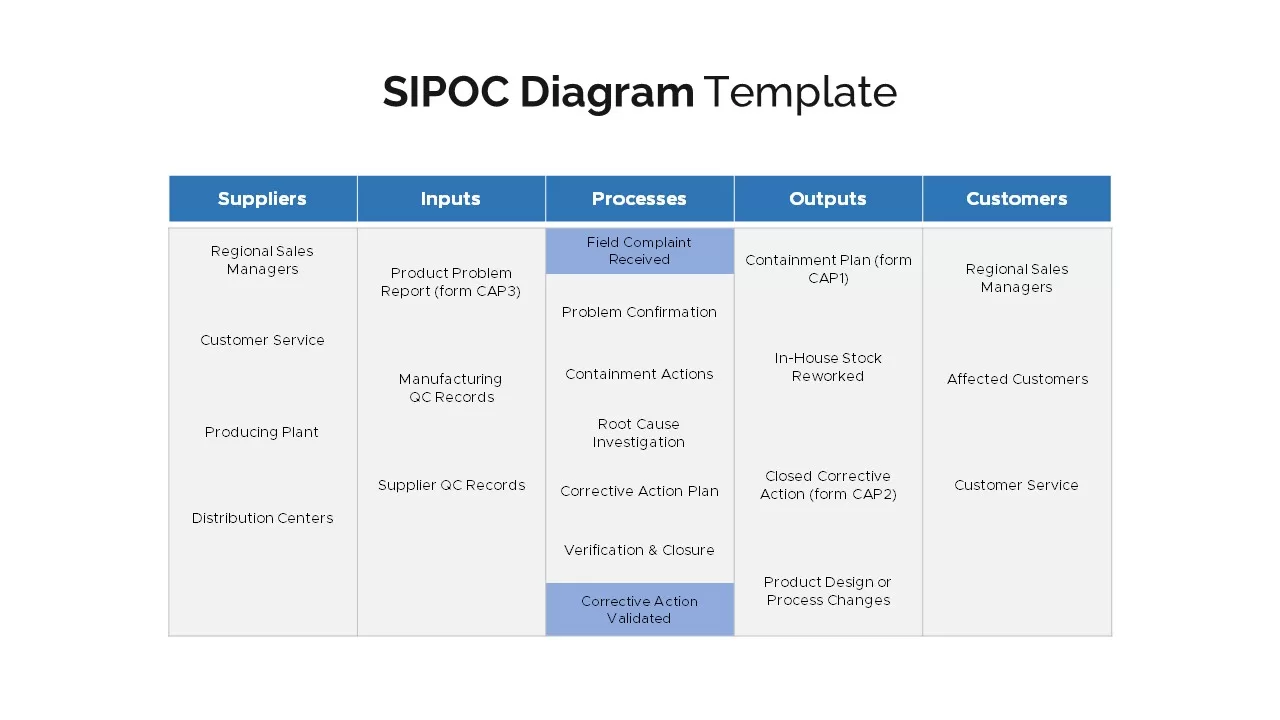
Four SIPOC Diagram Infographic Templates for PowerPoint & Google Slides
Business Plan
Four Options Infographic Slides Template for PowerPoint & Google Slides
Comparison
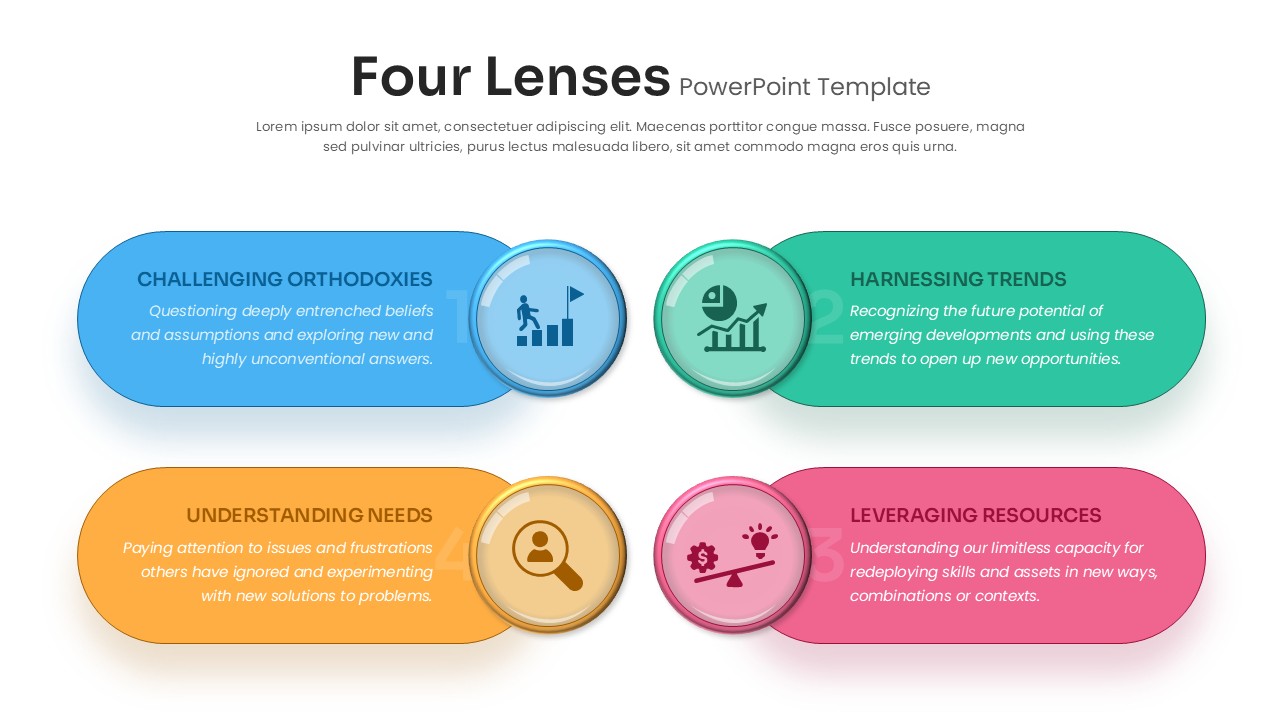
Four Lenses PowerPoint Template for PowerPoint & Google Slides
Competitor Analysis