Four Directional Arrow Diagram Template for PowerPoint & Google Slides
Description
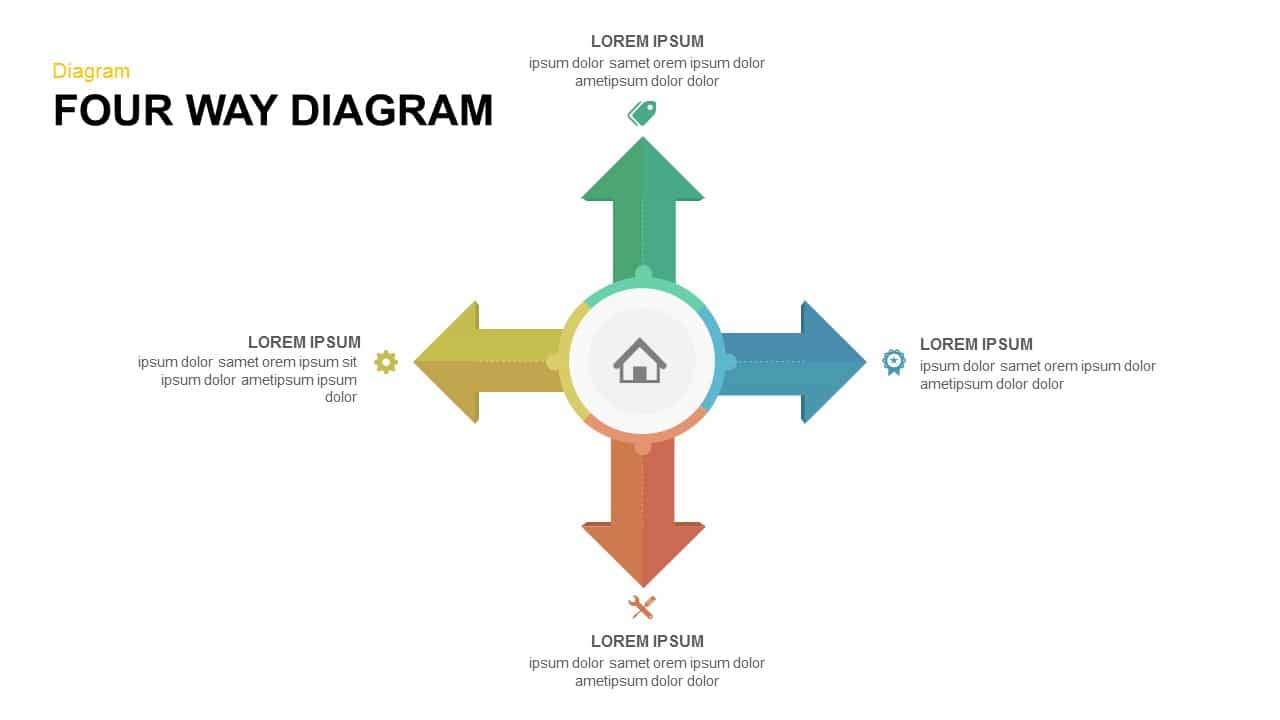
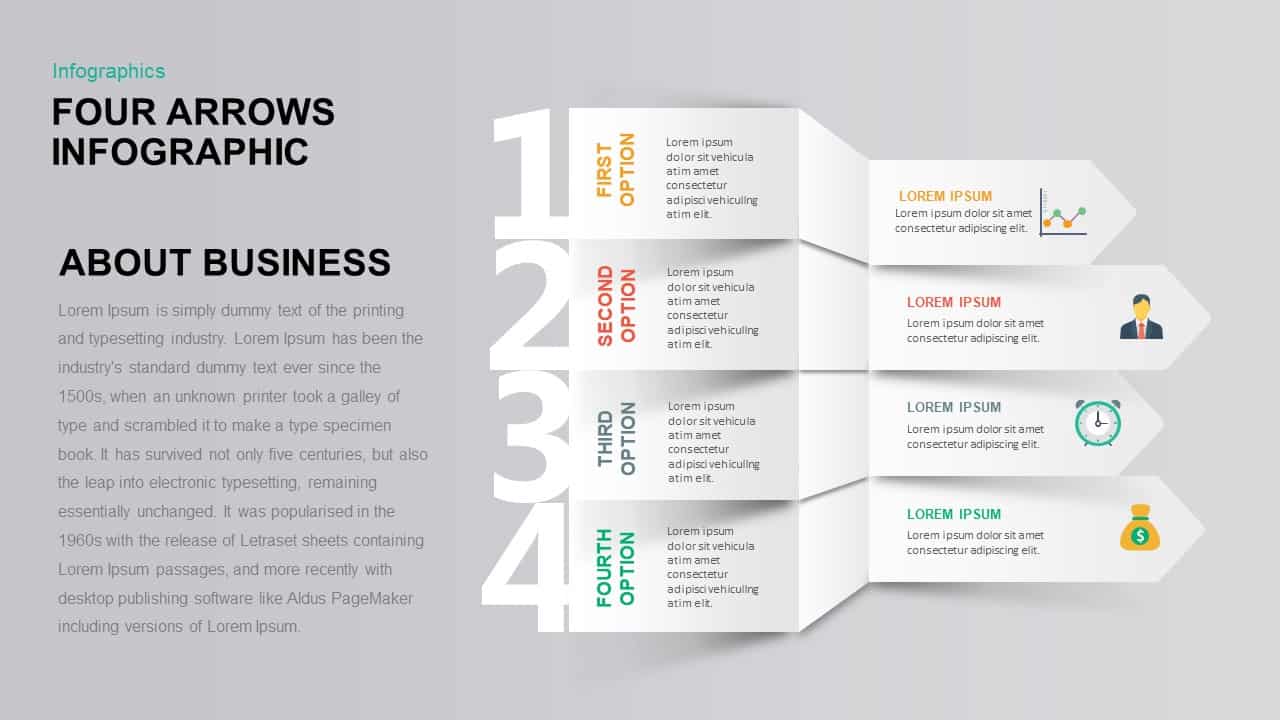
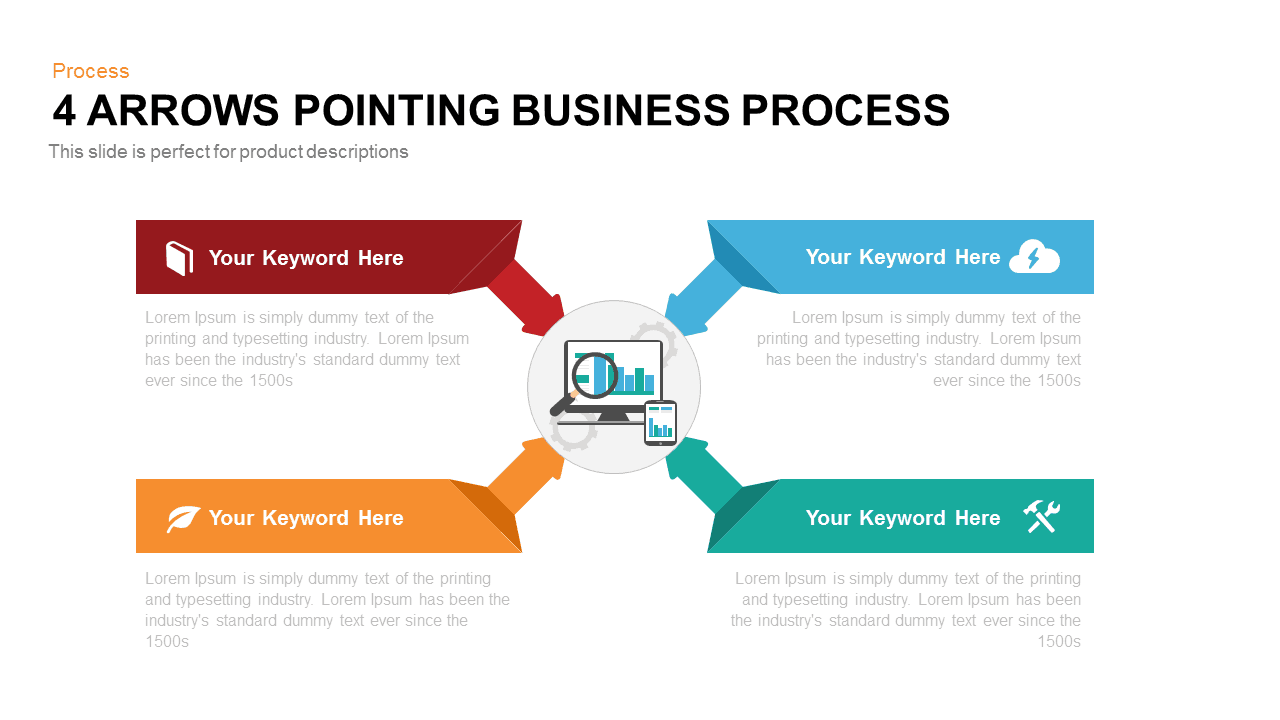
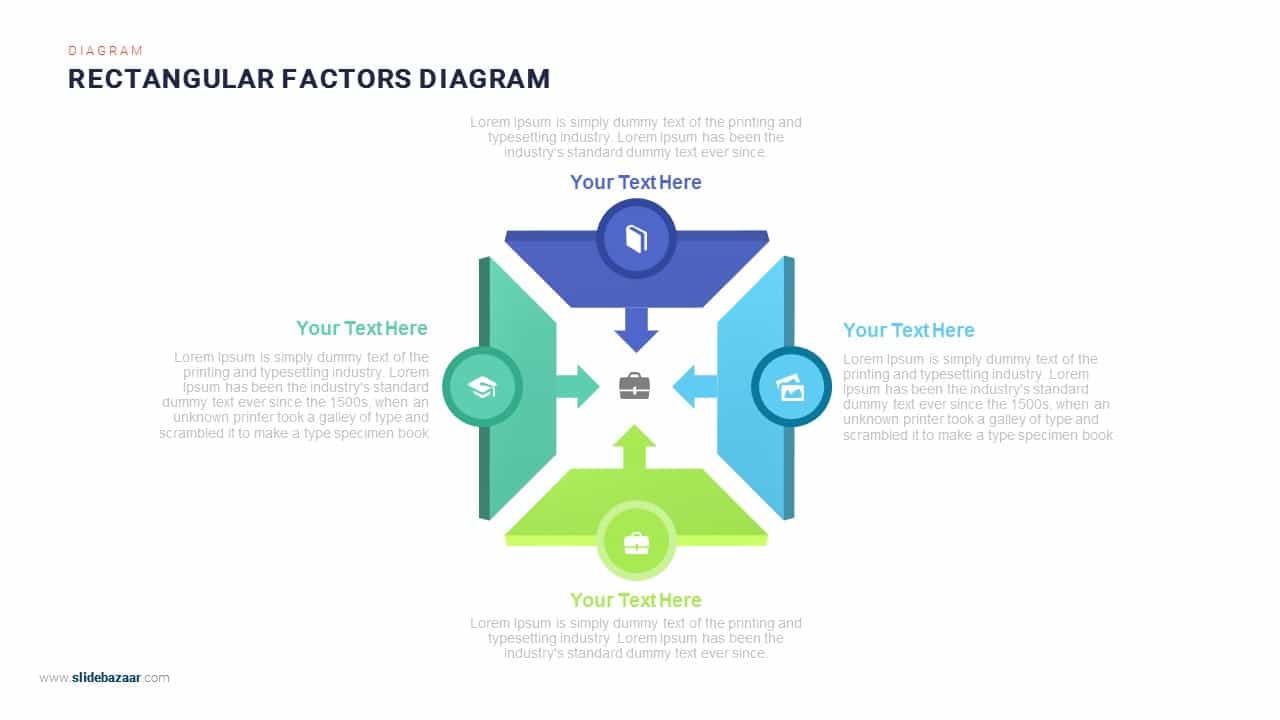
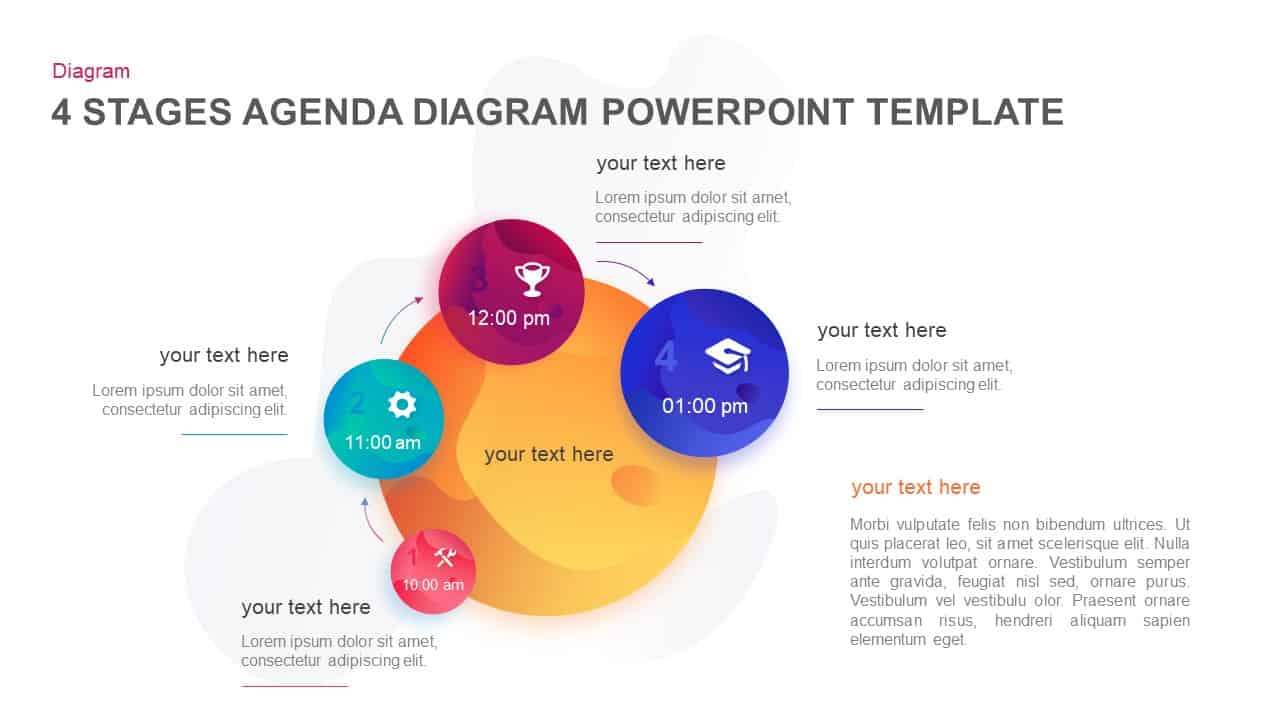
This slide presents a striking four-directional arrow diagram ideal for mapping cyclical processes and quadrant-based comparisons with precision. Four colored arrows—green, gold, gray, and red—interlock around a central icon cluster, guiding the viewer’s eye through each numbered step. Each arrow segment contains a clear text placeholder, while matching circular callouts on the slide perimeter allow for concise keyword descriptions and supporting details. The clean white background, flat design, and generous white space ensure your data remains front and center, and editable master layouts let you adjust colors, icons, and labels in seconds.
Designed for effortless customization, every shape is fully editable: swap icons, change arrow directions, or update text boxes to suit your narrative. The central icon grouping—featuring an hourglass, stopwatch, and currency symbols—provides a thematic anchor, but can be replaced to match any business, finance, or project-management context.
Whether you need to showcase a four-phase strategy, illustrate continuous improvement loops, or compare parallel workflows, this dynamic infographic ensures your audience stays engaged and informed.
Who is it for
Project managers, business analysts, marketing strategists, and operations leaders will value this diagram for presenting four-stage roadmaps, process lifecycles, or SWOT-style comparisons. Consultants and C-suite executives can leverage the directional arrows to highlight strategic pivots, performance metrics, or project milestones in boardroom decks.
Other Uses
Beyond process mapping, repurpose this layout to depict customer journey stages, risk-reward analyses, supply chain flows, or feature prioritization matrices. Duplicate and recolor arrow segments to build multi-step timelines, decision-making frameworks, or KPI dashboards, making this slide a versatile asset across industries and use cases.
Login to download this file

Item ID
SB00458
Related Templates

Four-Way Directional Arrow Diagram Template for PowerPoint & Google Slides
Arrow
3D Four-Directional Arrow Infographics Template for PowerPoint & Google Slides
Arrow
Different Directional Arrow Infographic Template for PowerPoint & Google Slides
Arrow
3D Arrow Directional template for PowerPoint & Google Slides
Arrow

Two Directional Arrow Infographic Template for PowerPoint & Google Slides
Arrow
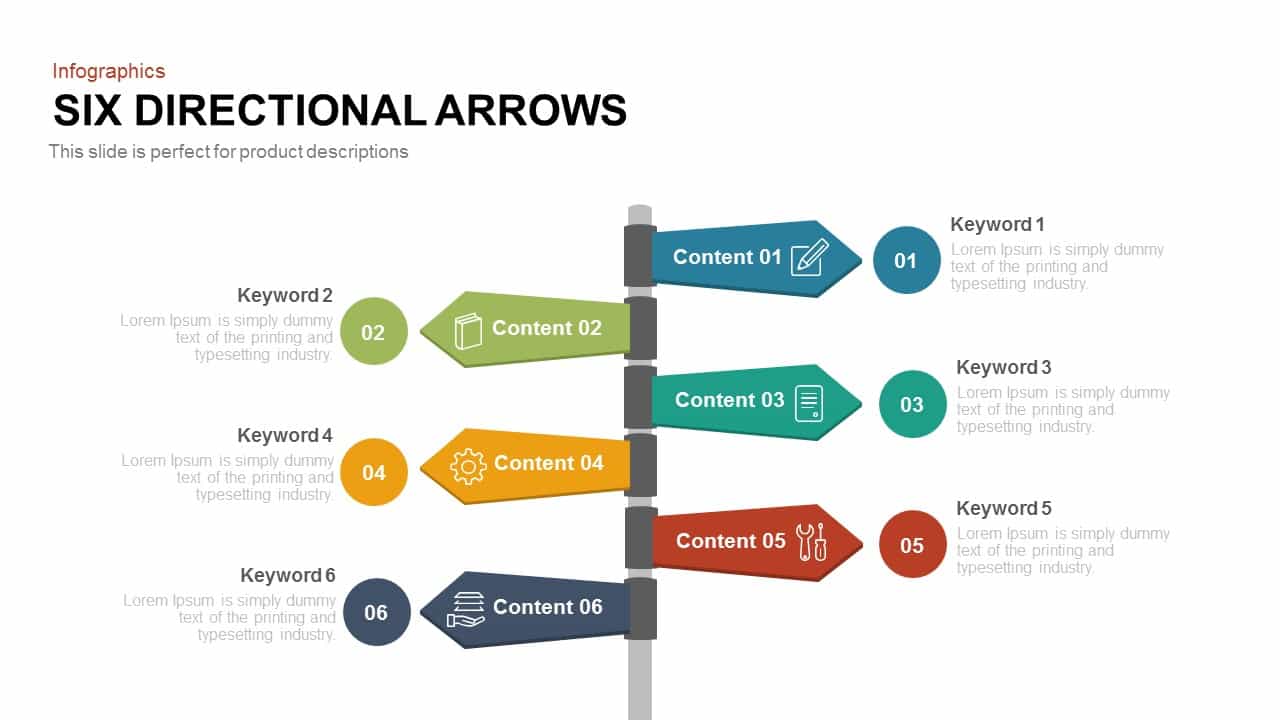
Six Directional Arrows Infographic Template for PowerPoint & Google Slides
Arrow
3D Four Arrow Infographics Diagram Template for PowerPoint & Google Slides
Arrow
Four-Section Arrow Infographic Diagram Template for PowerPoint & Google Slides
Arrow
Four-Point Arrow Cycle Diagram Template for PowerPoint & Google Slides
Arrow

Four-Staged Business Arrow Diagram Template for PowerPoint & Google Slides
Process
Four-Arrow Curved Hub-and-Spoke Diagram Template for PowerPoint & Google Slides
Arrow
Hand-Drawn Four-Step Curved Arrow Diagram Template for PowerPoint & Google Slides
Arrow
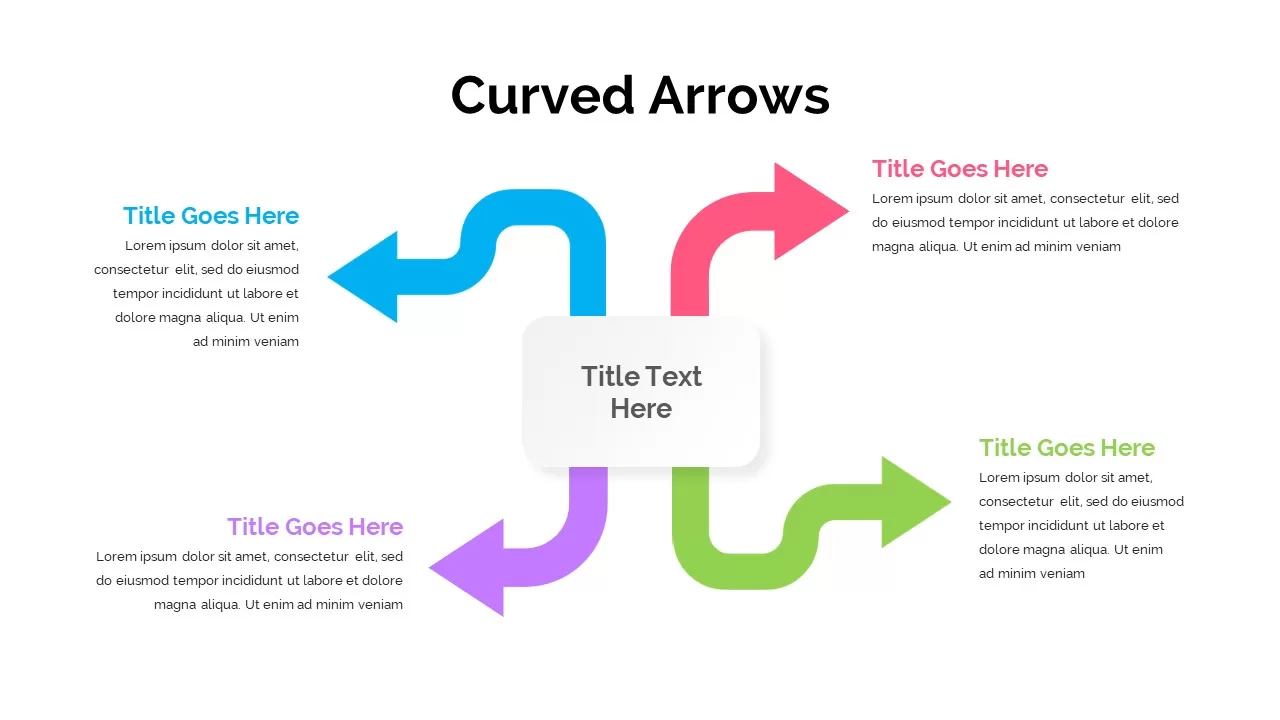
Four-Step Curved Arrow Diagram Template for PowerPoint & Google Slides
Arrow
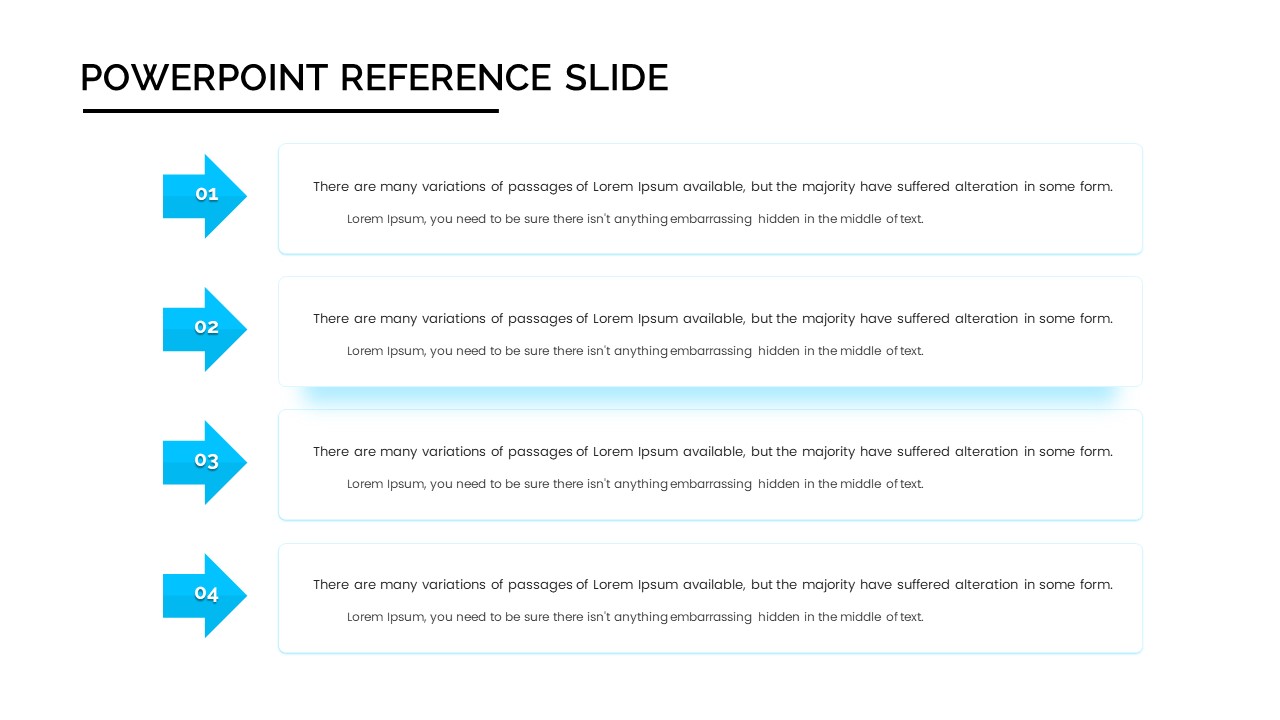
Four-Step Arrow Reference Diagram Slide Template for PowerPoint & Google Slides
Arrow
Four Arrow Square Infographics Template for PowerPoint & Google Slides
Arrow
Four Swoosh Arrow Infographics template for PowerPoint & Google Slides
Arrow
Four-Step Arrow Process Infographic Template for PowerPoint & Google Slides
Arrow
Four-Option 4-Step Arrow Infographic Template for PowerPoint & Google Slides
Arrow
Four-Step Curved Arrow Process Template for PowerPoint & Google Slides
Process
Four-Segment Circular Arrow Cycle Template for PowerPoint & Google Slides
Circular
Four-Stage Circle Arrow Infographic Template for PowerPoint & Google Slides
Circular
Four-Stage Circle Arrow Infographic Template for PowerPoint & Google Slides
Circular
Four Step Ribbon Diagram Template for PowerPoint & Google Slides
Infographics
Four Segmented Hemisphere Diagram Template for PowerPoint & Google Slides
Process
Diamond Mind Map Diagram Four Branches Template for PowerPoint & Google Slides
Mind Maps
Four Section Comparison Chart Diagram Template for PowerPoint & Google Slides
Infographics
Four-Part 3D Spheres Section Diagram template for PowerPoint & Google Slides
Process
Four Arrows Business Process Diagram template for PowerPoint & Google Slides
Process
Four-Step Zigzag Ribbon Diagram template for PowerPoint & Google Slides
Arrow
Four-Step Business Staircase Diagram template for PowerPoint & Google Slides
Process

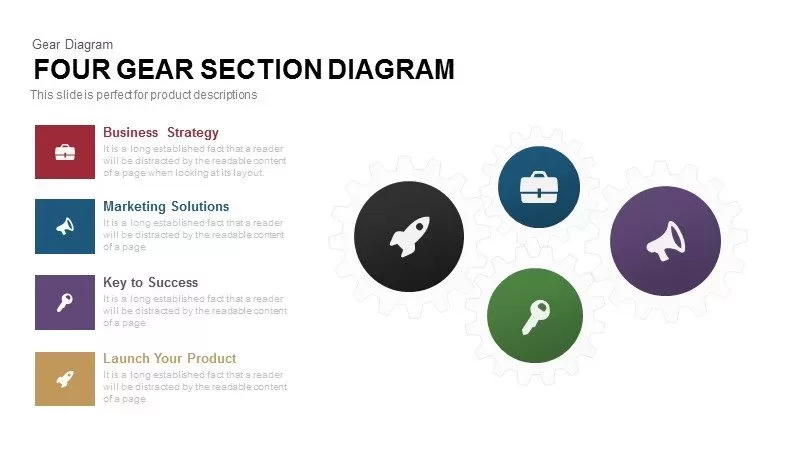
Four Gear Section Diagram Template for PowerPoint & Google Slides
Circular
Four-Circle Venn Process Diagram template for PowerPoint & Google Slides
Process
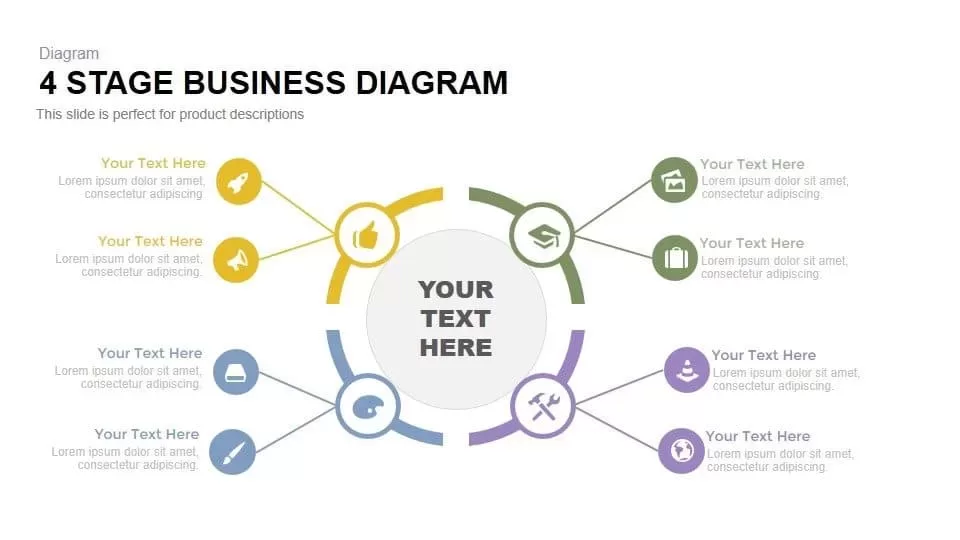
Four-Stage Business Circular Diagram Template for PowerPoint & Google Slides
Process
Pie Segment Diagram Four-Step Process Template for PowerPoint & Google Slides
Pie/Donut
Professional Four-Stage Funnel Diagram Template for PowerPoint & Google Slides
Funnel
Simple Four Connected Boxes Diagram Template for PowerPoint & Google Slides
Business Models
Four-Stage Linear Infographic Diagram Template for PowerPoint & Google Slides
Process
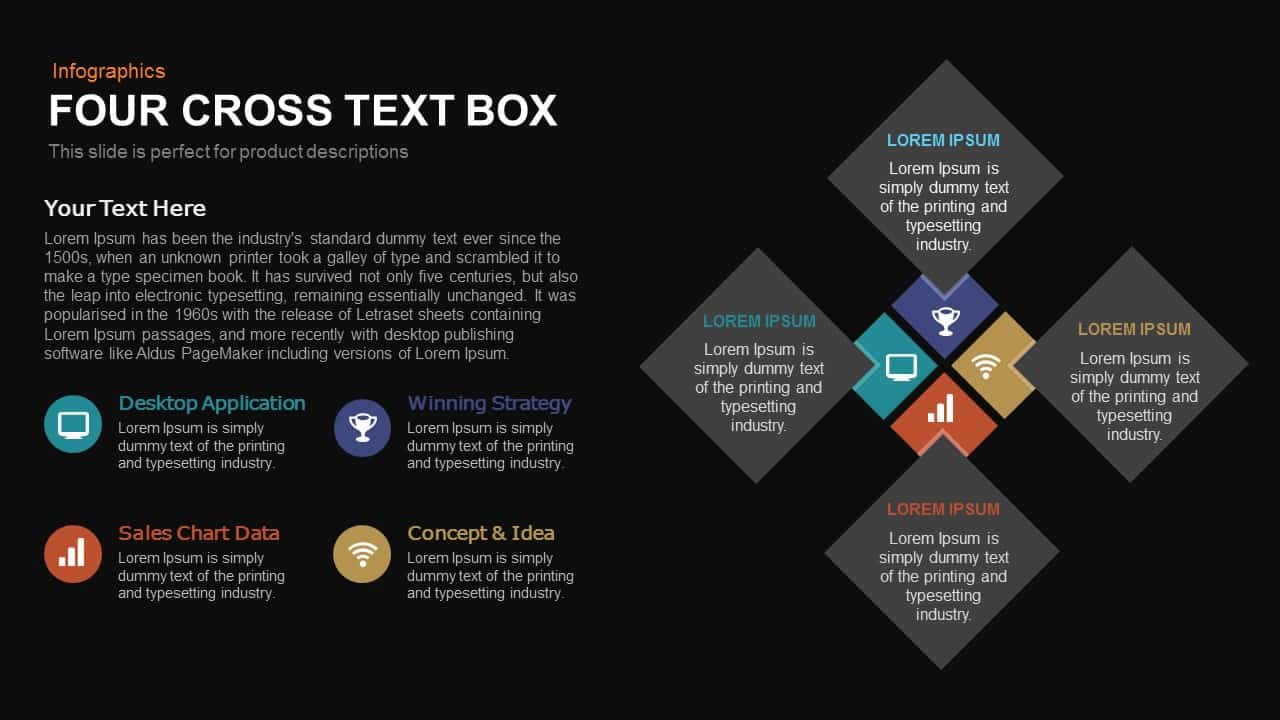
Four-Cross Text Box Diagram Template for PowerPoint & Google Slides
Comparison
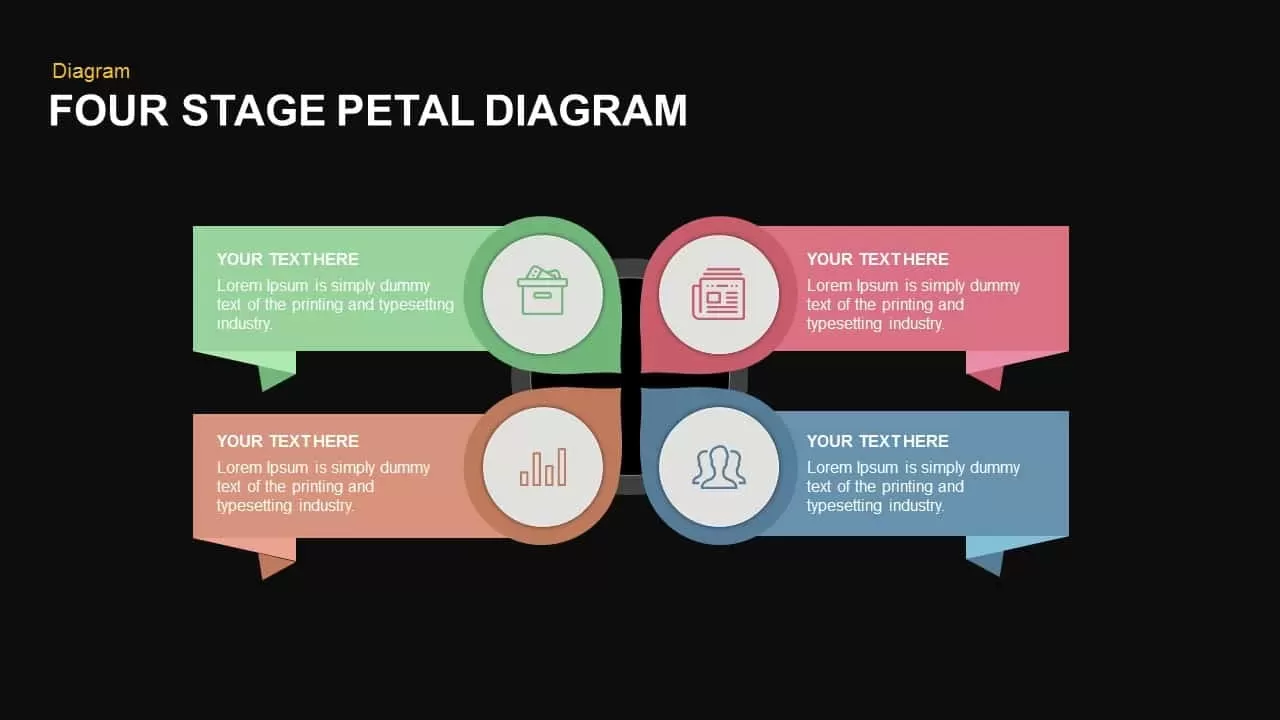
Modern Four-Stage Petal Diagram Template for PowerPoint & Google Slides
Circular
Four and Five-Stage Funnel Diagram Template for PowerPoint & Google Slides
Funnel
Clean Four-Section Review Diagram Template for PowerPoint & Google Slides
Agenda
Four-Section Strategy Diagram Slide Template for PowerPoint & Google Slides
Business Strategy
Four-Arrows Rectangular Factors Diagram Template for PowerPoint & Google Slides
Process
Editable Four-Section 3D Shape Diagram Template for PowerPoint & Google Slides
Comparison
Four-Circle Hub and Spoke Diagram Template for PowerPoint & Google Slides
Process

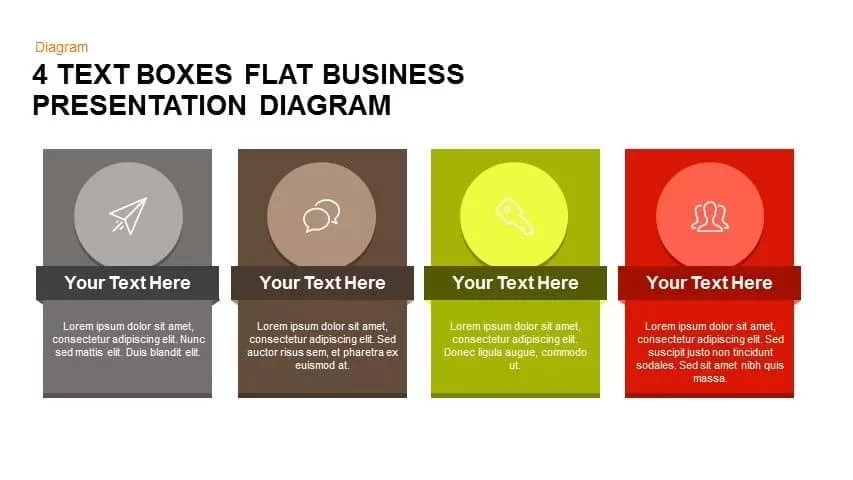
Flat Four-Box Business Layout Diagram Template for PowerPoint & Google Slides
Process
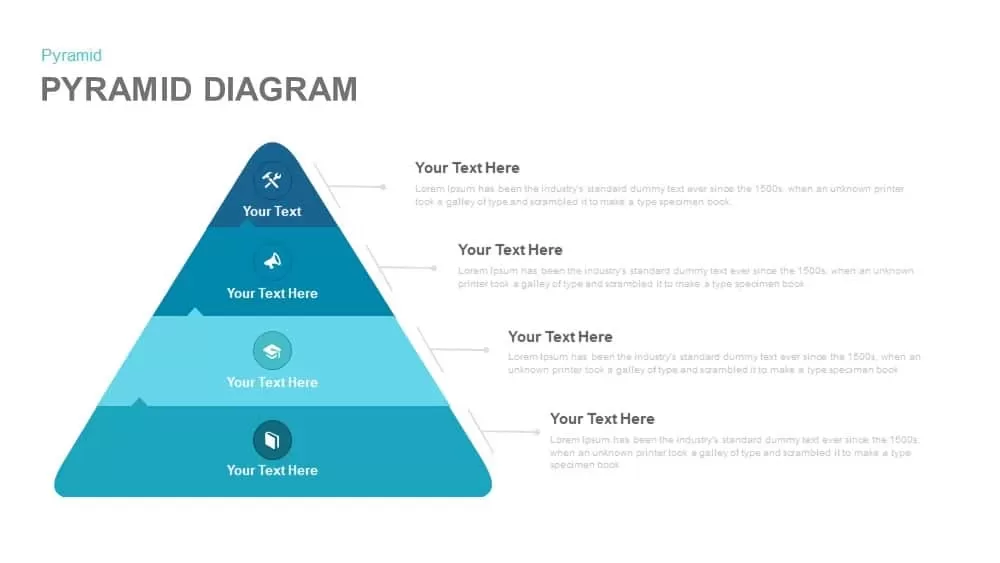
Four-Level Business Pyramid Diagram Template for PowerPoint & Google Slides
Pyramid
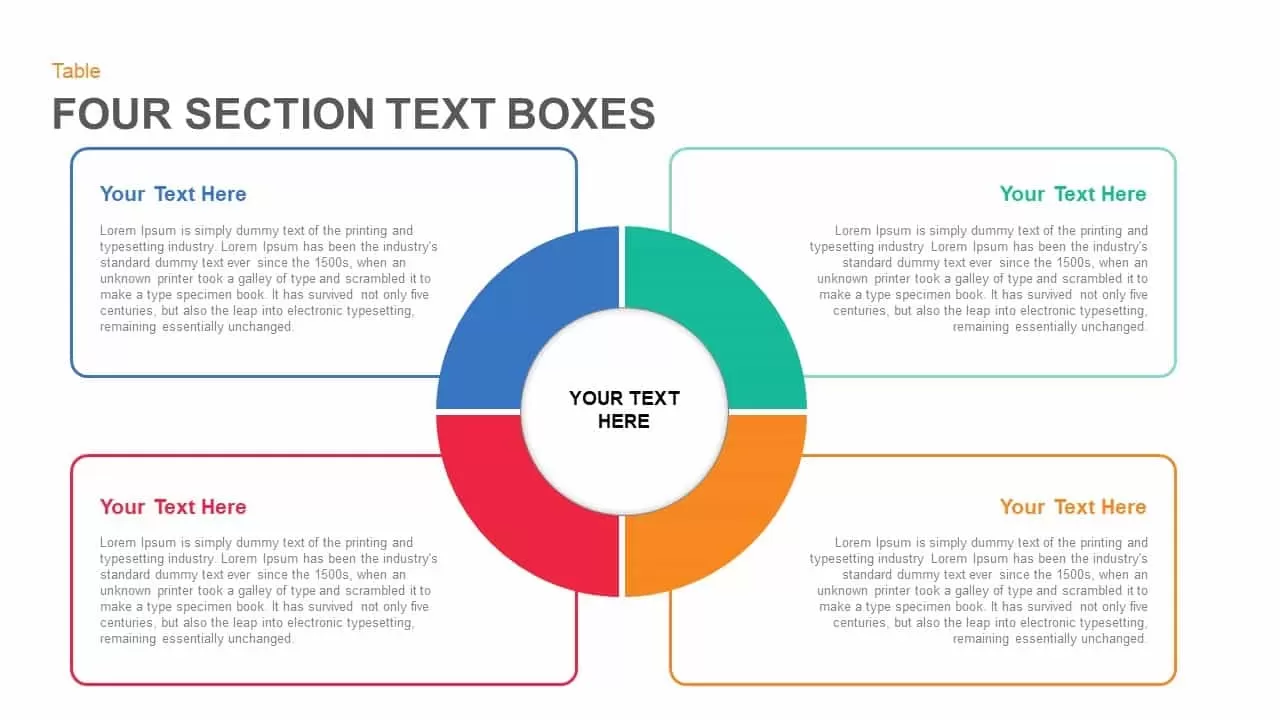
Four Section Circular Text Boxes Diagram Template for PowerPoint & Google Slides
Circular
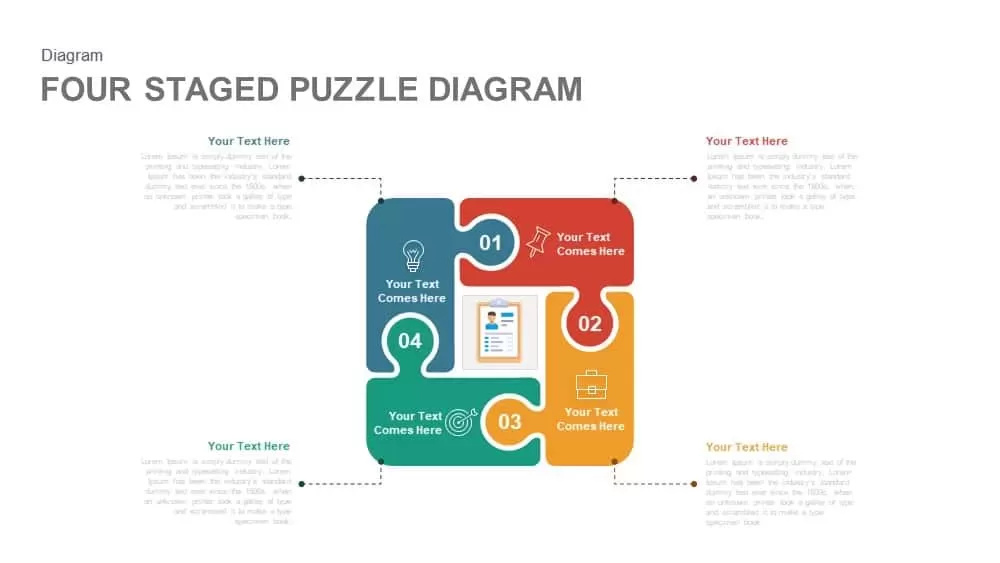
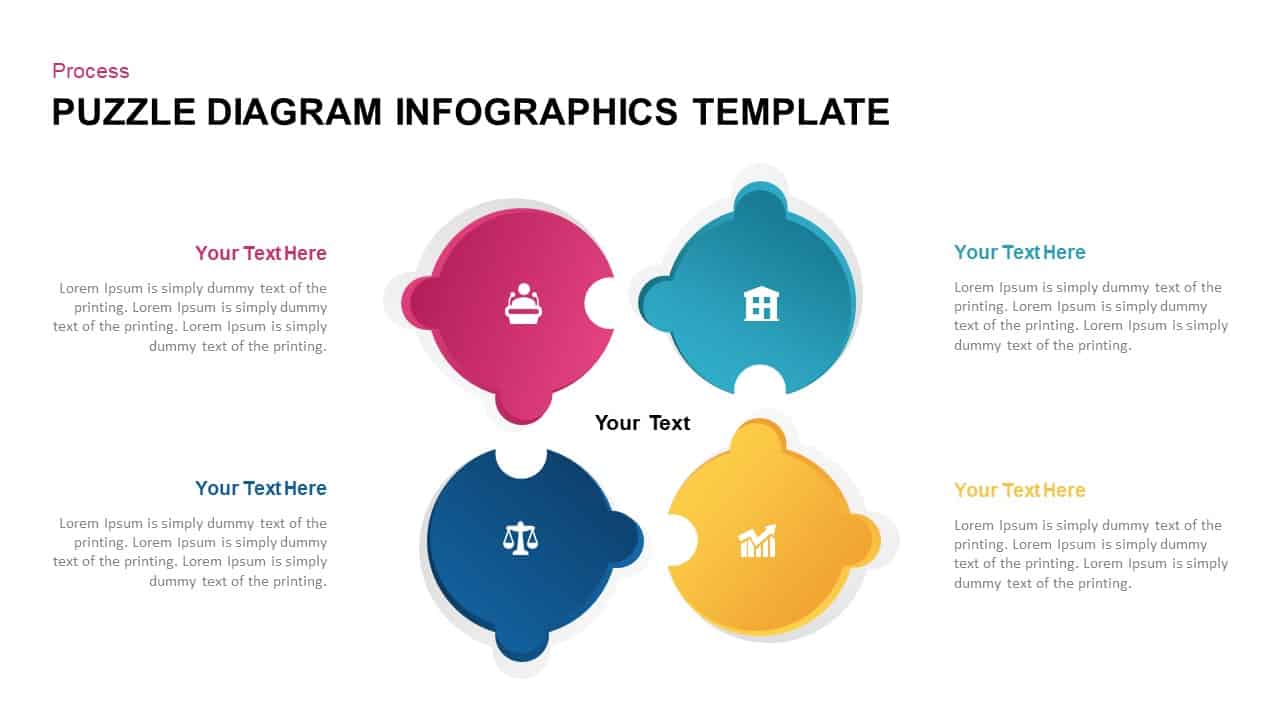
Four-Staged Puzzle Diagram Slide Template for PowerPoint & Google Slides
Process

Four-Plus Process Flow Diagram Template for PowerPoint & Google Slides
Process
Modern Four Stage Gear Diagram Template for PowerPoint & Google Slides
Process
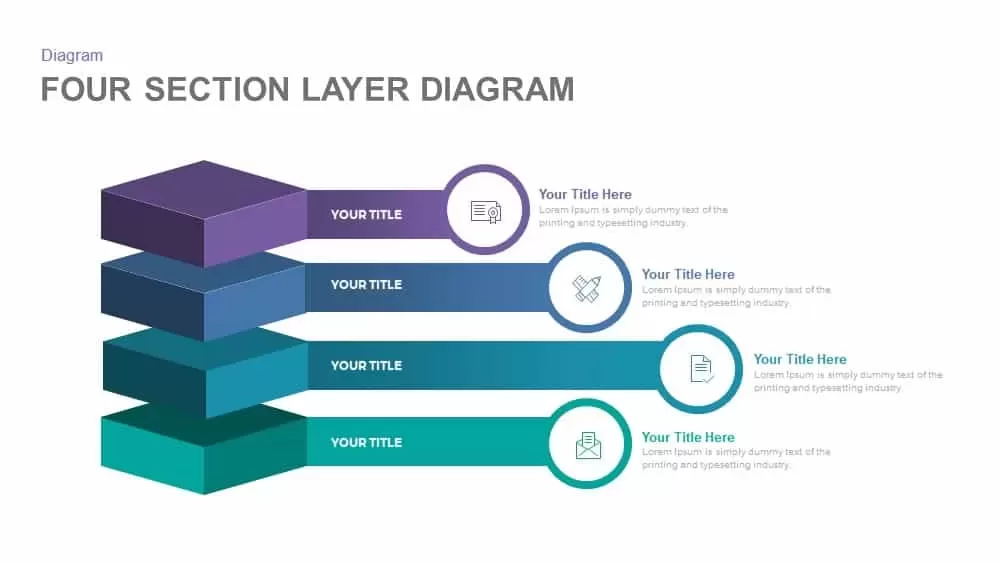
Professional Four-Section Layer Diagram Template for PowerPoint & Google Slides
Process
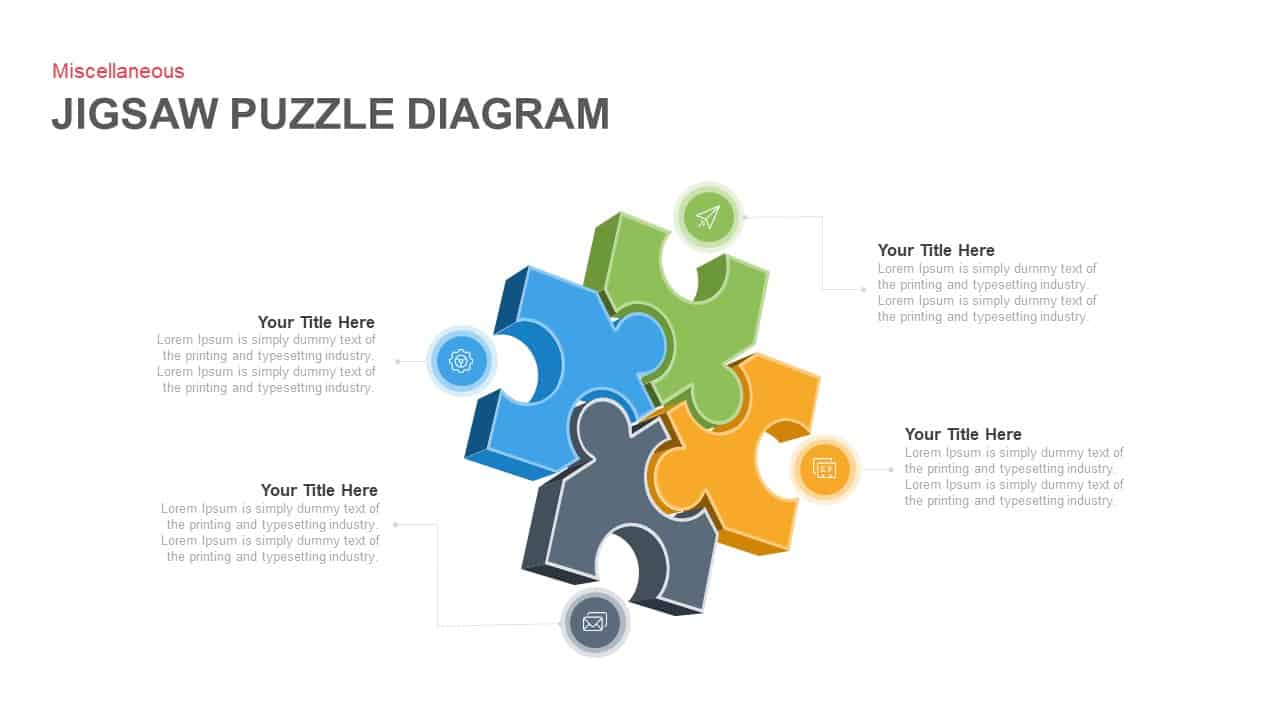
Four-Piece Jigsaw Puzzle Diagram Template for PowerPoint & Google Slides
Process
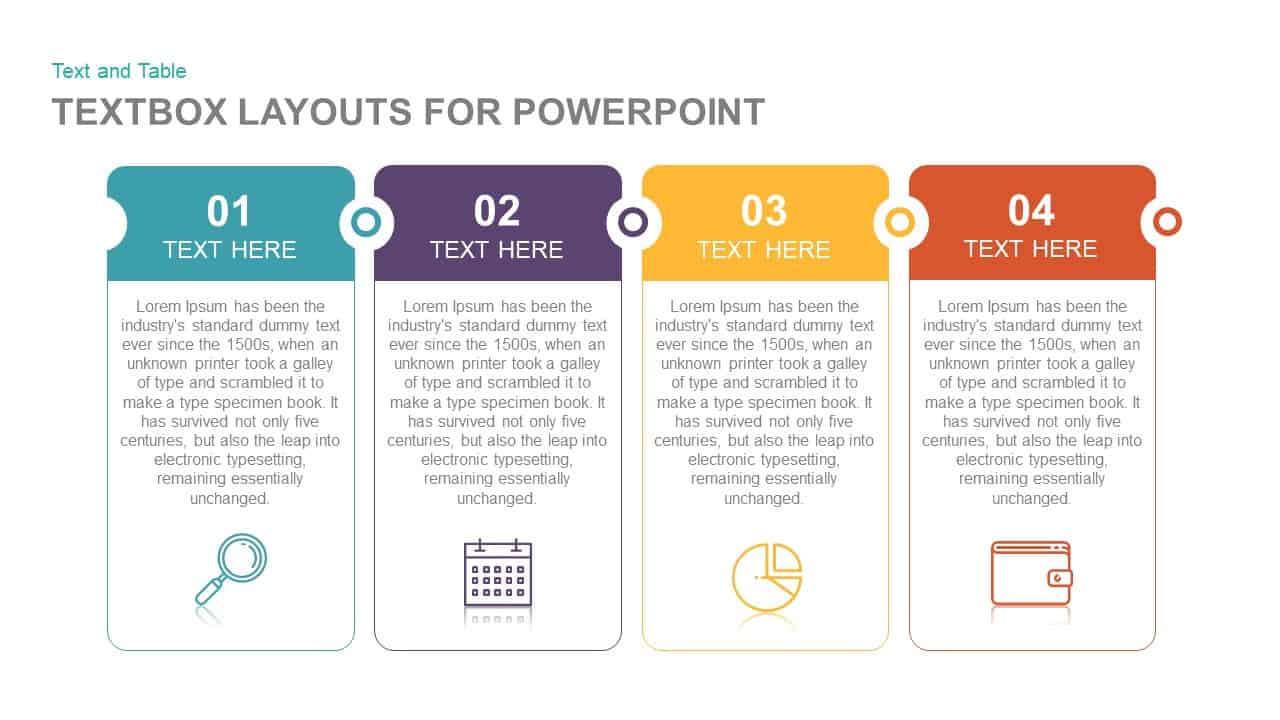
Four-Step Textbox Layout Diagram Template for PowerPoint & Google Slides
Business Report
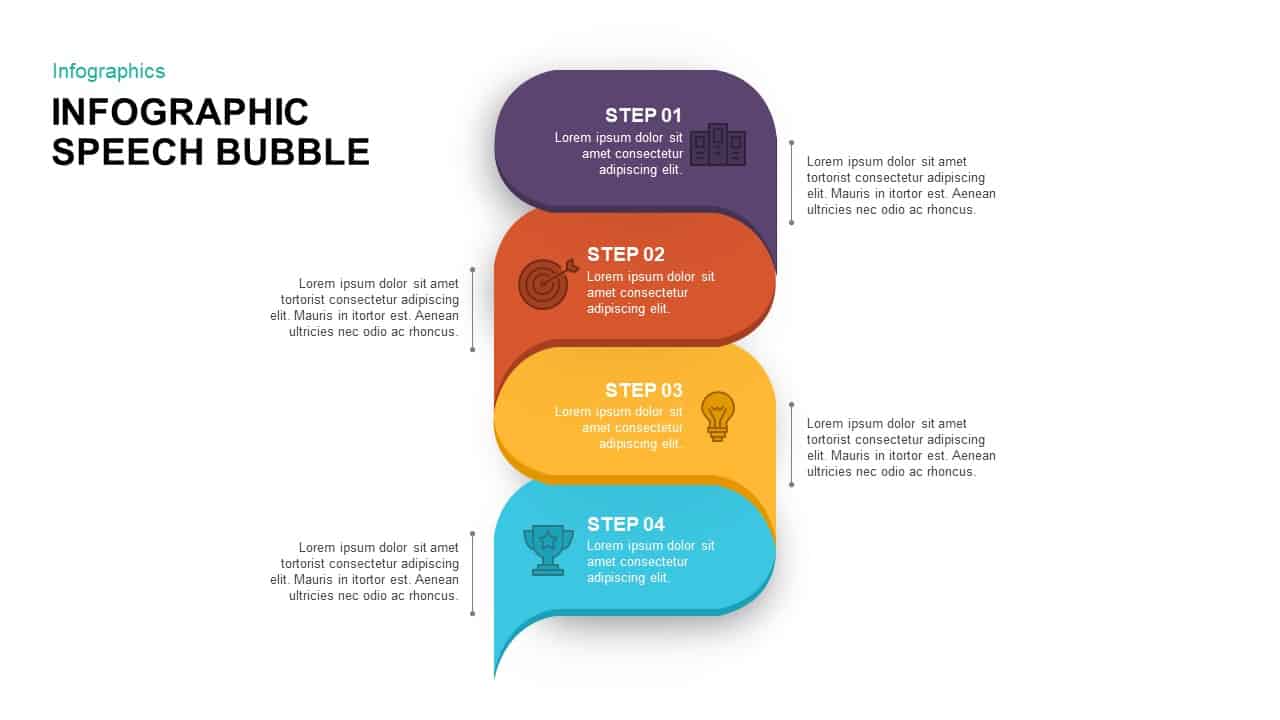
Four-Step Speech Bubble Diagram Template for PowerPoint & Google Slides
Process
Four-Stage Agenda Circle Diagram Slide Template for PowerPoint & Google Slides
Agenda
Four-Stage Circular Diagram Infographic Template for PowerPoint & Google Slides
Circular
Four-Stage Gear Process Diagram Template for PowerPoint & Google Slides
Process
Four-Stage Cycle Process Diagram Template for PowerPoint & Google Slides
Process
Four-Quadrant SWOT Analysis Diagram Template for PowerPoint & Google Slides
SWOT
Concentric Four-Layer Core Diagram Template for PowerPoint & Google Slides
Circular
Four-Stage Linear Process Flow Diagram Template for PowerPoint & Google Slides
Process
Four-Stage Circular Flow Diagram Template for PowerPoint & Google Slides
Circular
Hand-Held Four-Step Process Diagram Template for PowerPoint & Google Slides
Process
Four-Stage Start-Up Plan Arc Diagram Template for PowerPoint & Google Slides
Process
Four-Stage Funnel Diagram Infographic Template for PowerPoint & Google Slides
Funnel
Four-Step Spiral Funnel Diagram Template for PowerPoint & Google Slides
Funnel
Four-Part SWOT Analysis Diagram Template for PowerPoint & Google Slides
SWOT
Four-Step Puzzle Diagram Infographic Template for PowerPoint & Google Slides
Process
Four-Stage Funnel Diagram Infographic Template for PowerPoint & Google Slides
Funnel
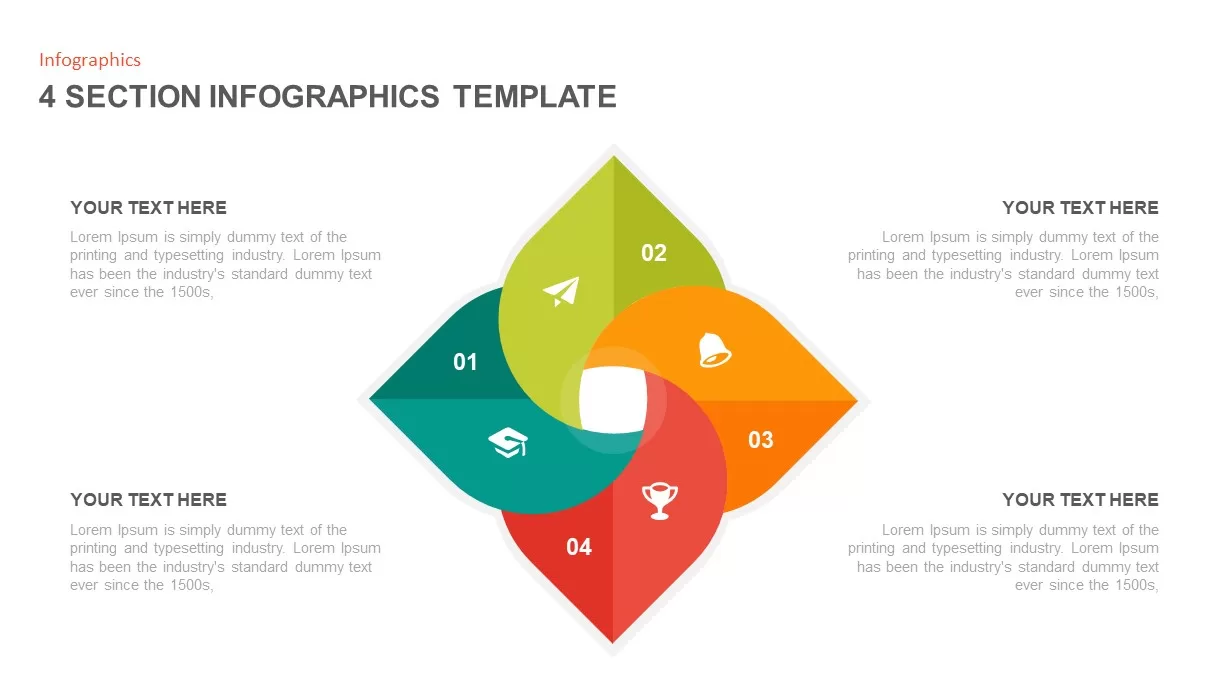
Four Section Diagram Infographics template for PowerPoint & Google Slides
Process
Four Business Structure Types Comparison Diagram Template for PowerPoint & Google Slides
Business Strategy

Four Section Infographic Diagram Template for PowerPoint & Google Slides
Circular
Four-Phase Maturity Model Diagram Template for PowerPoint & Google Slides
Process
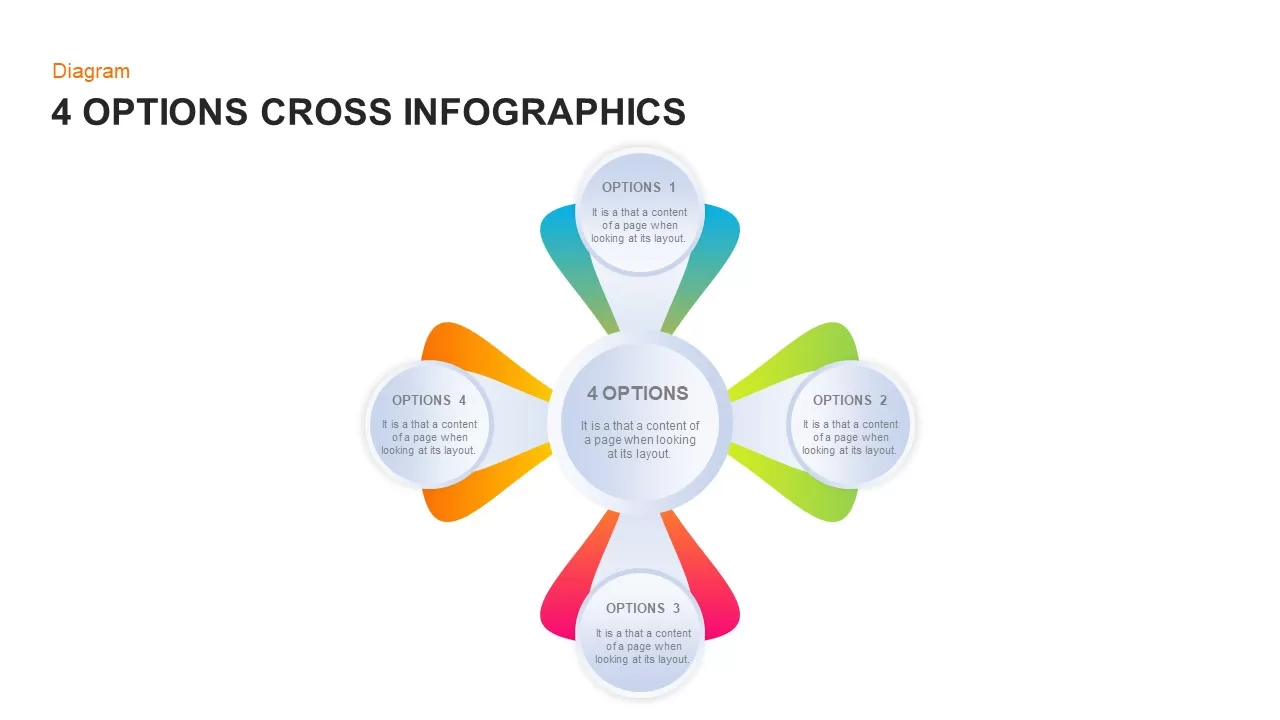
Four-Option Cross Infographic Diagram Template for PowerPoint & Google Slides
Comparison
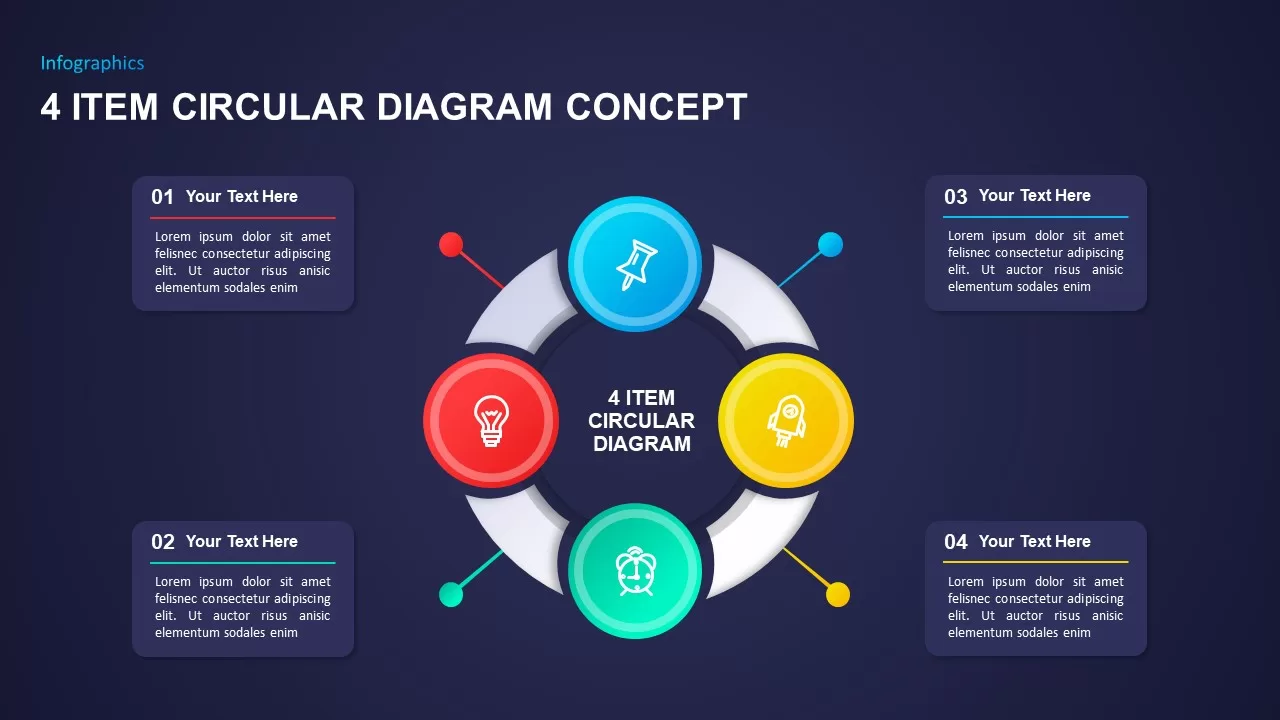
Four-Item Circular Diagram Concept Template for PowerPoint & Google Slides
Circular
Gradient Four-Step Roadmap Diagram Template for PowerPoint & Google Slides
Roadmap
Four-Step Objective Goal Diagram Template for PowerPoint & Google Slides
Goals
Elegant PDCA Four-Step Process Diagram Template for PowerPoint & Google Slides
Process
Four-Point Hub and Spoke Diagram Template for PowerPoint & Google Slides
Business Strategy
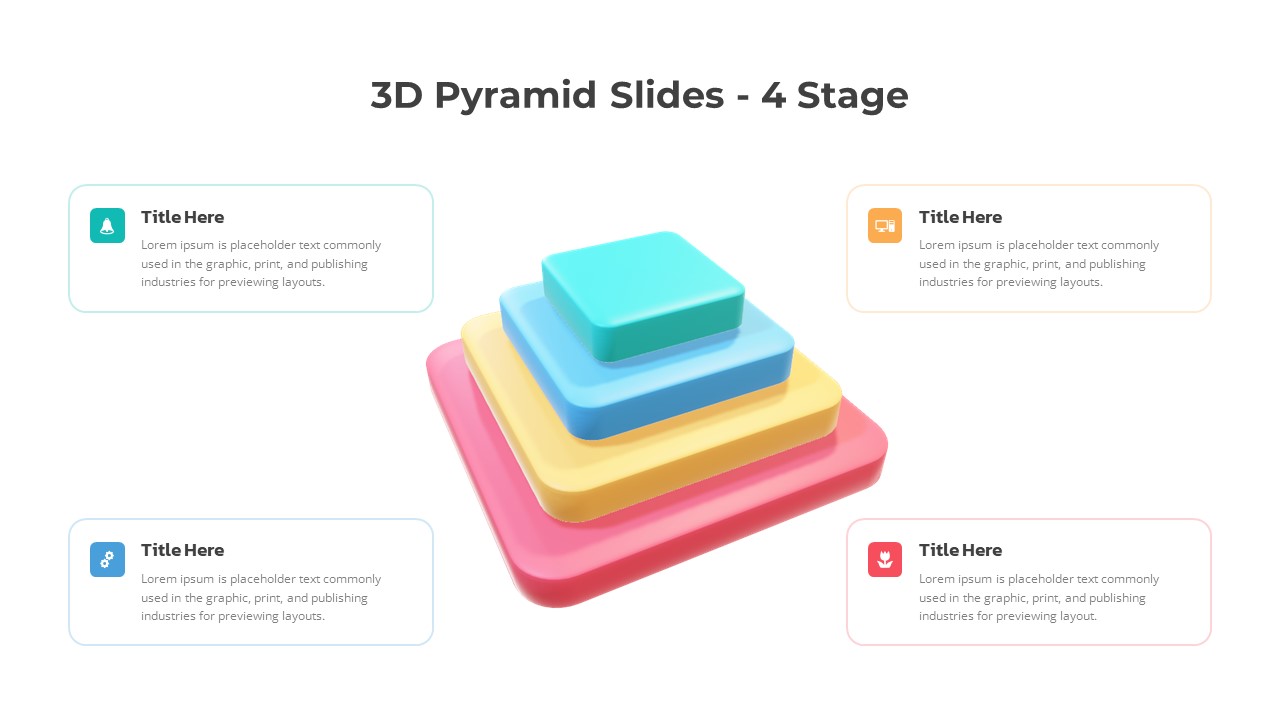
3D Four-Stage Pyramid Diagram Template for PowerPoint & Google Slides
Pyramid
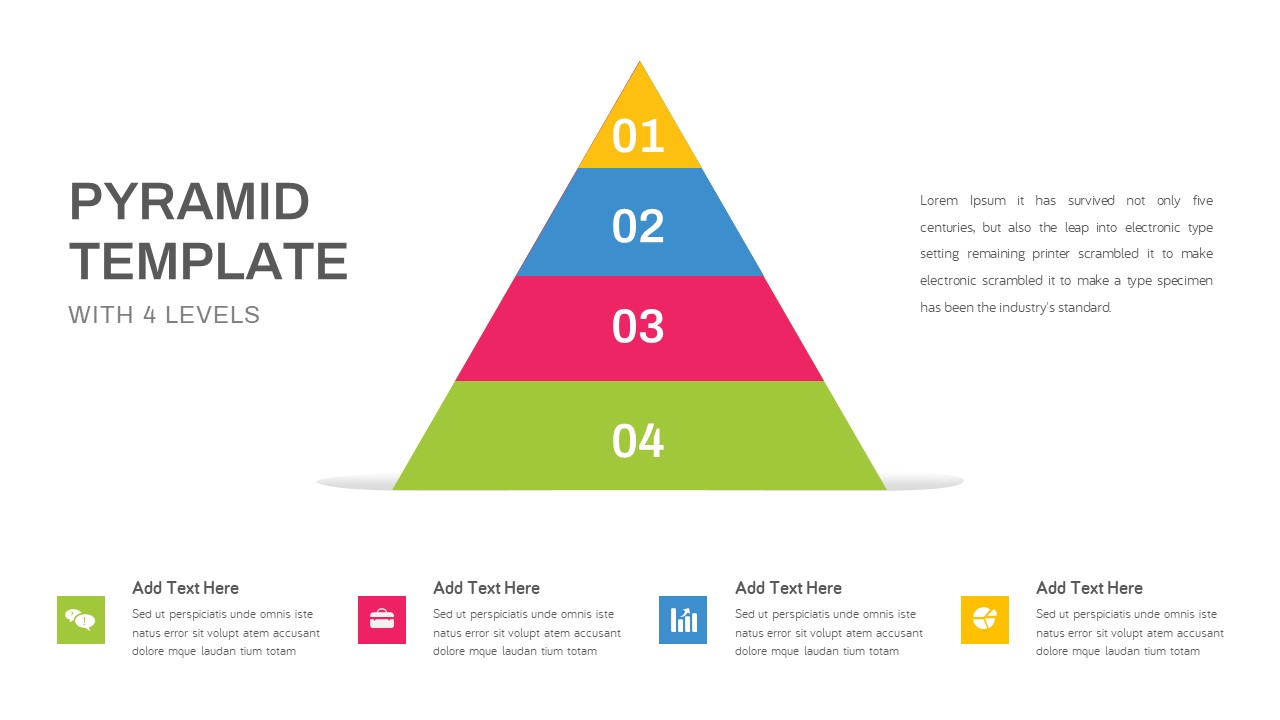
Four-Level Colorful Pyramid Diagram Template for PowerPoint & Google Slides
Pyramid
Modern Four-Level Pyramid Diagram Template for PowerPoint & Google Slides
Pyramid
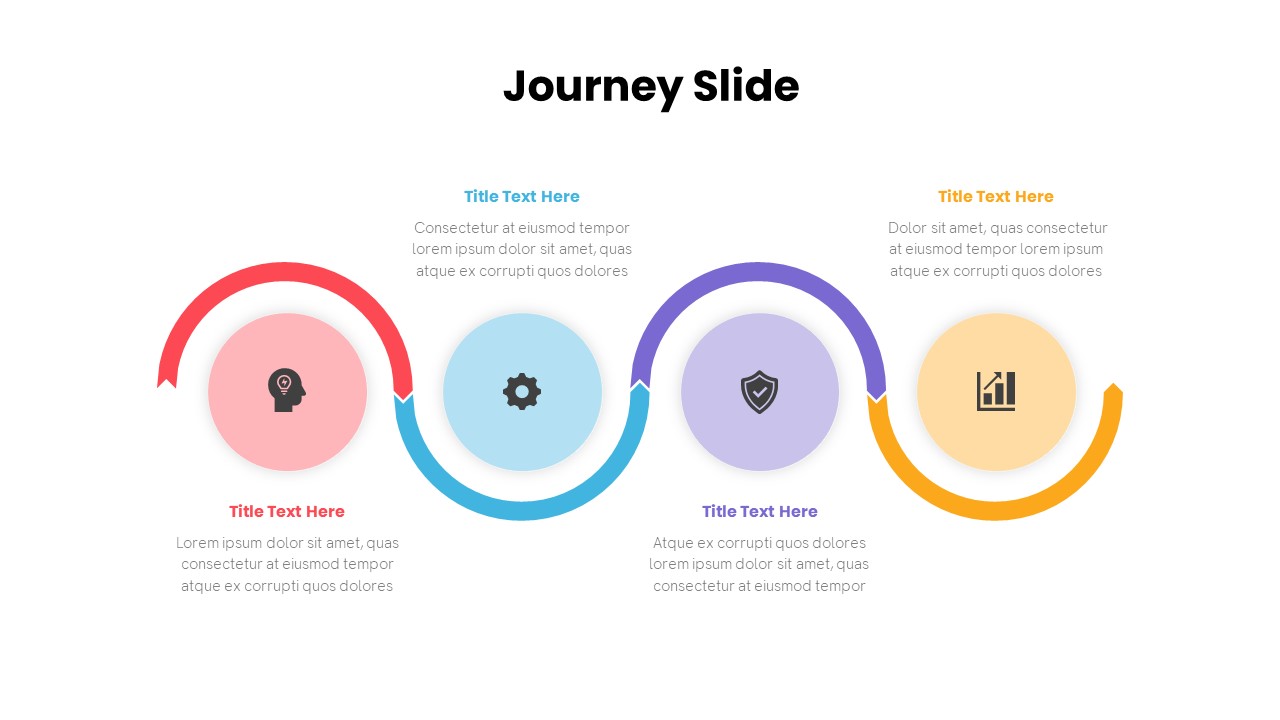
Free Journey Slide with Four Icons Diagram Template for PowerPoint & Google Slides
Process
Free
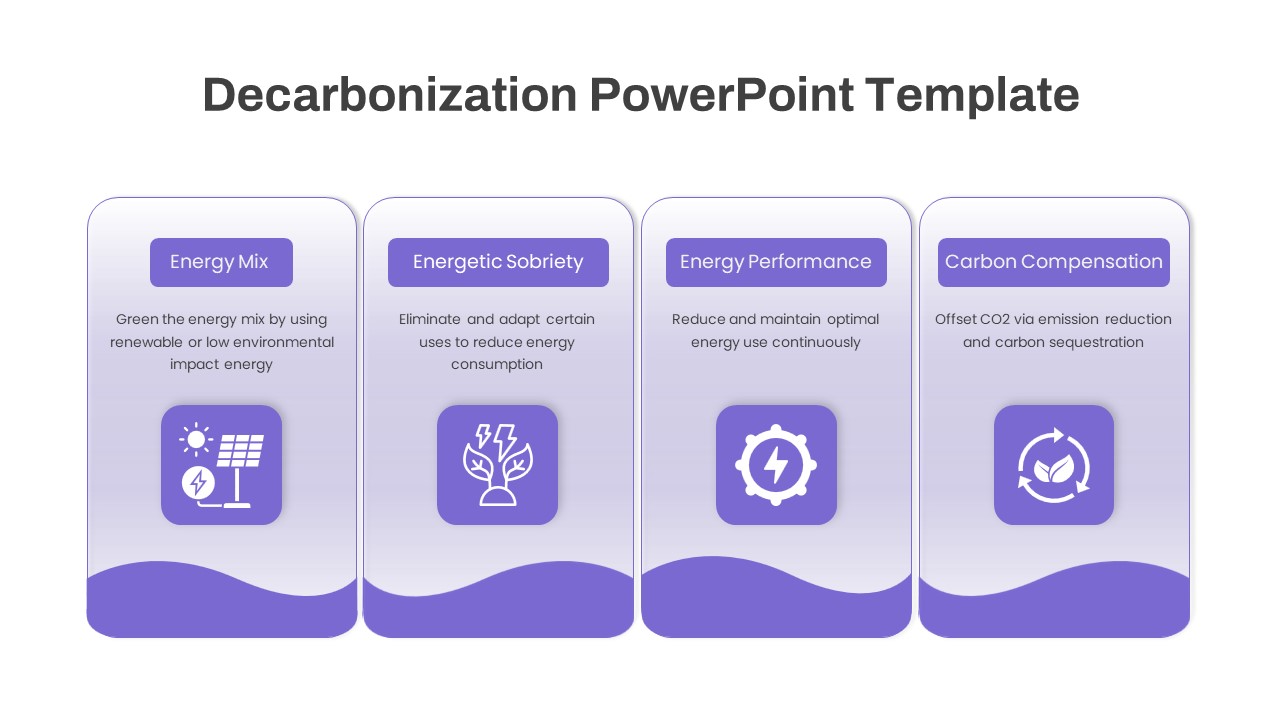
Four-Phase Decarbonization Diagram Template for PowerPoint & Google Slides
Process
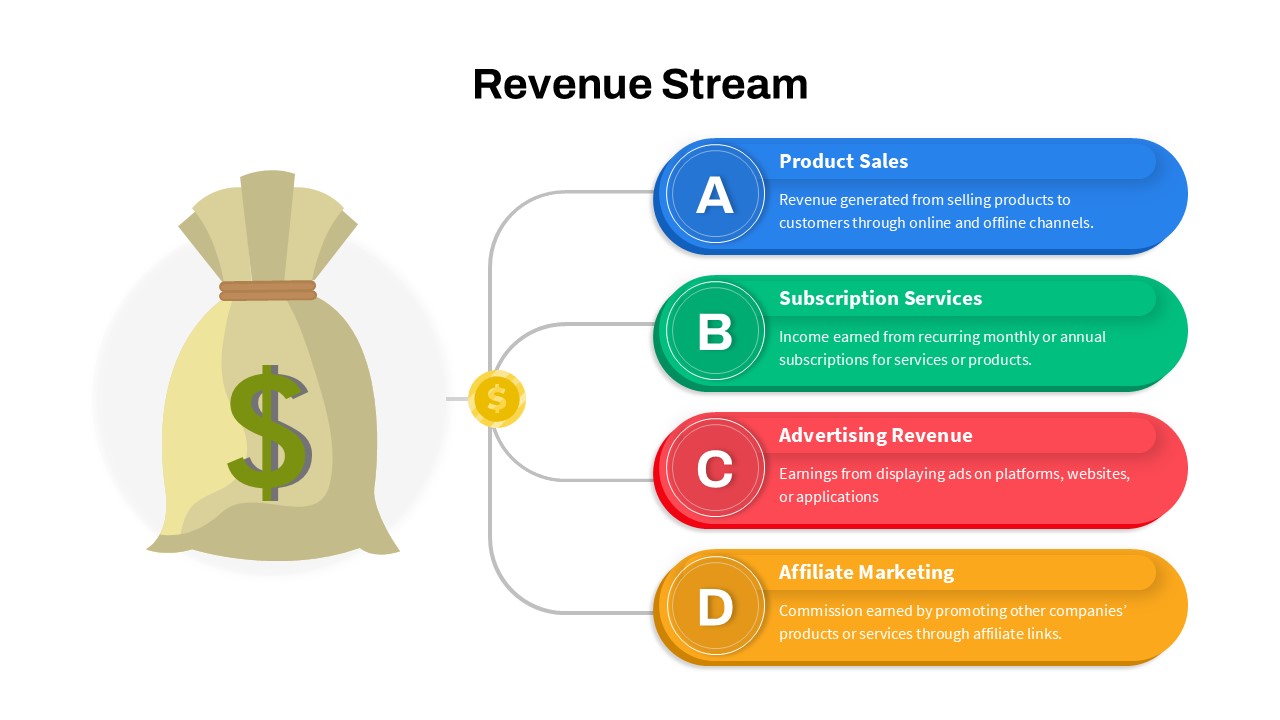
Revenue Streams: Four Channels Diagram Template for PowerPoint & Google Slides
Business Models
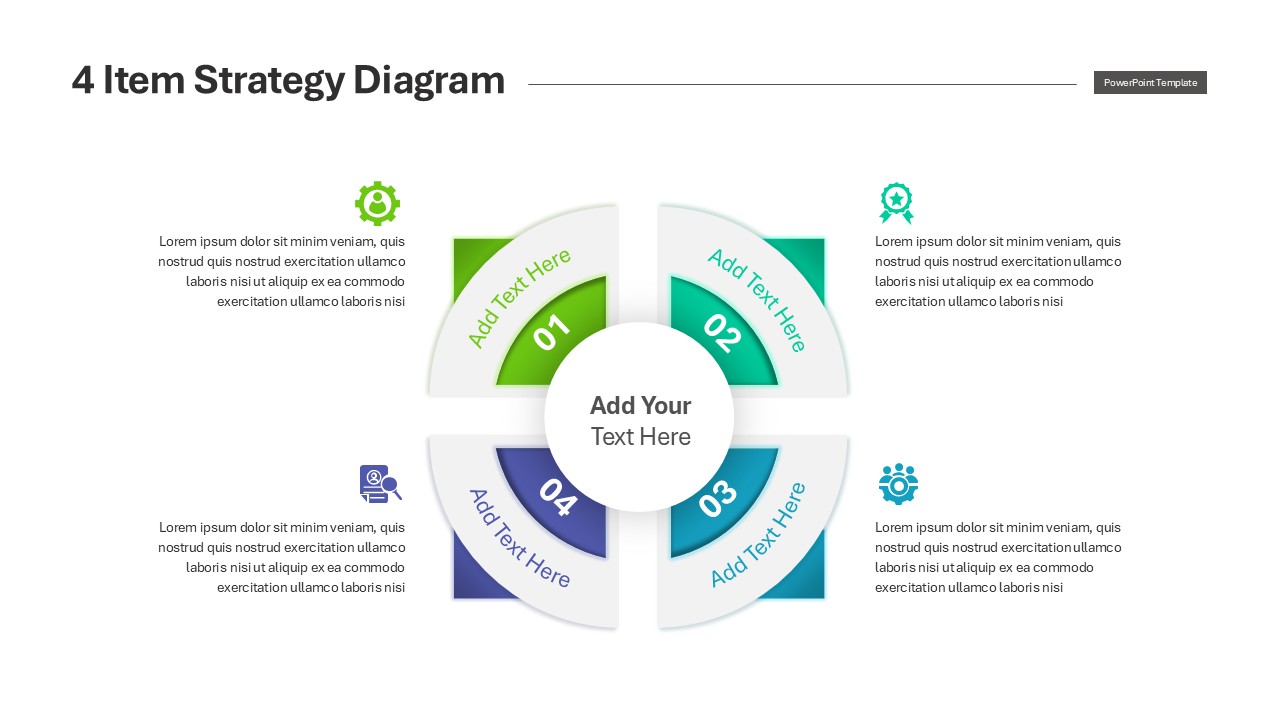
Engaging Four-Option Strategy Diagram Template for PowerPoint & Google Slides
Business Strategy
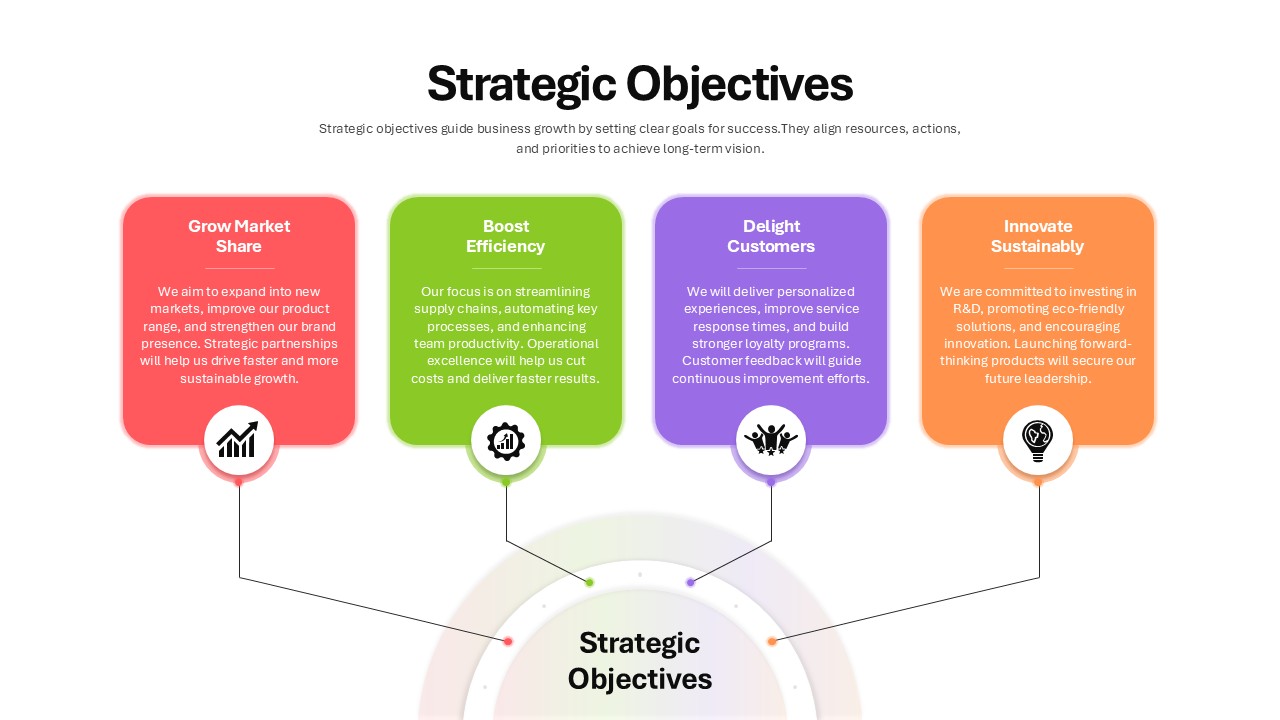
Four Strategic Objectives Radial Diagram Template for PowerPoint & Google Slides
Business Strategy
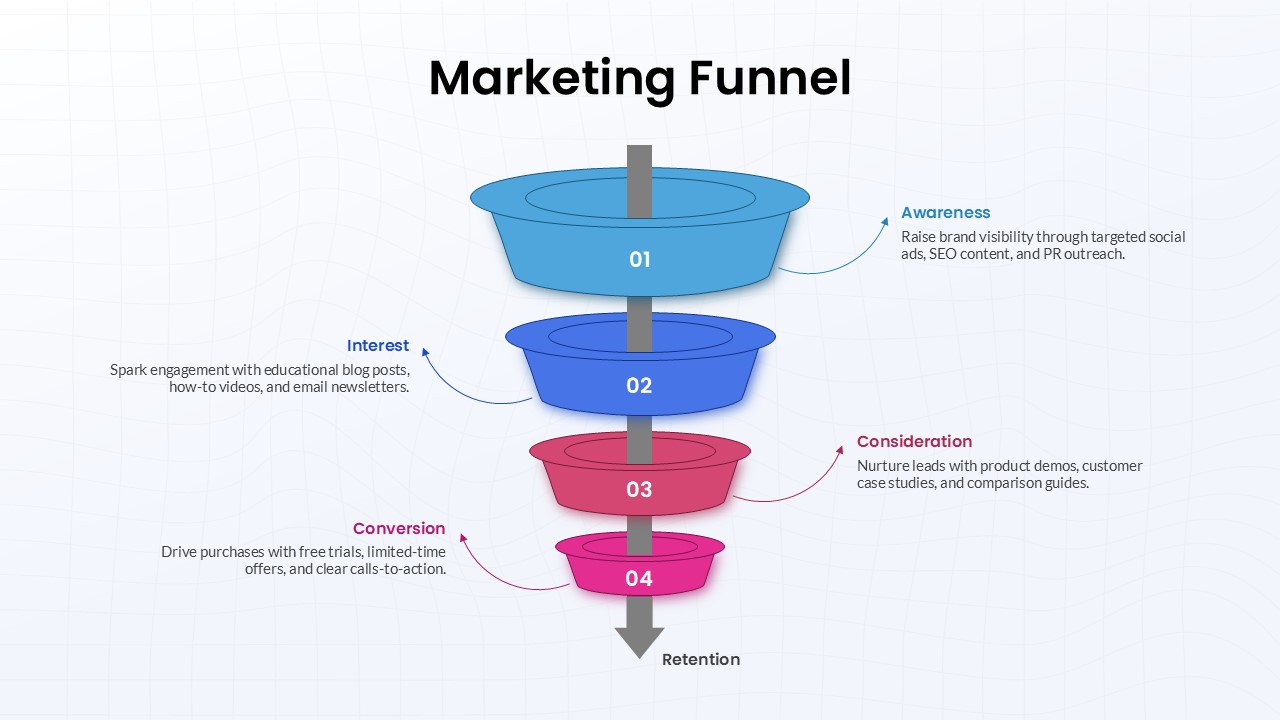
Four-Stage Marketing Funnel Diagram Template for PowerPoint & Google Slides
Marketing Funnel
Four-Level Colorful Pyramid Diagram Template for PowerPoint & Google Slides
Pyramid
Four Linked Circle Diagram for PowerPoint & Google Slides
Process

Four Staged Agenda Diagram for PowerPoint & Google Slides
Agenda
Four Step Infographics Diagram for PowerPoint & Google Slides
Process
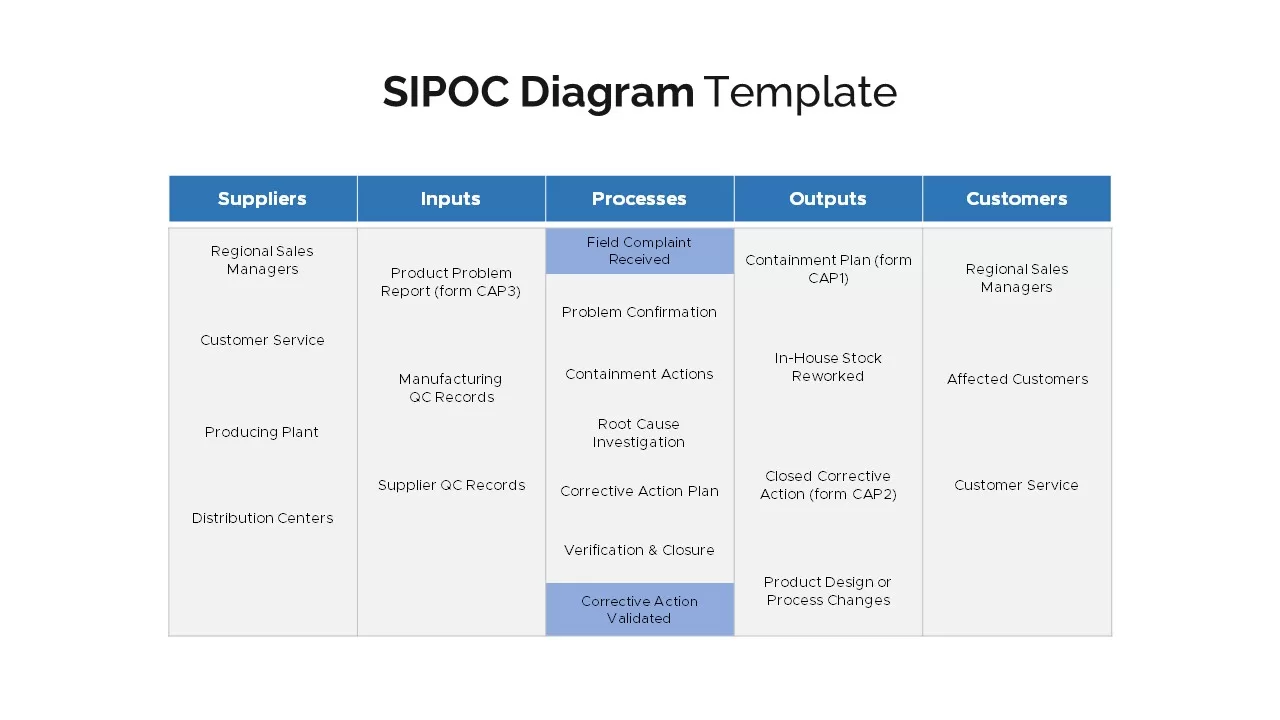
Four SIPOC Diagram Infographic Templates for PowerPoint & Google Slides
Business Plan
Three Circle Arrow Process Diagram template for PowerPoint & Google Slides
Circular
Arrow Stage Process Diagram template for PowerPoint & Google Slides
Arrow
Eight-Stage Zigzag Arrow Diagram Template for PowerPoint & Google Slides
Process
Free Six-Stage Arrow Process Diagram Template for PowerPoint & Google Slides
Process
Free
Six-Step Linear Arrow Process Diagram Template for PowerPoint & Google Slides
Process
Concentric Circular Arrow Cycle Diagram Template for PowerPoint & Google Slides
Process