Floating Island Ecosystem Infographics Template for PowerPoint & Google Slides
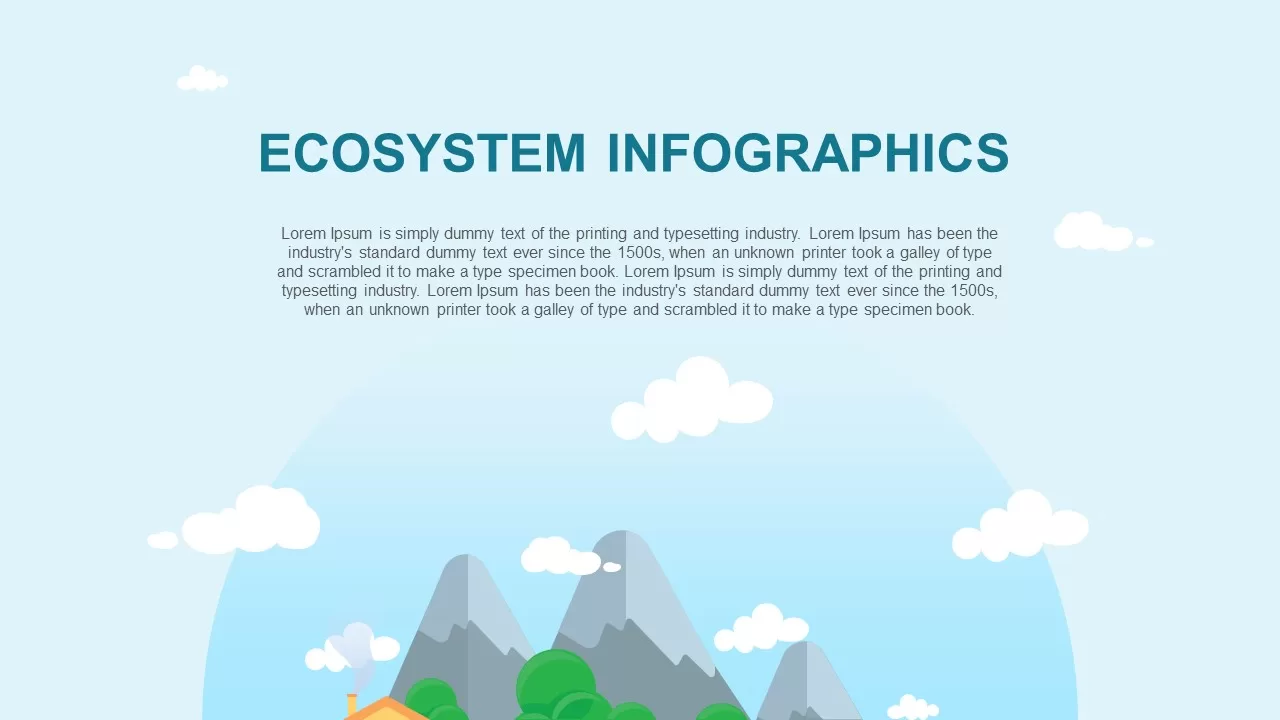
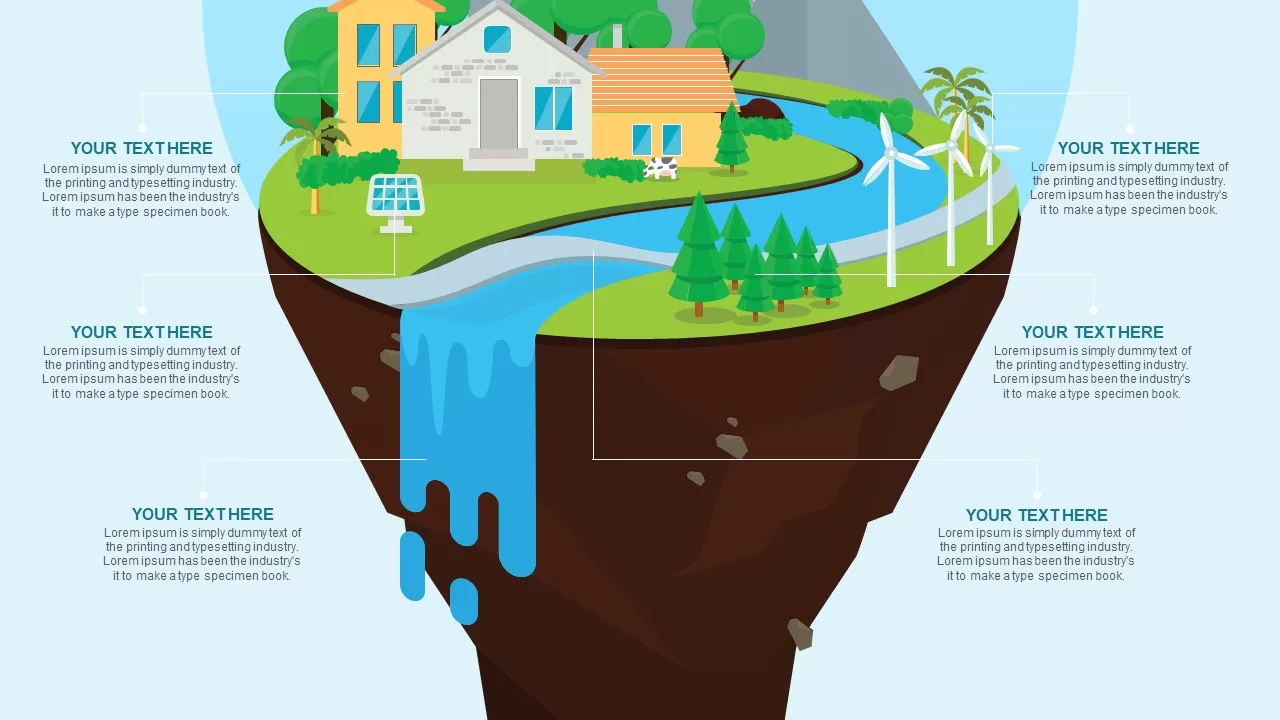
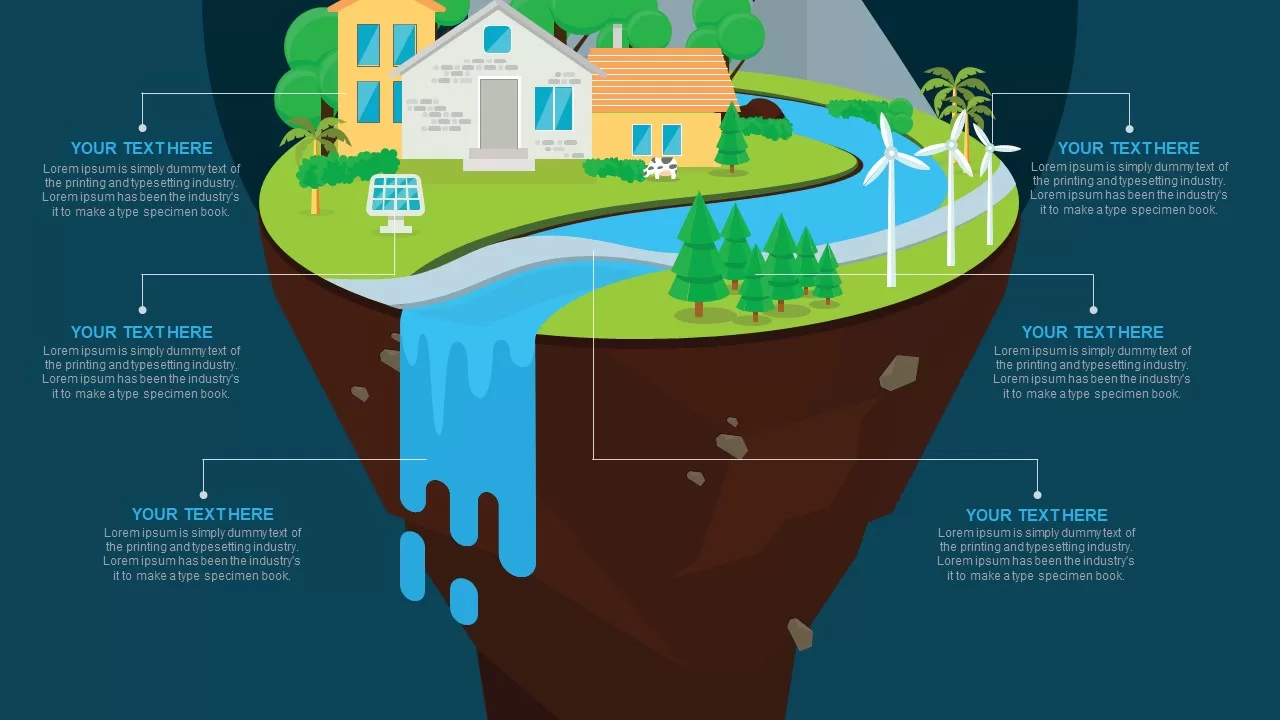

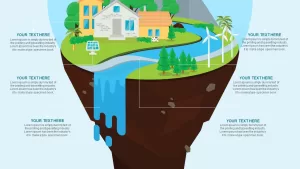

This vibrant infographic presents a floating-island cross-section that visualizes ecosystem components—solar panels, housing, river flow, wind turbines, forests, and wildlife—against a sky-blue backdrop with subtle clouds. Callout lines connect each element to editable text placeholders, enabling you to detail energy production, water resources, forestry metrics, housing data, and human impact in a single, cohesive diagram.
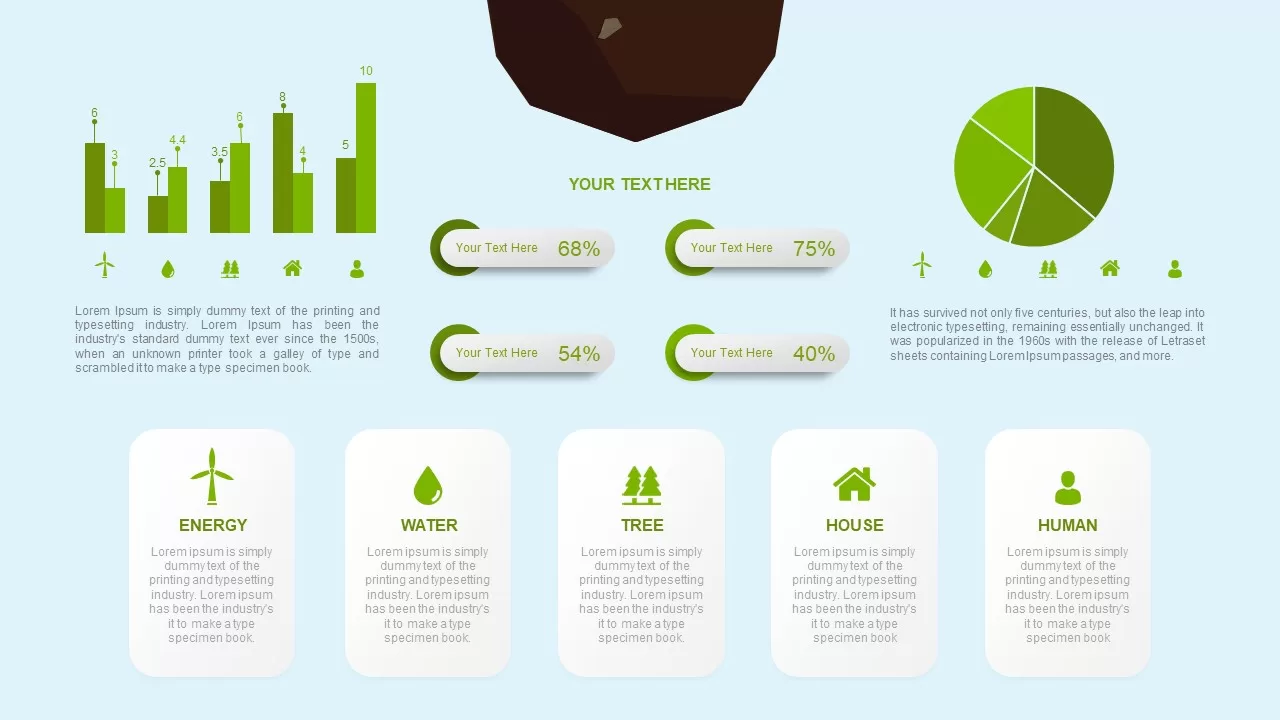
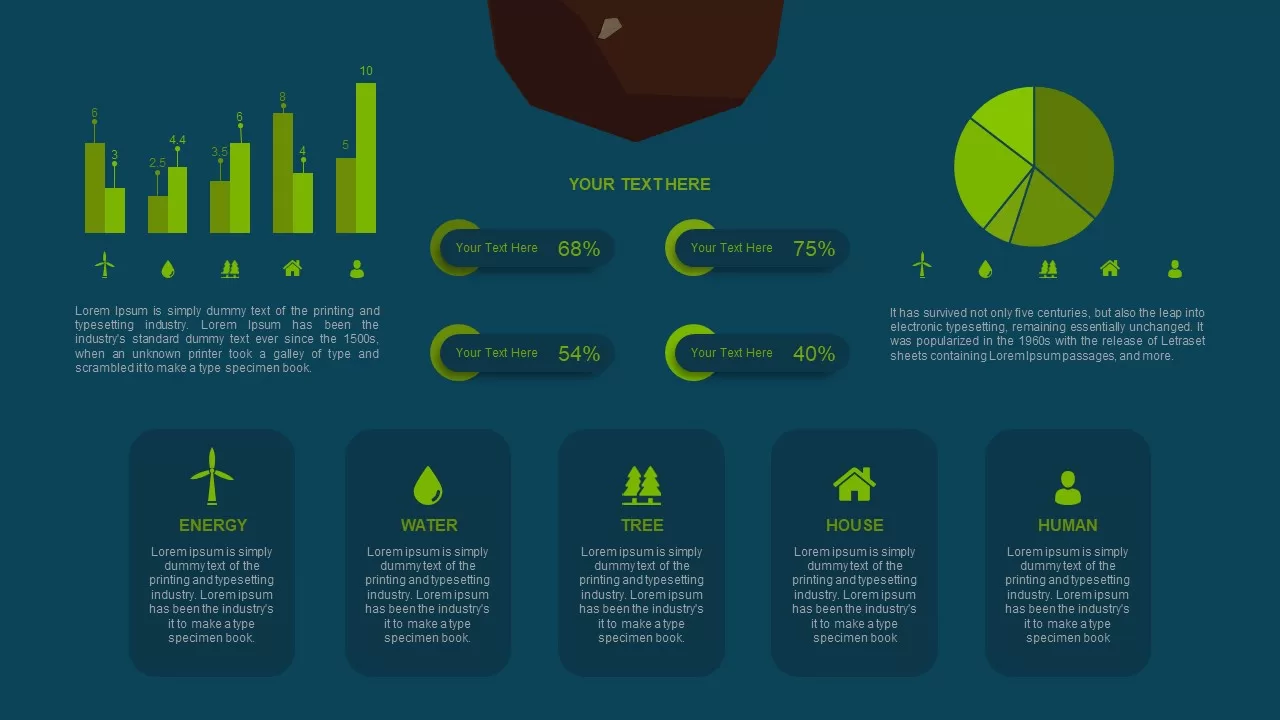
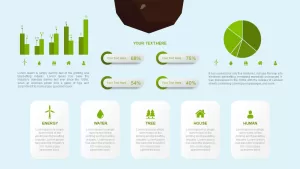
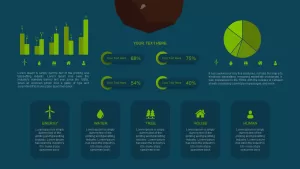
Beneath the main illustration, a data section offers five green-themed bar charts, circular progress indicators, and a pie chart—each keyed to custom icons for Energy, Water, Tree, House, and Human categories. Users can input actual values, adjust axis labels, and update percentages with ease. A row of rounded-corner cards provides additional space for concise descriptions or action points tied to each resource segment.
Built on master slides for both PowerPoint and Google Slides, this infographic template features fully editable vector shapes, color themes, and alignment guides. Swap out icons, tweak chart styles, or recolor the island’s terrain and foliage in seconds to match your brand palette. Smart-fill placeholders and drag-and-drop elements streamline customization, ensuring your data-driven narrative remains clear and visually engaging across every slide.
Use this template to depict sustainability reports, environmental impact assessments, resource-allocation plans, or educational overviews. Its striking floating-island motif captures attention while delivering complex data in an intuitive, story-driven format.
Who is it for
Environmental consultants, sustainability managers, urban planners, and educators will find this infographic invaluable for communicating ecosystem analyses, resource-management strategies, and green-initiative results to stakeholders, students, or community groups.
Other Uses
Beyond environmental topics, repurpose the floating-island layout for business model breakdowns, product ecosystem maps, service portfolios, or cross-departmental dashboards. Replace icons and labels to showcase project phases, departmental KPIs, or multi-stakeholder processes in a visually unified framework.
Login to download this file

Item ID
SB01999
Related Templates

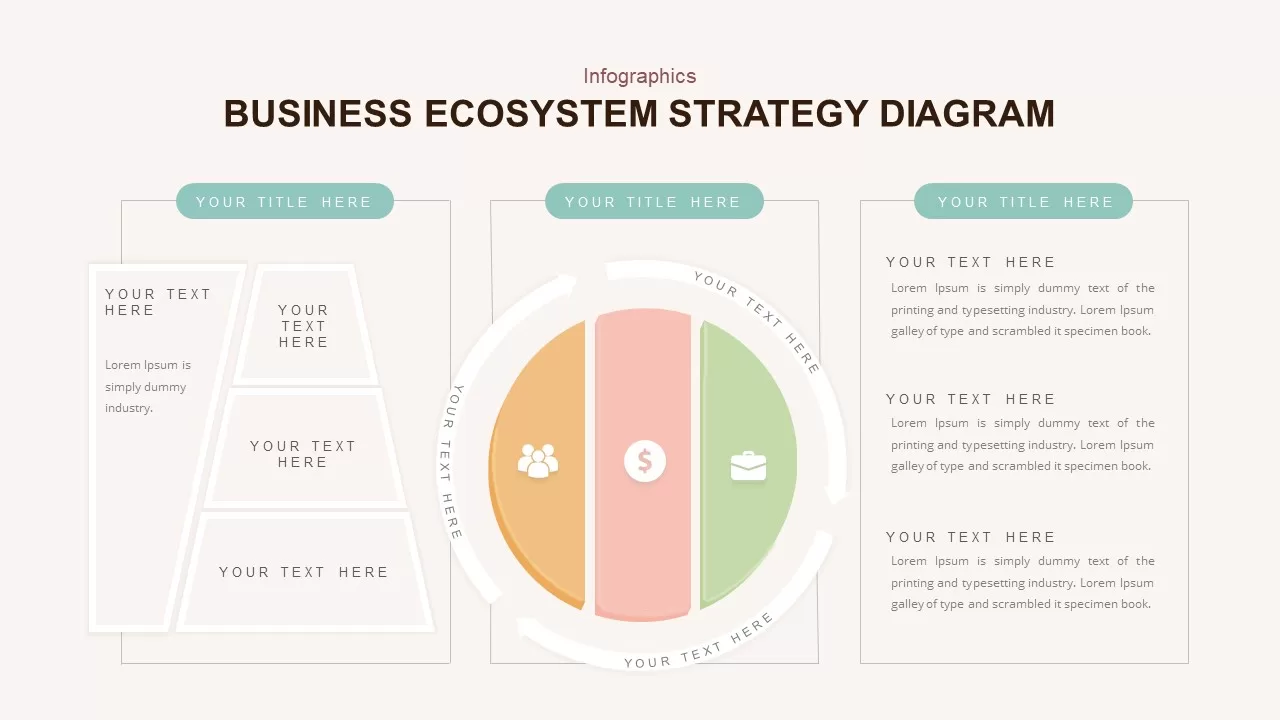
Business Ecosystem Strategy Diagram template for PowerPoint & Google Slides
Business Strategy
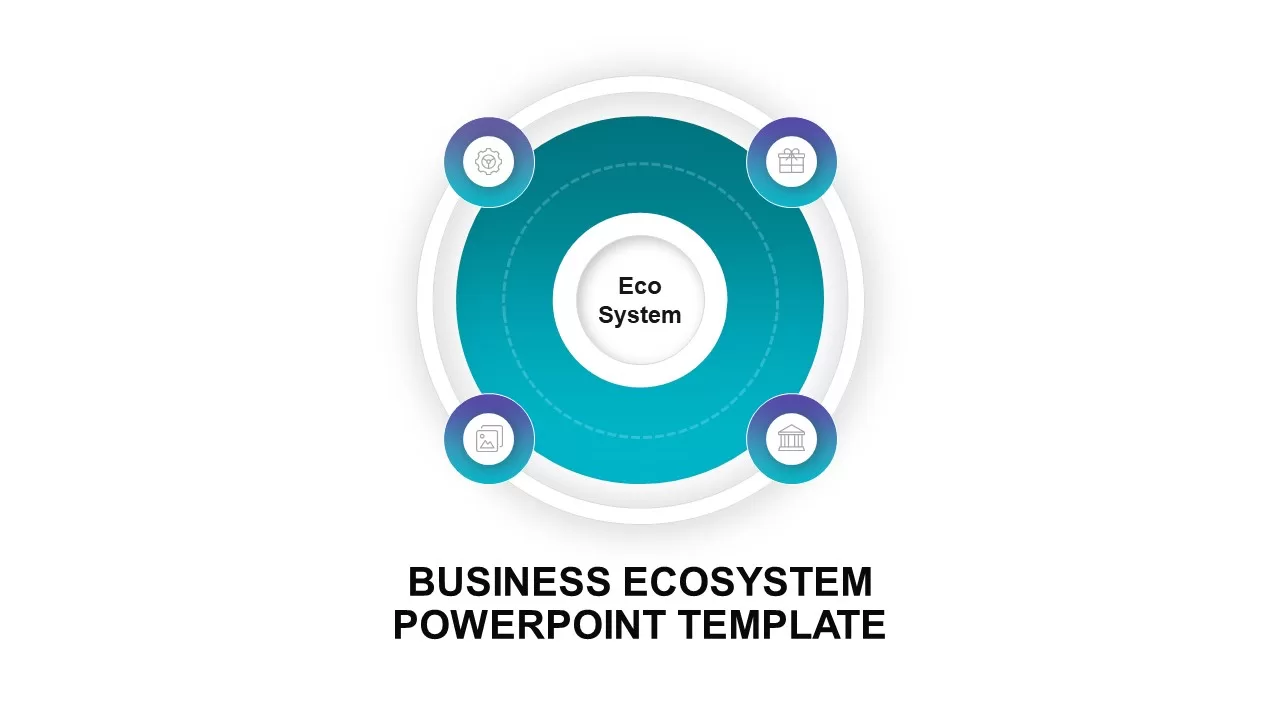
Circular Business Ecosystem Diagram Template for PowerPoint & Google Slides
Business Strategy
AI and Data Ecosystem Map Template for PowerPoint & Google Slides
AI
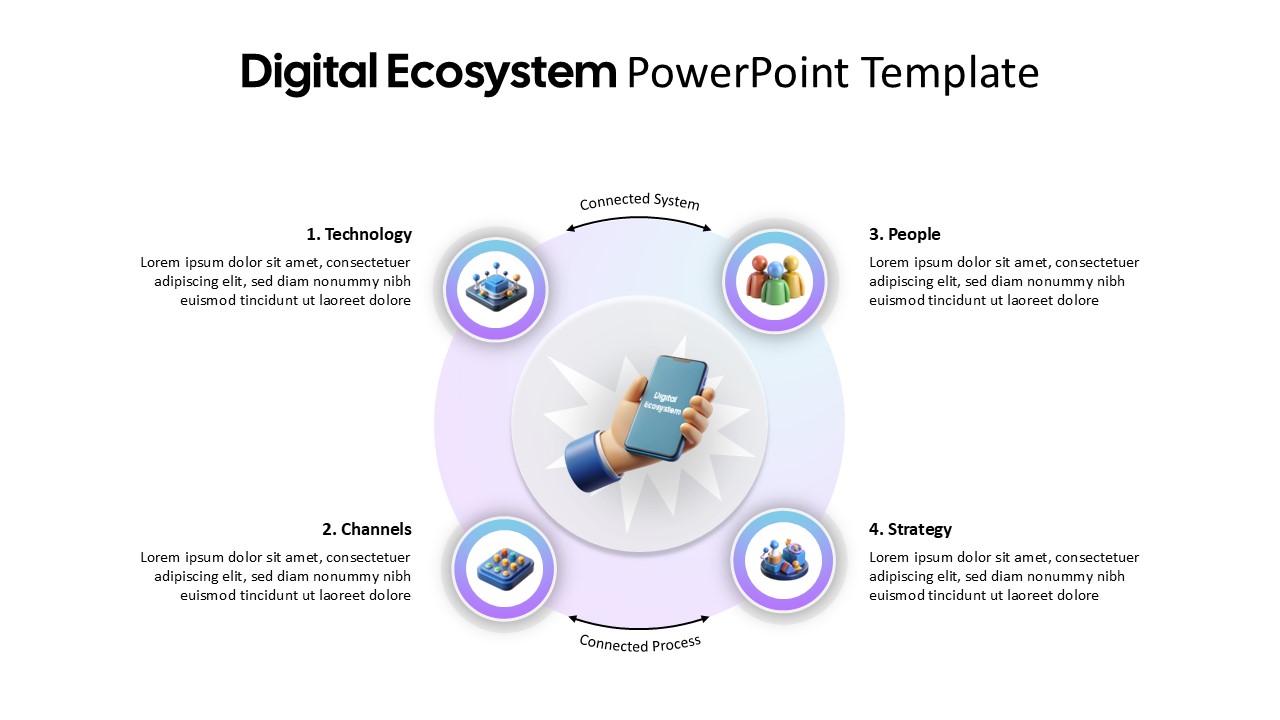
Digital Ecosystem Circular Model Template for PowerPoint & Google Slides
Information Technology
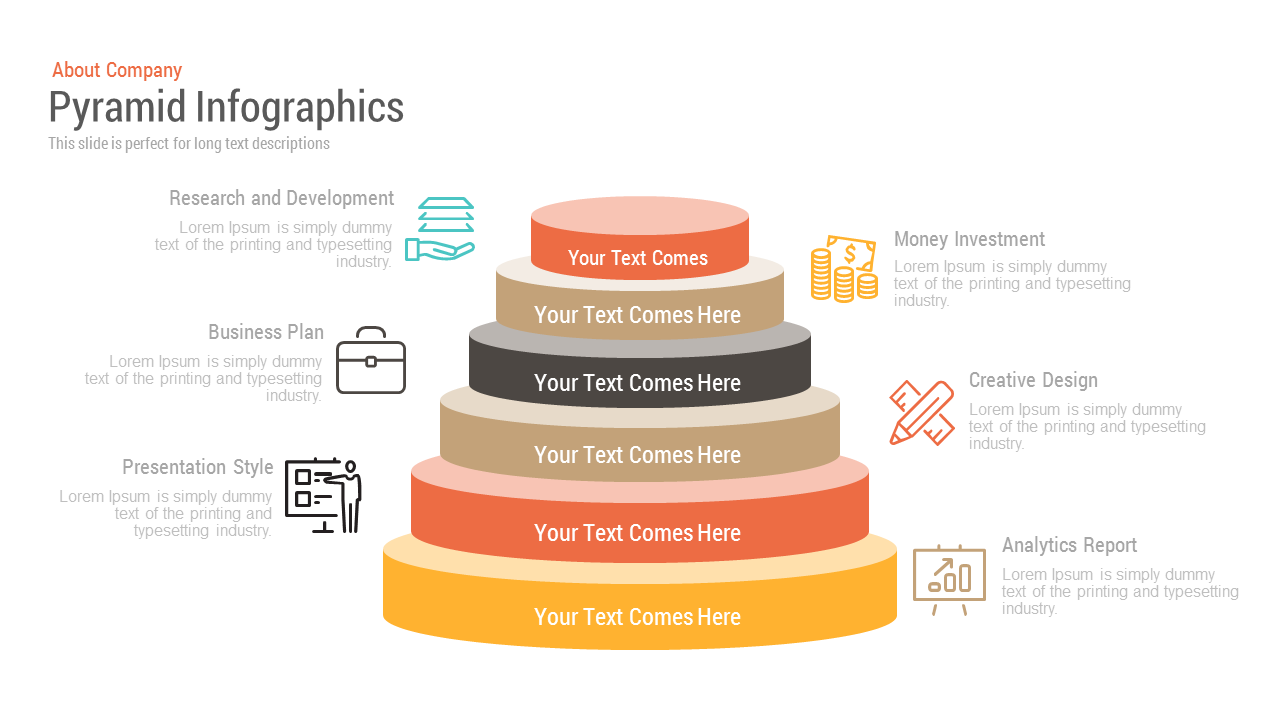
Free Pyramid Infographics template for PowerPoint & Google Slides
Pyramid
Free
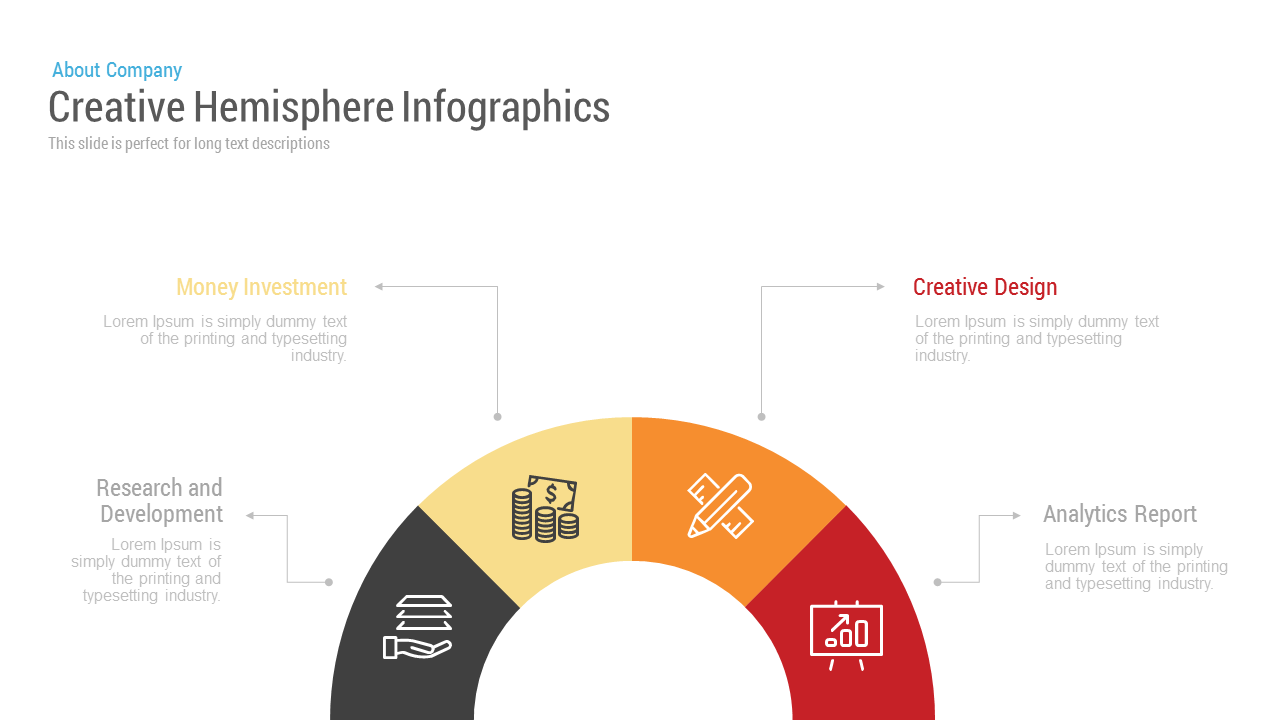
Free Creative Hemisphere Infographics template for PowerPoint & Google Slides
Infographics
Free
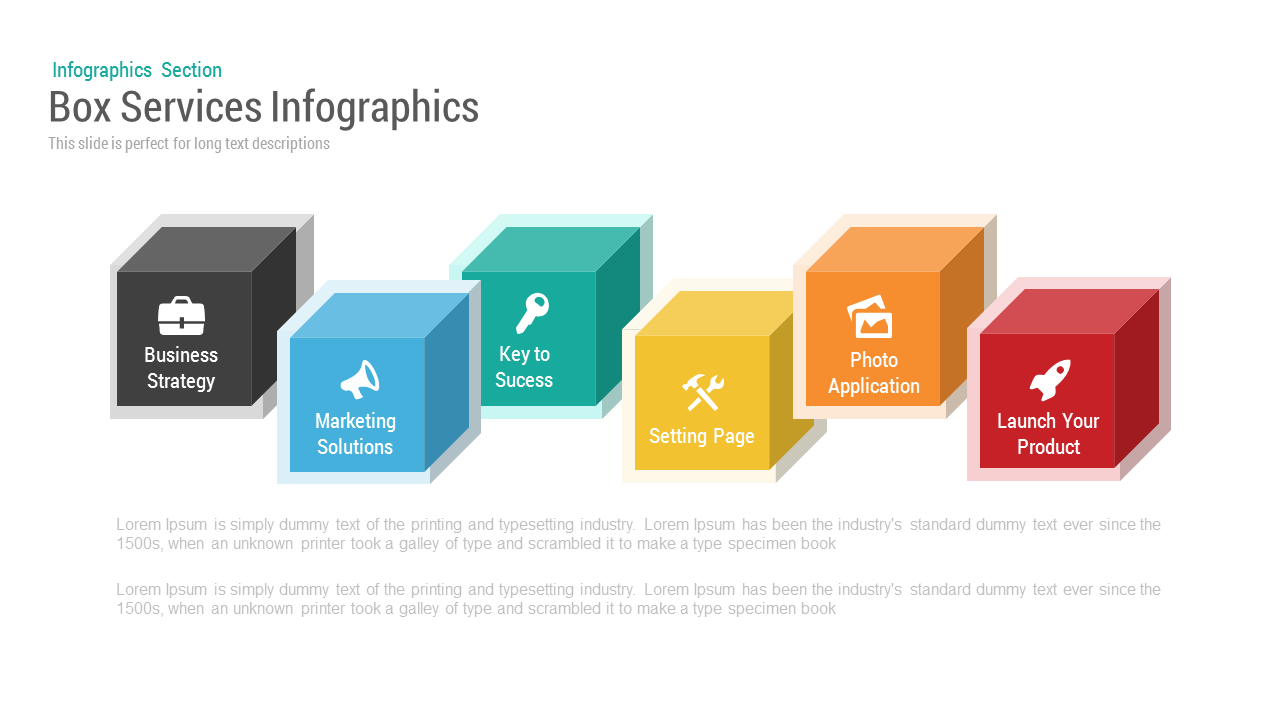
Box Services Infographics template for PowerPoint & Google Slides
Process
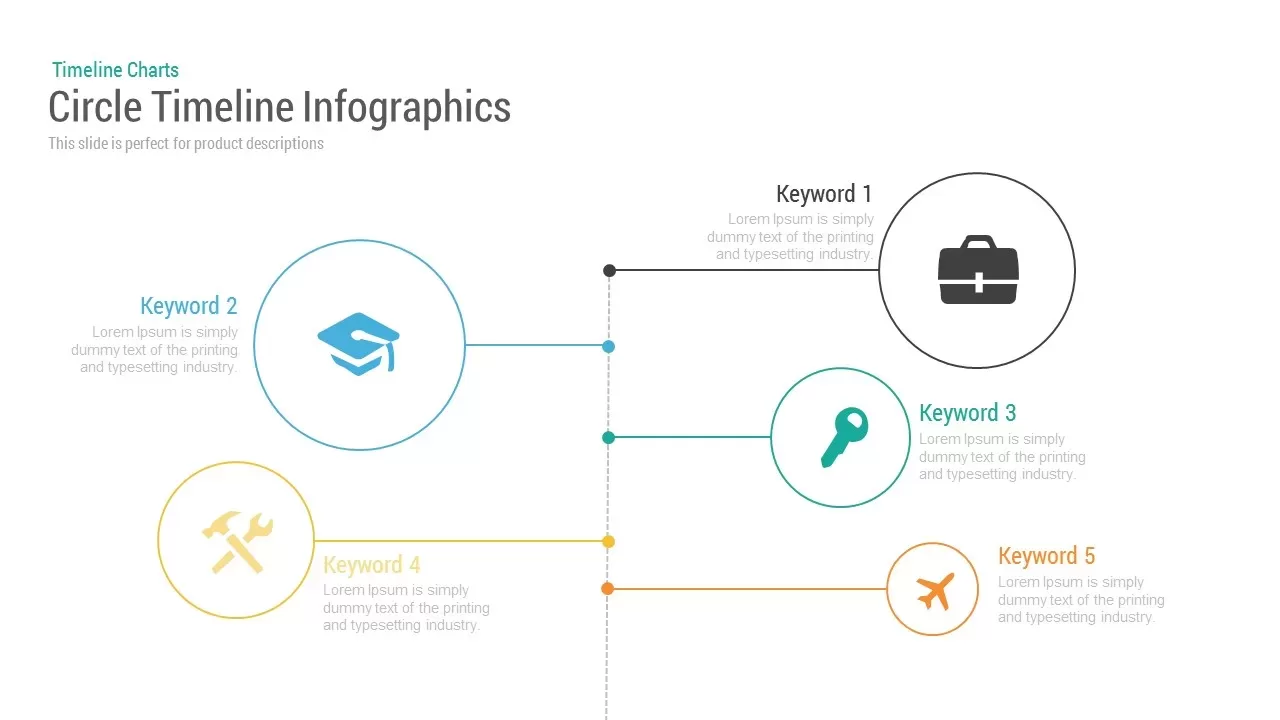
Circle Timeline Infographics template for PowerPoint & Google Slides
Timeline
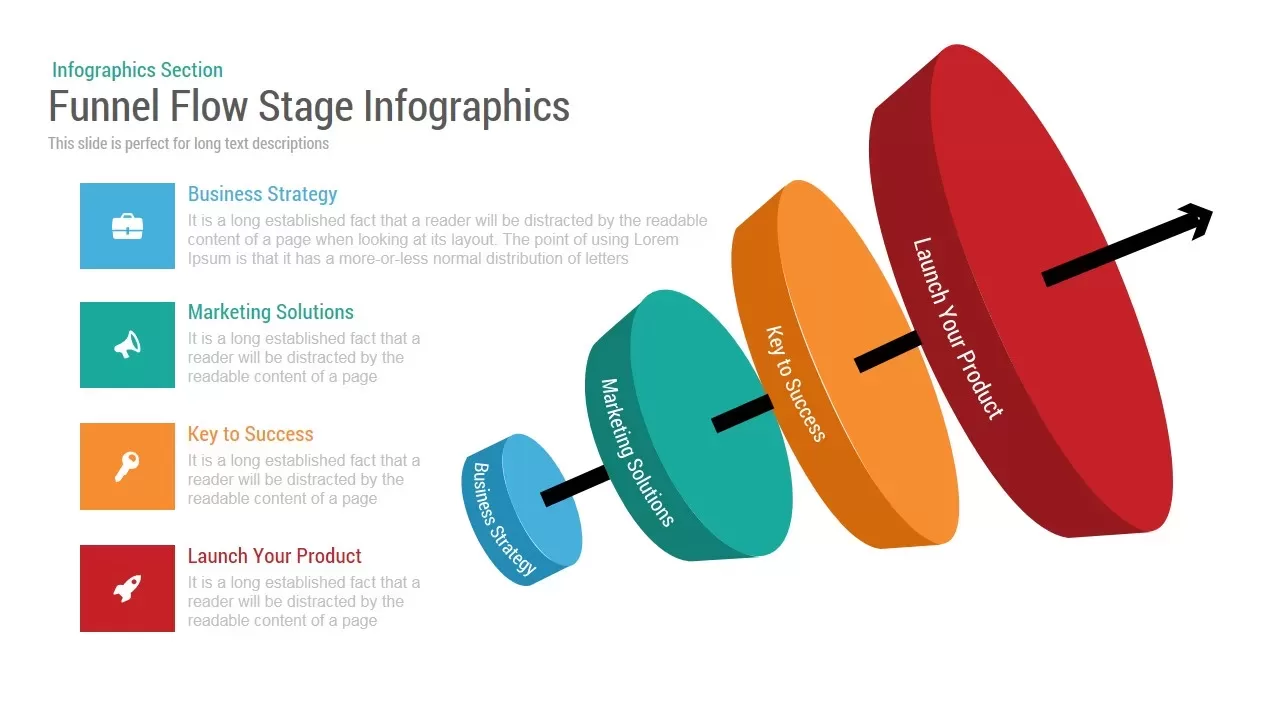
Funnel Flow Stage Infographics template for PowerPoint & Google Slides
Funnel
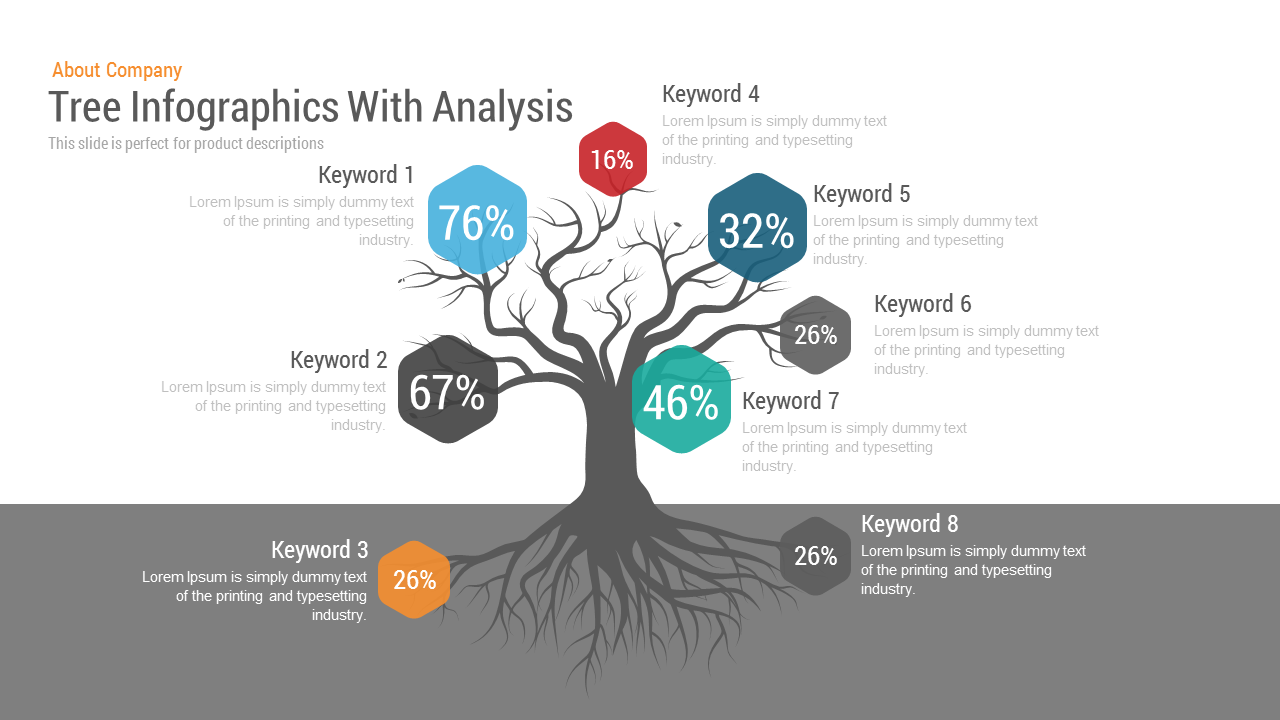
Tree Infographics template for PowerPoint & Google Slides
Decision Tree
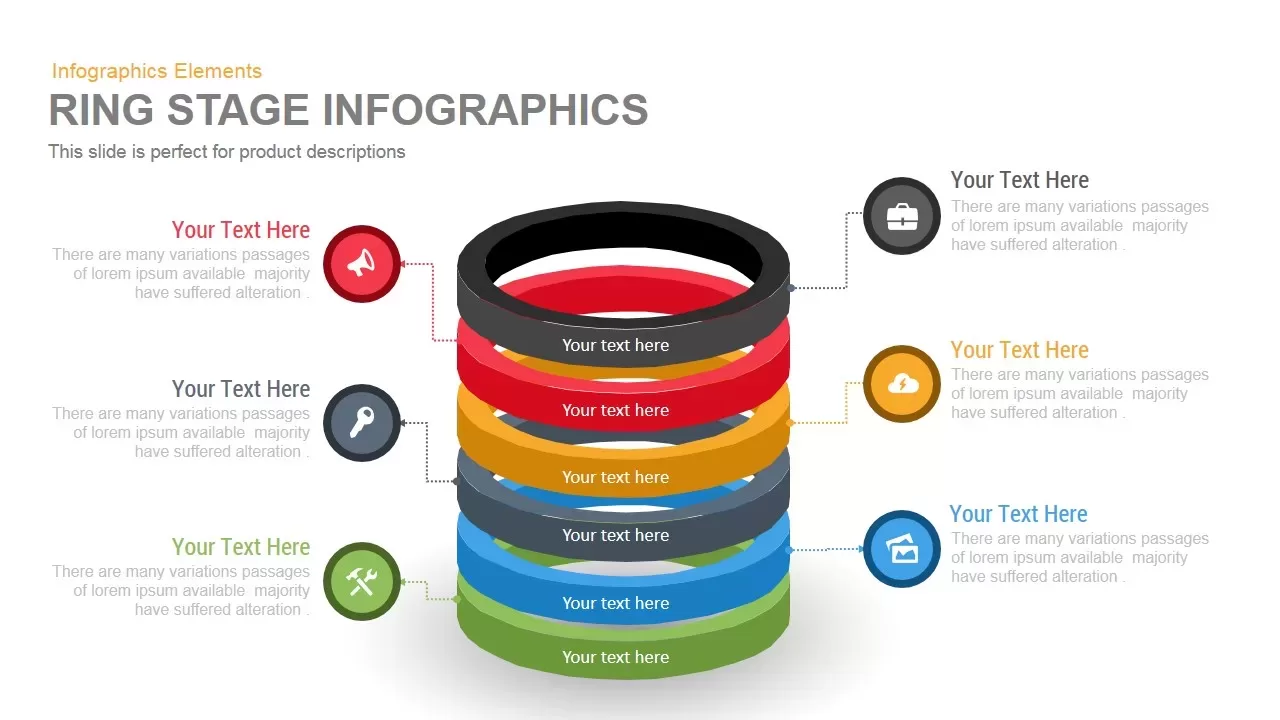
Ring Infographics template for PowerPoint & Google Slides
Circular
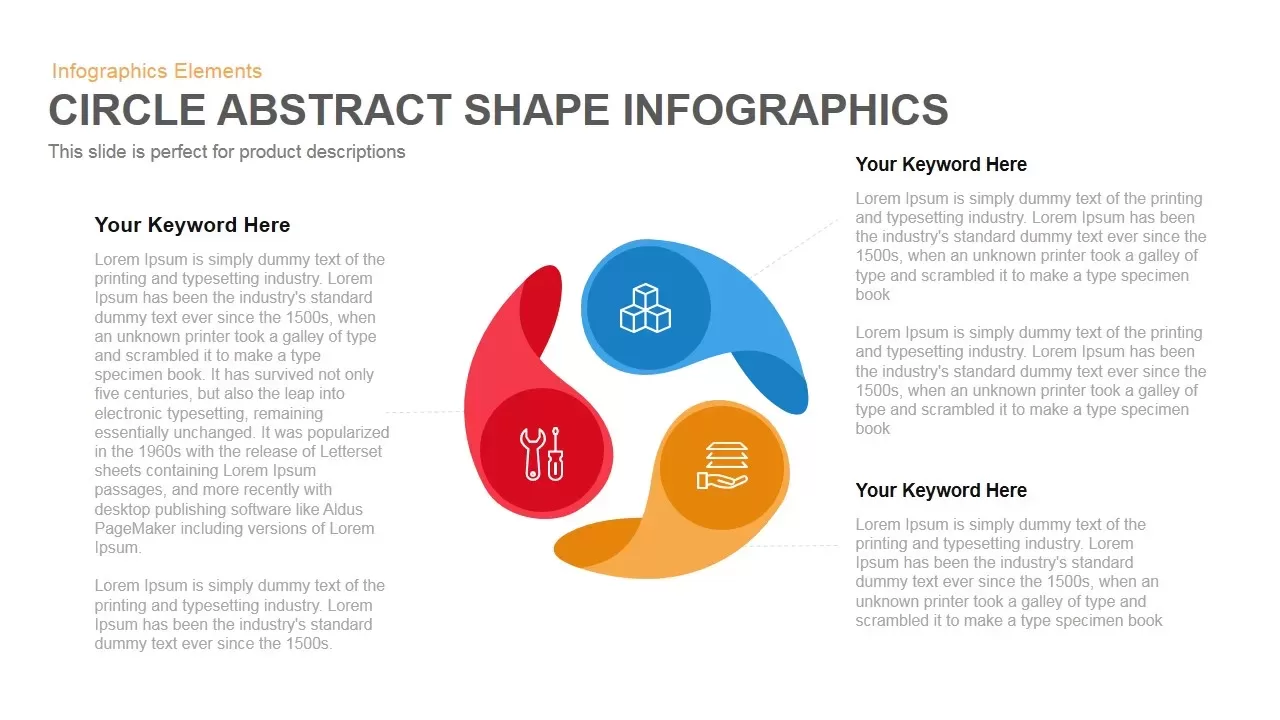
Circle Abstract Shape Infographics Template for PowerPoint & Google Slides
Circular
3D Four Arrow Infographics Diagram Template for PowerPoint & Google Slides
Arrow
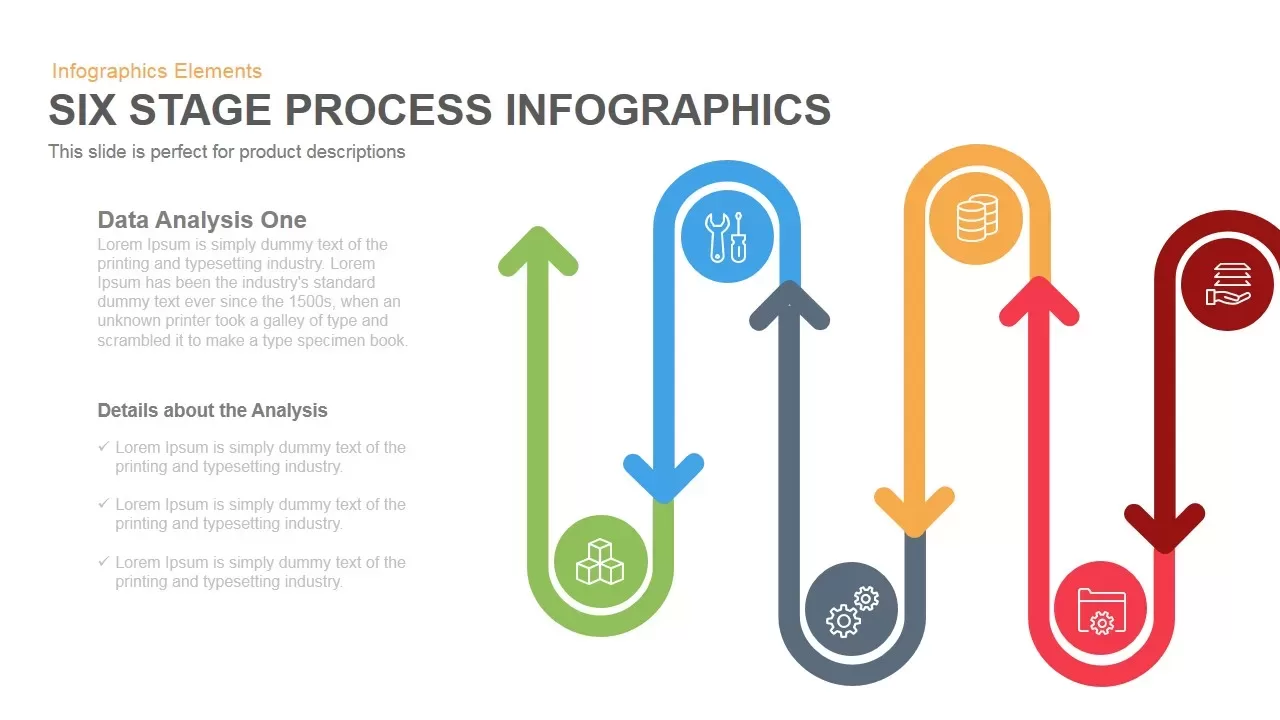
Six-Stage Process Infographics Template for PowerPoint & Google Slides
Process
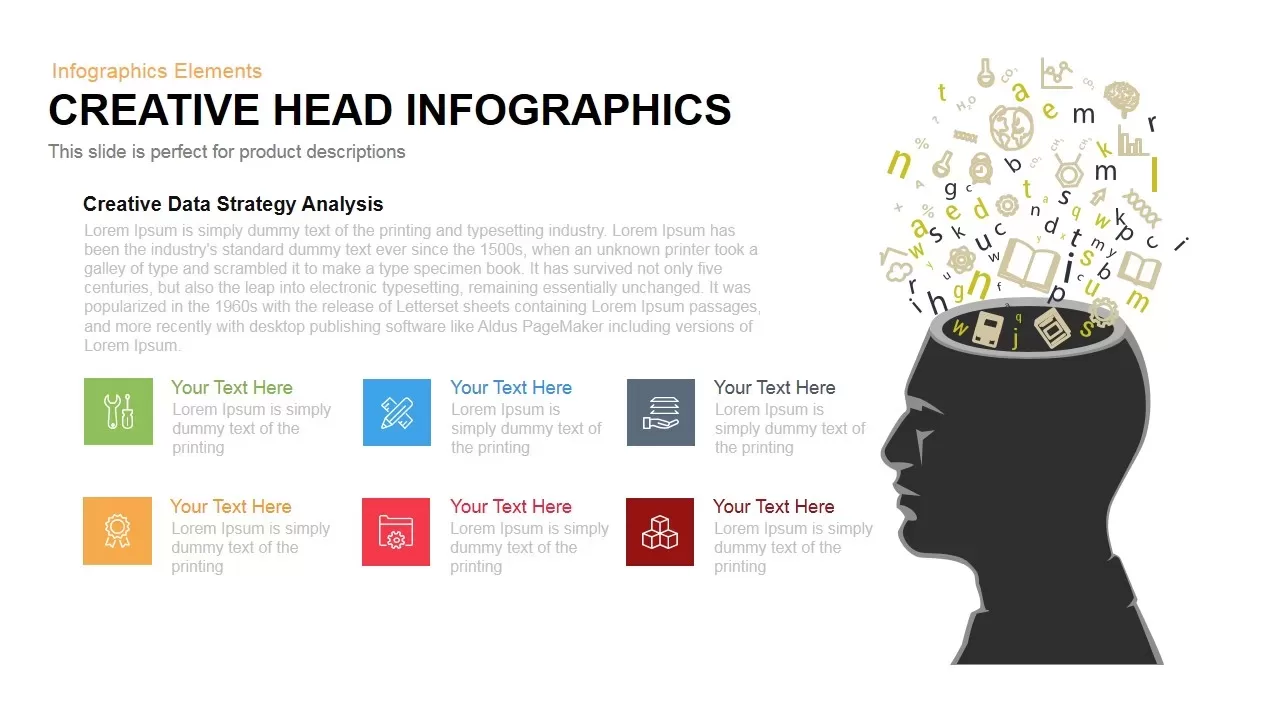
Dynamic Creative Head Infographics Template for PowerPoint & Google Slides
Circular
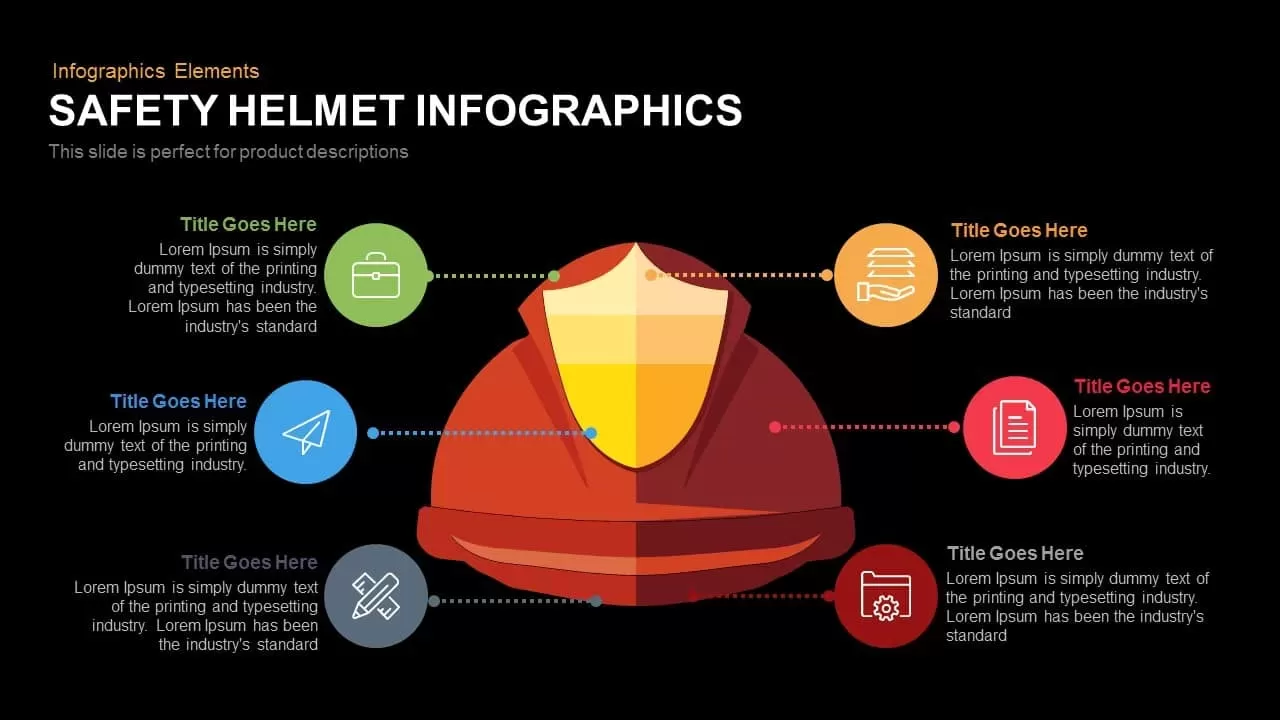
Safety Helmet Infographics Template for PowerPoint & Google Slides
Infographics
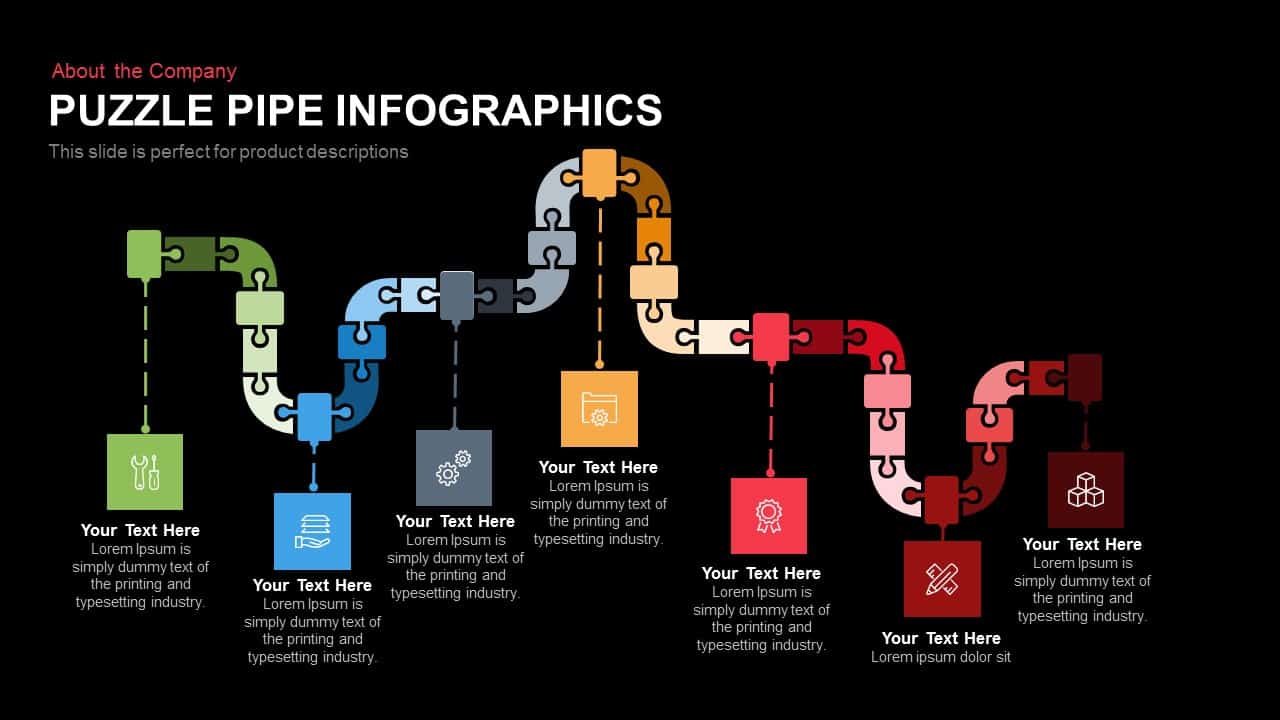
Puzzle Pipe Infographics Process Flow Template for PowerPoint & Google Slides
Process
Four Arrow Square Infographics Template for PowerPoint & Google Slides
Arrow
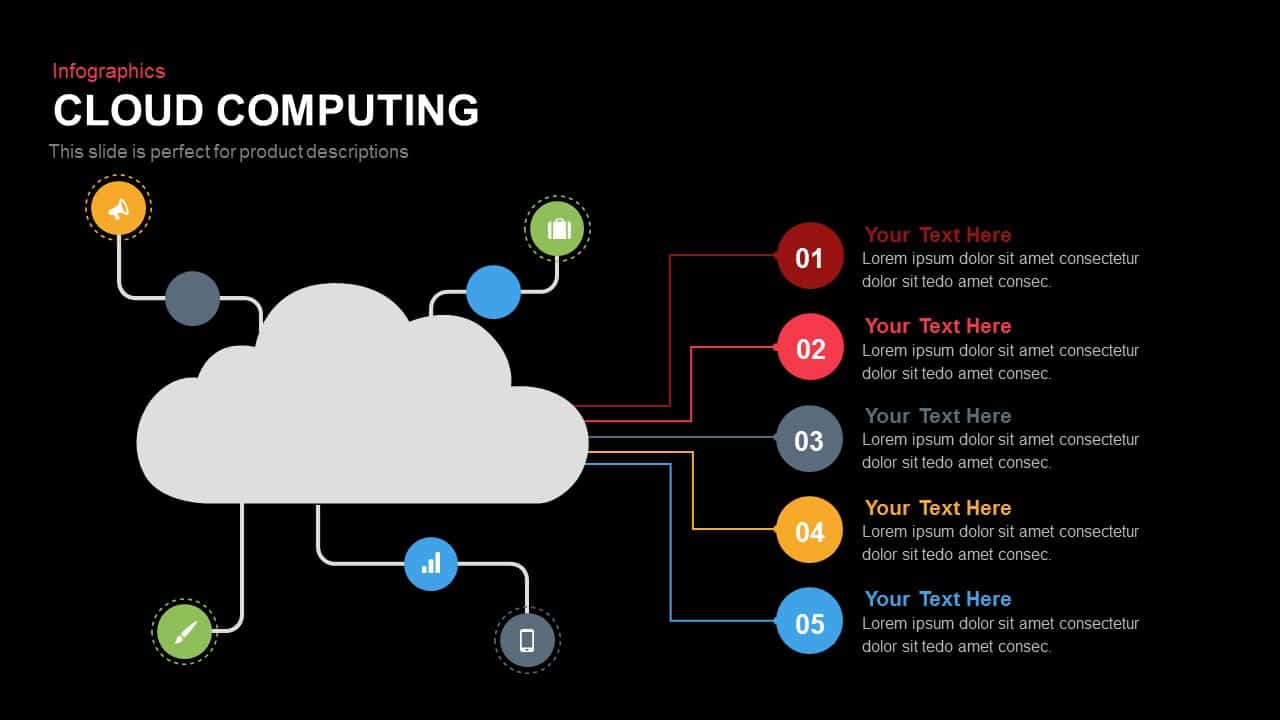
Cloud Computing Infographics template for PowerPoint & Google Slides
Cloud Computing
Brain Gear Hub-and-Spoke Infographics template for PowerPoint & Google Slides
Org Chart
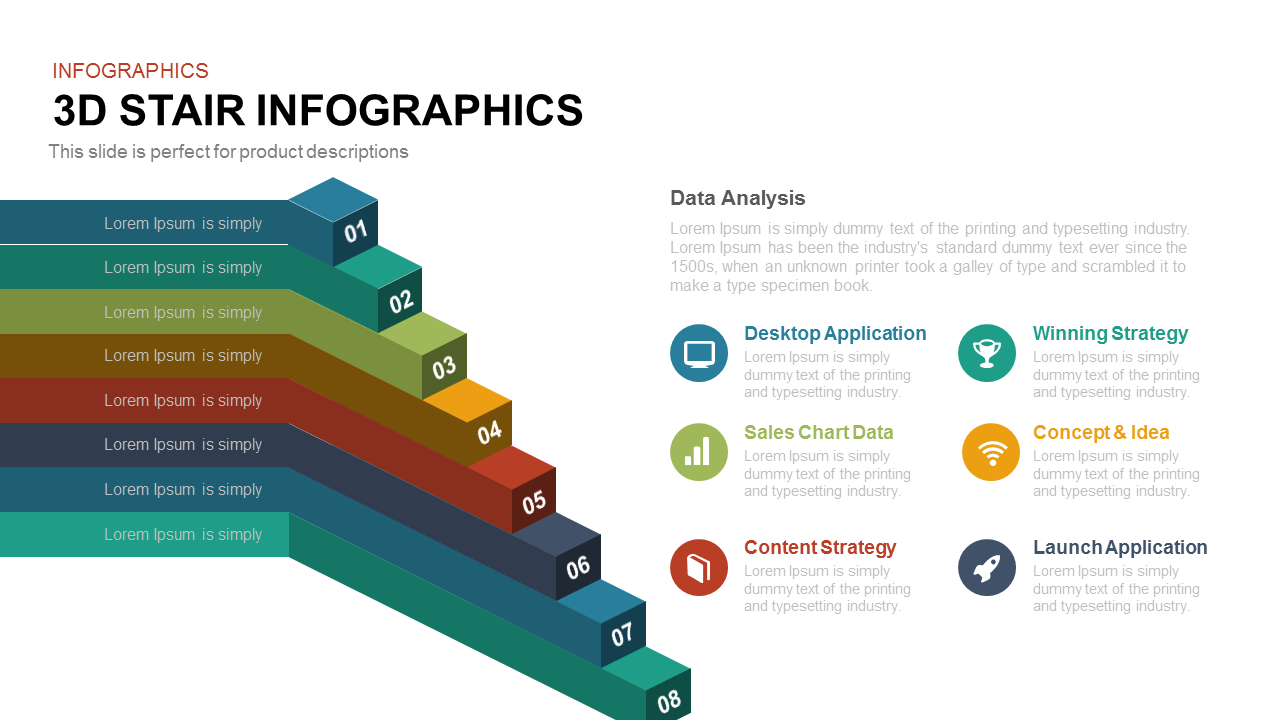
8-Step 3D Stair Infographics Slide template for PowerPoint & Google Slides
Process
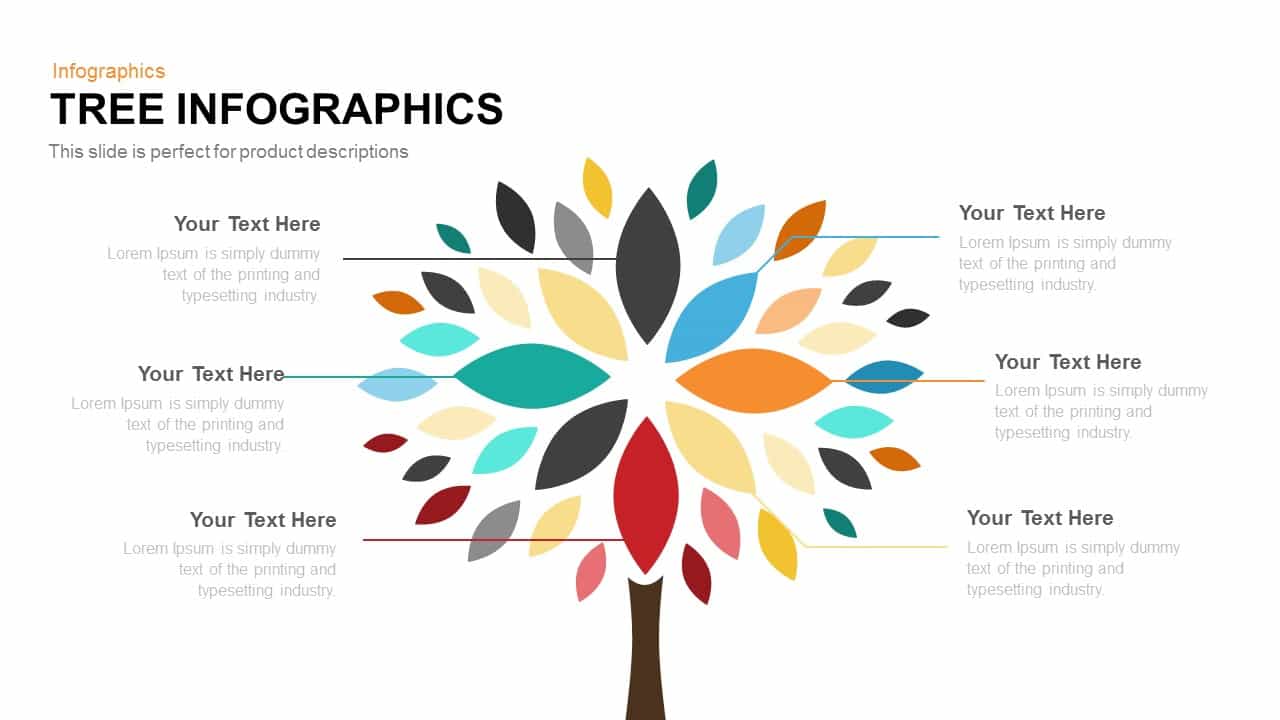
Tree Infographics template for PowerPoint & Google Slides
Infographics
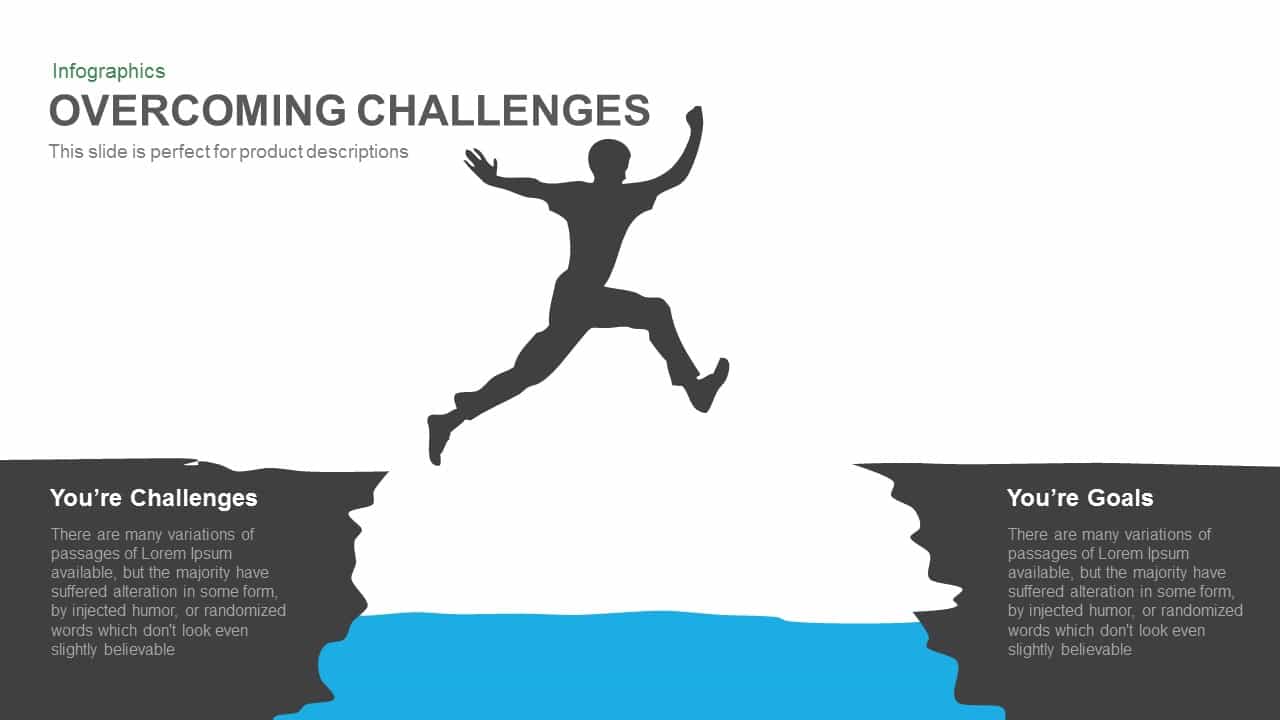
Overcoming Challenges Infographics template for PowerPoint & Google Slides
Opportunities Challenges
Multi-Stage Timeline Infographics Template for PowerPoint & Google Slides
Timeline
Five-Stage Arrow Infographics Timeline Template for PowerPoint & Google Slides
Arrow
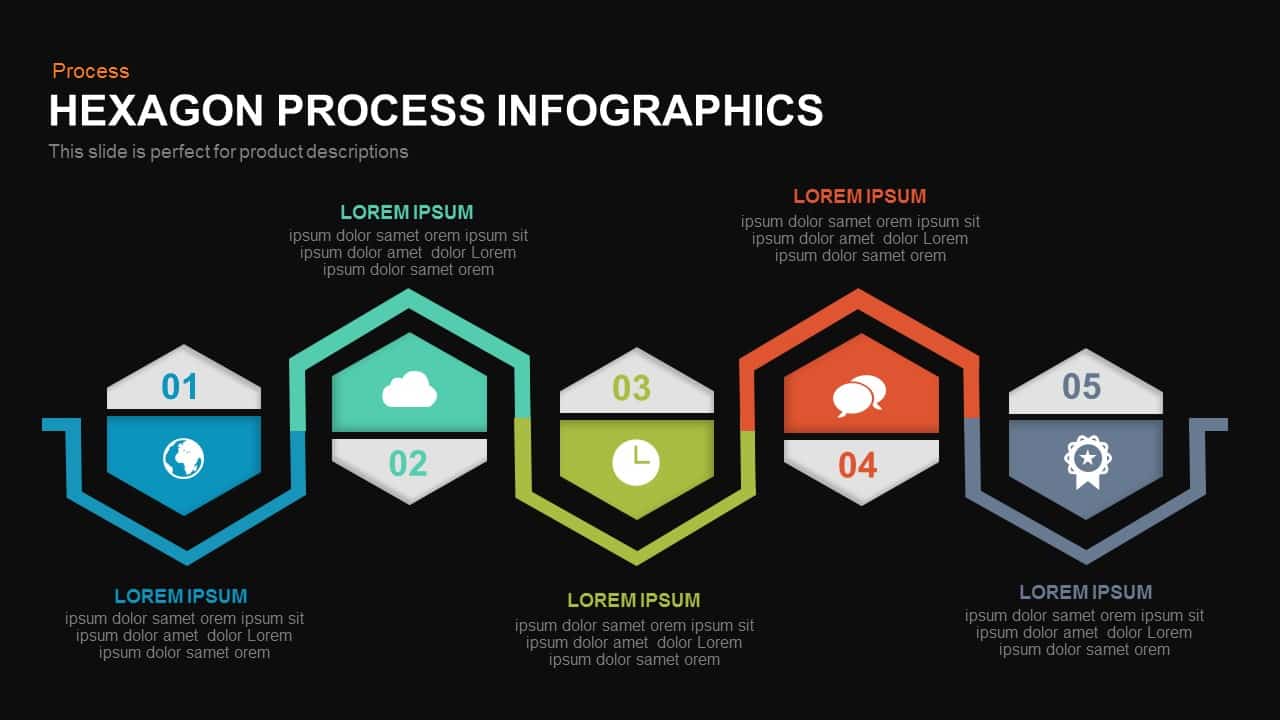
Five-Stage Hexagon Process Infographics template for PowerPoint & Google Slides
Process
Five-Stage Pyramid Infographics Diagram Template for PowerPoint & Google Slides
Pyramid
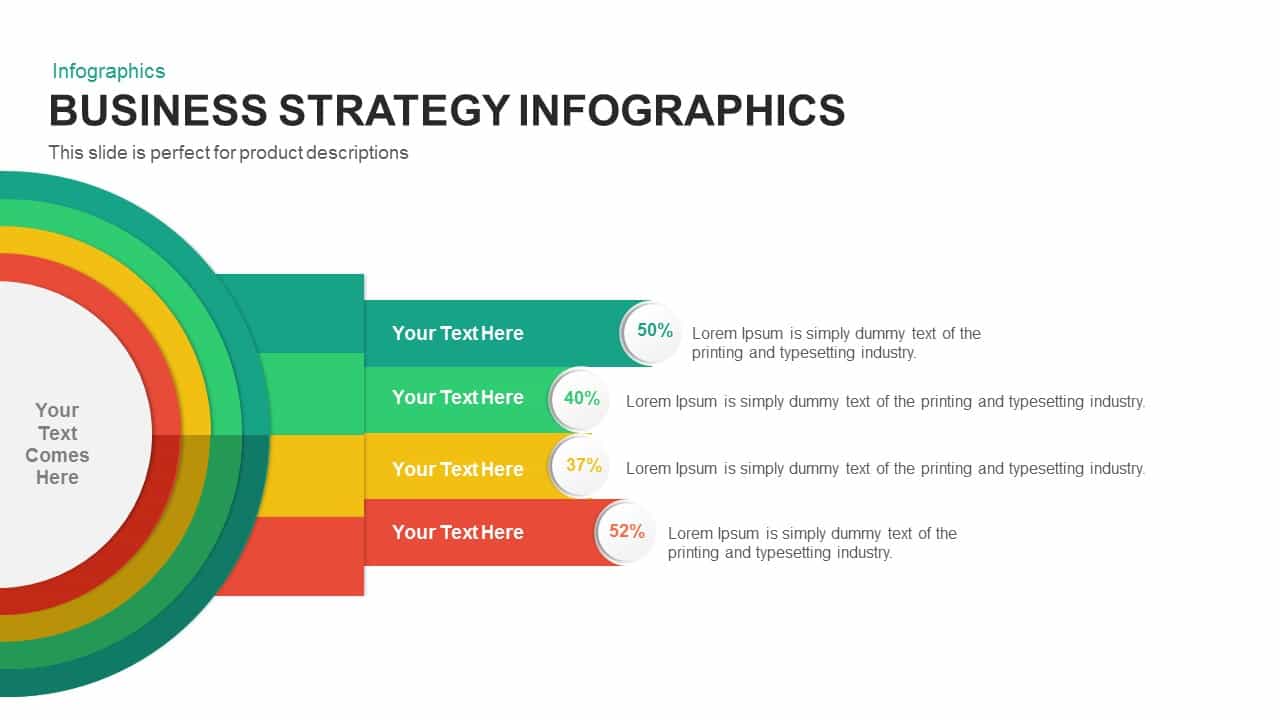
Business Strategy Infographics Diagram Template for PowerPoint & Google Slides
Business Strategy
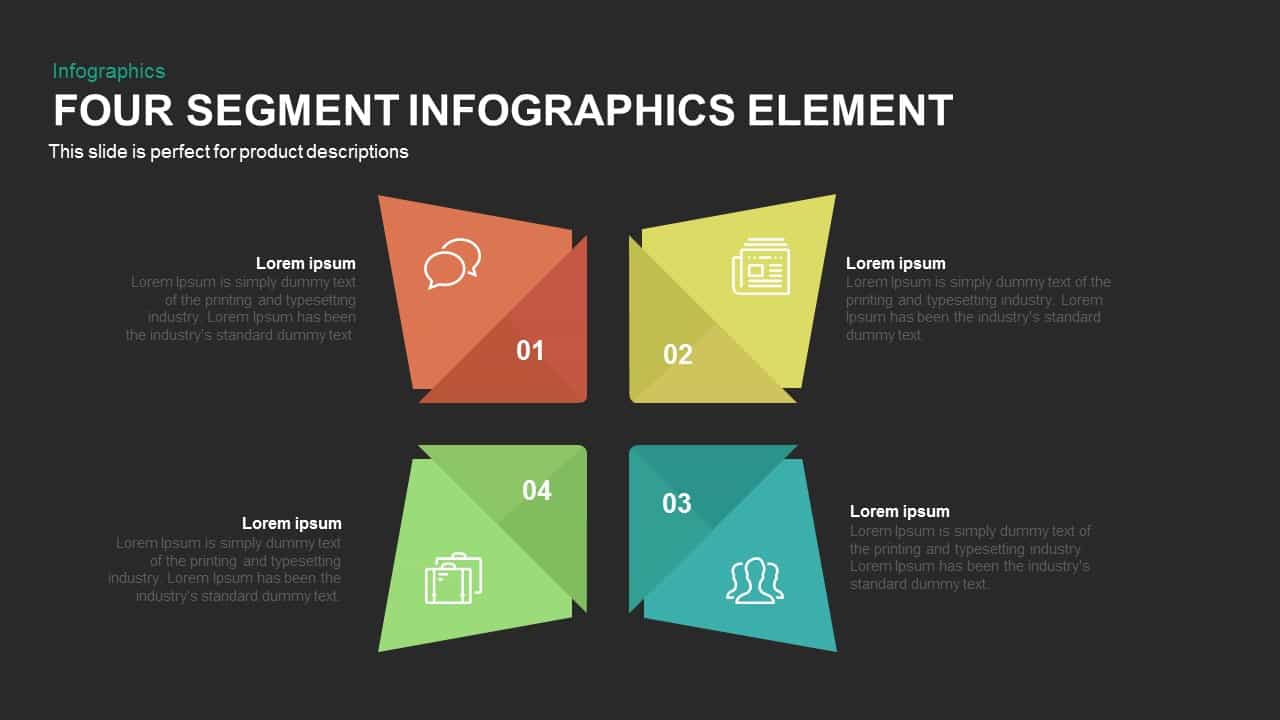
Four Segment Infographics Element Template for PowerPoint & Google Slides
Comparison
Six-Stage Time Arrow Infographics Template for PowerPoint & Google Slides
Arrow
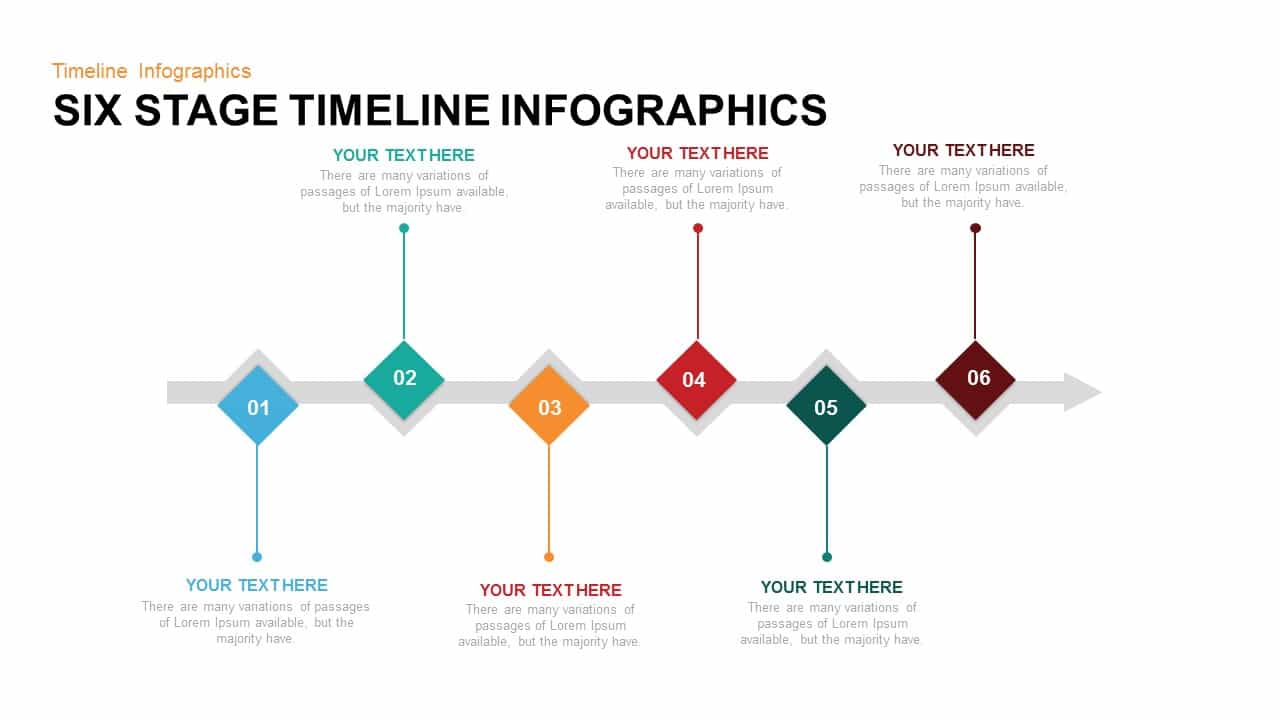
Six Stage Timeline Infographics Template for PowerPoint & Google Slides
Timeline
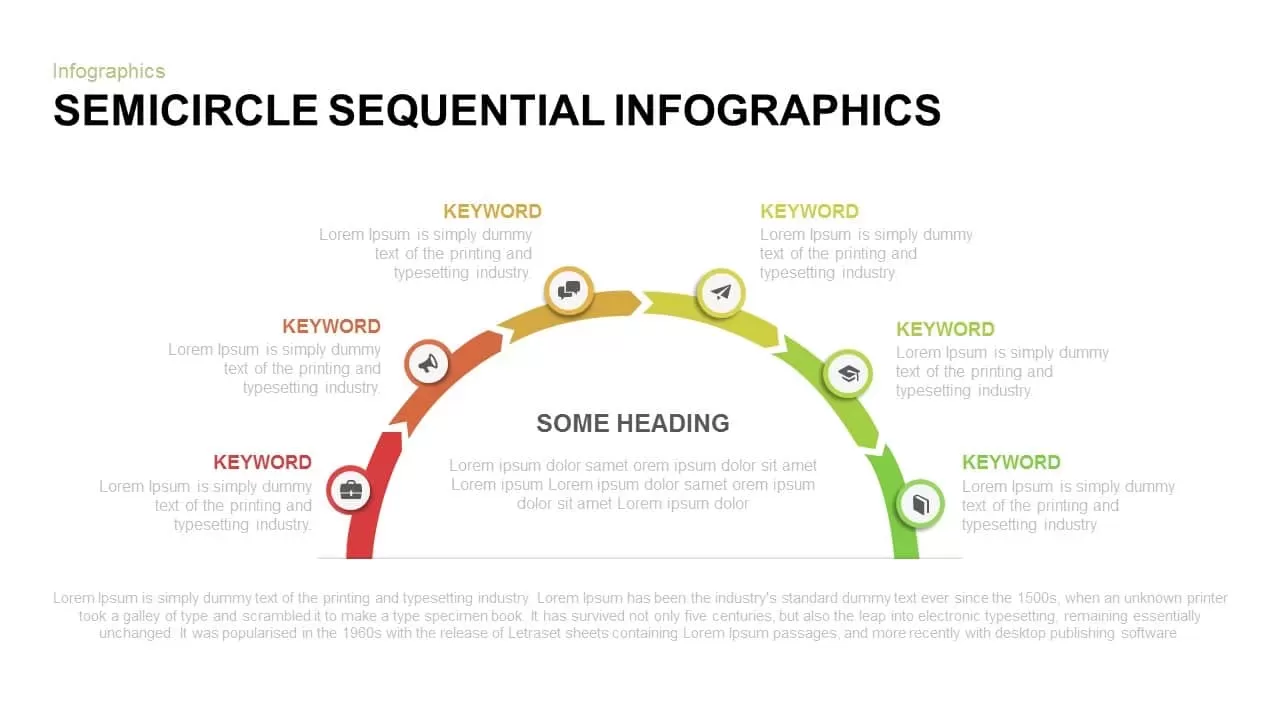
Semicircle Sequential Infographics Template for PowerPoint & Google Slides
Arrow
3D Arrow Infographics template for PowerPoint & Google Slides
Arrow
Layer Infographics template for PowerPoint & Google Slides
Process
Free Layer Infographics template for PowerPoint & Google Slides
Process
Free

Seven-Stage Timeline Infographics Template for PowerPoint & Google Slides
Timeline
Linear Chain Link Infographics Template for PowerPoint & Google Slides
Process
Circular Timeline Infographics Template for PowerPoint & Google Slides
Timeline
Free Professional Cloud Infographics Template for PowerPoint & Google Slides
Process
Free
Growth Plant Infographics template for PowerPoint & Google Slides
Process
Business Innovation Infographics template for PowerPoint & Google Slides
Process
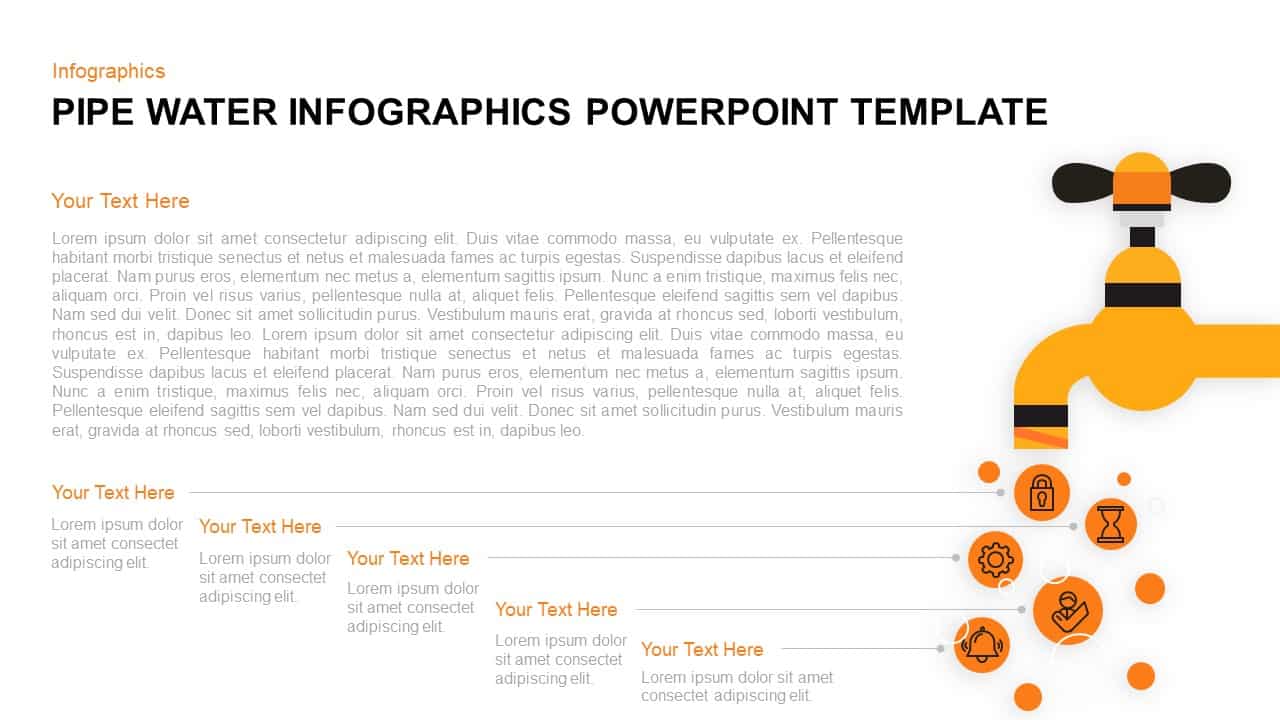
Pipe Water Infographics Flow Diagram Template for PowerPoint & Google Slides
Process
Five-Stage Pyramid Infographics Process Template for PowerPoint & Google Slides
Pyramid
Mobile Infographics Data Visualization Template for PowerPoint & Google Slides
Infographics
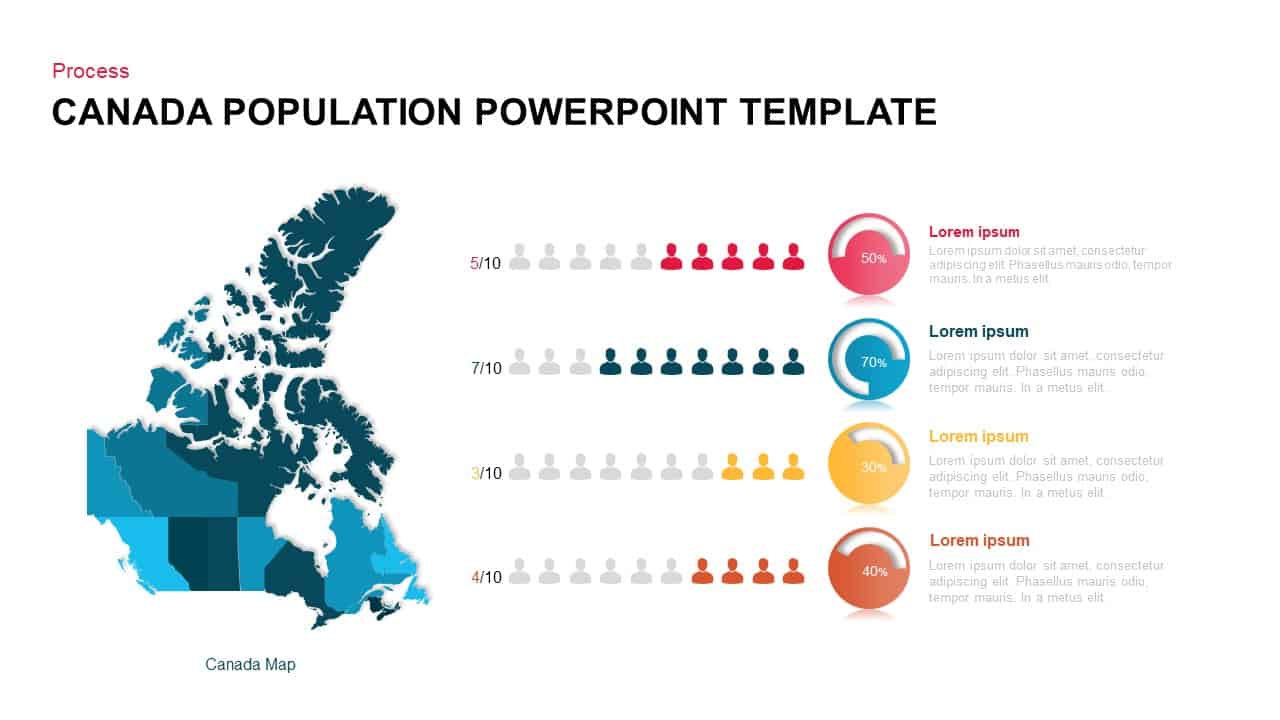
Canada Population Infographics Template for PowerPoint & Google Slides
World Maps
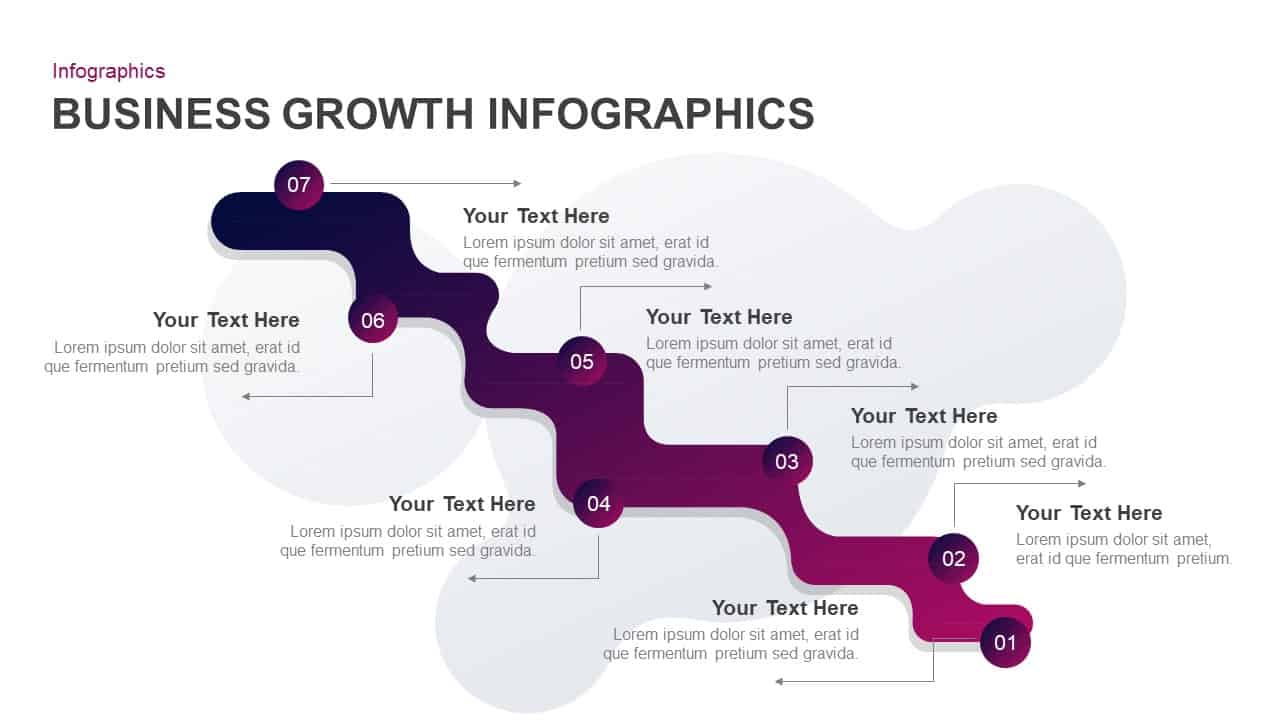
Business Growth Infographics Template for PowerPoint & Google Slides
Roadmap
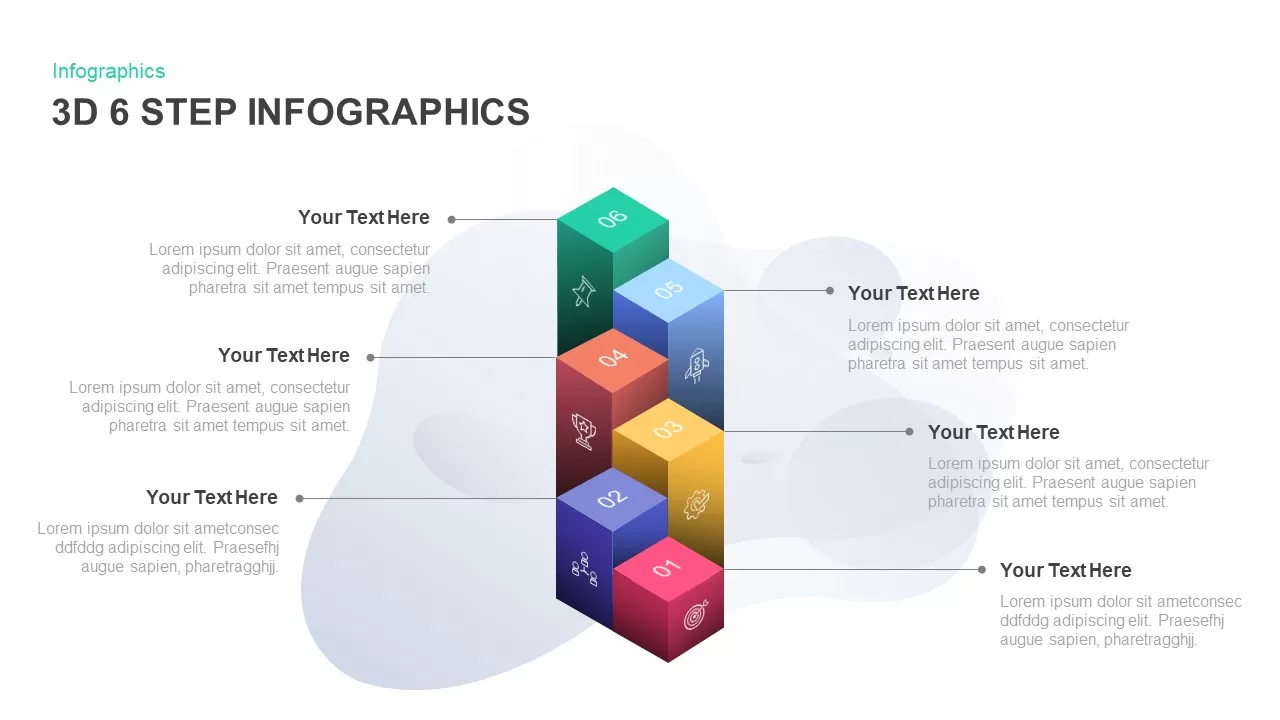
3D 6-Step Infographics Process Diagram Template for PowerPoint & Google Slides
Infographics
Six-Step Purple Gradient Infographics Template for PowerPoint & Google Slides
Process
Recruitment Process Funnel Infographics Template for PowerPoint & Google Slides
Recruitment
Vertical Process Infographics Template for PowerPoint & Google Slides
Process
Recruitment Process Infographics Template for PowerPoint & Google Slides
Process
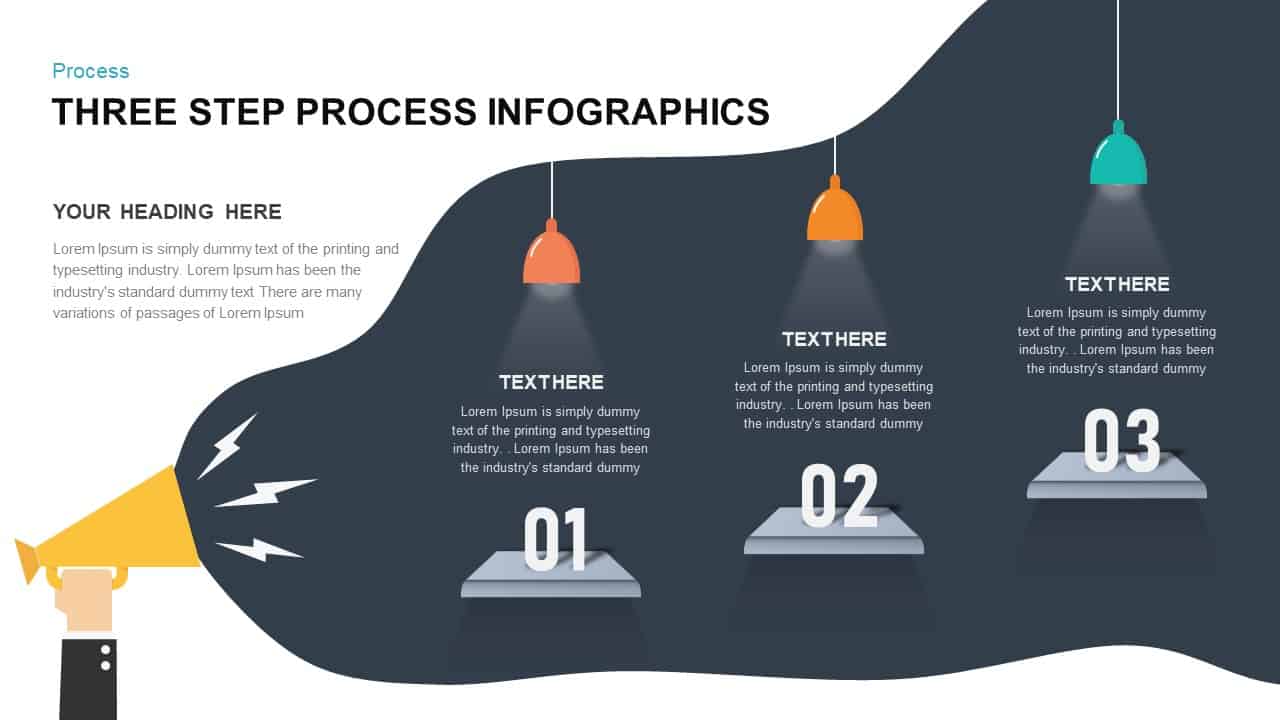
Three-Step Process Infographics Template for PowerPoint & Google Slides
Process
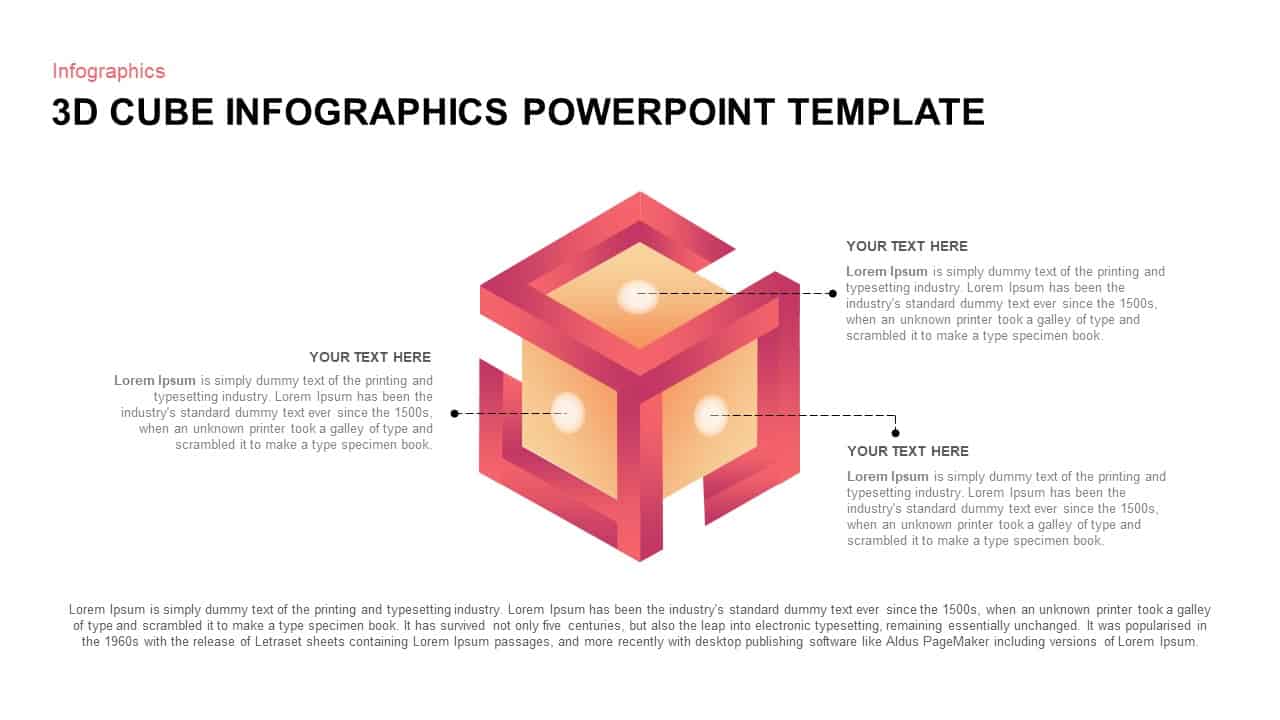
3D Cube Infographics template for PowerPoint & Google Slides
Process
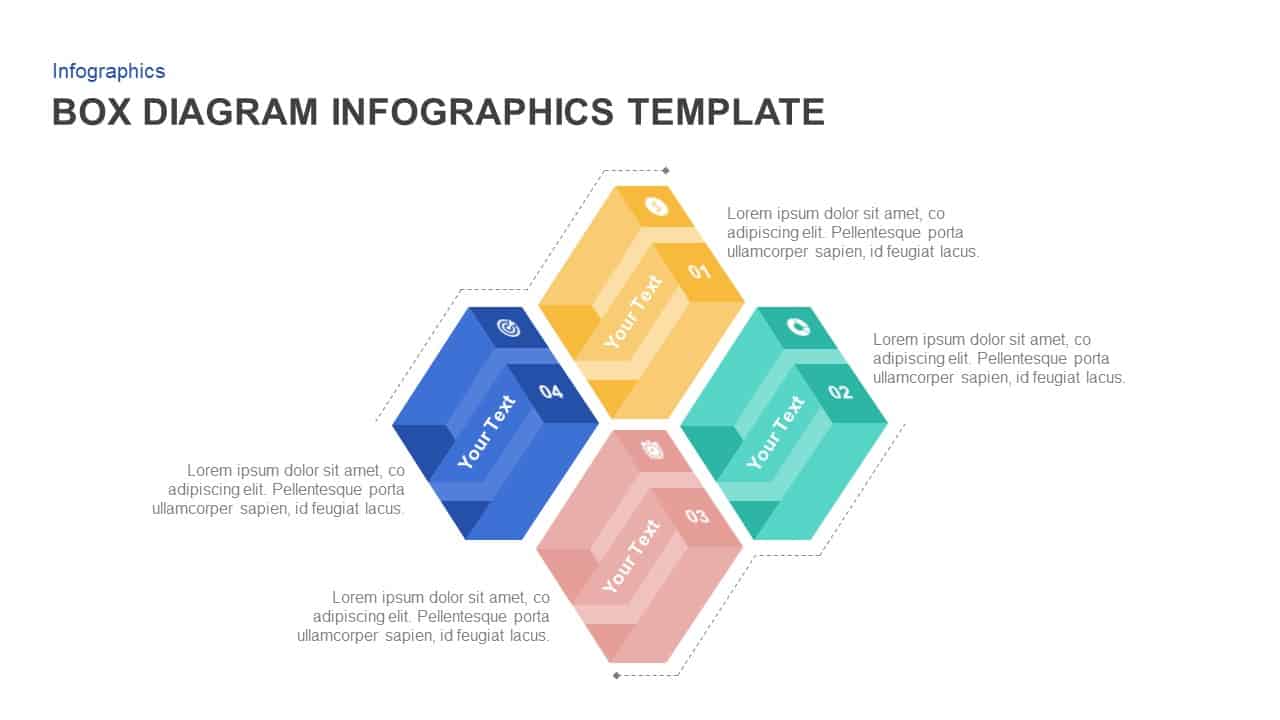
Box Diagram Infographics template for PowerPoint & Google Slides
Business

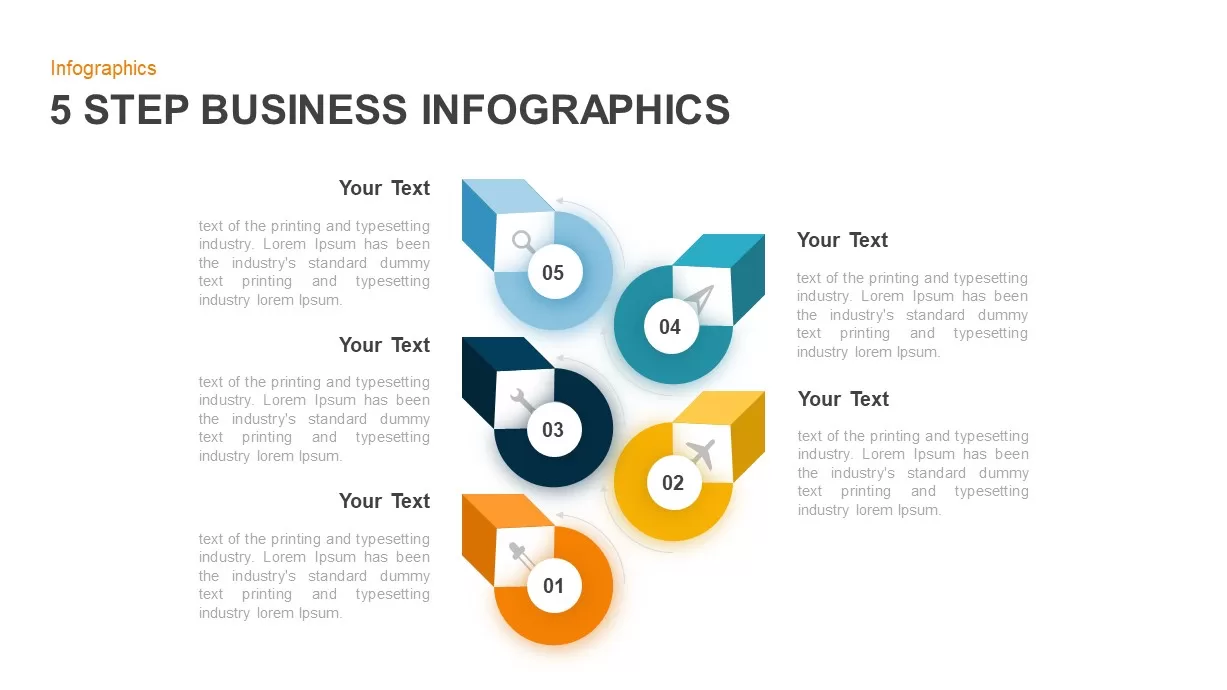
Five-Step Business Infographics Template for PowerPoint & Google Slides
Infographics
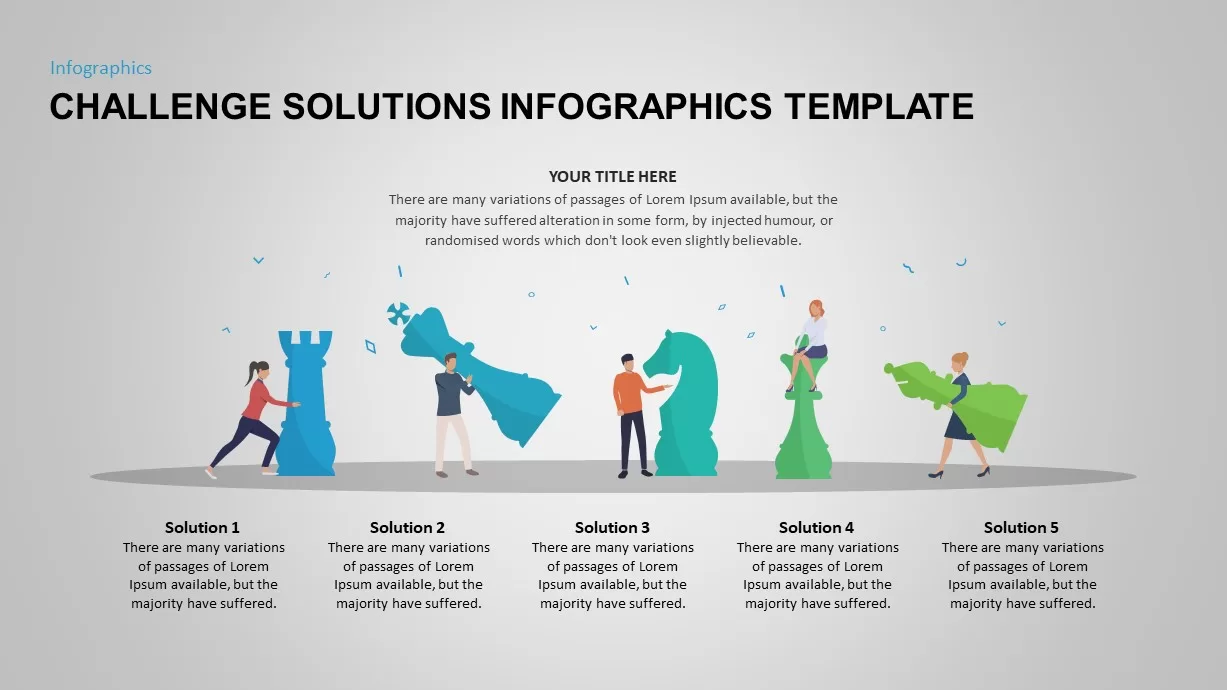
Challenge Solutions Infographics Template for PowerPoint & Google Slides
Opportunities Challenges
Four-Step Circular Process Infographics Template for PowerPoint & Google Slides
Circular
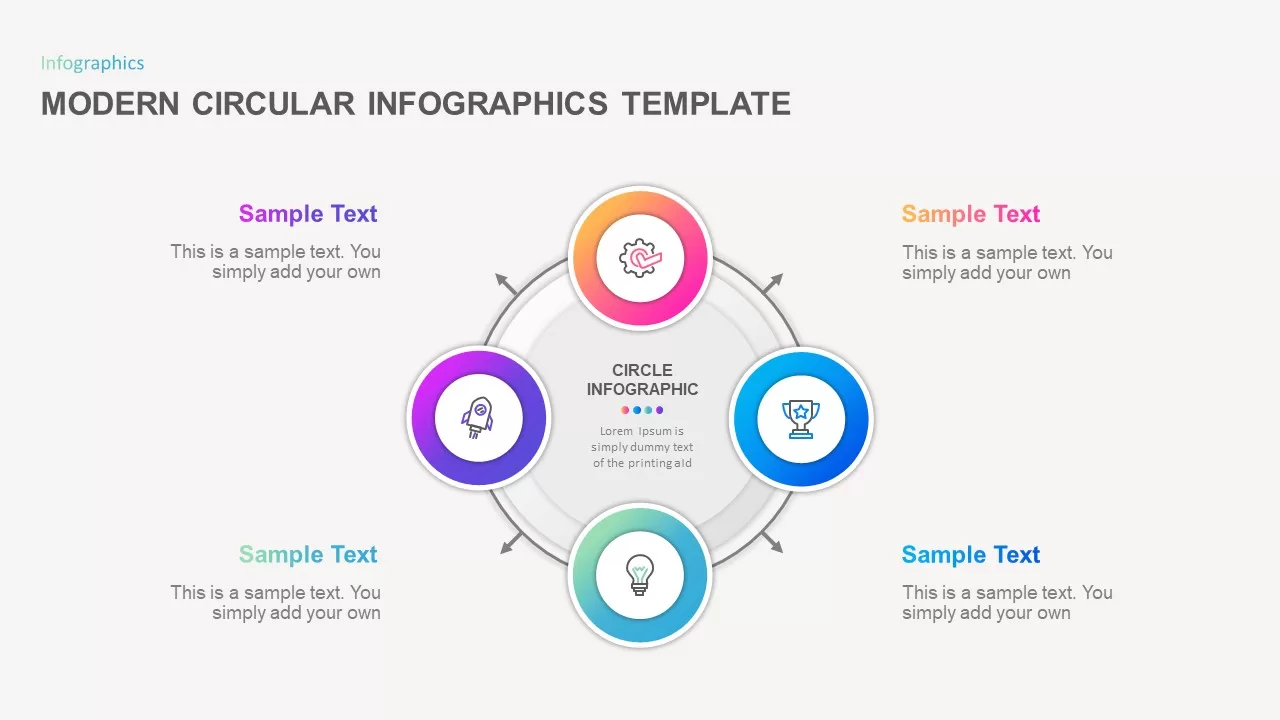
Modern Circular Infographics Template for PowerPoint & Google Slides
Circular
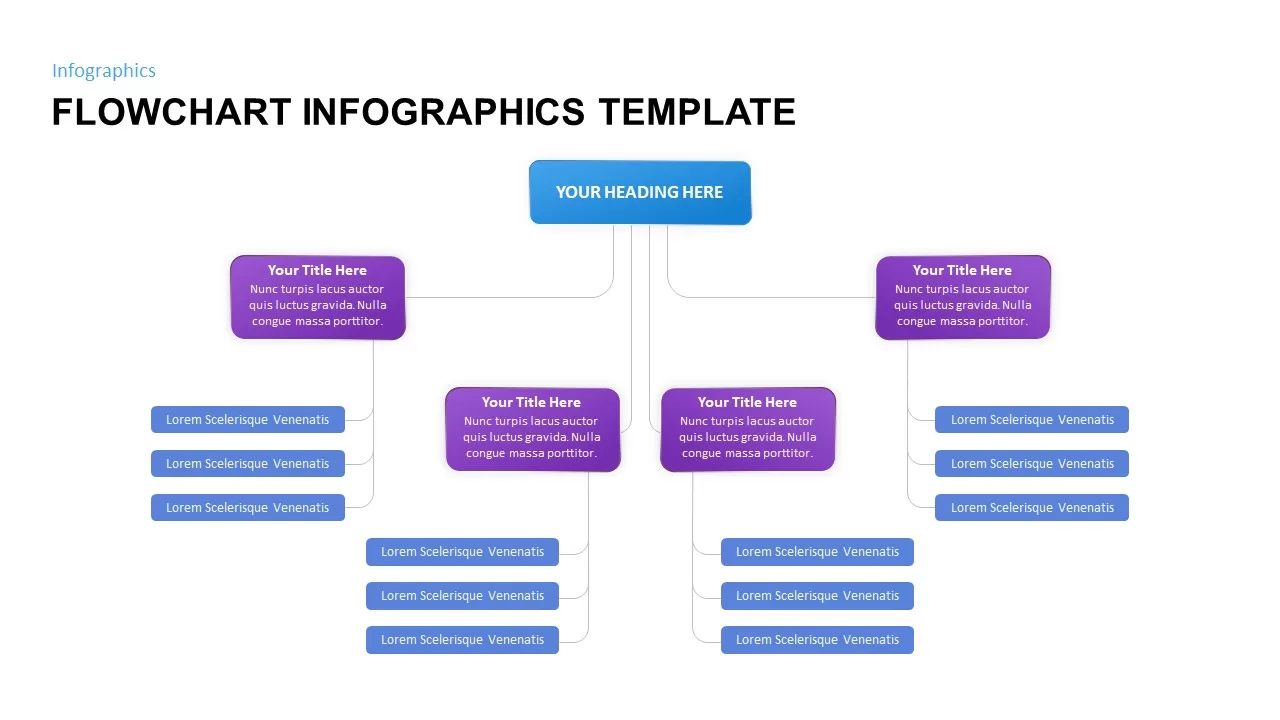
Flowchart Infographics Template for PowerPoint & Google Slides
Infographics
Five-Step Circular Badge Infographics Template for PowerPoint & Google Slides
Circular
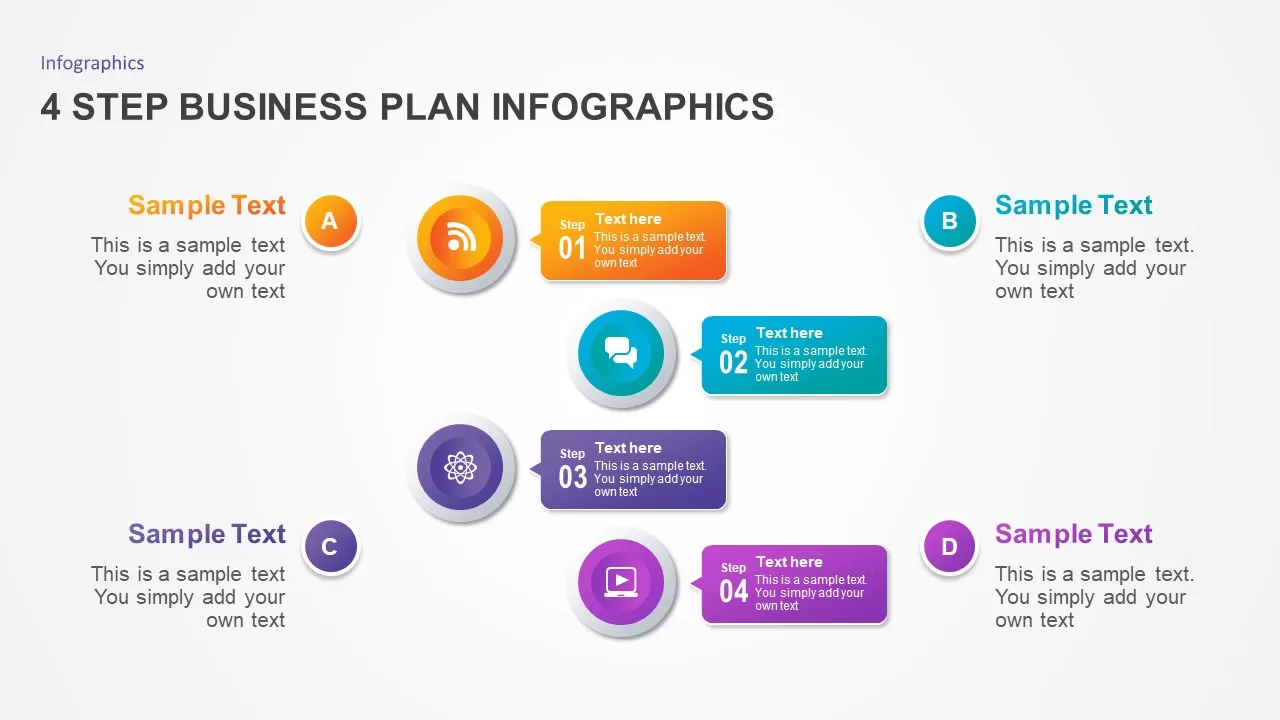
Four-Step Business Plan Infographics Template for PowerPoint & Google Slides
Business Plan
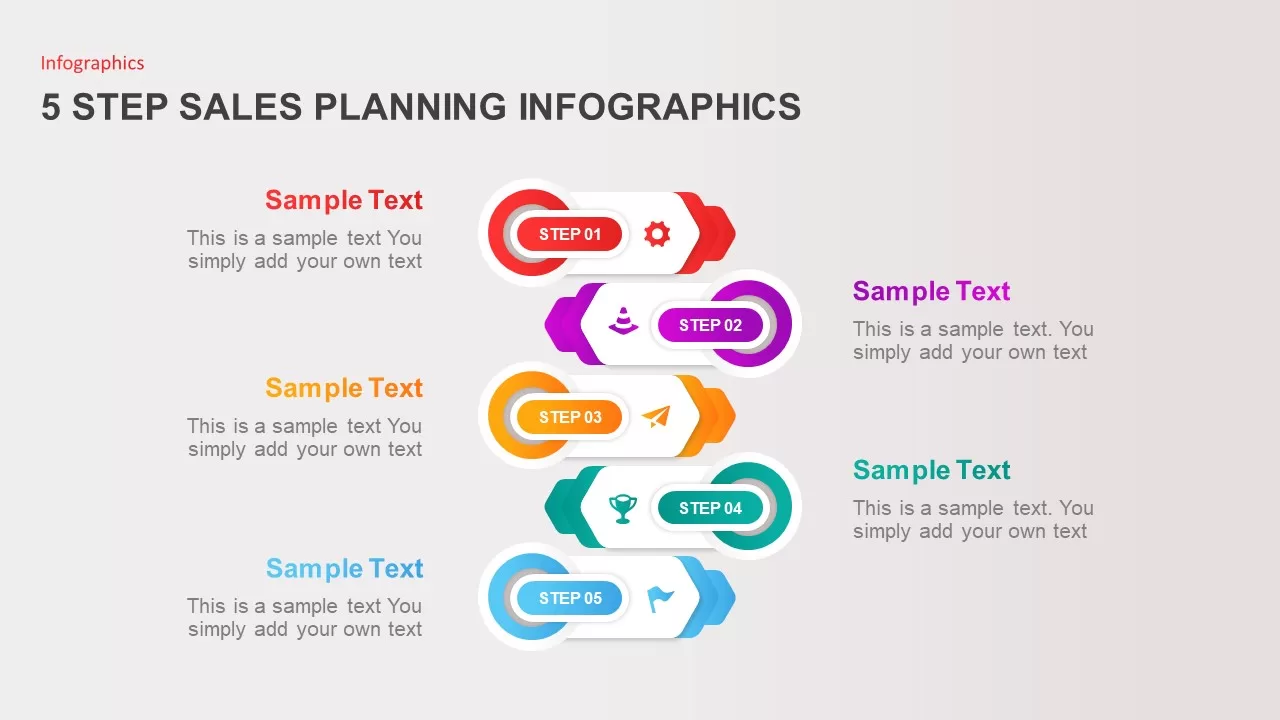
5 Step Sales Planning Infographics Template for PowerPoint & Google Slides
Process
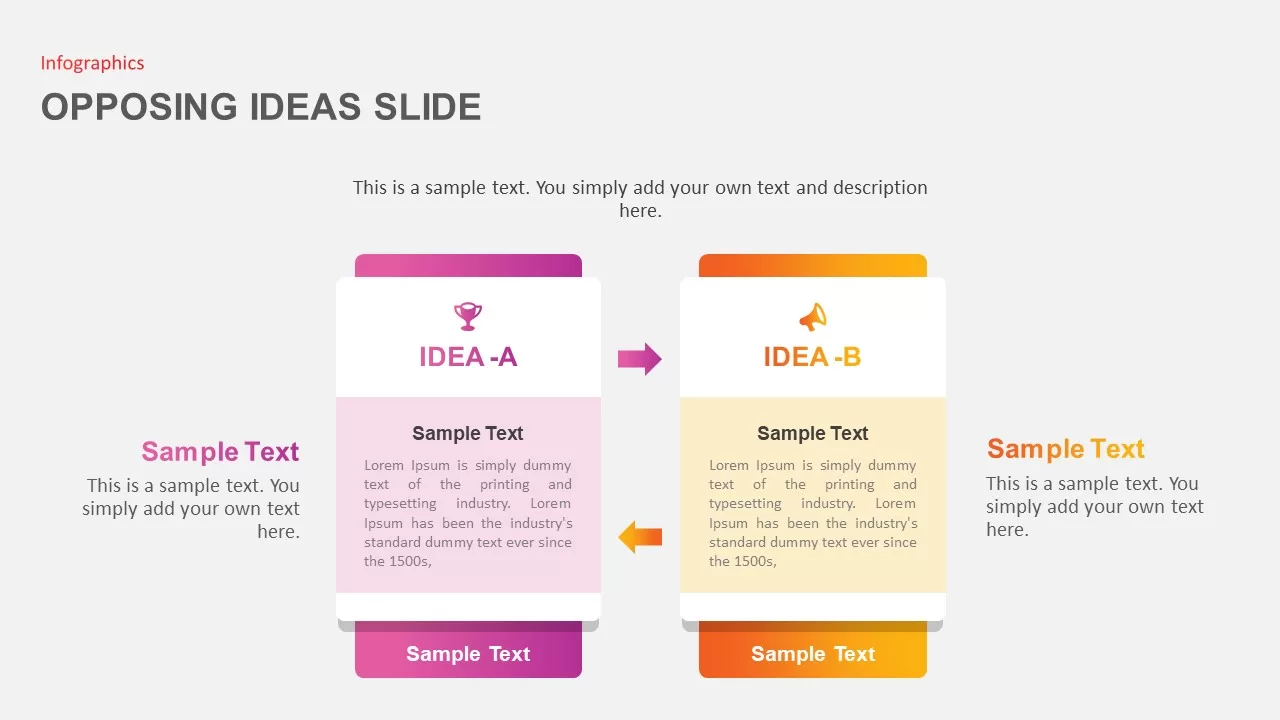
Opposing Ideas Infographics Pack Template for PowerPoint & Google Slides
Comparison
Business Growth Plant Infographics Pack Template for PowerPoint & Google Slides
Process
8-Step Circular Diagram Infographics Template for PowerPoint & Google Slides
Circular
Dynamic Gear Diagram Infographics Template for PowerPoint & Google Slides
Process
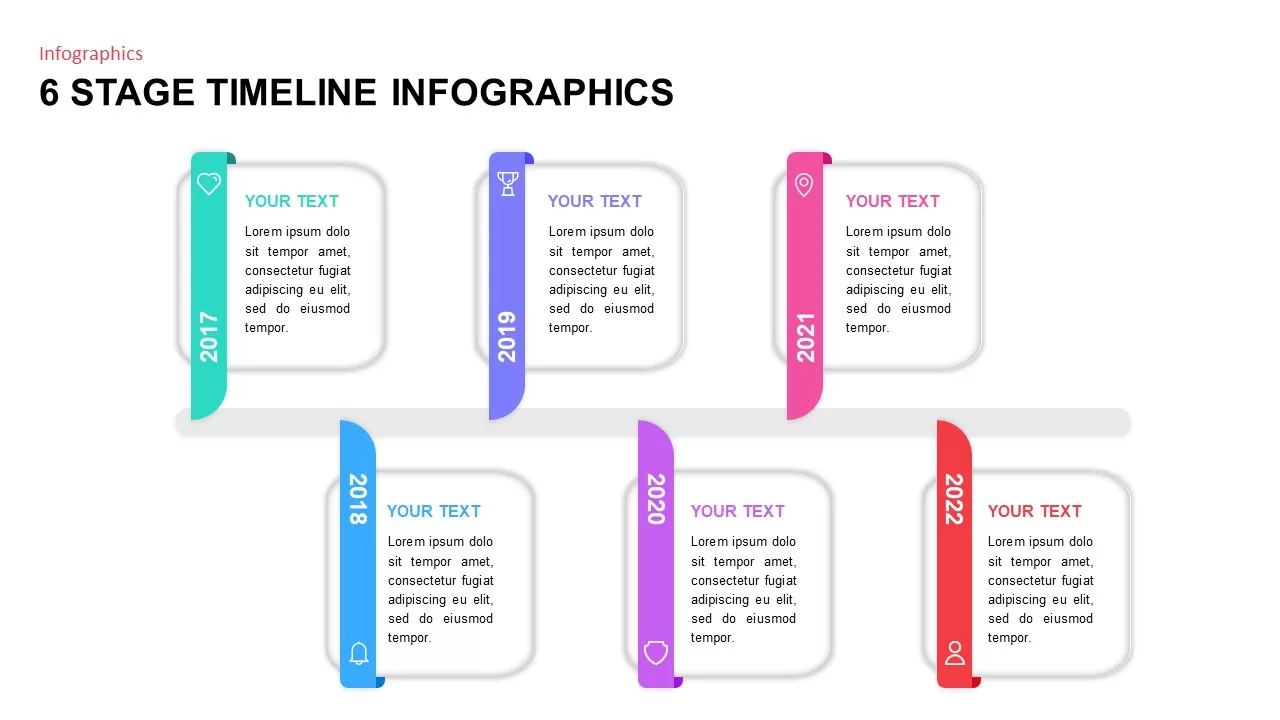
6 Stage Timeline Infographics template for PowerPoint & Google Slides
Timeline
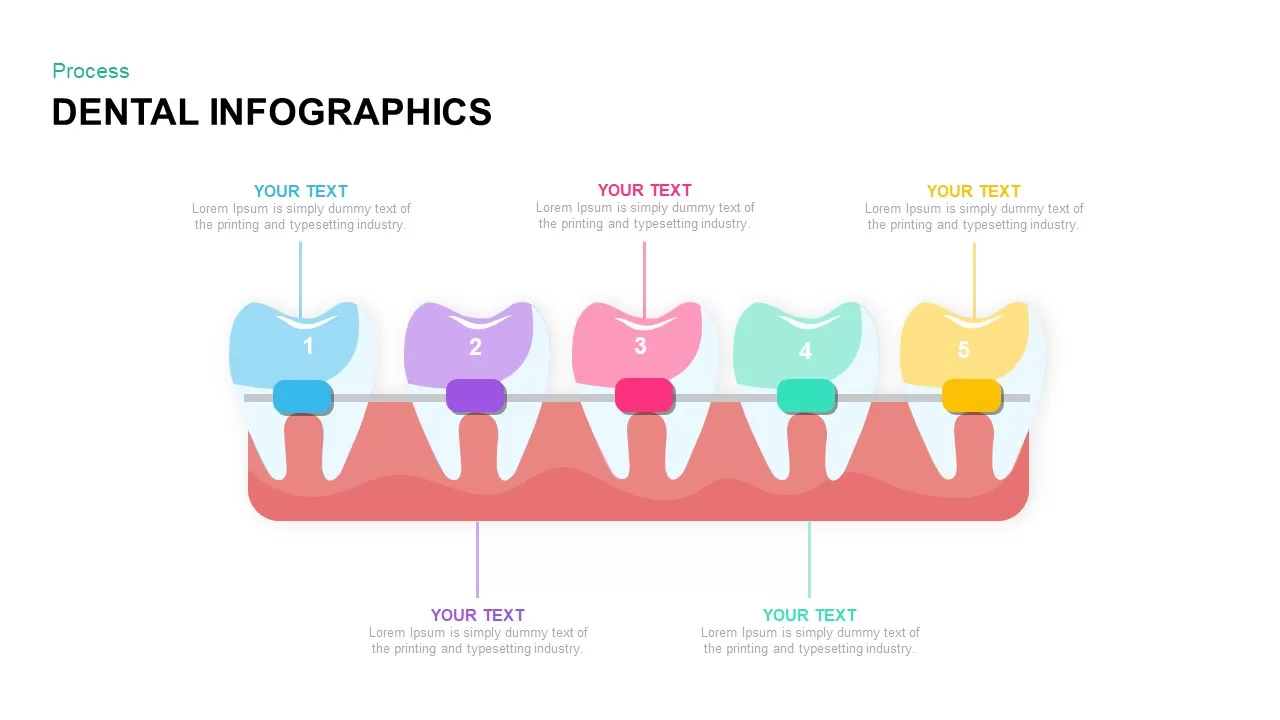
Dental Infographics Process template for PowerPoint & Google Slides
Health
Doodle Infographics Template for PowerPoint & Google Slides
Infographics
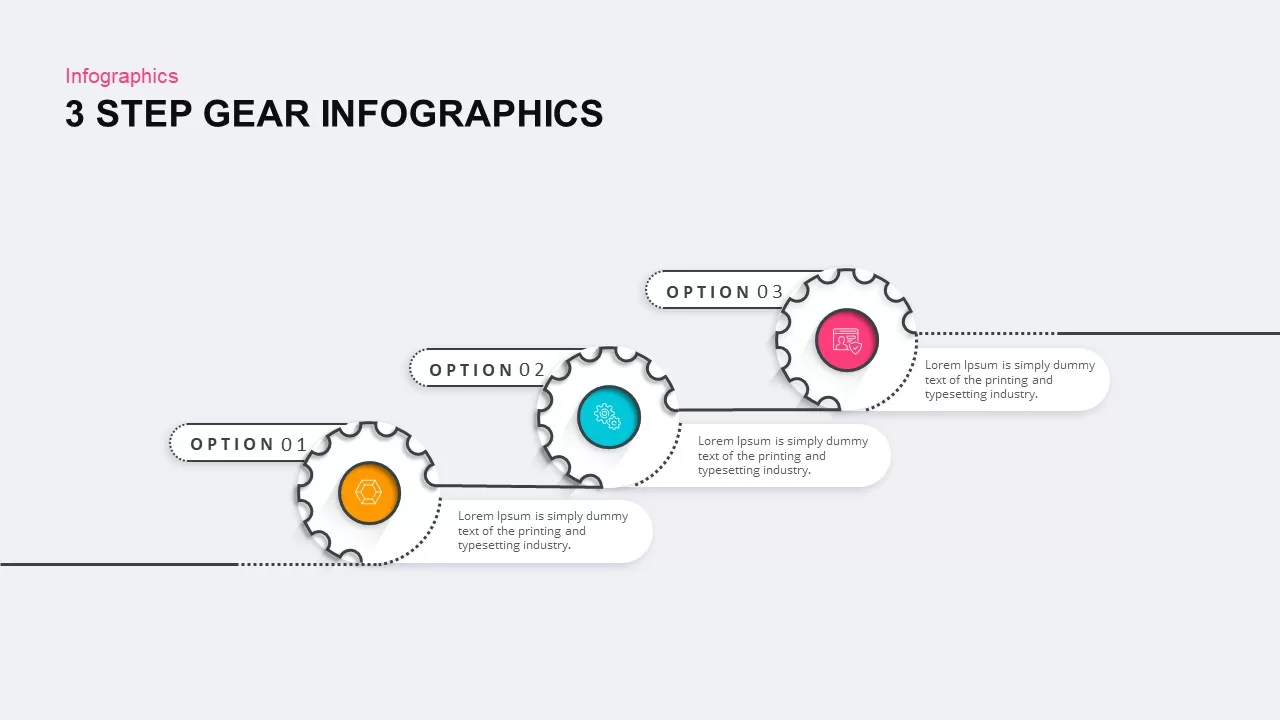
3, 4, and 5 Step Gear Infographics Template for PowerPoint & Google Slides
Process

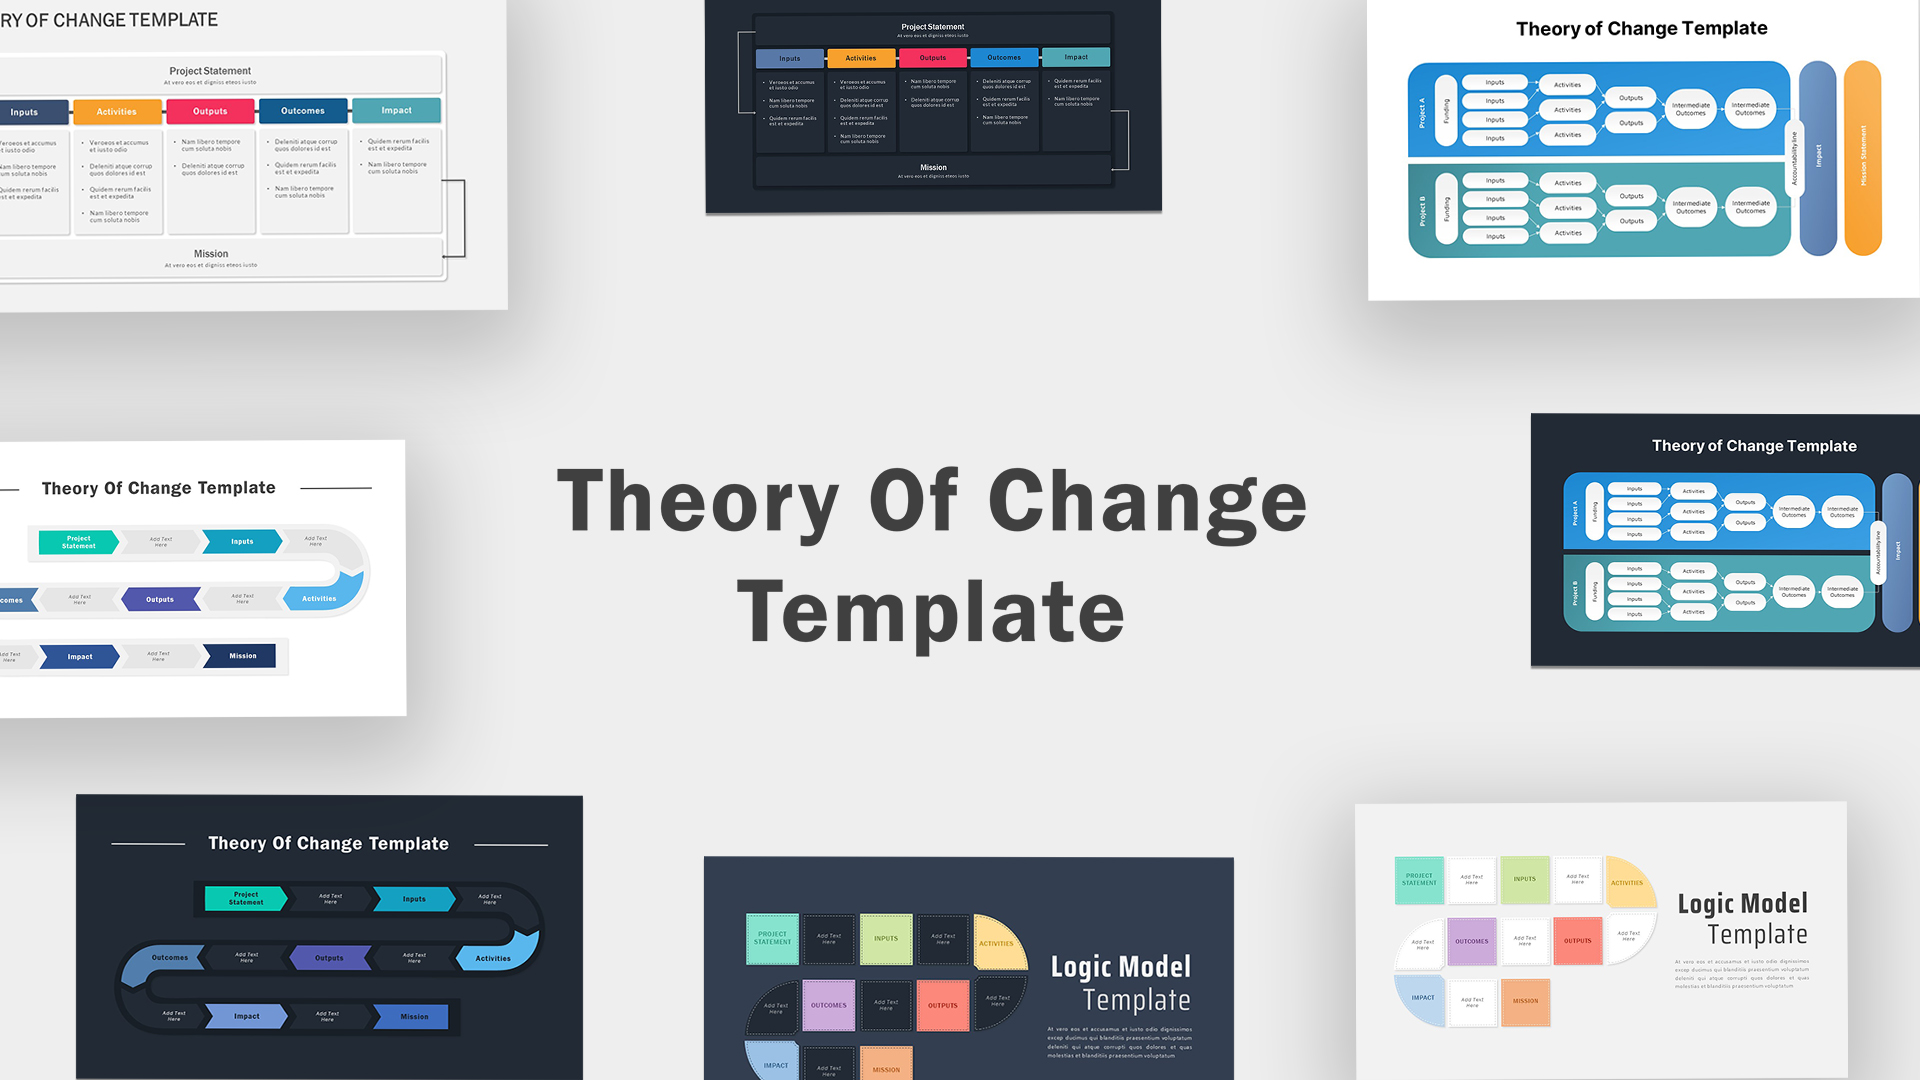
Theory of Change Infographics Pack Template for PowerPoint & Google Slides
Process
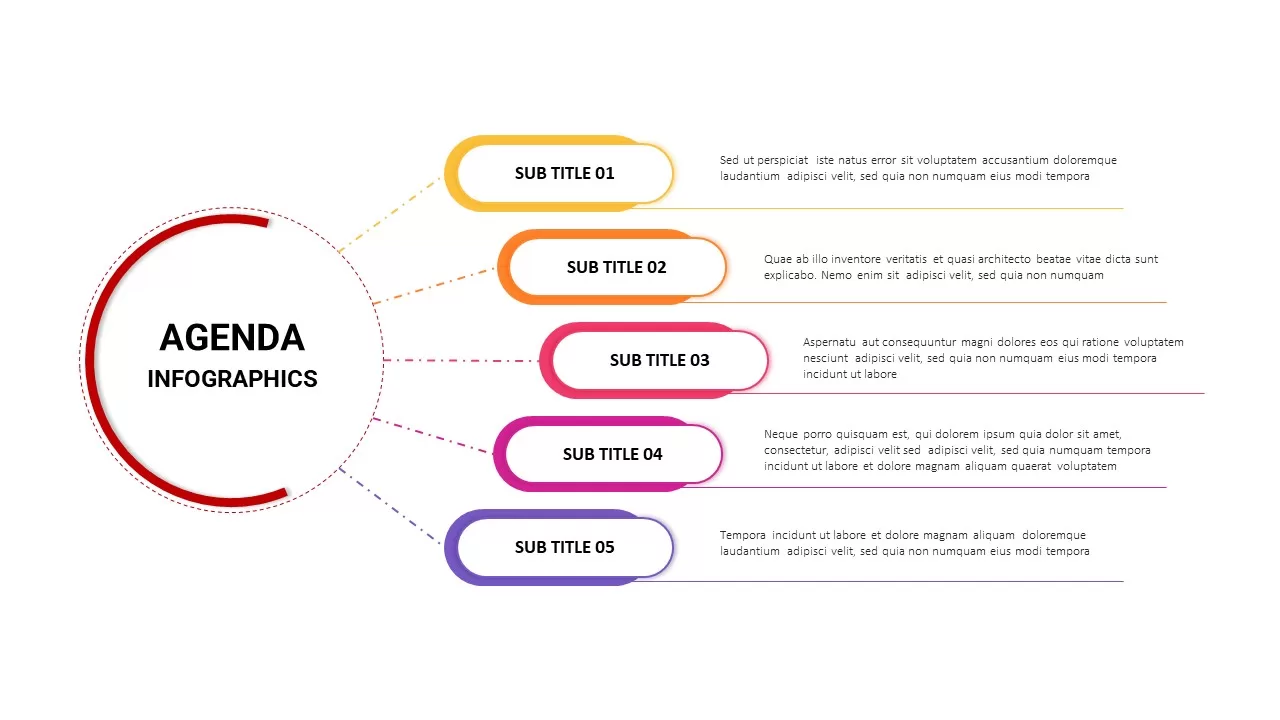
Agenda Infographics Structure template for PowerPoint & Google Slides
Business Plan
Agenda Infographics List template for PowerPoint & Google Slides
Business Plan
Agenda Infographics Diamond template for PowerPoint & Google Slides
Business Plan
Colorful Process Flow Infographics Template for PowerPoint & Google Slides
Process
Question Mark Infographics template for PowerPoint & Google Slides
Infographics
Animated Timeline Infographics template for PowerPoint & Google Slides
Timeline
Timeline Infographics template for PowerPoint & Google Slides
Timeline
Population Infographics template for PowerPoint & Google Slides
Comparison
Free Percentage Infographics template for PowerPoint & Google Slides
Comparison
Free
Before and After Comparison Infographics Template for PowerPoint & Google Slides
Comparison
Turtle Diagram Infographics Template for PowerPoint & Google Slides
Process
Versatile Leadership Infographics Template for PowerPoint & Google Slides
Infographics
Table of Contents Infographics template for PowerPoint & Google Slides
Company Profile
Supply Chain Circular Process Infographics Template for PowerPoint & Google Slides
Business Strategy
Domino Effect Sequential Infographics Template for PowerPoint & Google Slides
Process
Agriculture Infographics Slide with Progress Rings & Metrics Template for PowerPoint & Google Slides
Pie/Donut
5 Layer Concentric Circles Infographics Template for PowerPoint & Google Slides
Circular
Flywheel Infographics Pack Template for PowerPoint & Google Slides
Circular
Flywheel Infographics template for PowerPoint & Google Slides
Business Strategy
Modern Social Media Infographics Template for PowerPoint & Google Slides
Digital Marketing
Conflict Infographics Comparison Template for PowerPoint & Google Slides
Infographics
Pharmacology Infographics Slide Template for PowerPoint & Google Slides
Health
Free Colorful Timeline Infographics Template for PowerPoint & Google Slides
Timeline
Free
Free Law Infographics Slide Pack Collection Template for PowerPoint & Google Slides
Infographics
Free
Vertical Roadmap Infographics Template for PowerPoint & Google Slides
Roadmap
Free Biology Theme Infographics Deck Template for PowerPoint & Google Slides
Health
Free
5 Styles Key Outcomes Infographics Pack Template for PowerPoint & Google Slides
Infographics
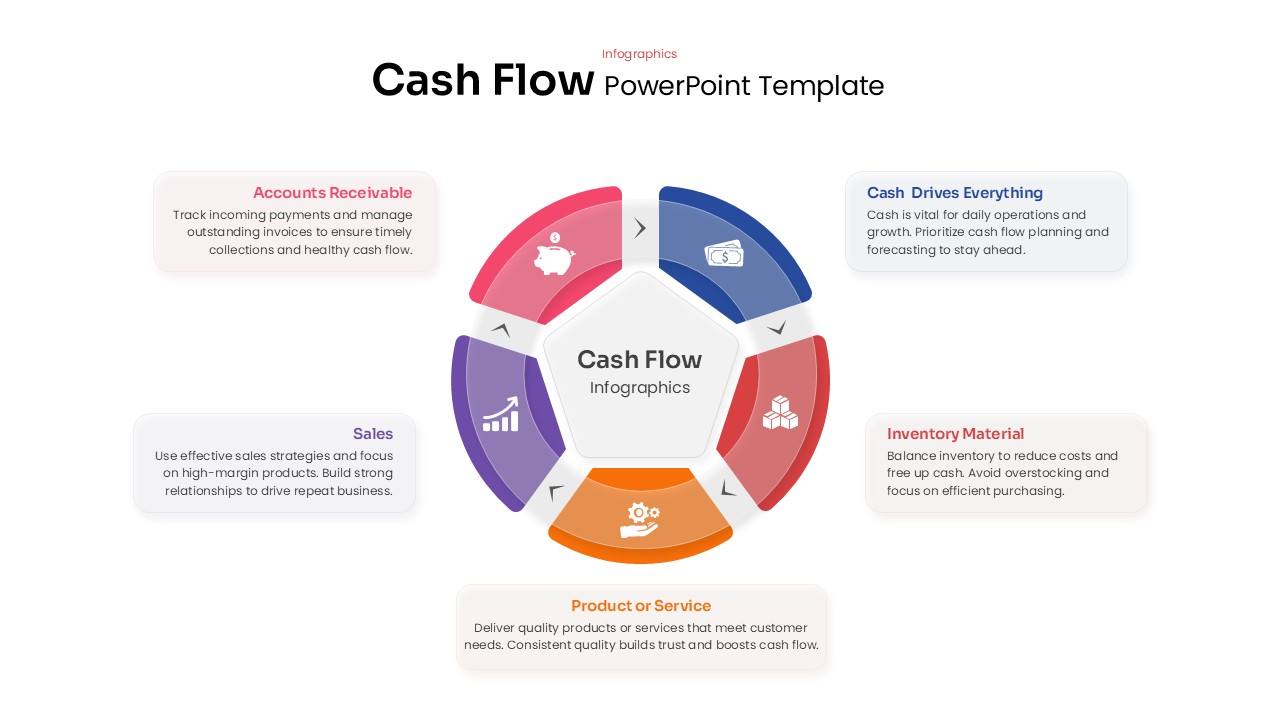
Cash Flow Infographics template for PowerPoint & Google Slides
Business
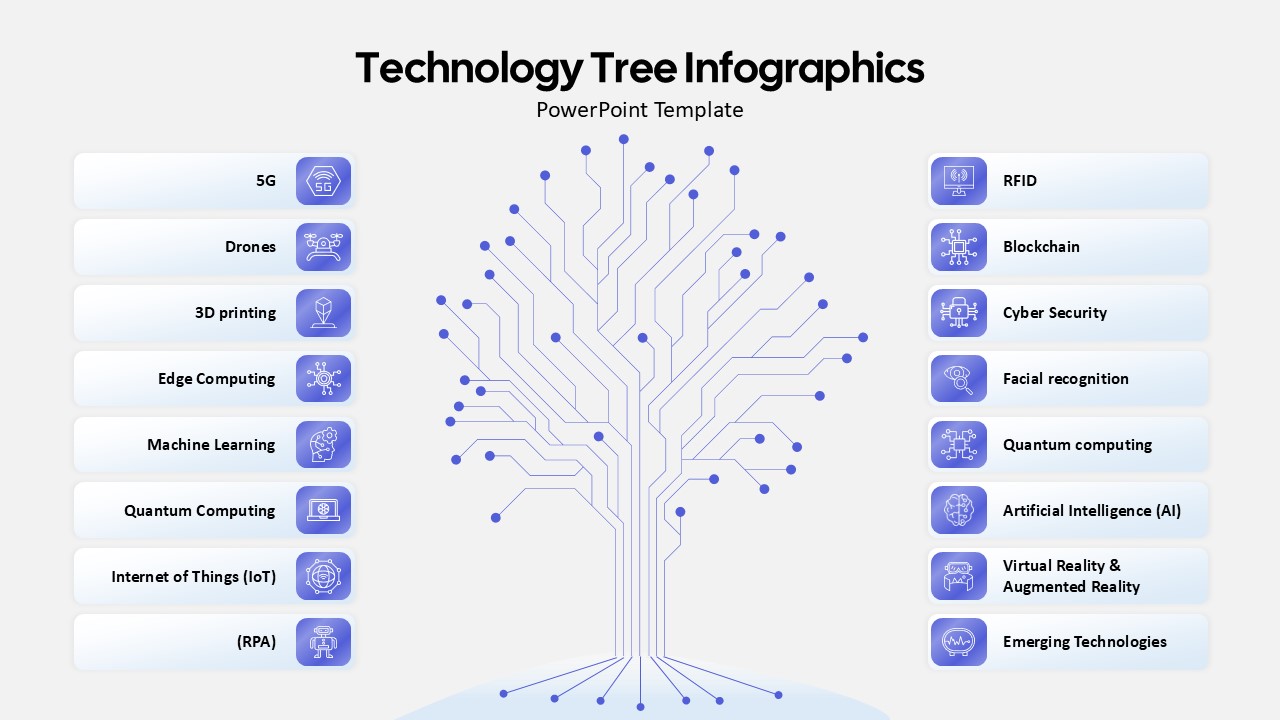
Technology Tree Infographics Template for PowerPoint & Google Slides
AI