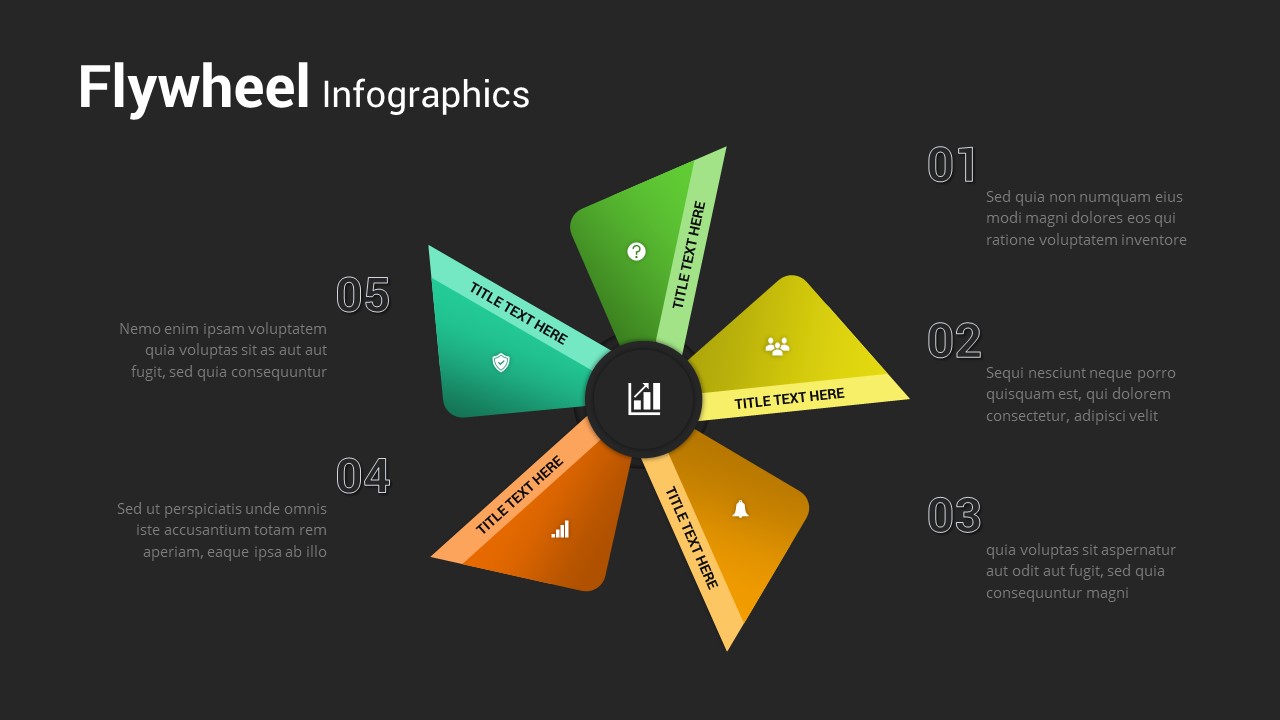
Five-Step Flywheel Infographic Diagram Template for PowerPoint & Google Slides


Description
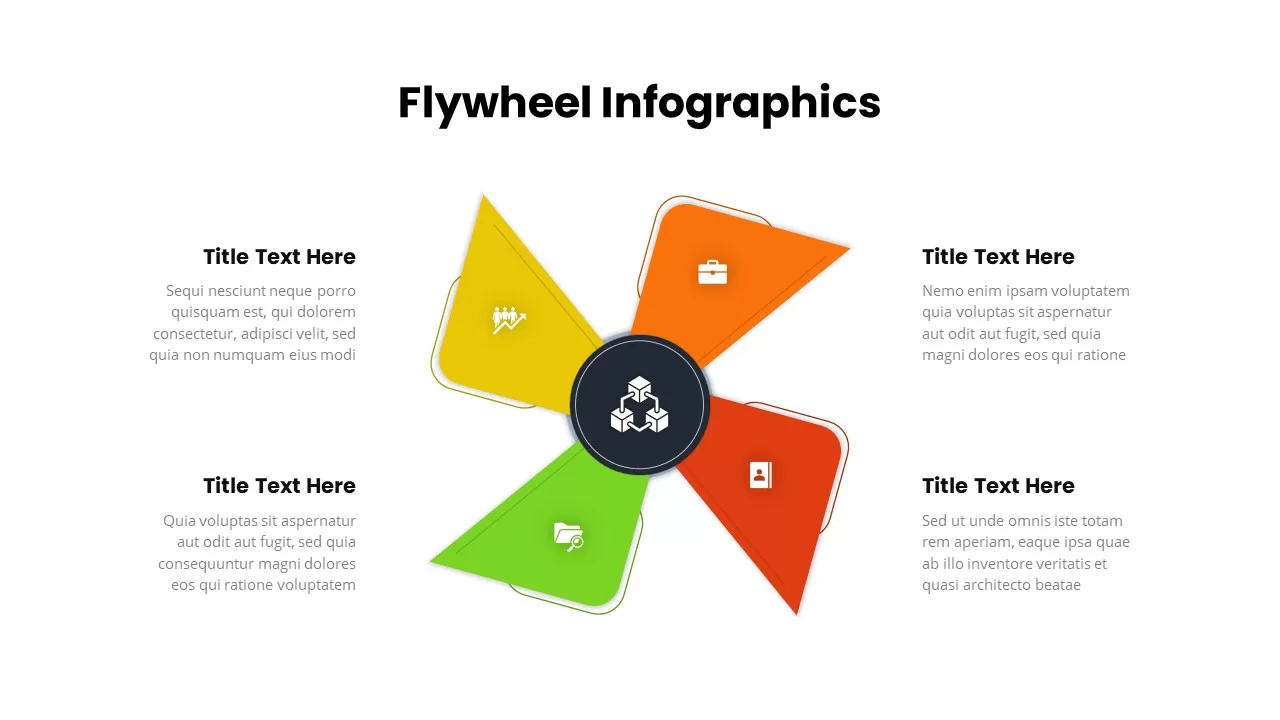
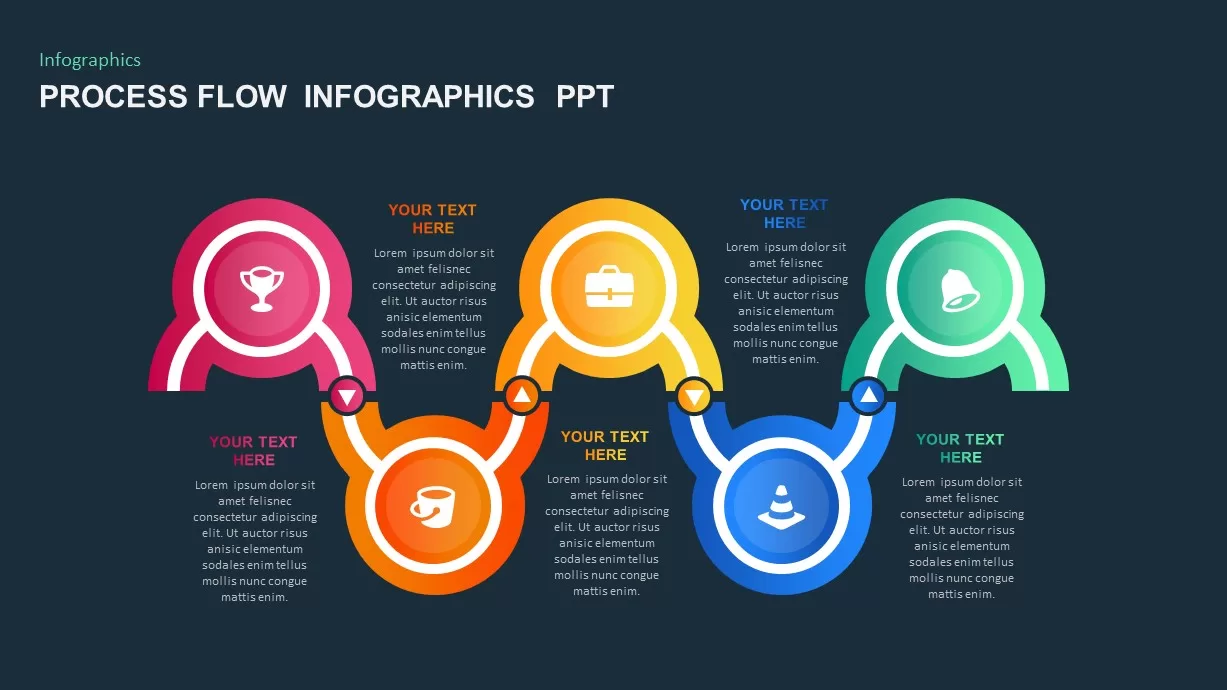
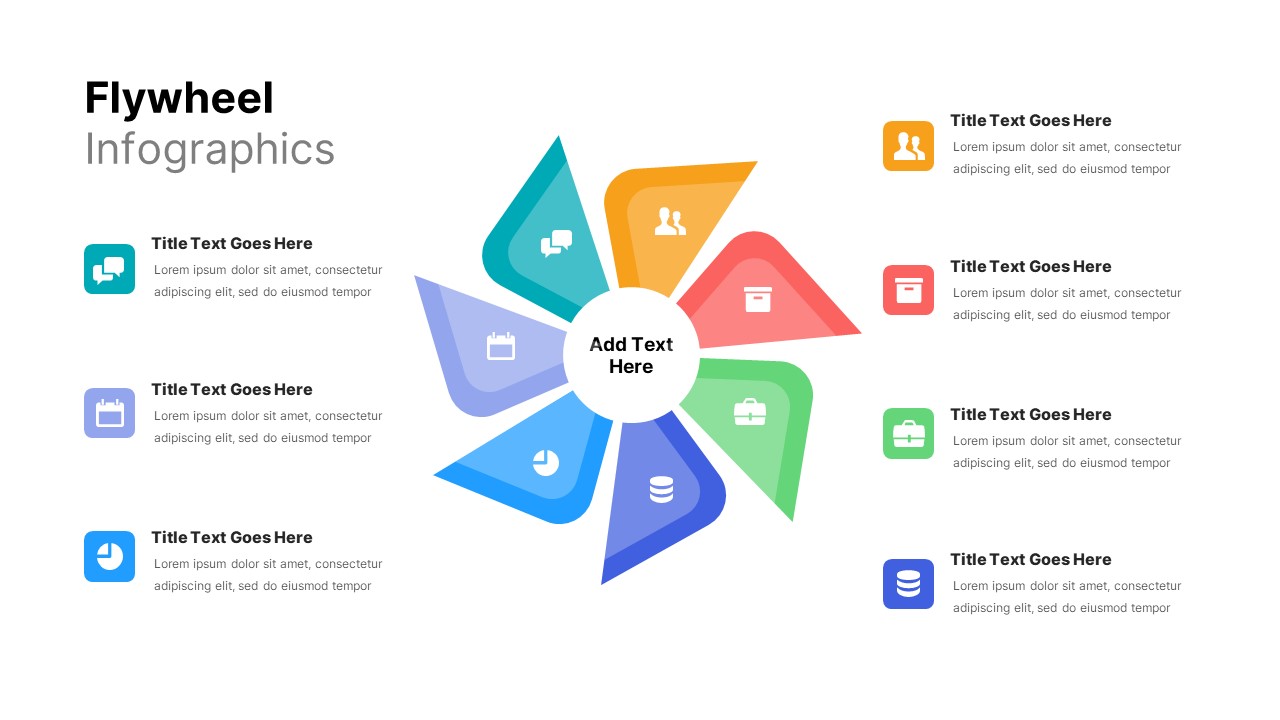
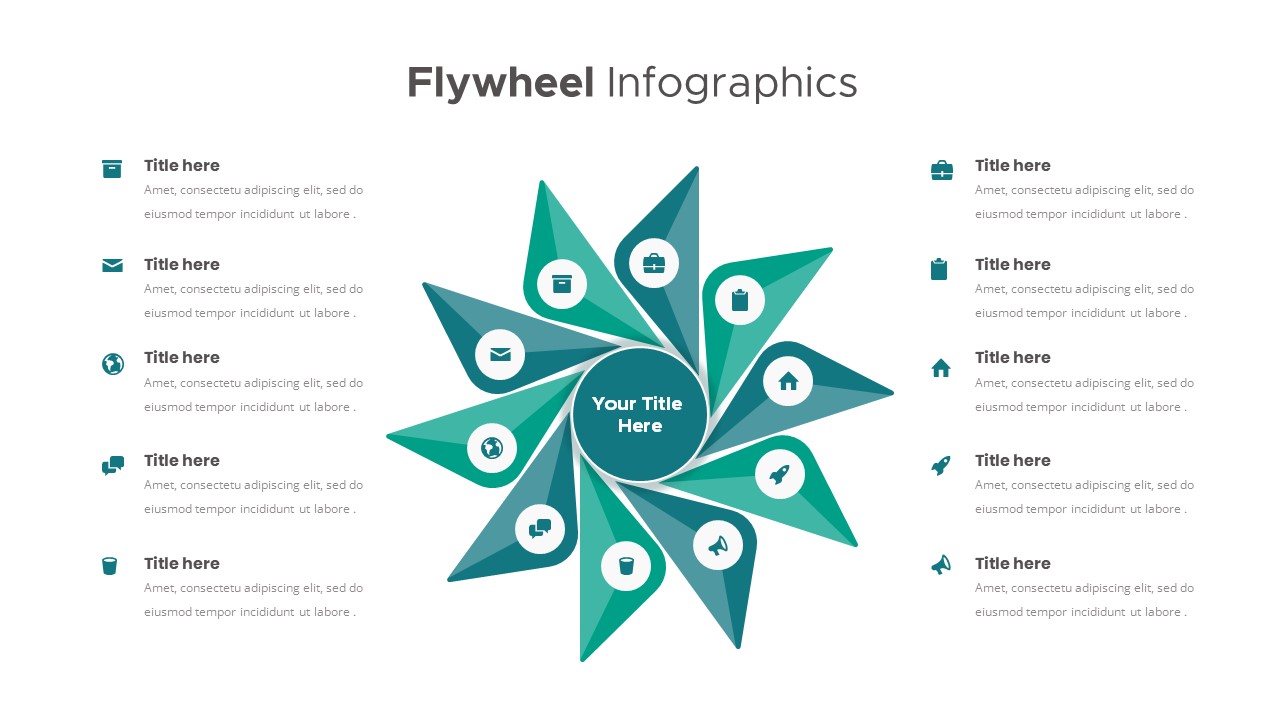
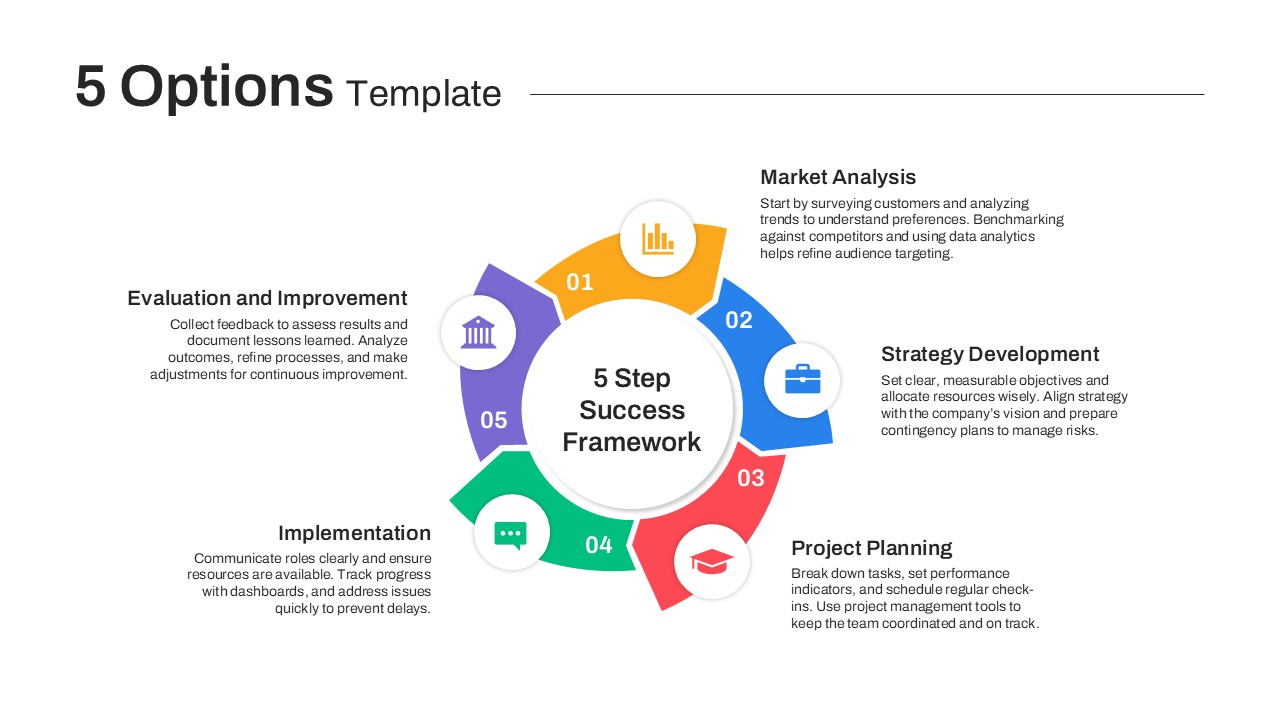
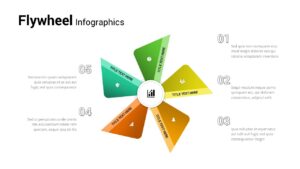
Use this highly customizable five-step flywheel infographic to illustrate cyclical business processes, continuous improvement, or growth strategies with maximum impact. This dynamic slide features a central hub encircled by five color-coded petals, each anchored by distinctive icons and text placeholders for titles and concise descriptions. The sleek flat design, with smooth gradients and subtle drop shadows, creates a polished, professional look while maintaining readability. Easily swap icons, adjust hues, and edit text to reflect any stage—such as planning, execution, monitoring, optimization, evaluation, and scaling—and highlight key performance indicators at the core.
Built with master slides and vector shapes, this asset ensures rapid customization without compromising quality. The radial layout emphasizes the interconnected nature of each phase, reinforcing the momentum-driven concept of a flywheel. By leveraging editable segments and cohesive color themes, you can align the slide with corporate branding or distinct campaign palettes in just a few clicks. Seamlessly compatible with both PowerPoint and Google Slides, the template guarantees consistent formatting across platforms, eliminating version control issues and formatting headaches.
Ideal for strategic reviews, marketing presentations, and operational briefings, this infographic supports both high-level overviews and detailed breakdowns. Use the central metric icon to showcase aggregate performance data, while each petal can spotlight specific objectives, tasks, or performance metrics. Animations and transition guides are optimized for smooth playback, enhancing audience engagement without distracting from core messages. Elevate your storytelling with a clear, motion-inspired visualization that drives home the idea of perpetual growth and iterative development. Customizable data-driven charts and slide notes are included to streamline preparation and ensure clarity when presenting complex concepts to stakeholders.
Who is it for
Marketing directors, product managers, and business consultants will benefit from this flywheel slide when presenting strategic frameworks, customer journey cycles, or growth initiatives. Project managers and operations leaders can leverage the radial layout to communicate process dependencies and performance metrics. Educators and trainers may also use this visual to explain iterative methodologies and continuous improvement concepts.
Other Uses
Beyond strategic frameworks and marketing initiatives, repurpose this slide for agile retrospectives, performance reviews, training workshops, customer journey mapping, KPI presentations, or educational modules that require a clear depiction of ongoing cycles and feedback loops.
Login to download this file

Item ID
SB03160
Related Templates

Six-Step Colorful Flywheel Diagram Template for PowerPoint & Google Slides
Circular
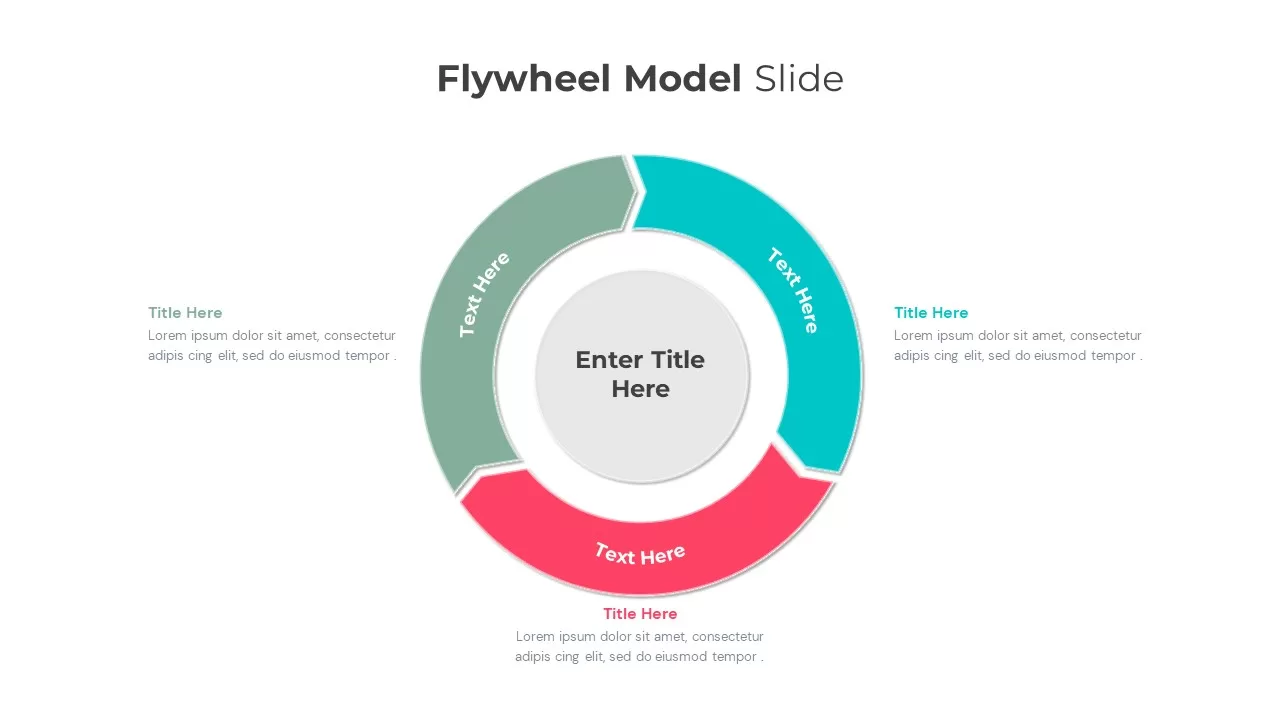
Flywheel Model Infographic Template for PowerPoint & Google Slides
Process
Four-Segment Flywheel Infographic Model Template for PowerPoint & Google Slides
Process
Flywheel Growth Cycle Diagram Template for PowerPoint & Google Slides
Circular
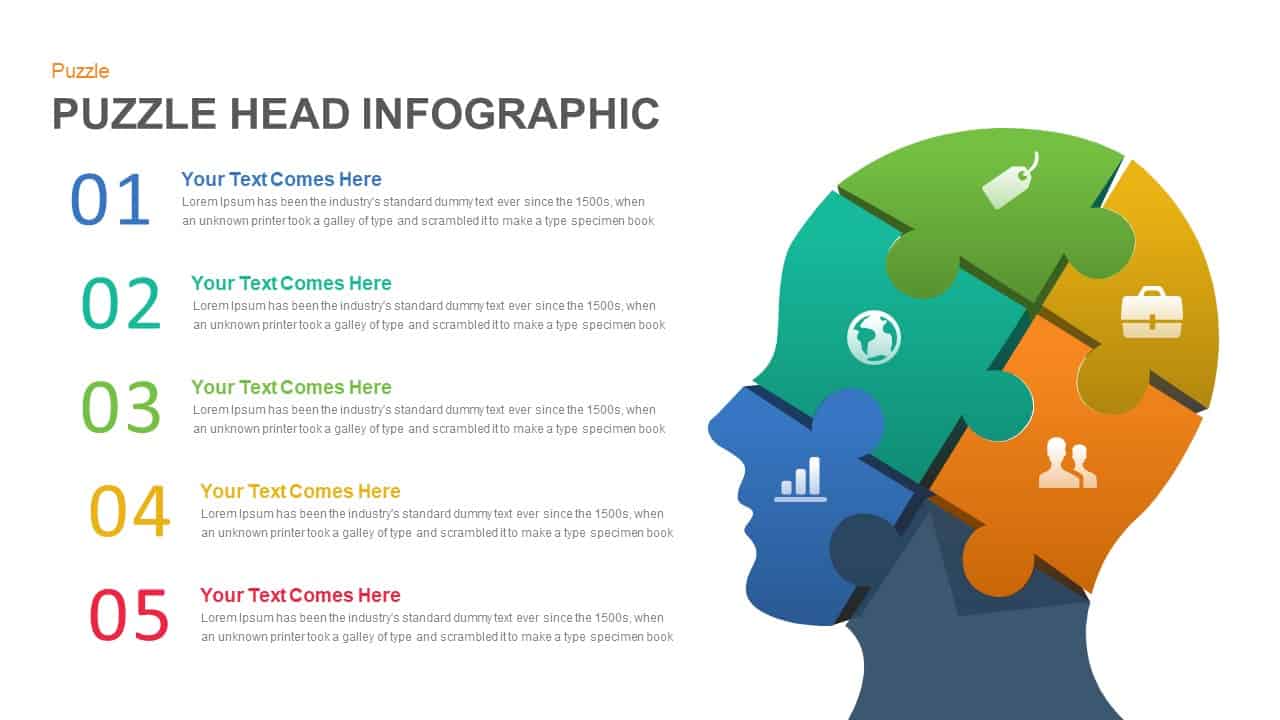
Five-Step Puzzle Head Infographic Template for PowerPoint & Google Slides
Process
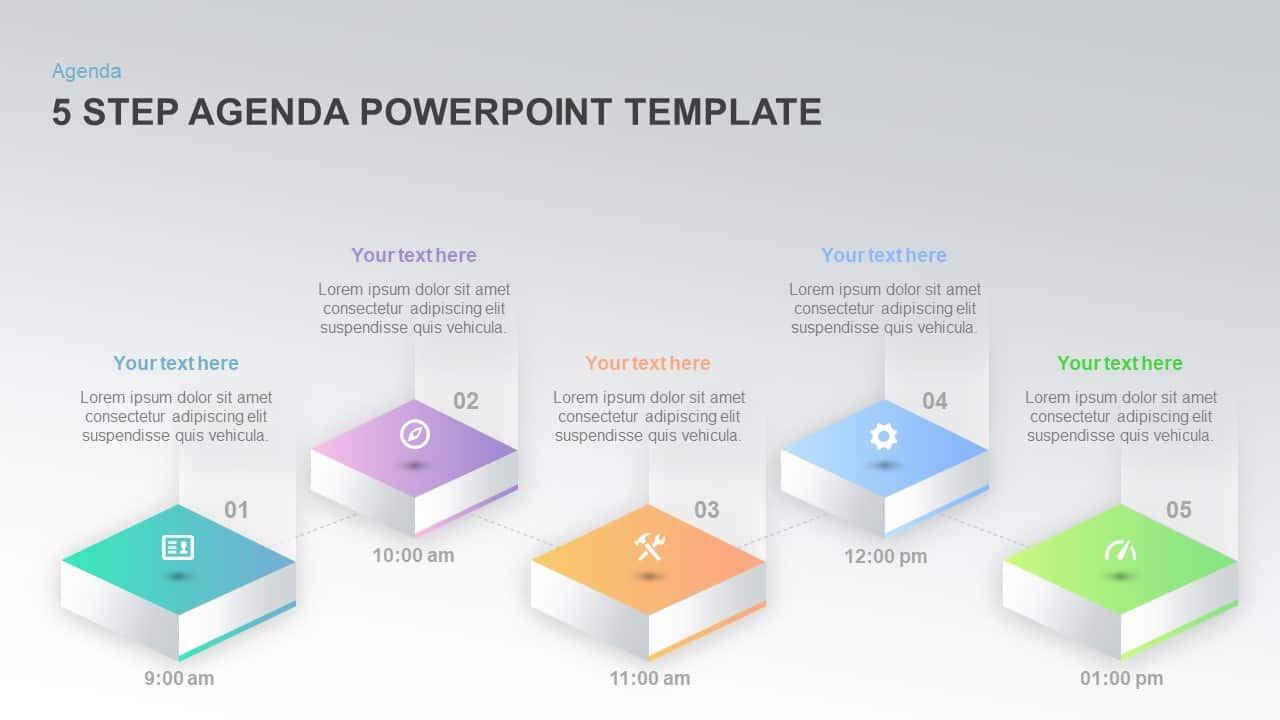
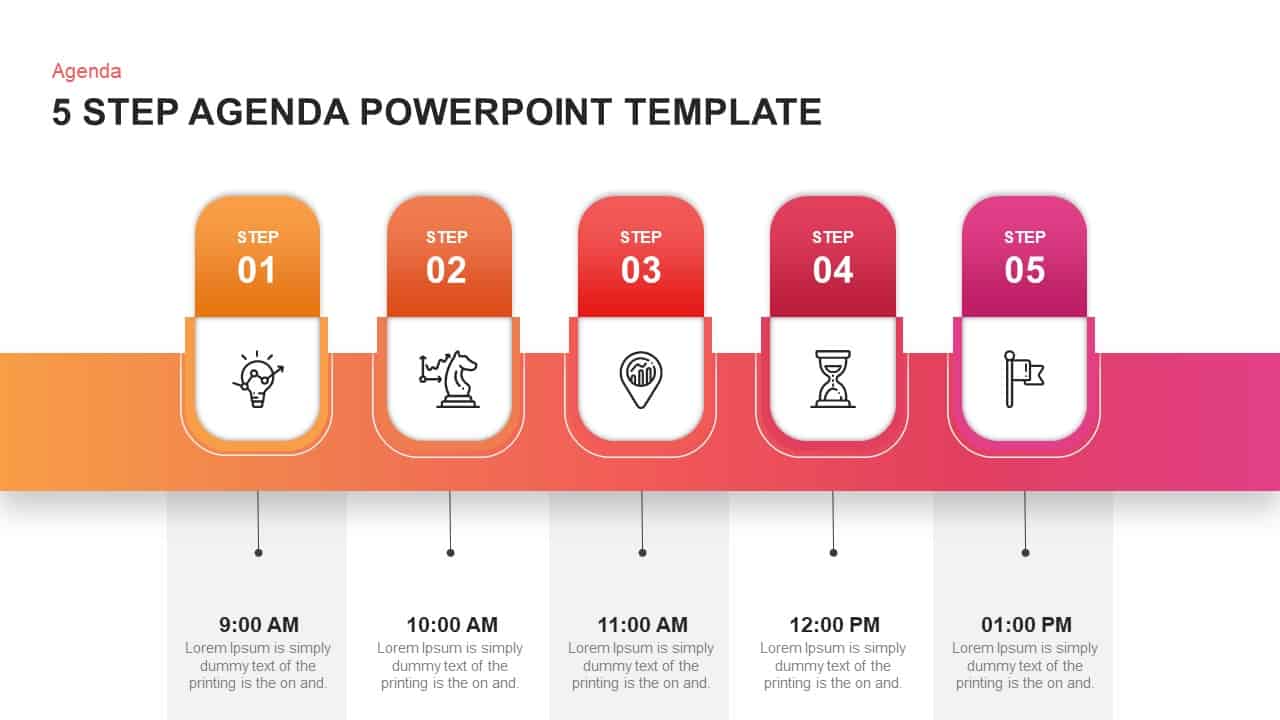
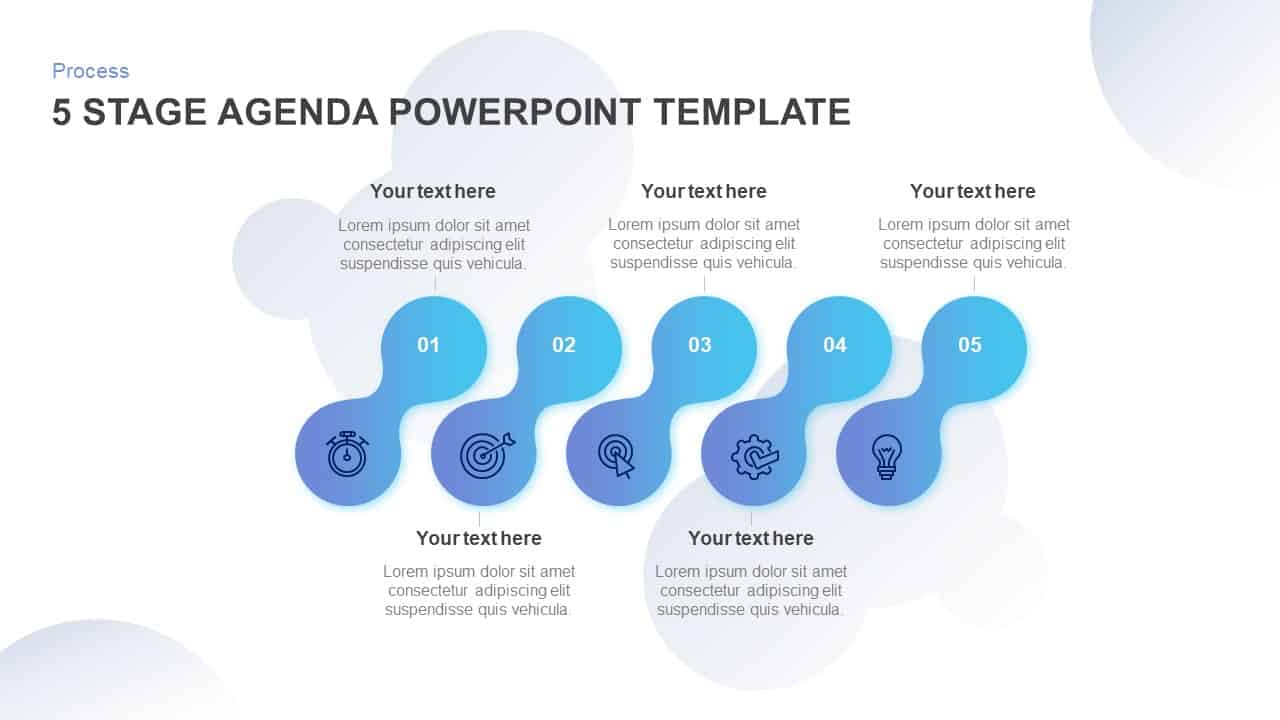
Five-Step Agenda Infographic Template for PowerPoint & Google Slides
Agenda
Five-Step Growth Infographic Slide Template for PowerPoint & Google Slides
Process
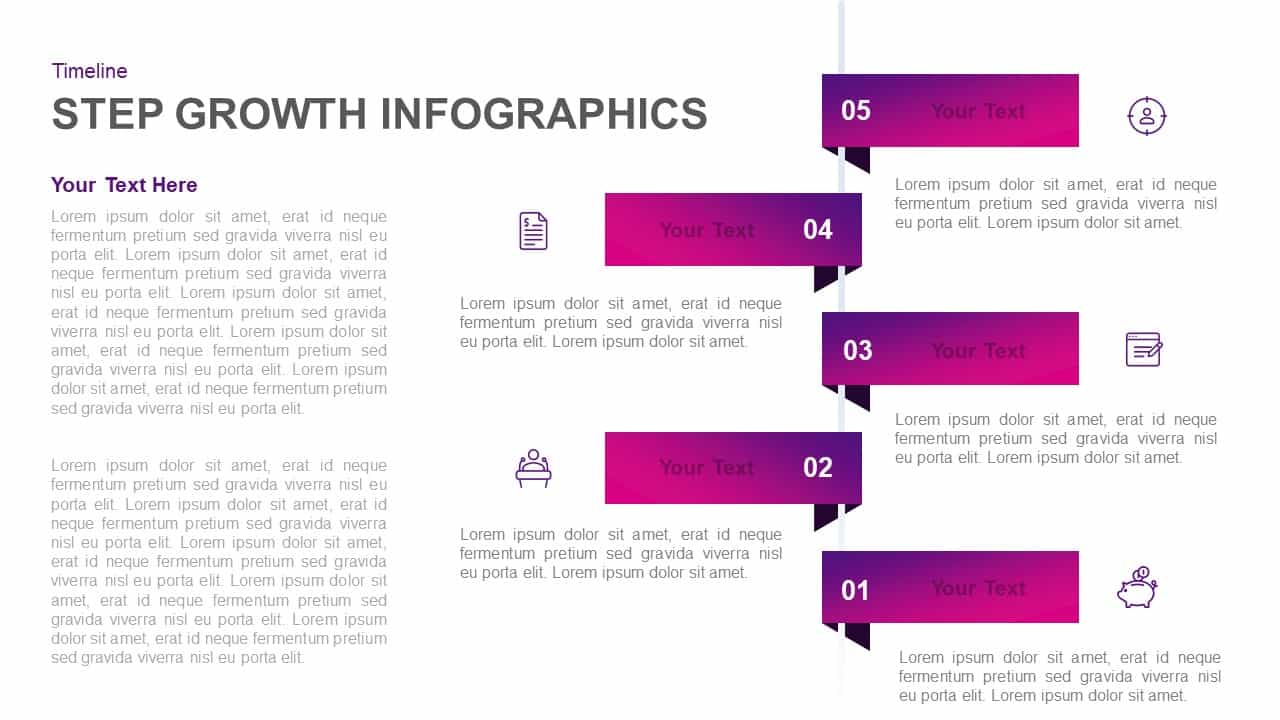
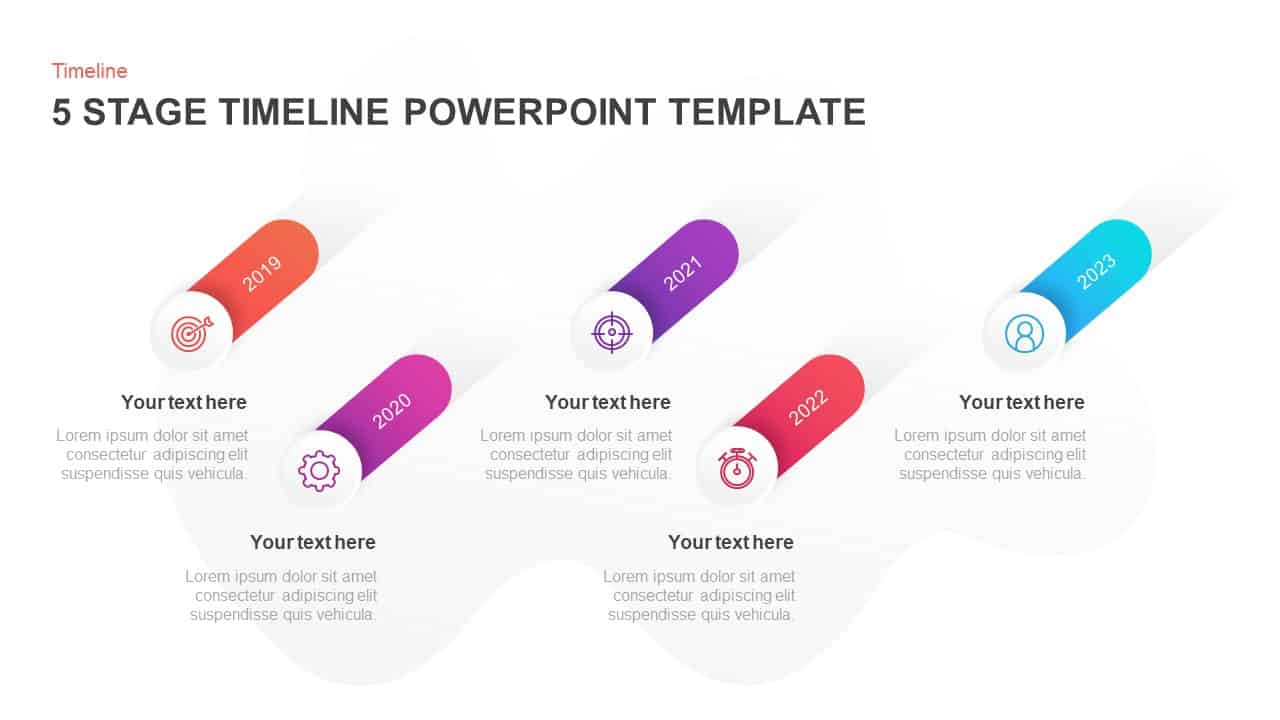
Five-Step Growth Timeline Infographic Template for PowerPoint & Google Slides
Timeline
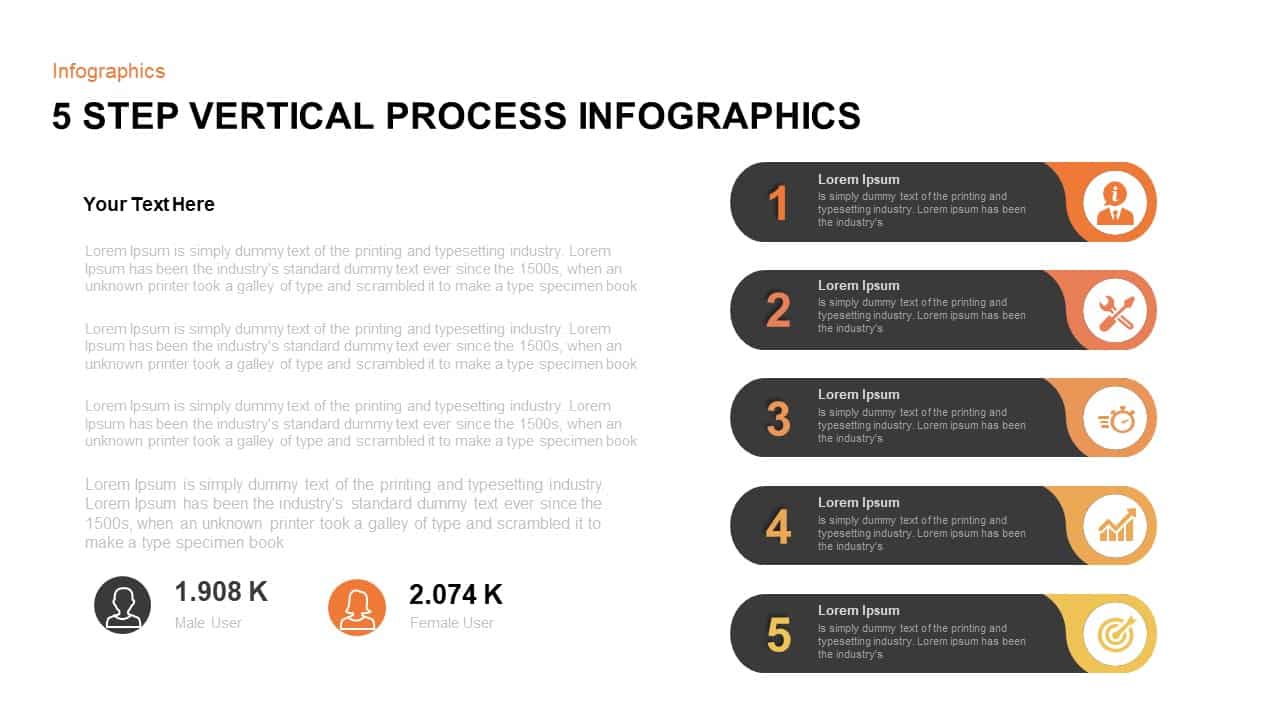
Five-Step Vertical Process Infographic Template for PowerPoint & Google Slides
Process
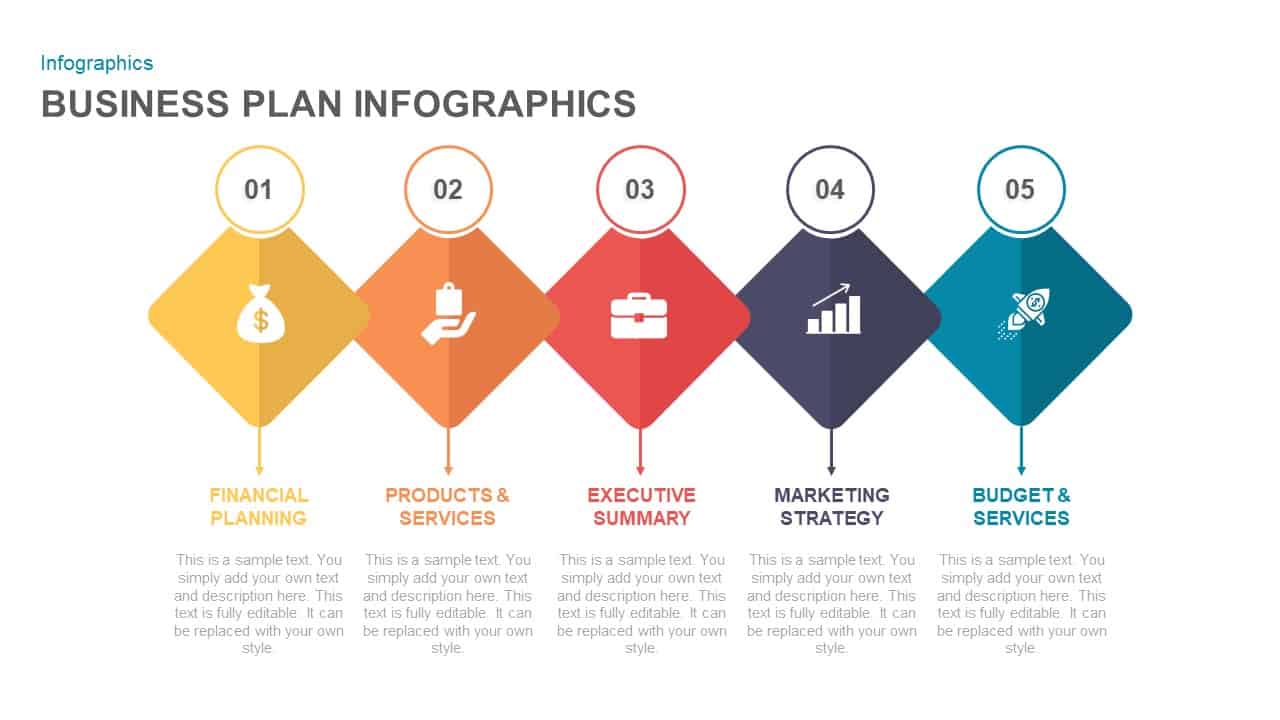
Five-Step Business Plan Infographic Template for PowerPoint & Google Slides
Business Plan
Five-Step Infographic Process and Agenda Template for PowerPoint & Google Slides
Process

Five-Step Process Flow Infographic Template for PowerPoint & Google Slides
Process
Five-Step Marketing Process Infographic Template for PowerPoint & Google Slides
Process

Free Five-Step Circular Timeline Infographic Template for PowerPoint & Google Slides
Timeline
Free
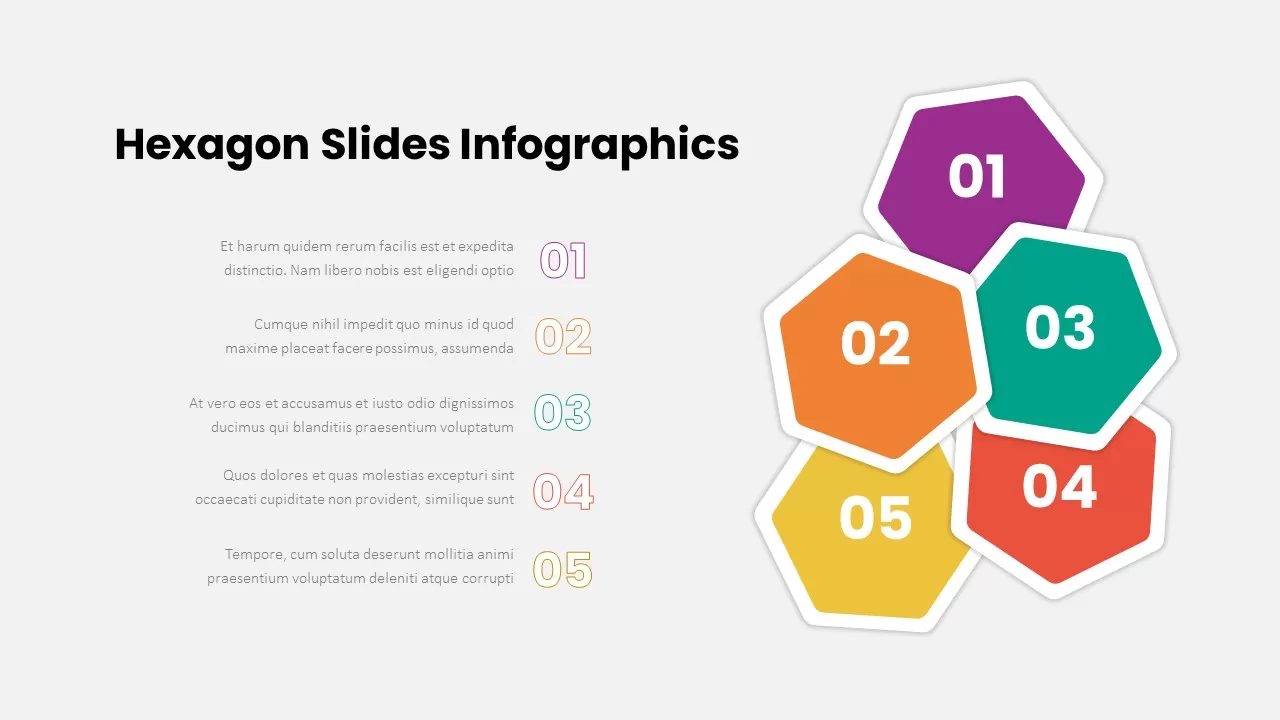
Five-Step Hexagon Infographic Process Template for PowerPoint & Google Slides
Process
Five-Step Chain Link Process Infographic Template for PowerPoint & Google Slides
Process
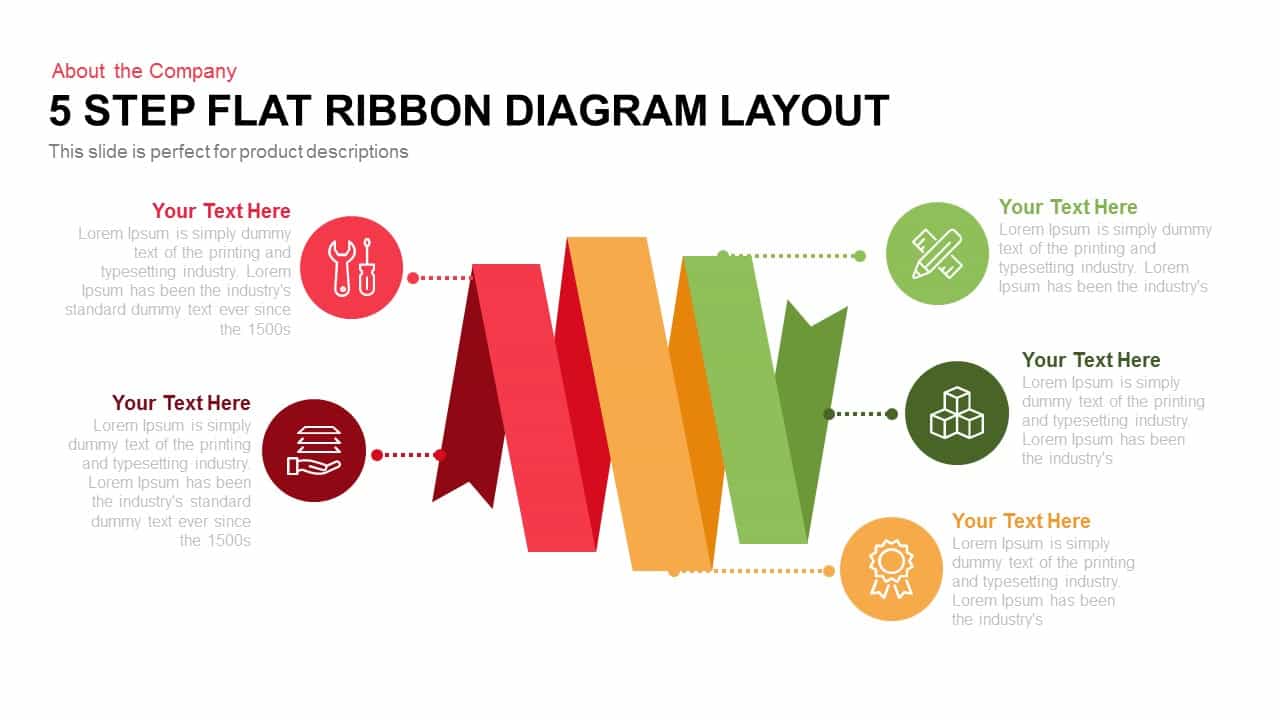
Five-Step Flat Ribbon Diagram Layout template for PowerPoint & Google Slides
Process

Five-Step Gear Process Diagram Template for PowerPoint & Google Slides
Process
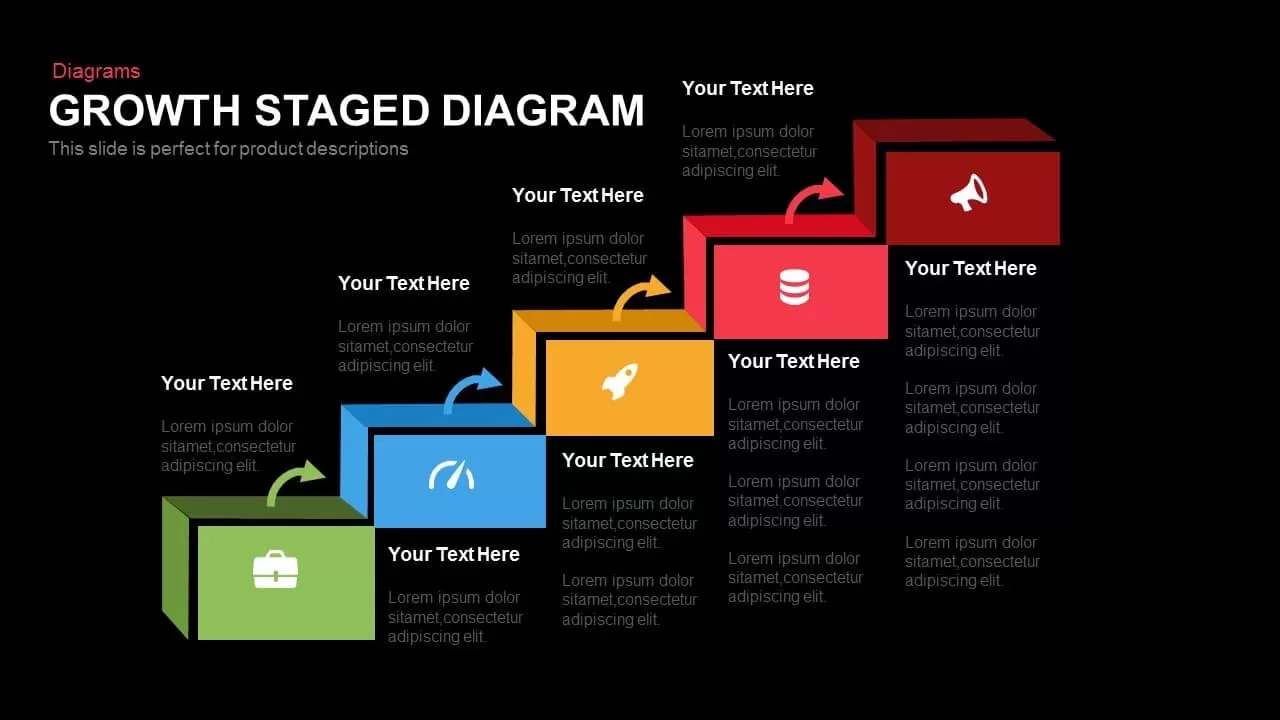
Five-Step Growth Stage Staircase Diagram Template for PowerPoint & Google Slides
Process
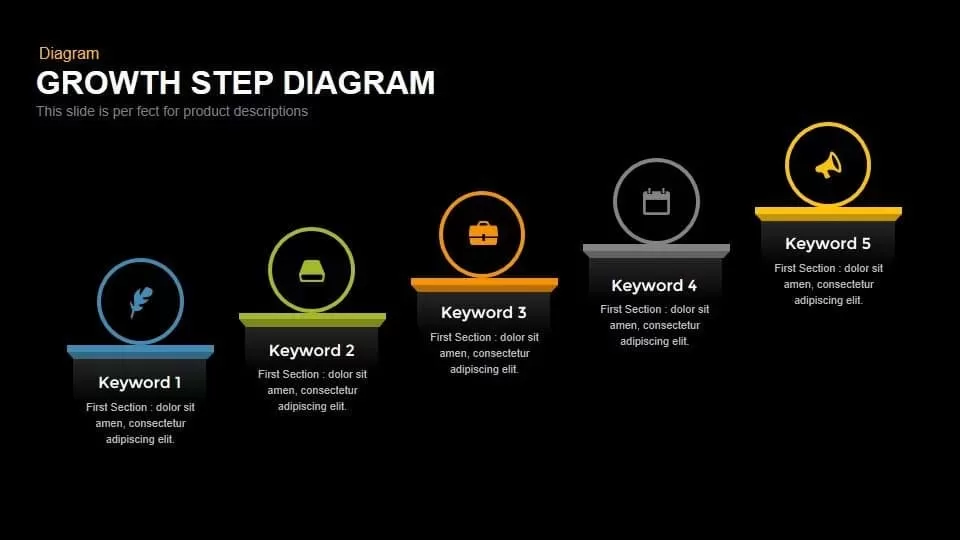
Modern Five-Step Growth Diagram Template for PowerPoint & Google Slides
Process

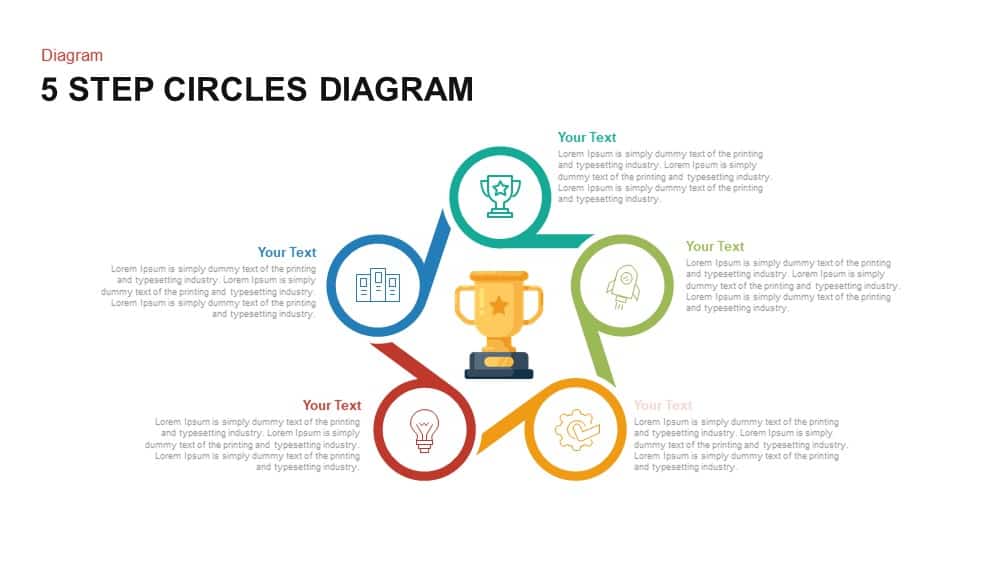
Modern Five-Step Circles Process Diagram Template for PowerPoint & Google Slides
Circular
Five-Step Diamond Process Diagram Template for PowerPoint & Google Slides
Process
Five-Step Circular Process Diagram Template for PowerPoint & Google Slides
Circular
Five-Step Gradient Blue Funnel Diagram Template for PowerPoint & Google Slides
Funnel
Colorful Five-Step Roadmap Diagram Template for PowerPoint & Google Slides
Roadmap
3D Five-Step Roadmap Diagram Slide Layout Template for PowerPoint & Google Slides
Roadmap
Gradient Five-Step Roadmap Diagram Template for PowerPoint & Google Slides
Roadmap
Five-Step Interlocking Gears Diagram Template for PowerPoint & Google Slides
Process
Five-Step Modelling Process Diagram Template for PowerPoint & Google Slides
Process
Five-Step Cascade Diagram & Timeline Template for PowerPoint & Google Slides
Process
Five-Step Modern Funnel Diagram Template for PowerPoint & Google Slides
Funnel
Five and Six Step Line Linear Stage Diagram for PowerPoint & Google Slides
Infographics
Flywheel Infographics Pack Template for PowerPoint & Google Slides
Circular
Flywheel Infographics template for PowerPoint & Google Slides
Process
Flywheel Infographics template for PowerPoint & Google Slides
Business Strategy
Flywheel Infographics template for PowerPoint & Google Slides
Business Strategy
Flywheel Infographics template for PowerPoint & Google Slides
Business Strategy
Business Flywheel Lifecycle Model Template for PowerPoint & Google Slides
Circular
Data Flywheel Strategy template for PowerPoint & Google Slides
Business
Funnel and Flywheel Thinking Comparison template for PowerPoint & Google Slides
Infographics
Five Up Arrow Infographic Diagram Template for PowerPoint & Google Slides
Arrow
Five Stage Process Diagram Infographic Template for PowerPoint & Google Slides
Process
Five-Stage Circular Infographic Diagram Template for PowerPoint & Google Slides
Process
Five-Layer Onion Diagram Infographic Template for PowerPoint & Google Slides
Process
Five-Step Process Improvement Template for PowerPoint & Google Slides
Process
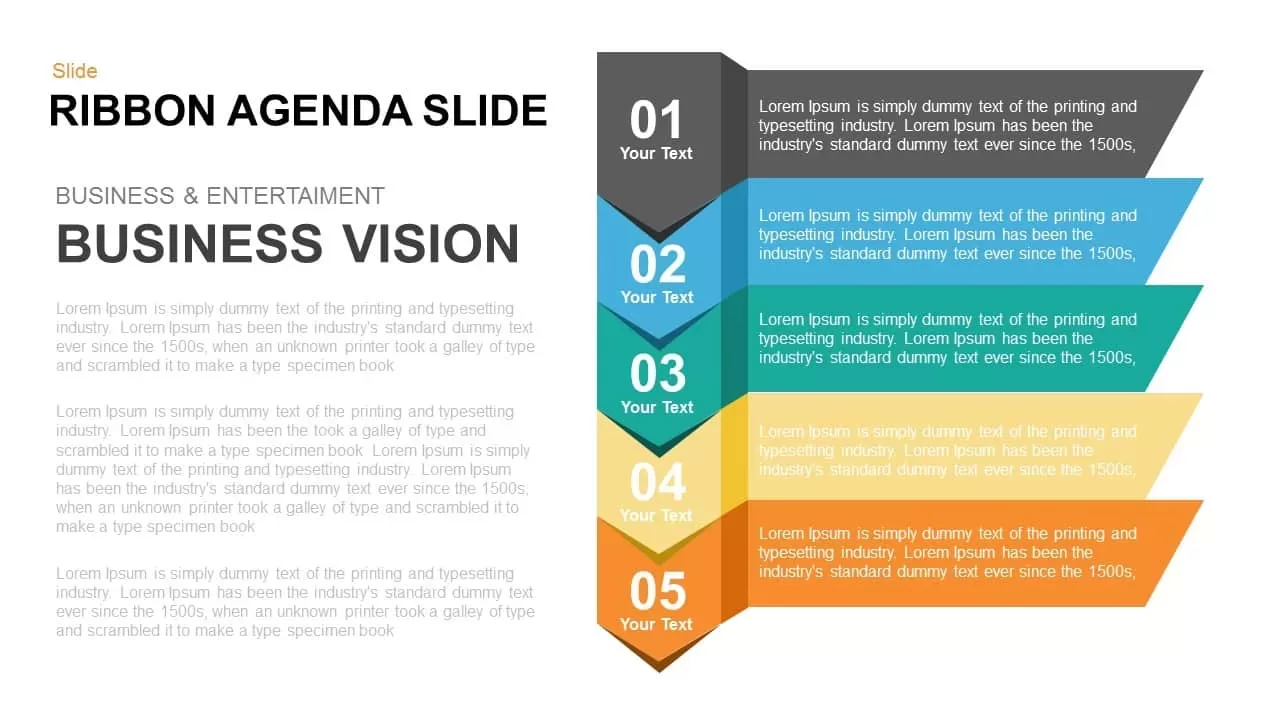
Dynamic Five-Step Ribbon Agenda Layout Template for PowerPoint & Google Slides
Agenda

Five-Step Concept to Delivery Process Template for PowerPoint & Google Slides
Process
Five-Step Gradient Agenda Timeline Template for PowerPoint & Google Slides
Agenda
Five-Step Hexagonal Process Flow Template for PowerPoint & Google Slides
Process
Business System Five-Step Process Template for PowerPoint & Google Slides
Process
Pencil Qualification Process Five-Step Template for PowerPoint & Google Slides
Process
Five-Step Business Infographics Template for PowerPoint & Google Slides
Infographics
Five-Step Circular Badge Infographics Template for PowerPoint & Google Slides
Circular
OSKAR Coaching Model Five-Step Framework Template for PowerPoint & Google Slides
Leadership
Five-Step Table of Contents Presentation Template for PowerPoint & Google Slides
Agenda
Multi-Color Five-Step Curved Arrow Template for PowerPoint & Google Slides
Process
Five-Step Animated Accordion Process Template for PowerPoint & Google Slides
Process
Five-Step Accomplishment Slide Template for PowerPoint & Google Slides
Accomplishment
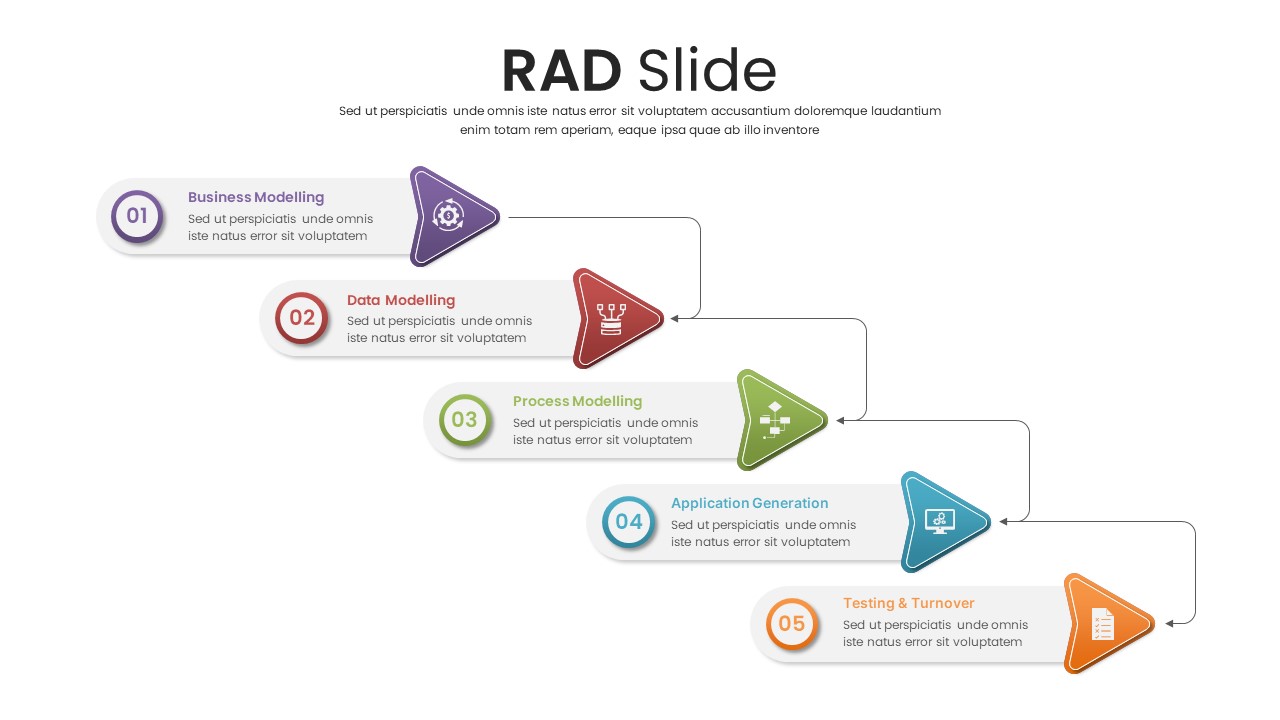
Professional Five-Step RAD Process Slide Template for PowerPoint & Google Slides
Process
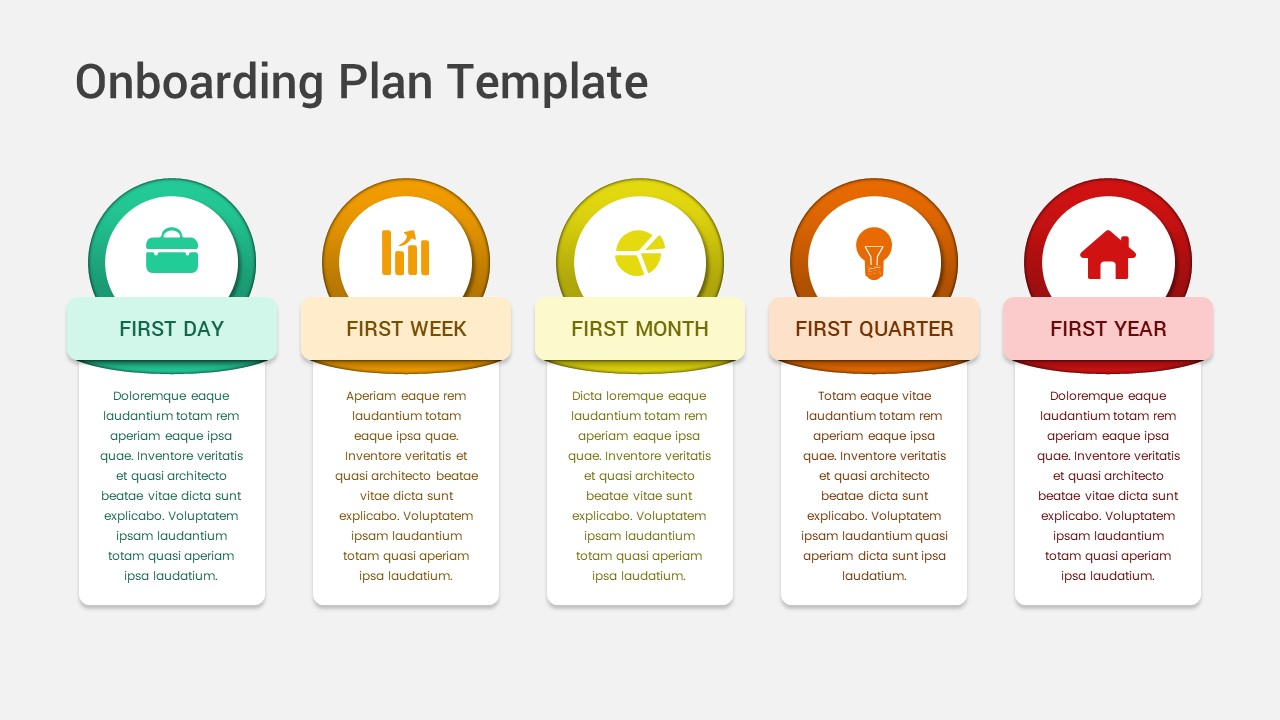
Five-Step Onboarding Plan Timeline Template for PowerPoint & Google Slides
Recruitment
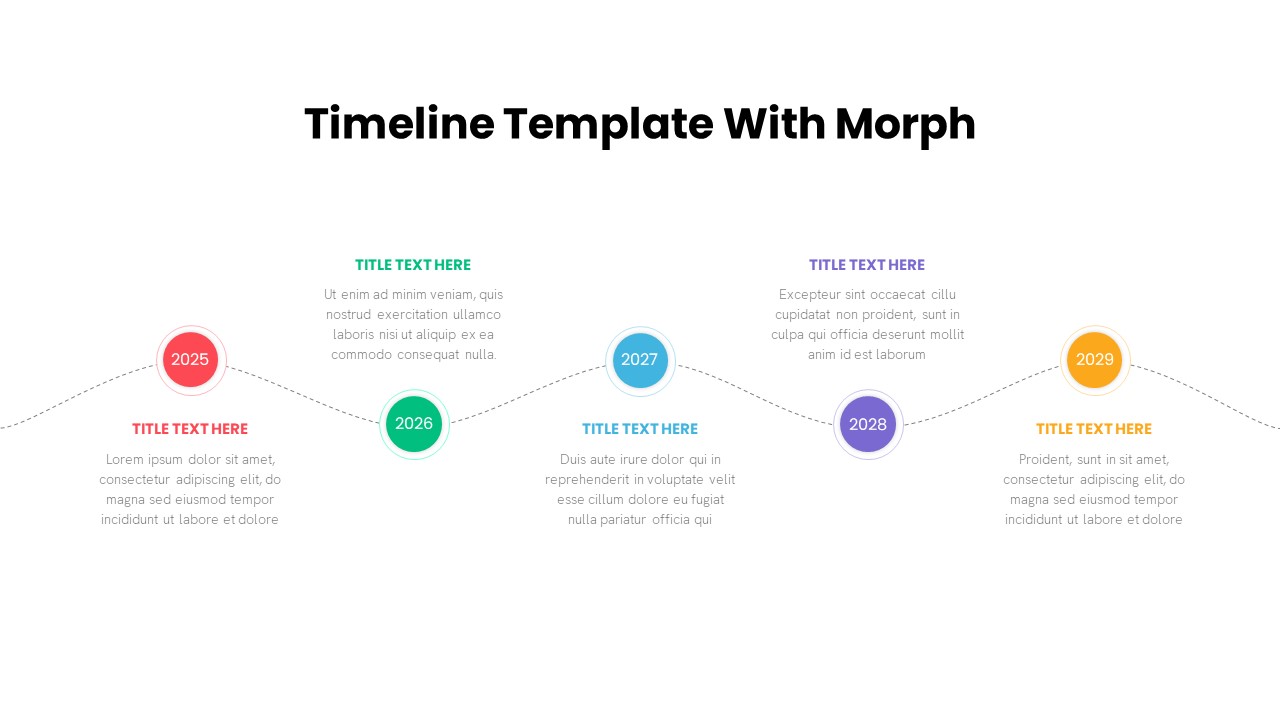
Five-Step Timeline with Morph Animation Template for PowerPoint & Google Slides
Timeline
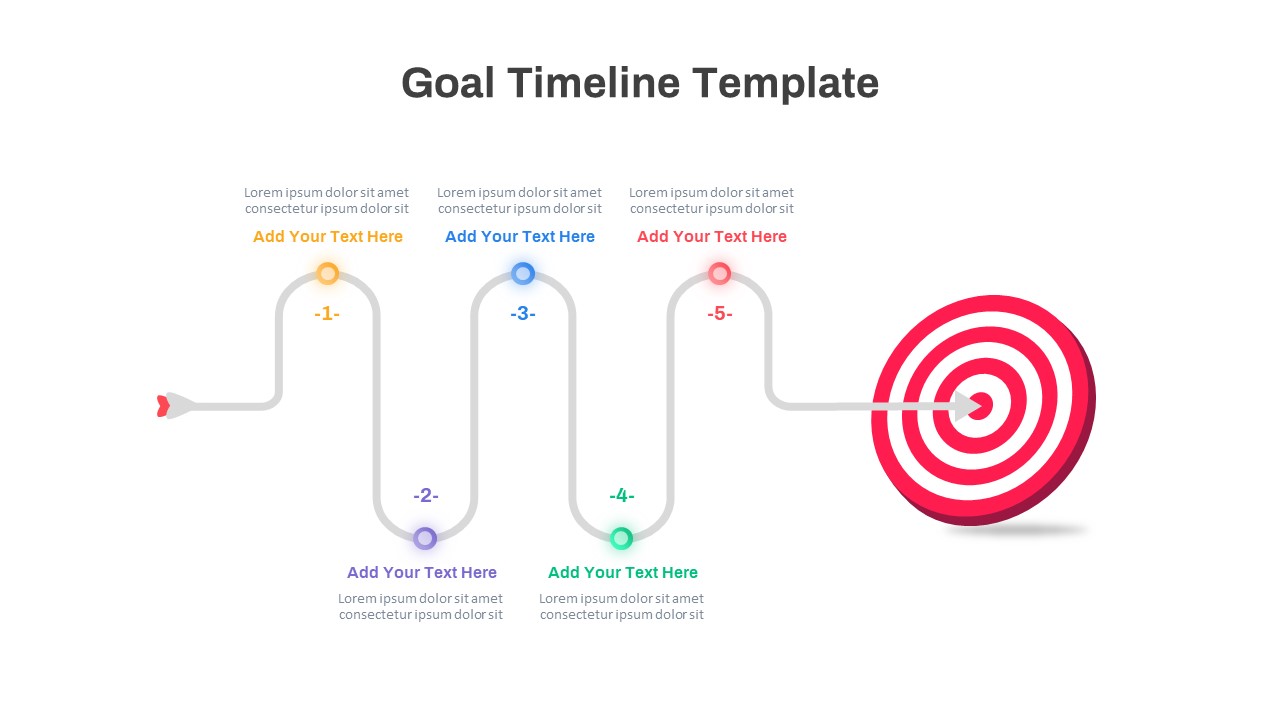
Colorful Five-Step Goal Timeline Template for PowerPoint & Google Slides
Timeline
Free Five-Step Employee Onboarding Process Template for PowerPoint & Google Slides
Recruitment
Free
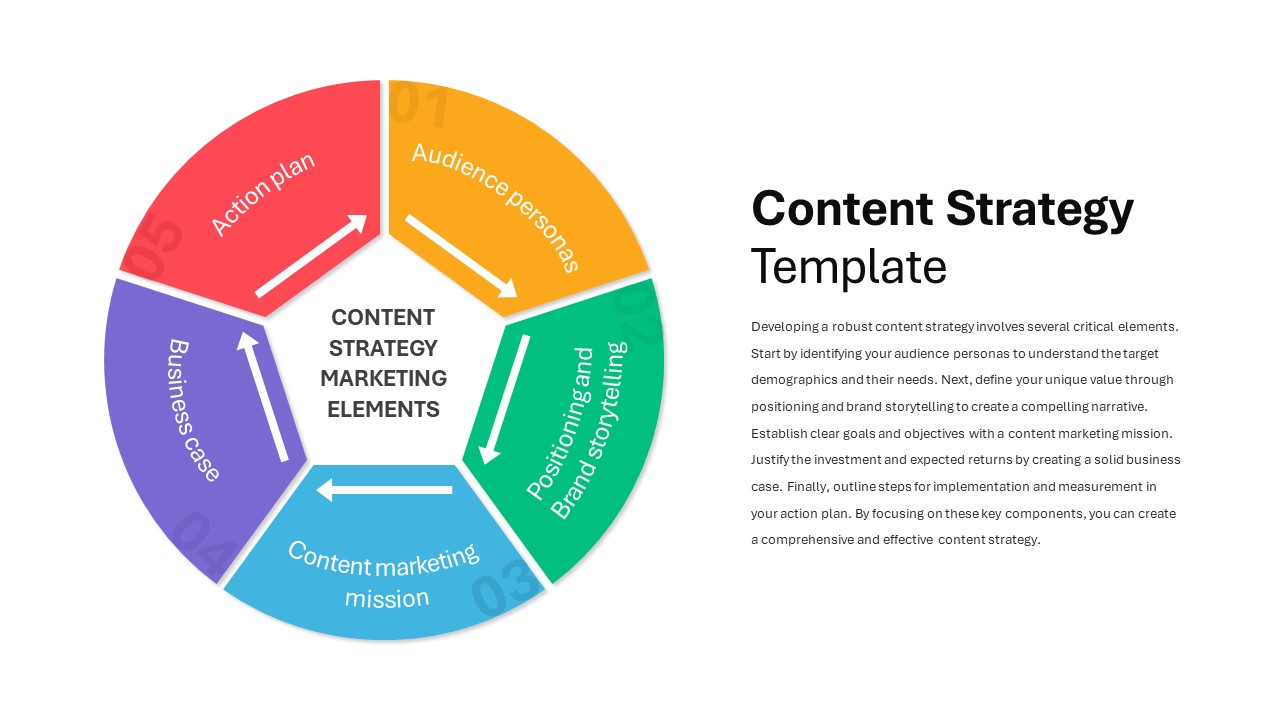
Five-Step Content Strategy Marketing Template for PowerPoint & Google Slides
Circular
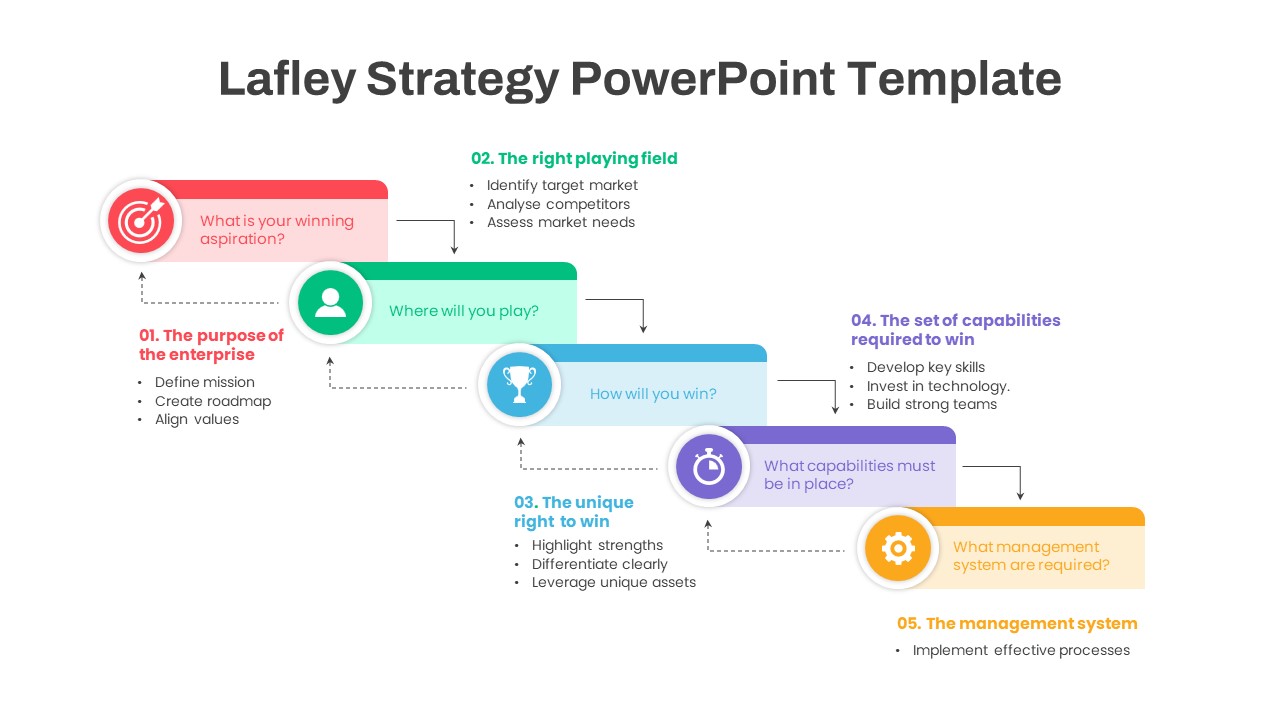
Lafley Strategy Five-Step Framework Template for PowerPoint & Google Slides
Business Strategy
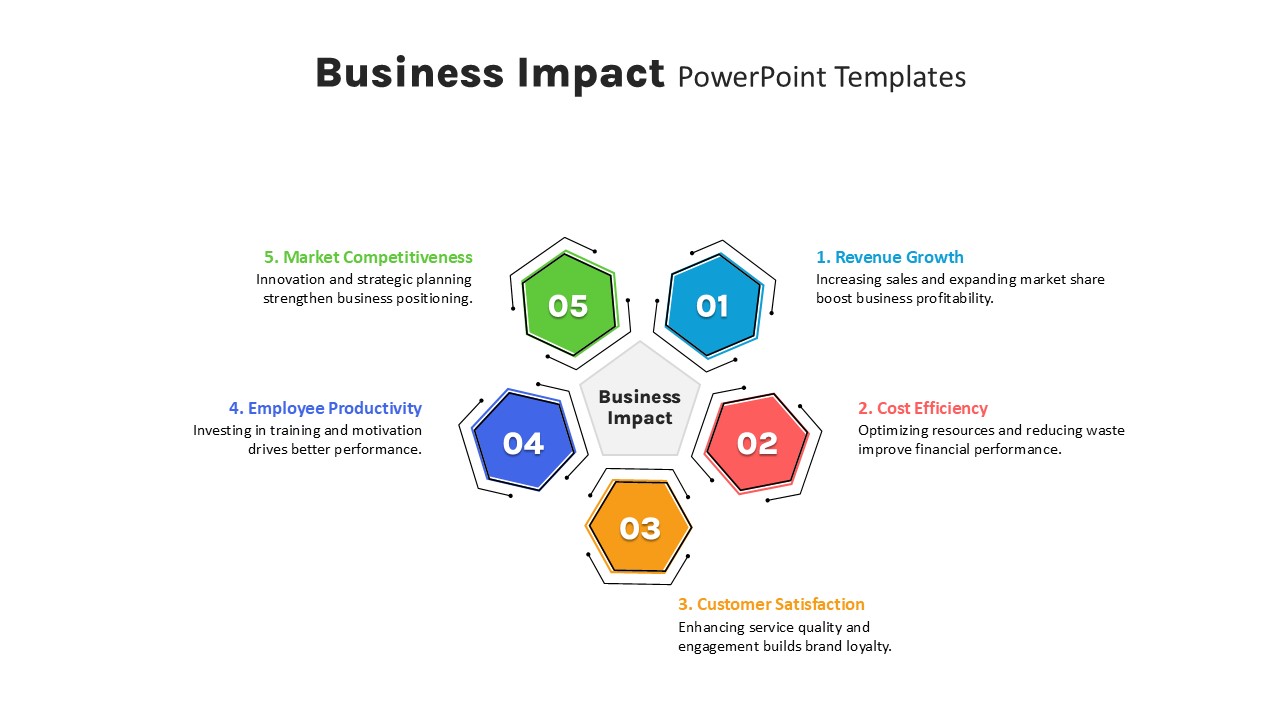
Five-Step Hexagon Business Impact Template for PowerPoint & Google Slides
Circular
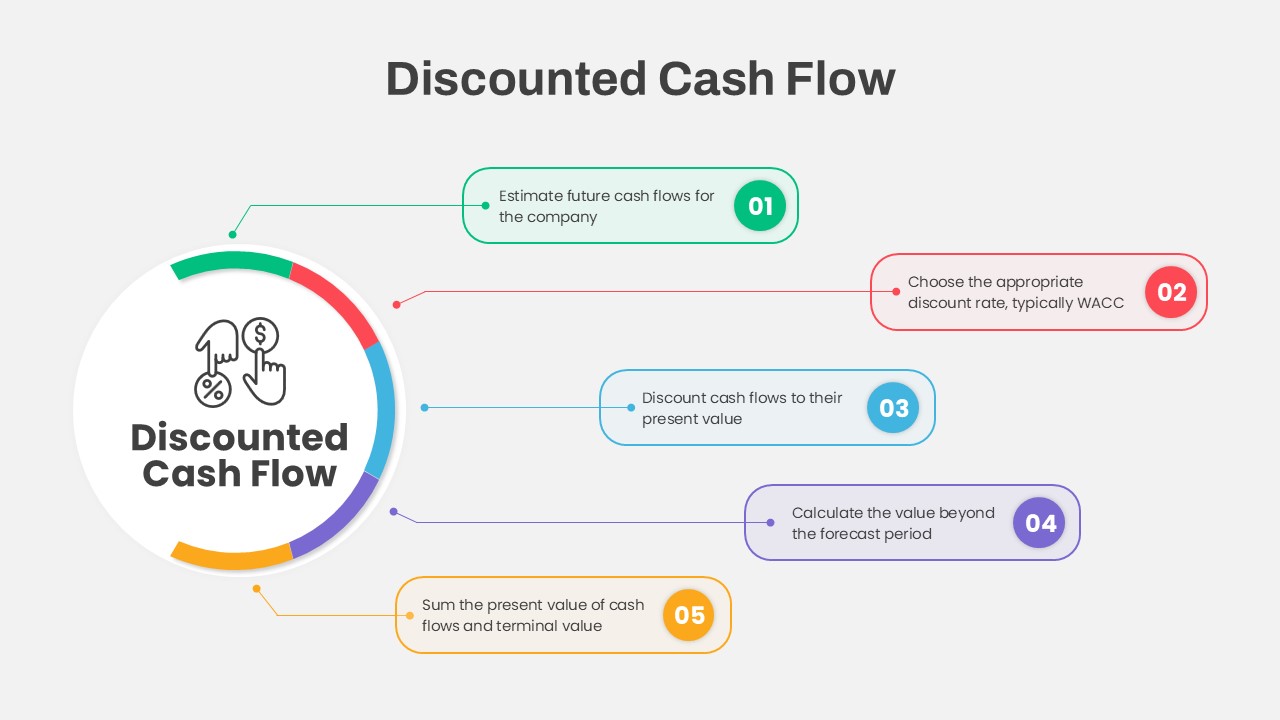
Discounted Cash Flow Five-Step Process Template for PowerPoint & Google Slides
Process
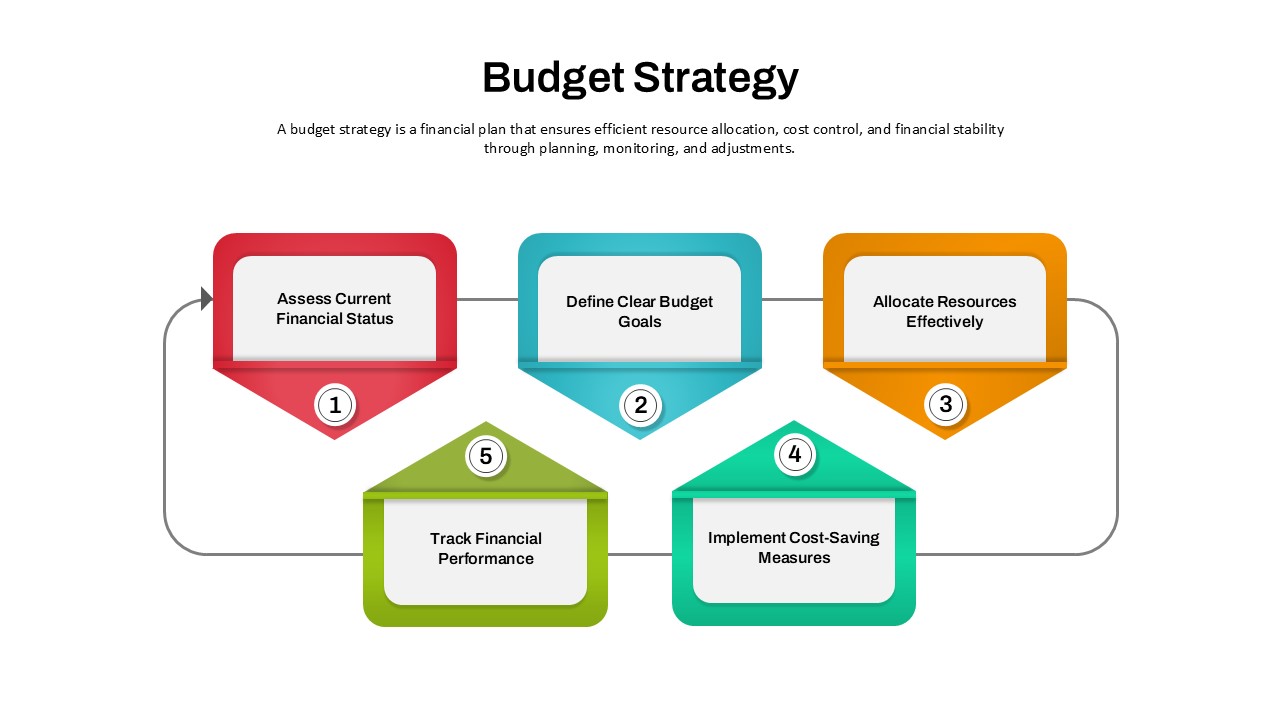
Budget Strategy Five-Step Process Template for PowerPoint & Google Slides
Finance
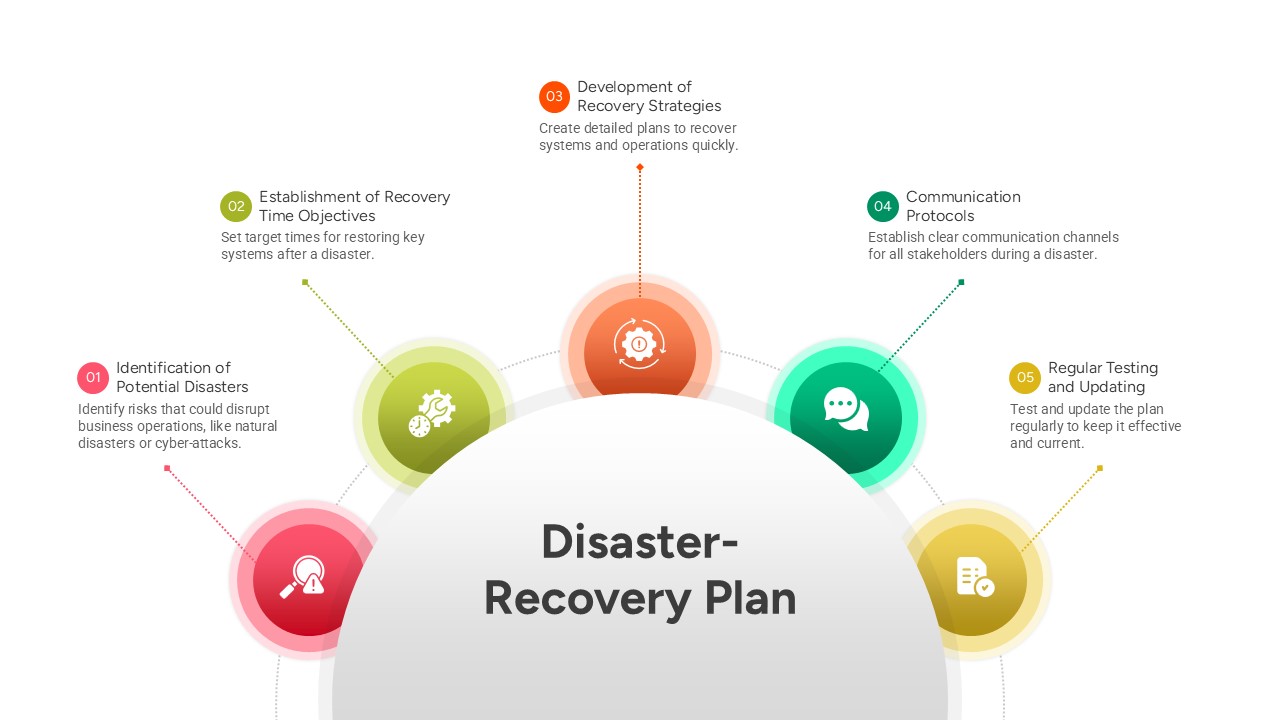
Five-Step Disaster Recovery Plan Template for PowerPoint & Google Slides
Project
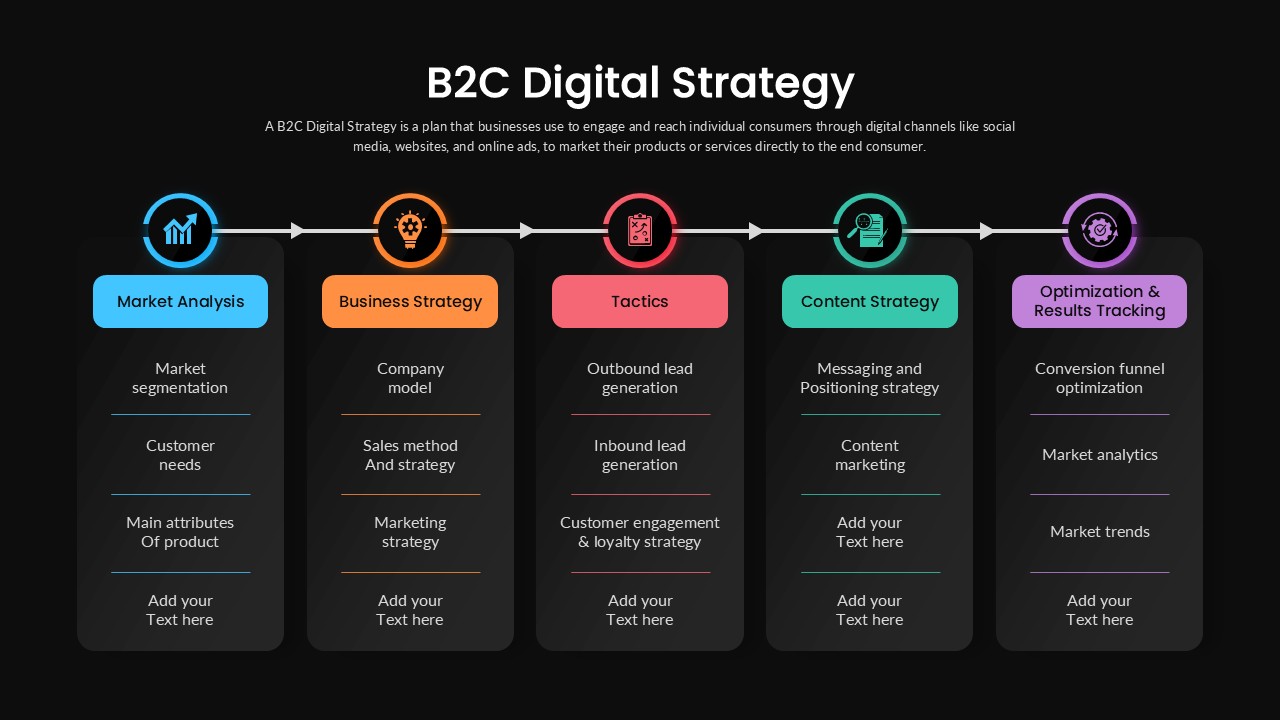
B2C Digital Strategy Five-Step Template for PowerPoint & Google Slides
Digital Marketing
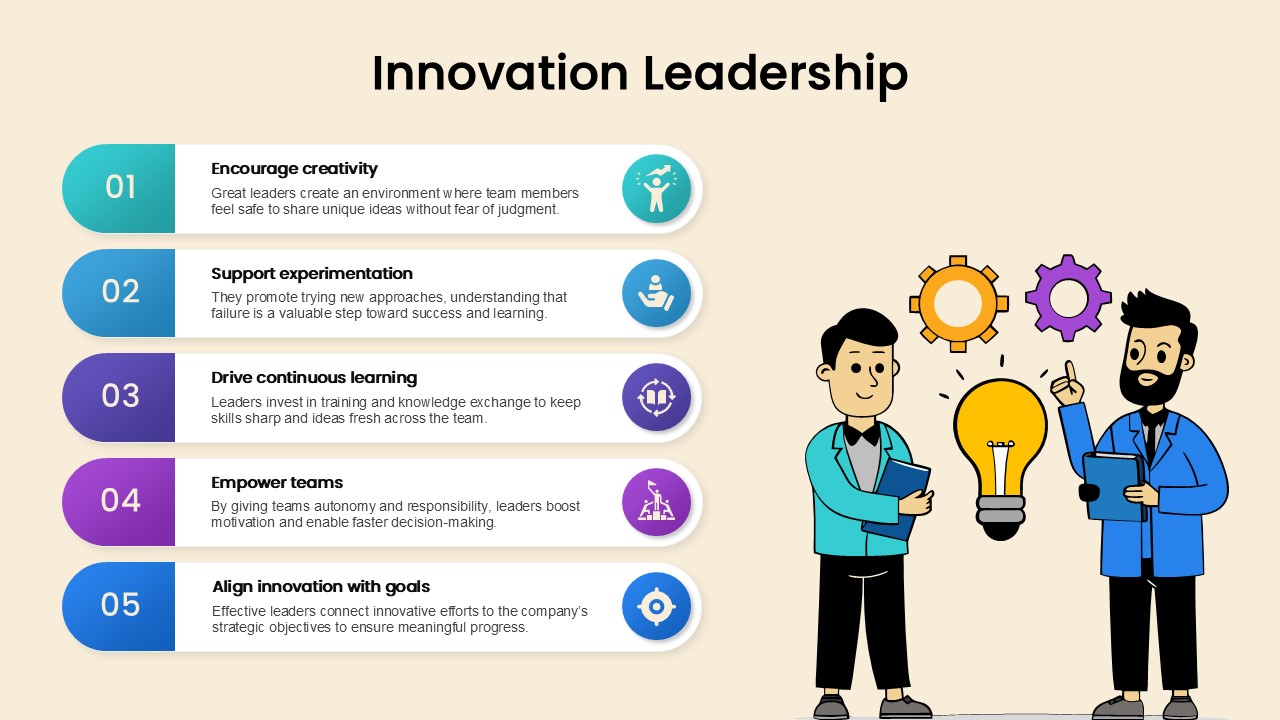
Innovation Leadership Five-Step List Template for PowerPoint & Google Slides
Leadership
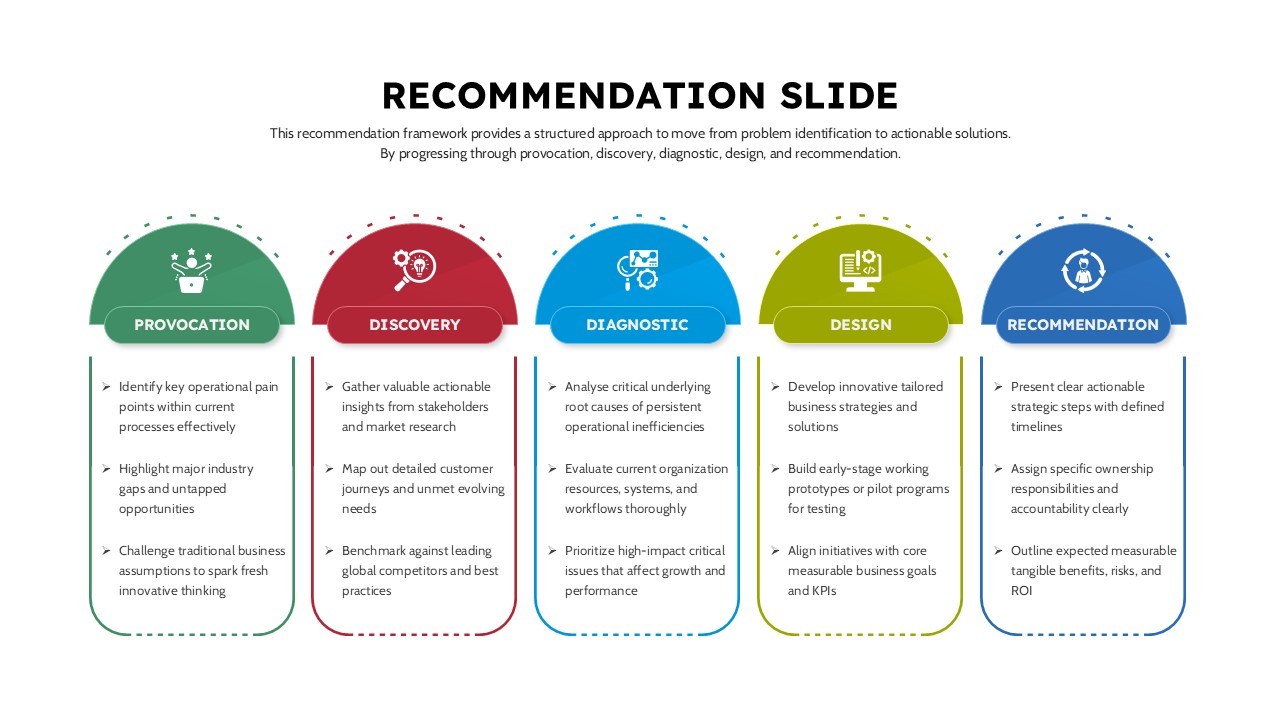
Five-Step Business Recommendation Slide for PowerPoint & Google Slides
Process
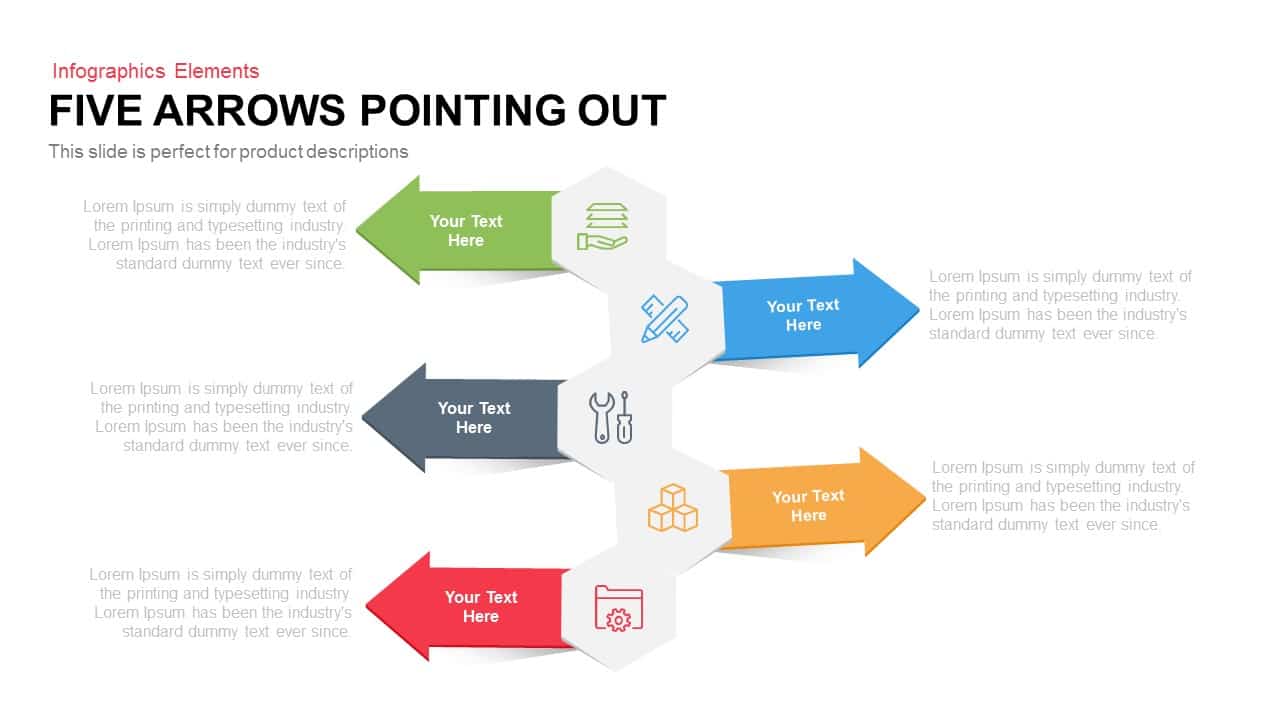
Five Arrows Pointing Out Infographic Template for PowerPoint & Google Slides
Arrow
Five 3D Growth Arrow Infographic Slide Template for PowerPoint & Google Slides
Arrow
Three Four Five Stage Timeline Infographic Template for PowerPoint & Google Slides
Timeline
Curved Five-Section Timeline Infographic template for PowerPoint & Google Slides
Timeline
Five-Stage People Infographic Chart template for PowerPoint & Google Slides
Process
Five-Stage Growth Arrow Infographic Template for PowerPoint & Google Slides
Arrow
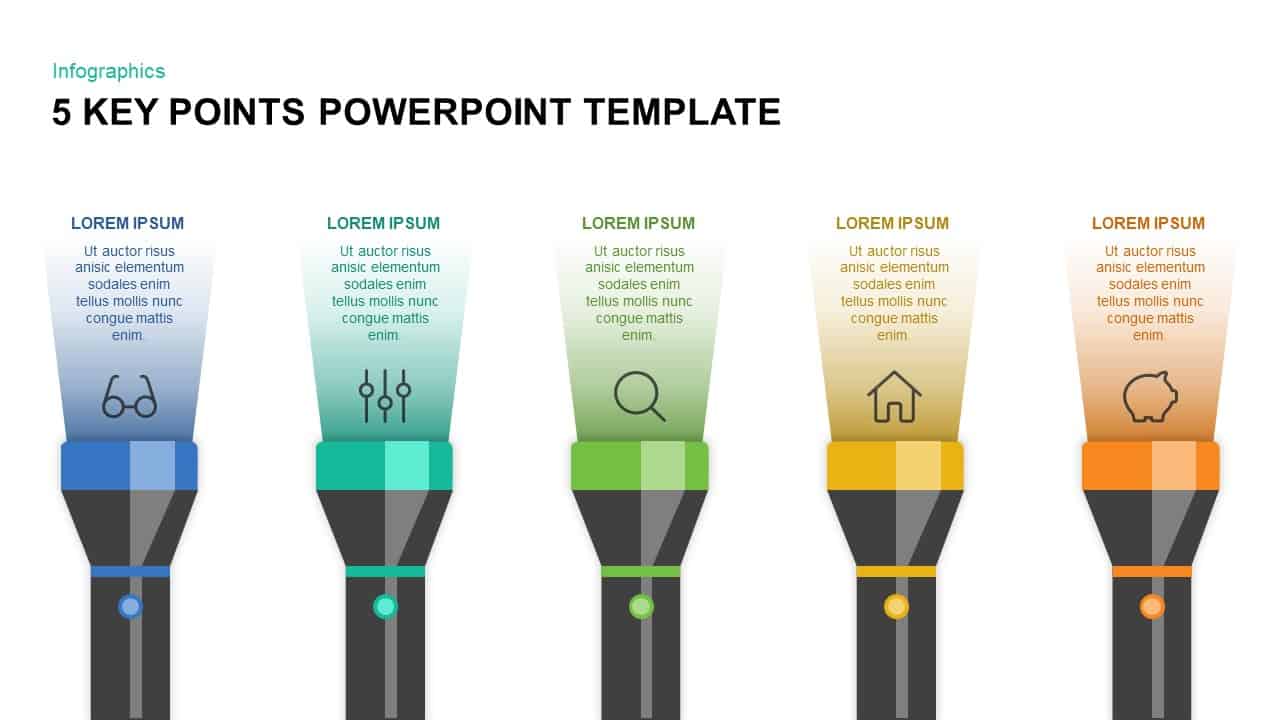
Five Key Flashlight Infographic Points Template for PowerPoint & Google Slides
Agenda
Five-Year Gradient Timeline Infographic Template for PowerPoint & Google Slides
Timeline
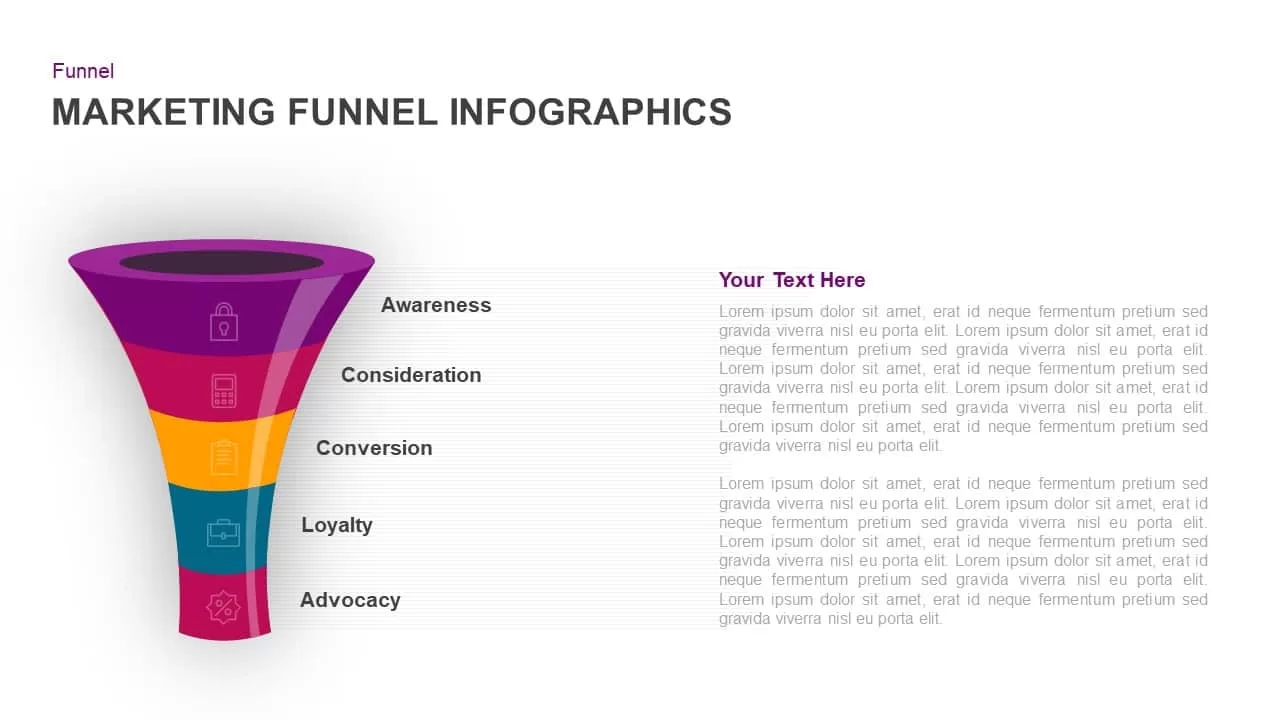
Five-Stage Marketing Funnel Infographic Template for PowerPoint & Google Slides
Funnel
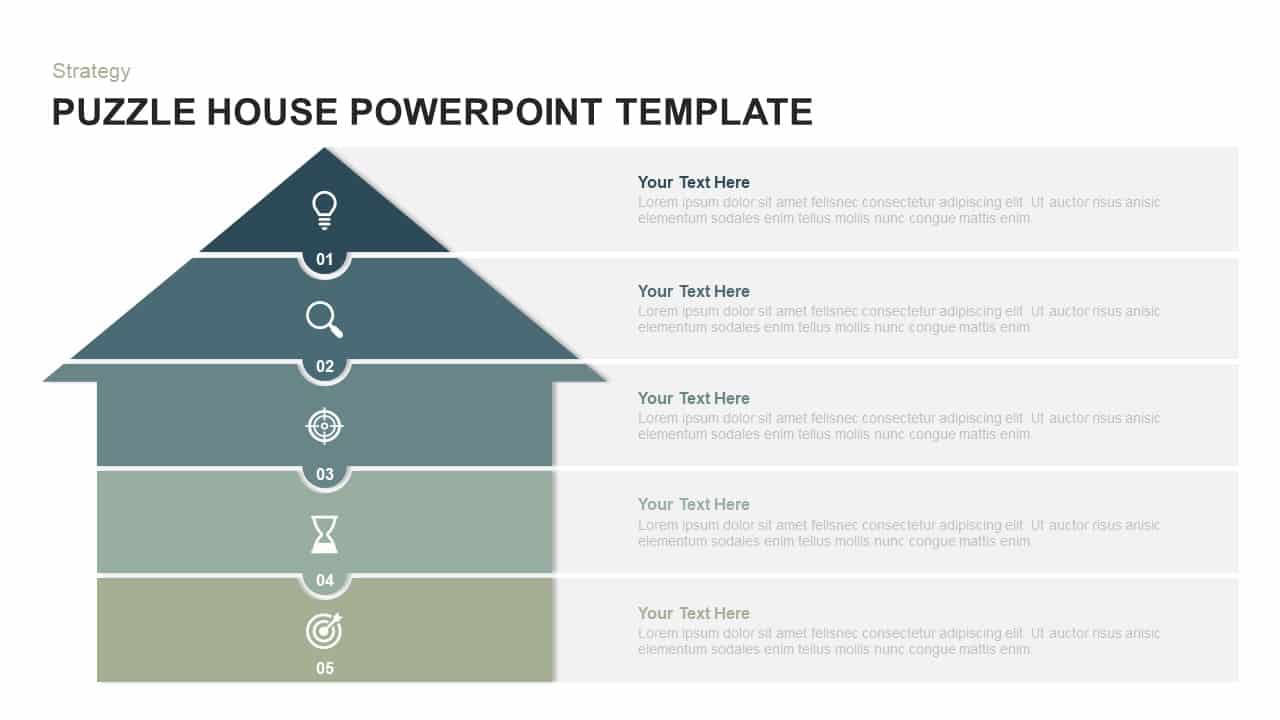
Five-Level Puzzle House Infographic Template for PowerPoint & Google Slides
Pyramid
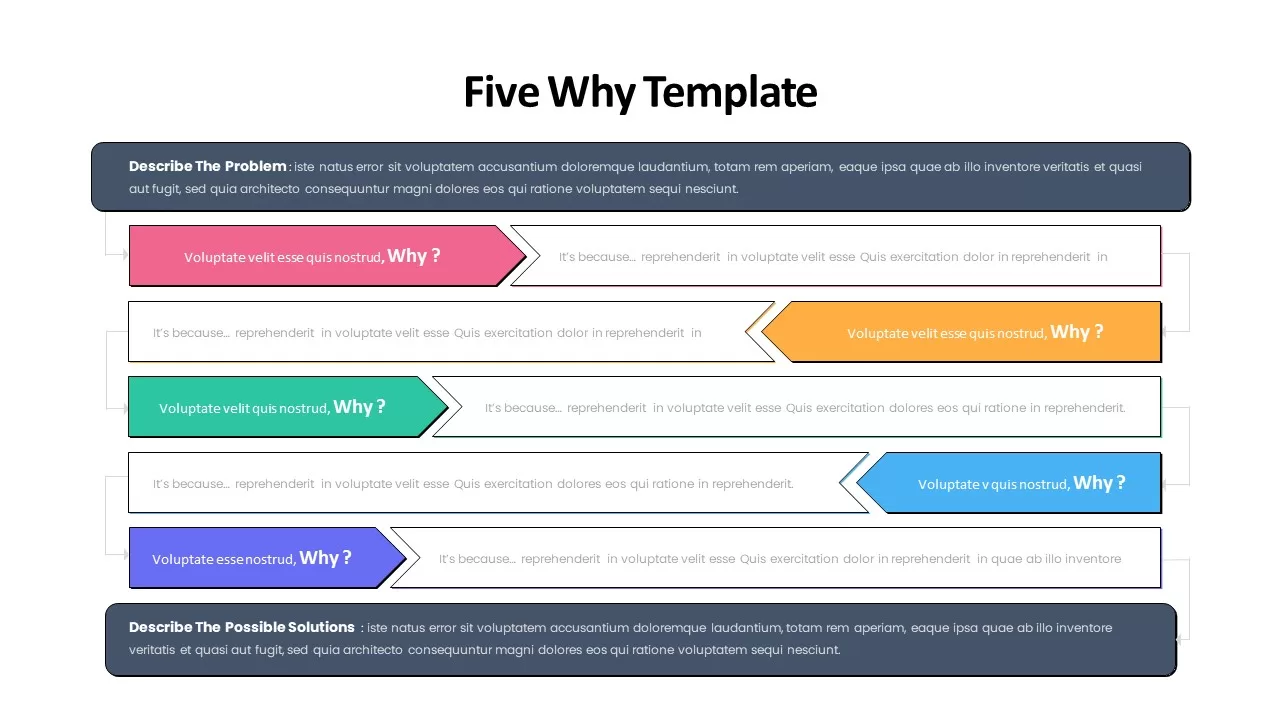
Five Whys Infographic template for PowerPoint & Google Slides
Business
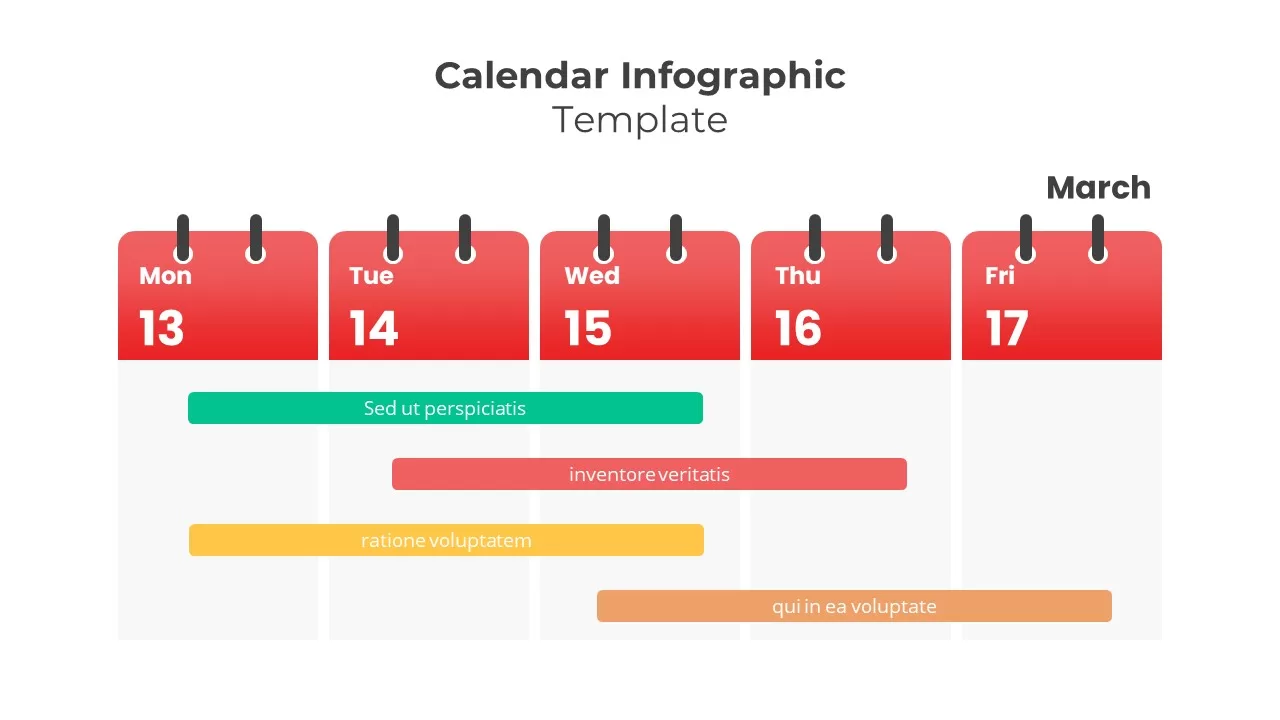
Weekly Five-Day Calendar Infographic Template for PowerPoint & Google Slides
Timeline
Five-Stage Circular Arrow Infographic Template for PowerPoint & Google Slides
Circular
Free Five-Part Hexagon Infographic Cluster Template for PowerPoint & Google Slides
Infographics
Free
Colorful Five-Option Ribbon Infographic Template for PowerPoint & Google Slides
Process

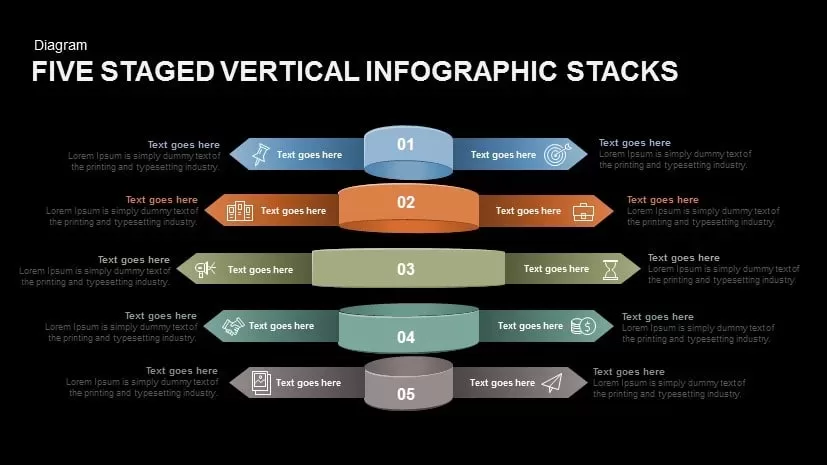
Five Staged Vertical Infographic Stacks for PowerPoint & Google Slides
Process
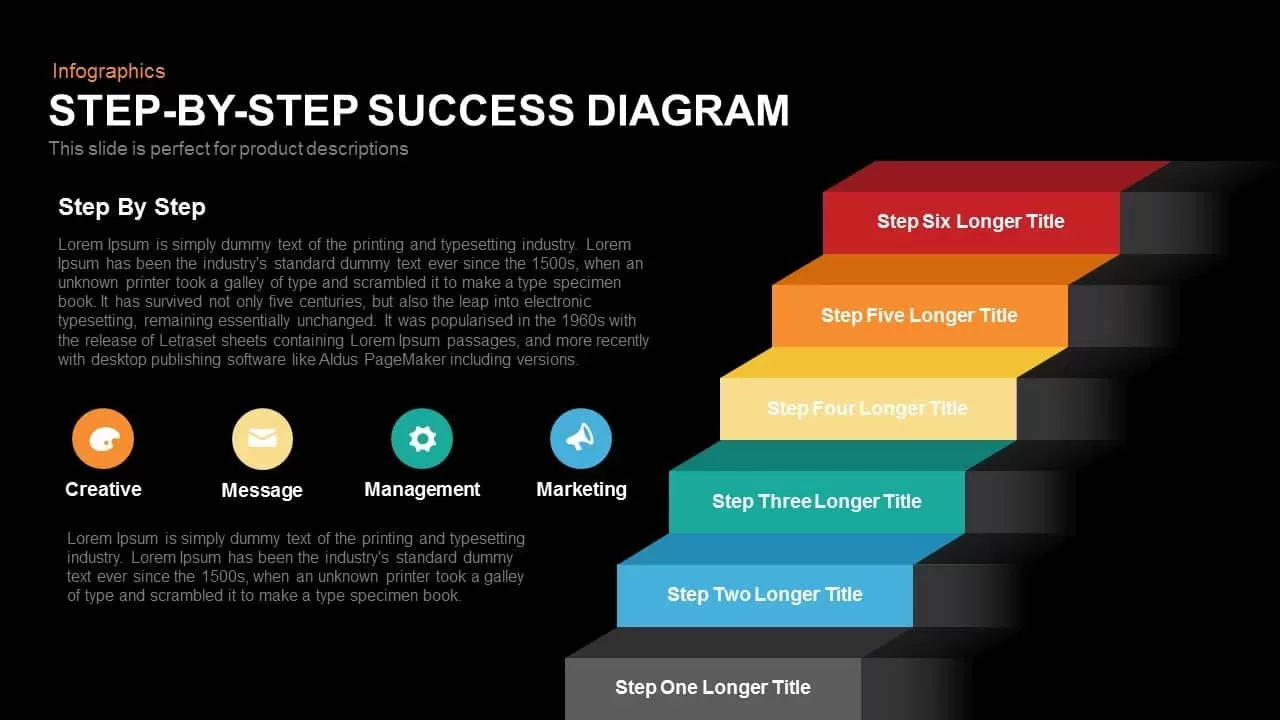
Step-by-Step Success Staircase Diagram template for PowerPoint & Google Slides
Process
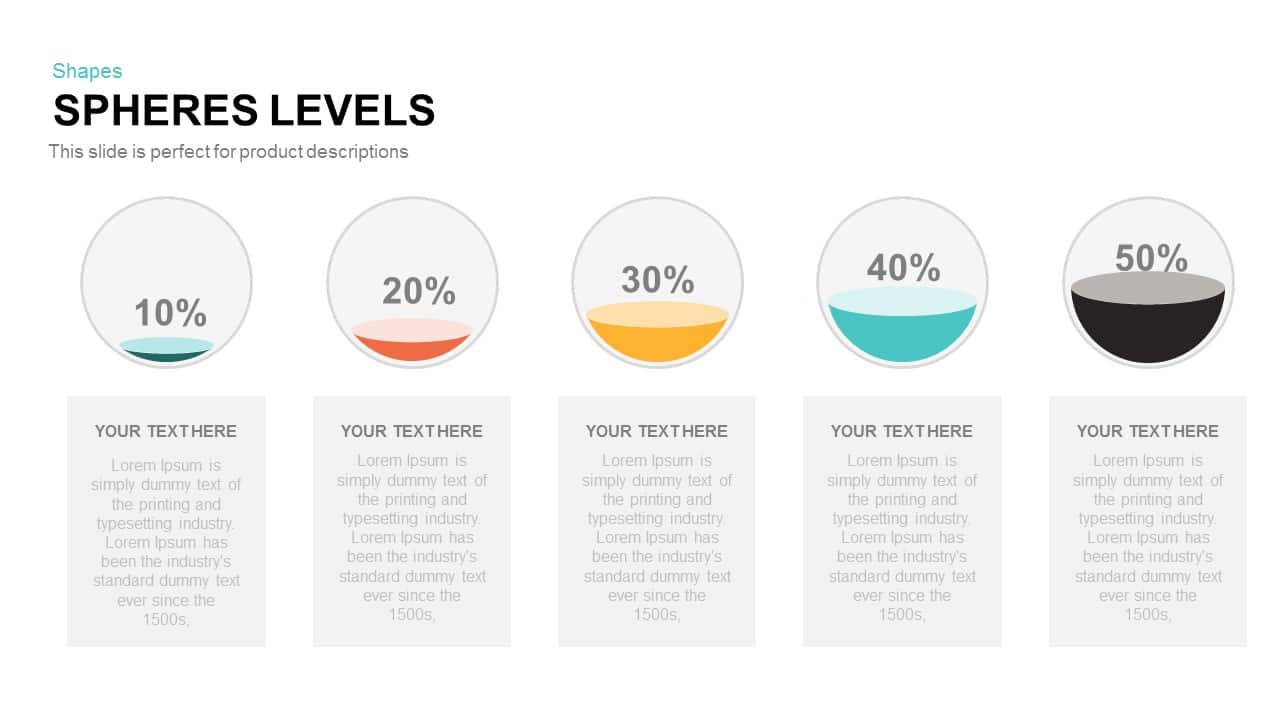
Five-Level Sphere Indicators Diagram template for PowerPoint & Google Slides
Infographics
Five-Section Circular Arrow Diagram Template for PowerPoint & Google Slides
Circular
Five-Stage Zig-Zag Arrow Diagram Template for PowerPoint & Google Slides
Process
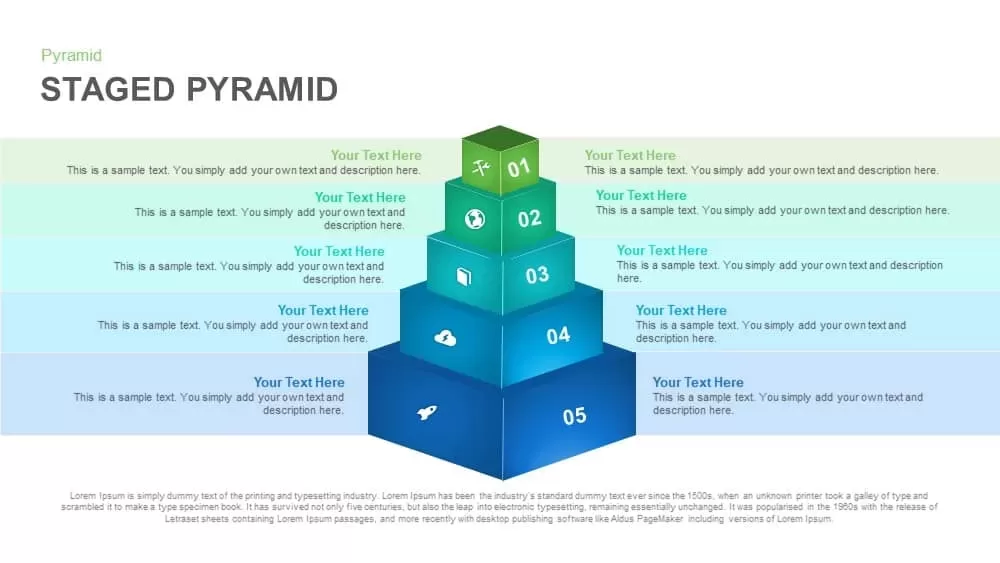
Five-Level Staged Pyramid Diagram Template for PowerPoint & Google Slides
Pyramid
Five-Stage Agenda Flow Diagram Template for PowerPoint & Google Slides
Agenda
Five-Stage Slanted Timeline Diagram Template for PowerPoint & Google Slides
Timeline
Five-Stage Pipe Process Diagram Template for PowerPoint & Google Slides
Process
Five-Input Cause and Effect Diagram Template for PowerPoint & Google Slides
Arrow
3D Five-Stage Pyramid Diagram Slide Template for PowerPoint & Google Slides
Pyramid
Five Circle Venn Diagram for Template for PowerPoint & Google Slides
Circular
Puzzle Shape Diagram with Five Elements Template for PowerPoint & Google Slides
Circular