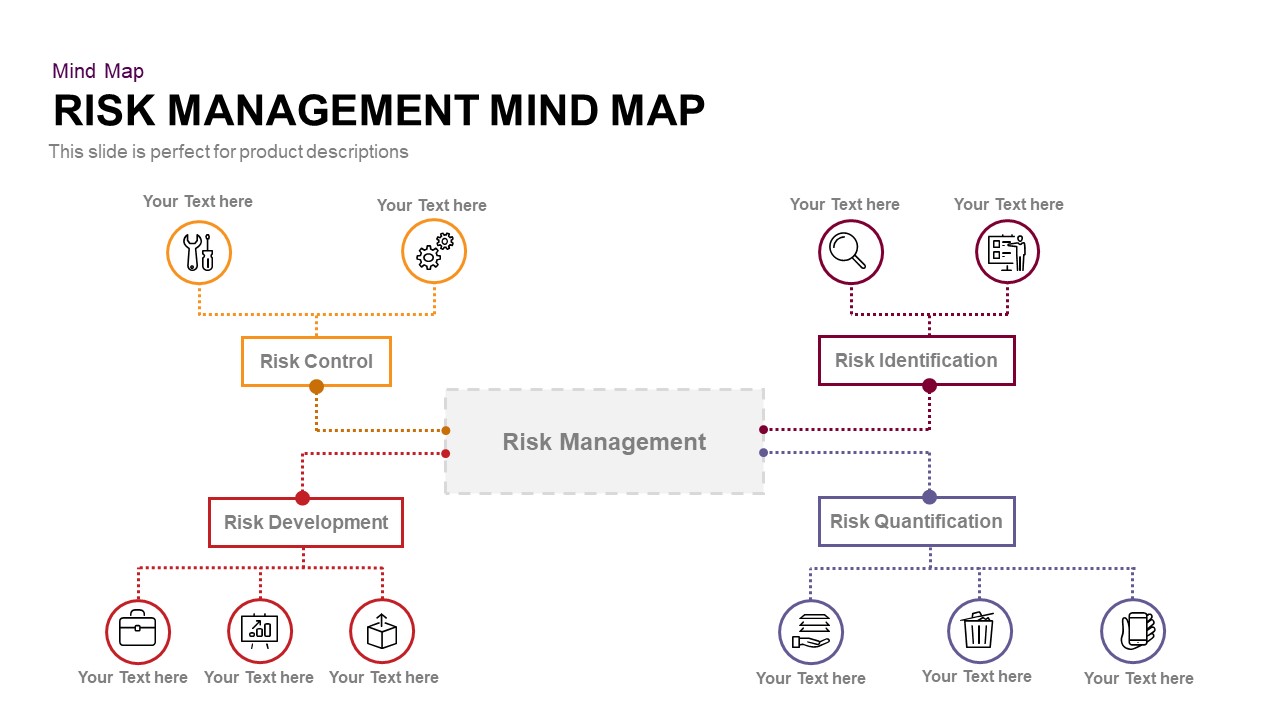
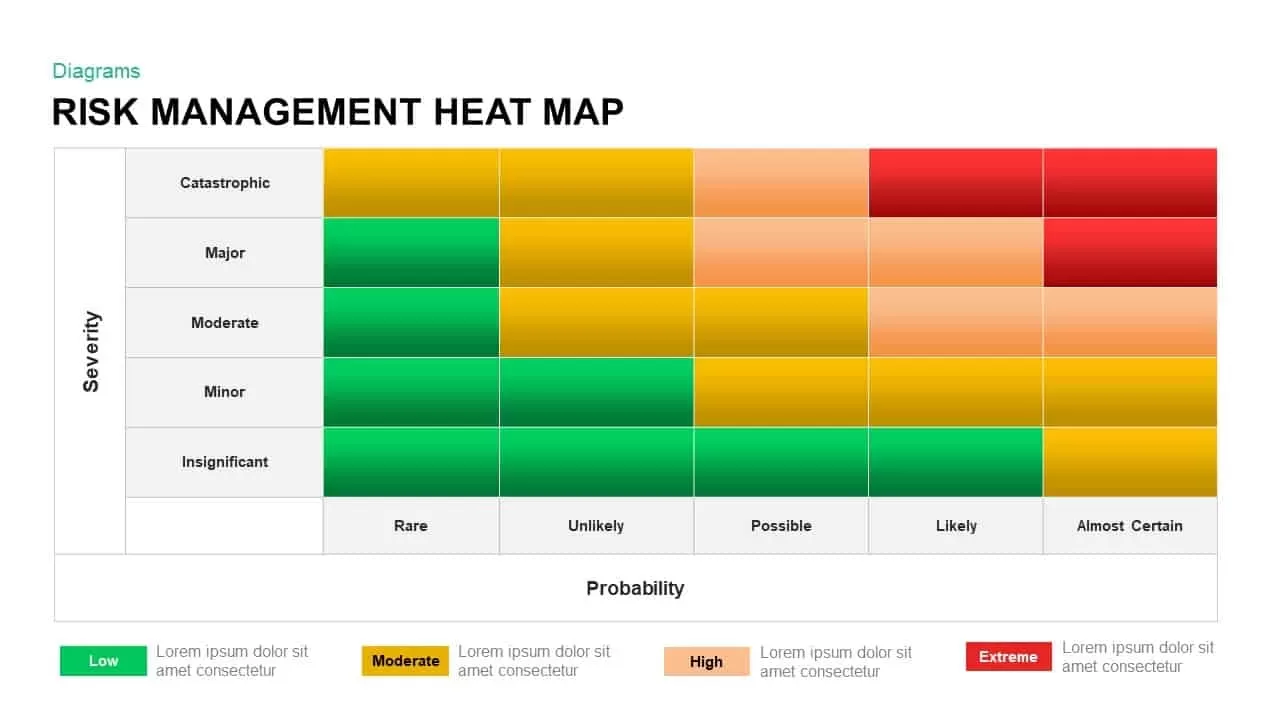
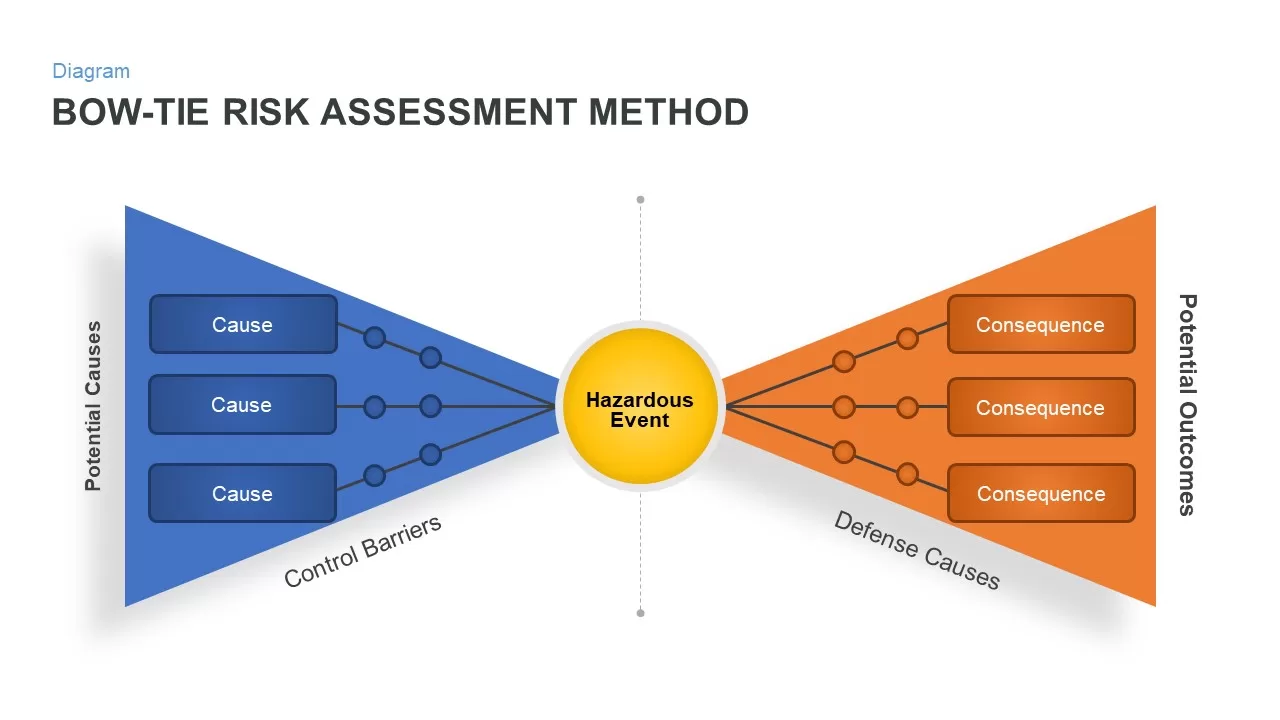
Enterprise Risk Management Cycle Diagram Template for PowerPoint & Google Slides
Description
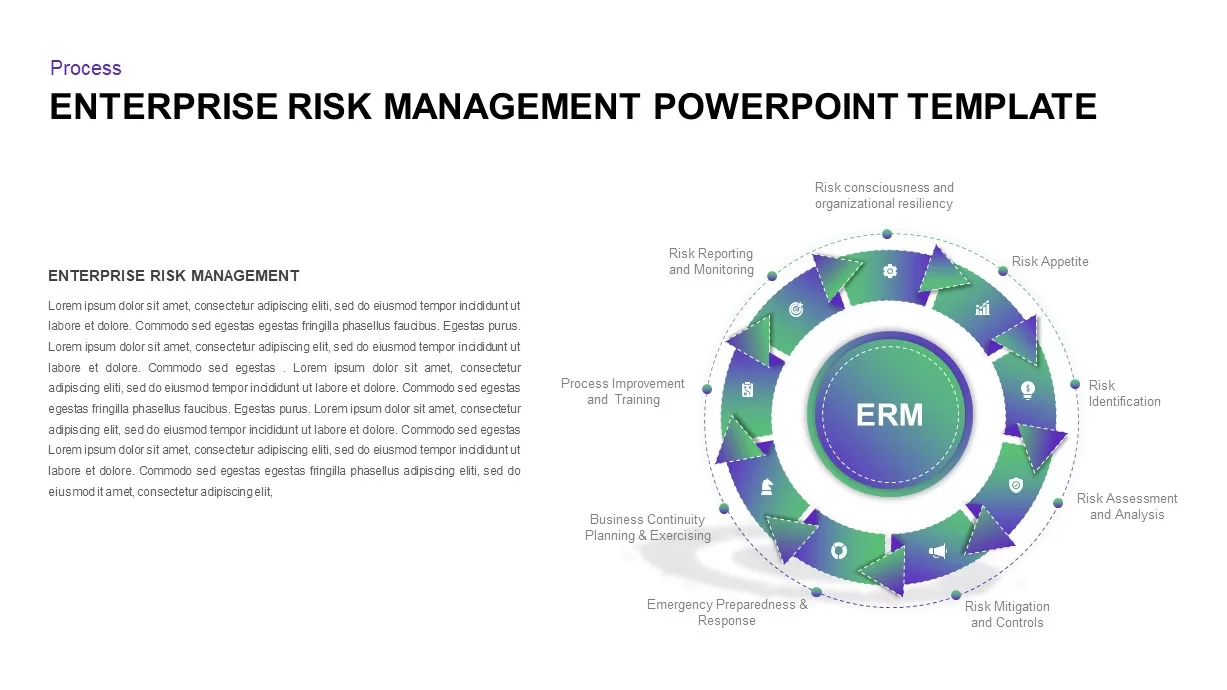
Use this enterprise risk management cycle infographic to clearly communicate the end-to-end ERM framework and reinforce proactive governance. At the center sits a bold ERM hub encircled by eight gradient arrows, each stylized with a smooth green-to-purple transition. Vector icons and dashed connectors annotate each process stage—Risk Appetite, Risk Identification, Risk Assessment & Analysis, Risk Mitigation & Controls, Emergency Preparedness & Response, Business Continuity Planning & Exercising, Process Improvement & Training, and Risk Reporting & Monitoring—culminating in Risk Consciousness and Organizational Resiliency. The clean white background, minimalist sans-serif typography, and subtle drop shadows keep the focus squarely on your risk data.
Built on fully editable master slides for both PowerPoint and Google Slides, this infographic delivers complete creative control. Swap gradient endpoints, replace icons, or relabel callouts in seconds using drag-and-drop placeholders. All shapes are vector-based for perfect scaling, and theme-aware elements automatically align with your brand palette. Smart guides maintain consistent spacing and help you extend or condense the cycle by adding or removing arrows without breaking the layout.
Ideal for executive briefings, board presentations, and compliance workshops, this slide simplifies the presentation of complex governance frameworks. Use it to map maturity levels, align cross-functional teams on risk appetite, and demonstrate continuity plans. Duplicate segments to focus on specific departments or overlay performance metrics on each arrow. This versatile design also adapts to audit cycle overviews, security workflows, or continuous improvement roadmaps—supporting dynamic, data-driven storytelling across any enterprise context.
Color-coded gradients and iconography create a memorable visual hierarchy that reinforces your messaging at every step.
Who is it for
Chief Risk Officers, compliance managers, internal auditors, and business continuity planners will leverage this cycle diagram to align stakeholders on ERM processes, track governance milestones, and drive a culture of risk awareness across the enterprise.
Other Uses
Repurpose this infographic for IT security risk reviews, internal audit frameworks, vendor risk assessments, or training modules on crisis response and continuity planning. Simply relabel callouts and adjust gradients to match any continuous-improvement or cyclical process.
Login to download this file


