End of Year Review Dashboard Template for PowerPoint & Google Slides

Description
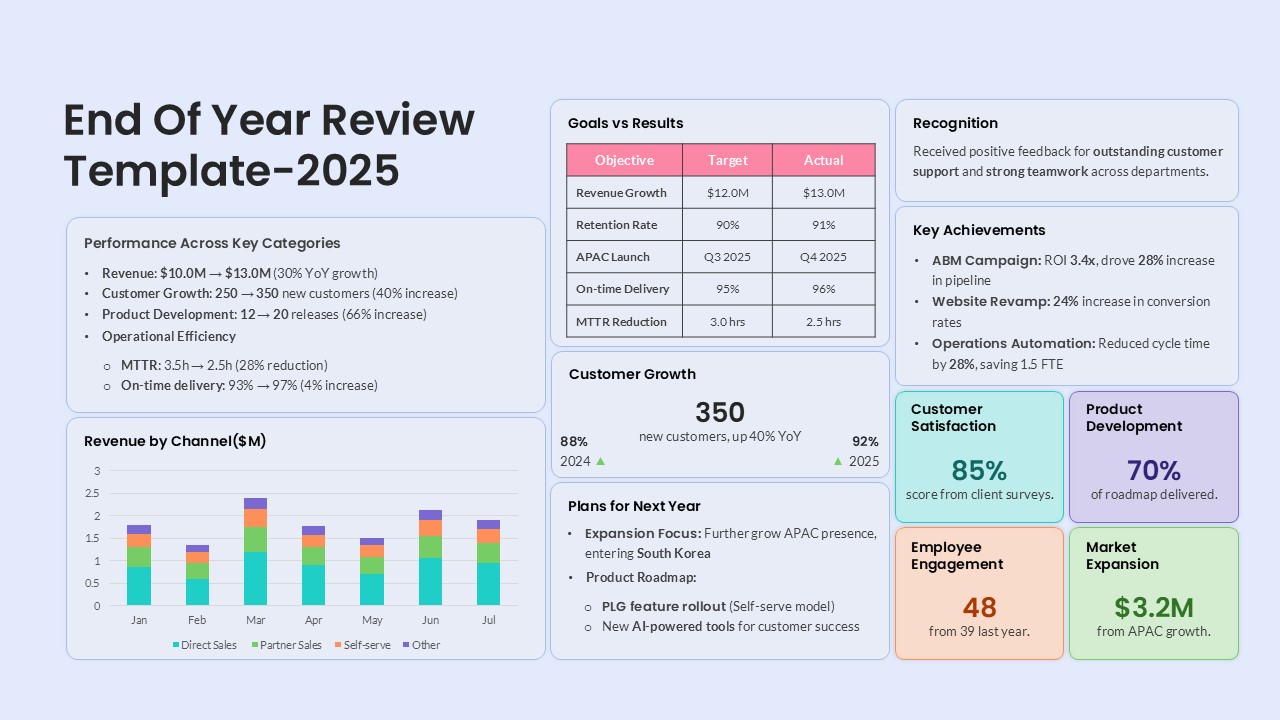
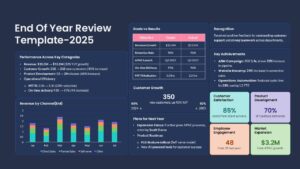
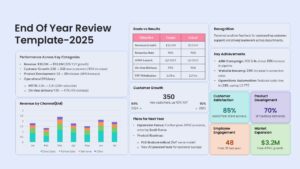
Summarize your organization’s annual performance with this comprehensive End of Year Review Dashboard slide. The template provides a data-driven overview of key business metrics and achievements, combining visual clarity with executive-level insight. At the top, clear typography highlights the reporting year, while the dark background enhances contrast for charts and text blocks.
The layout divides performance insights into multiple sections: Performance Across Key Categories, Goals vs Results, Customer Growth, and Key Achievements, offering a structured summary of financial, operational, and strategic outcomes. A multi-colored bar chart showcases Revenue by Channel, while data cards on the right display core KPIs such as Customer Satisfaction (85%), Product Development (70%), Employee Engagement (48), and Market Expansion ($3.2M). The slide also features recognition highlights and next-year plans, ensuring a balanced view of both achievements and future objectives.
Using cool, professional shades of navy, mint green, lavender, and coral, the slide delivers a modern corporate look suited for board meetings, quarterly reviews, or investor updates. Fully editable in PowerPoint and Google Slides, users can update metrics, charts, and text to align with their organization’s performance indicators. This design helps teams visualize progress, measure success, and set clear priorities for the upcoming year.
Who is it for
Ideal for executives, department heads, business analysts, and project managers presenting annual or quarterly performance summaries to stakeholders or leadership teams.
Other Uses
Can also be used for sales performance reviews, KPI dashboards, startup growth summaries, or strategic planning presentations.
Login to download this file

Item ID
SB05654Designed By
Niranjana
Related Templates

Free Quarterly Business Review Dashboard Template for PowerPoint & Google Slides
Business
Free
Quarterly Business Review Dashboard Template for PowerPoint & Google Slides
Pitch Deck
Monthly Business Review Dashboard Deck Template for PowerPoint & Google Slides
Business Report
Year in Review KPI Highlights Slide for PowerPoint & Google Slides
Business Report
Year-over-Year Stacked Gender Bar Chart Template for PowerPoint & Google Slides
Bar/Column
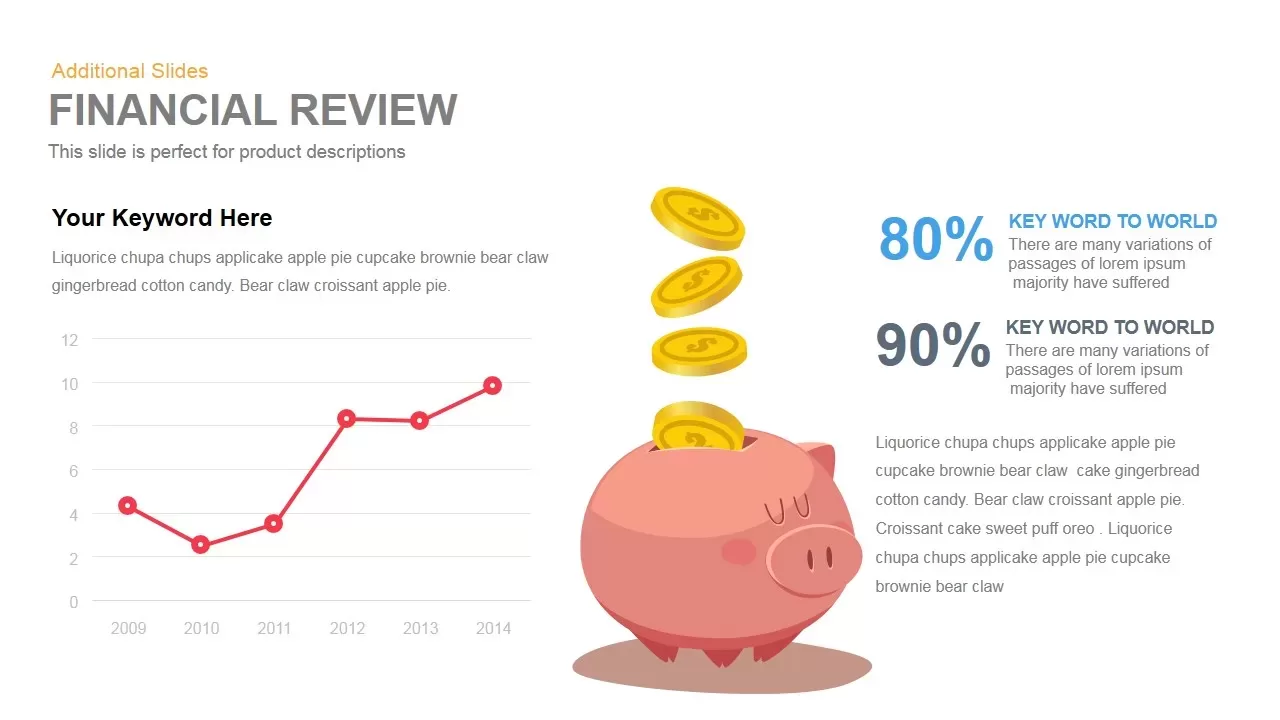
Financial Review template for PowerPoint & Google Slides
Finance
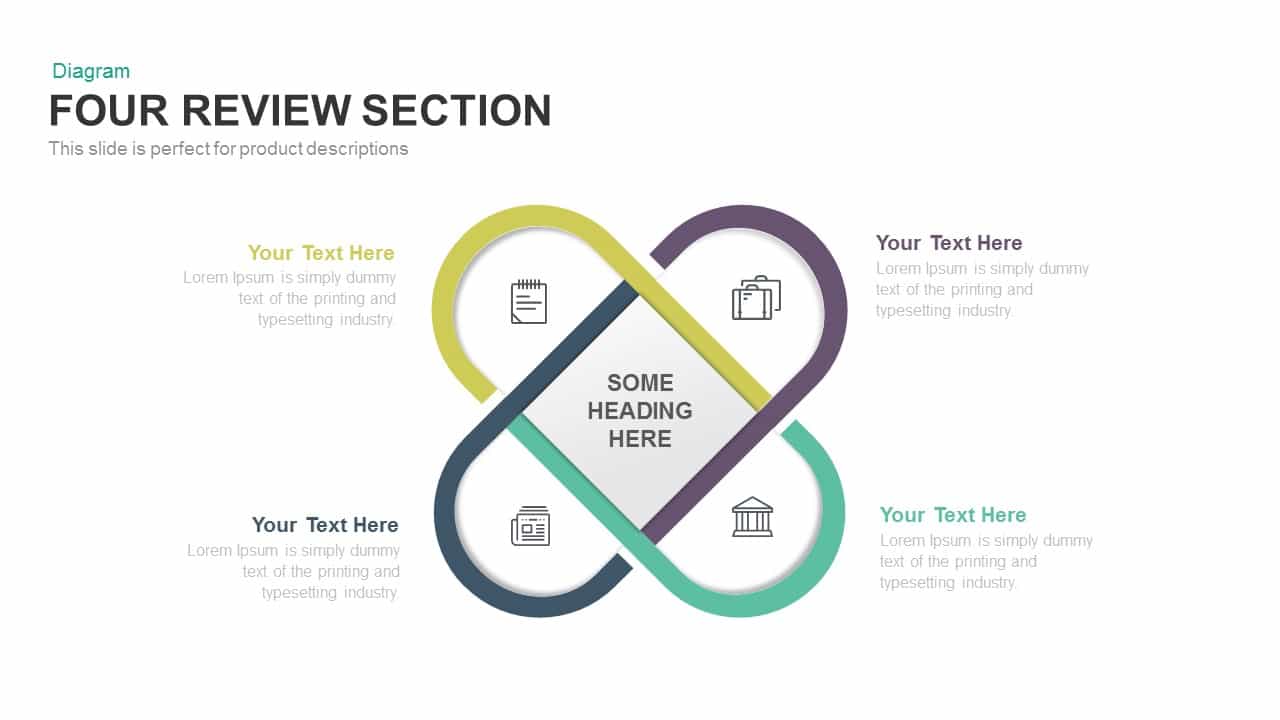
Clean Four-Section Review Diagram Template for PowerPoint & Google Slides
Agenda
Performance Review Process Management Cycle template for PowerPoint & Google Slides
Employee Performance
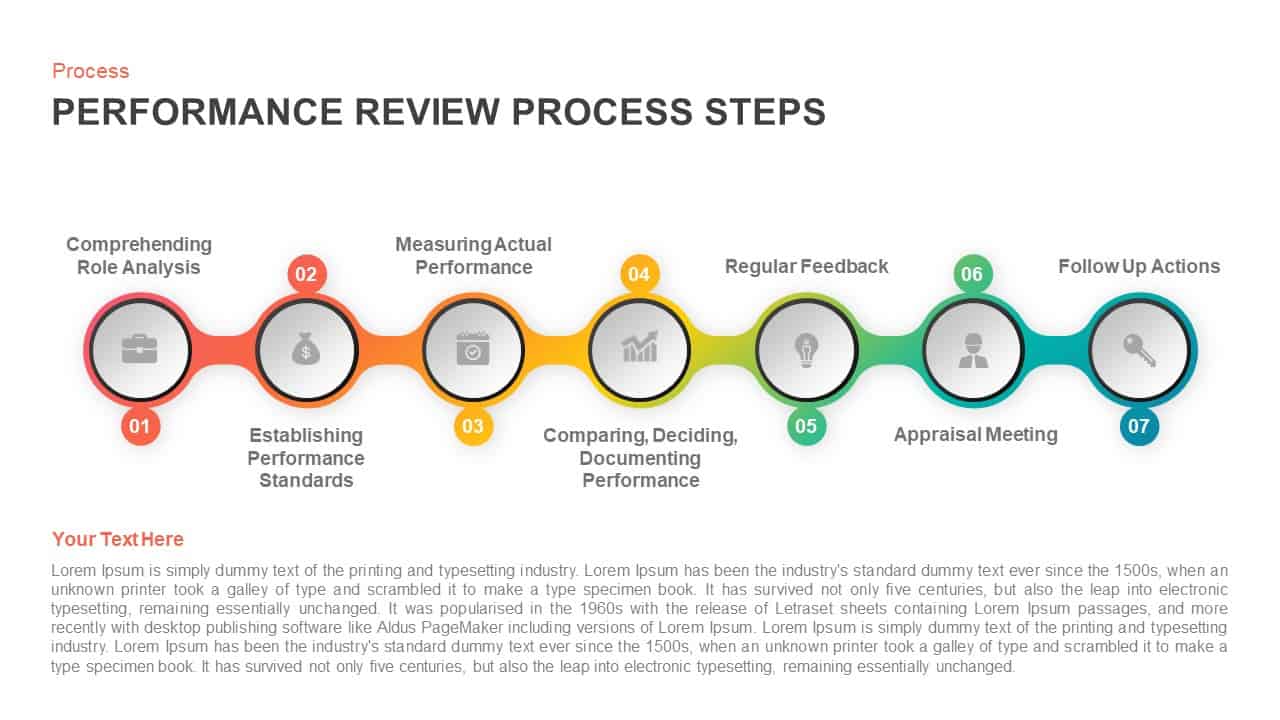
Performance Review Process Steps Template for PowerPoint & Google Slides
Employee Performance
Performance Review Progress Management Template for PowerPoint & Google Slides
Process
Professional Book Review Infographic Template for PowerPoint & Google Slides
Business
Business Review Deck with Market Updates Template for PowerPoint & Google Slides
Company Profile
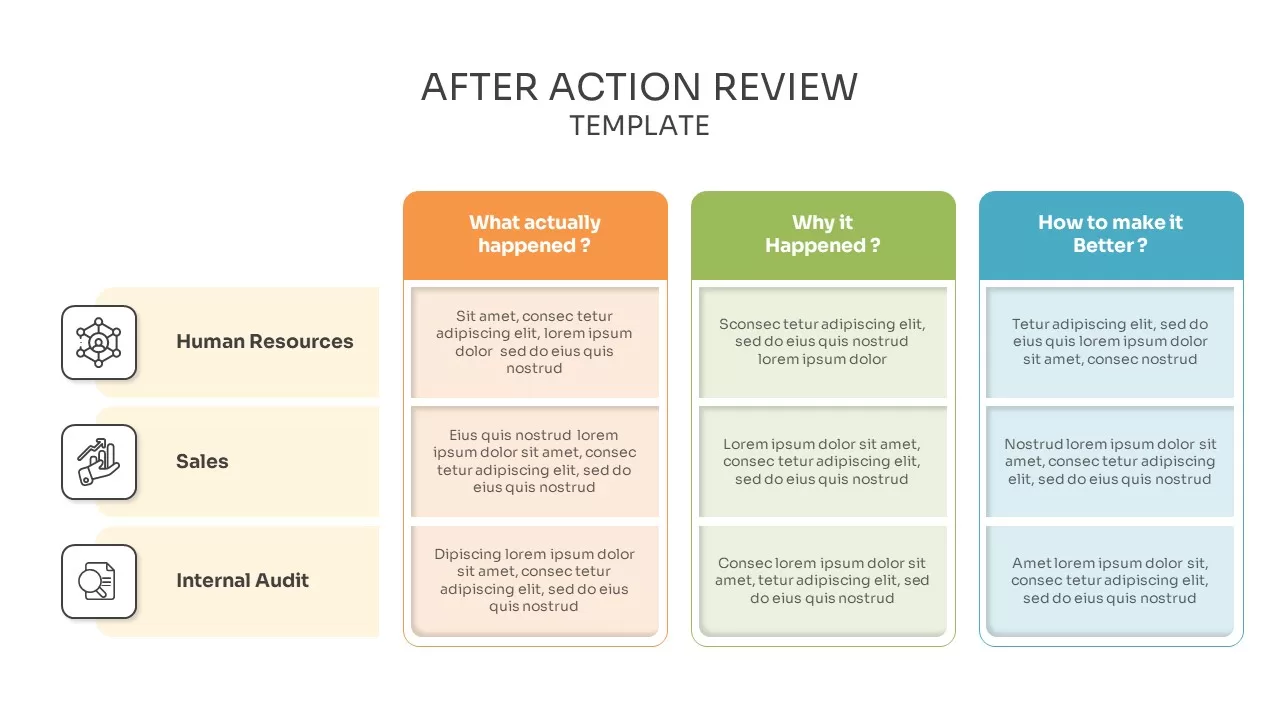
After Action Review Infographic Template for PowerPoint & Google Slides
Process
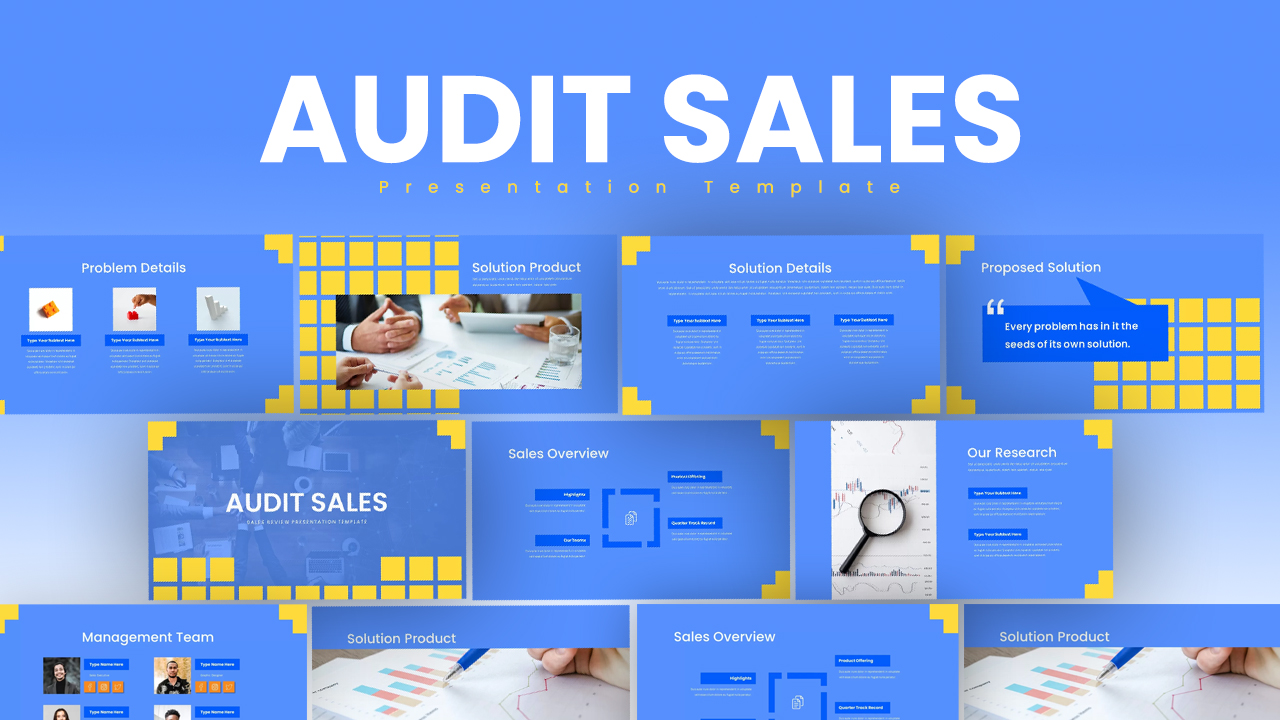
Audit Sales Review Presentation Template for PowerPoint & Google Slides
Decks
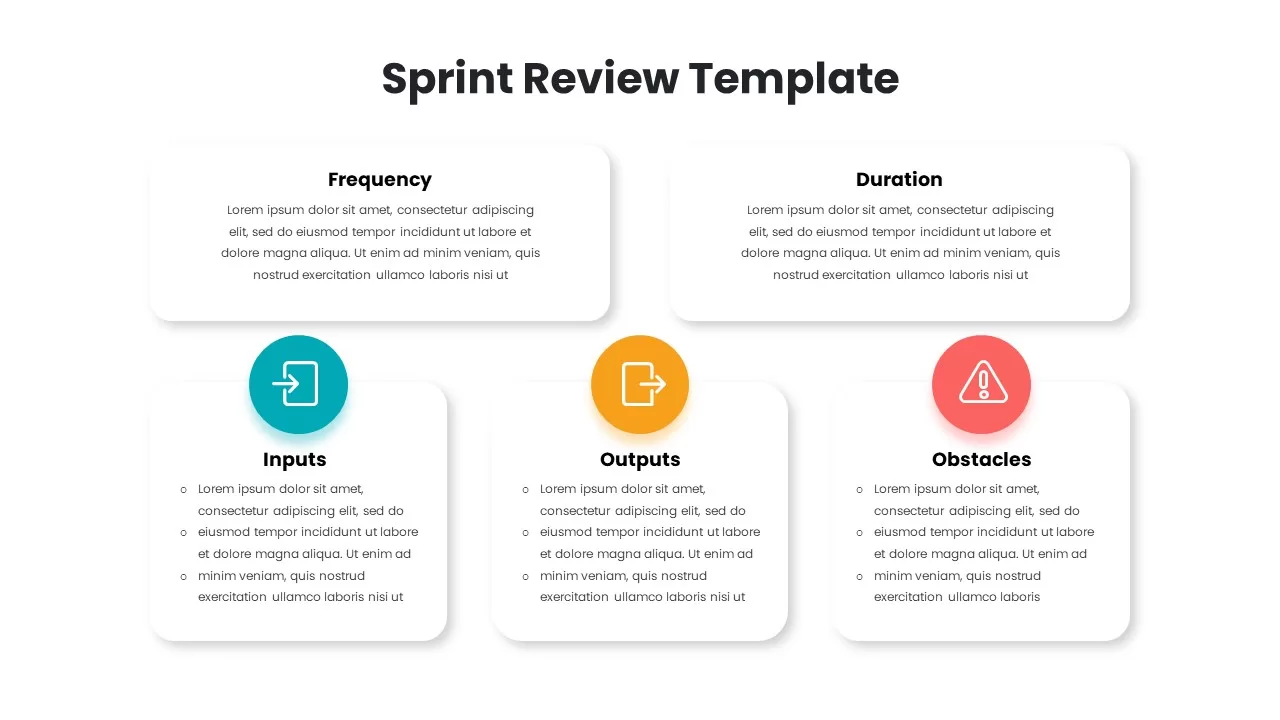
Sprint Review Process Infographics Pack Template for PowerPoint & Google Slides
Infographics
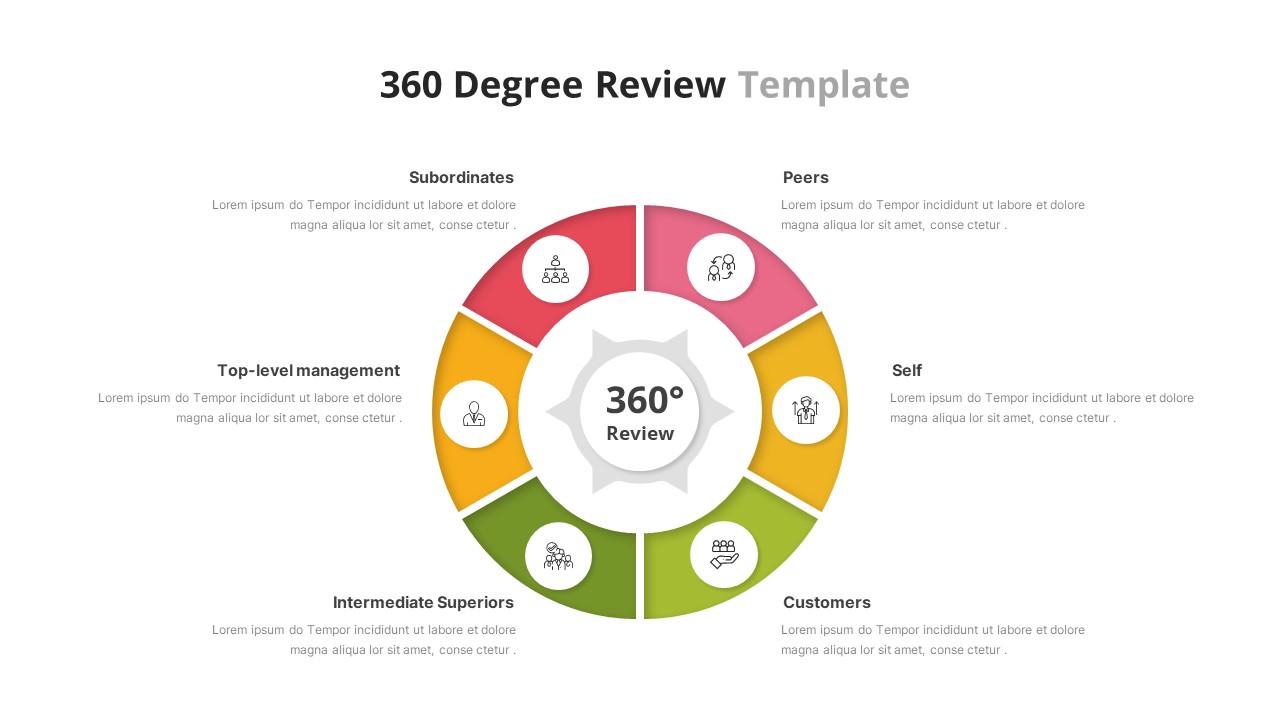
360 Degree Review Template for PowerPoint & Google Slides
Employee Performance
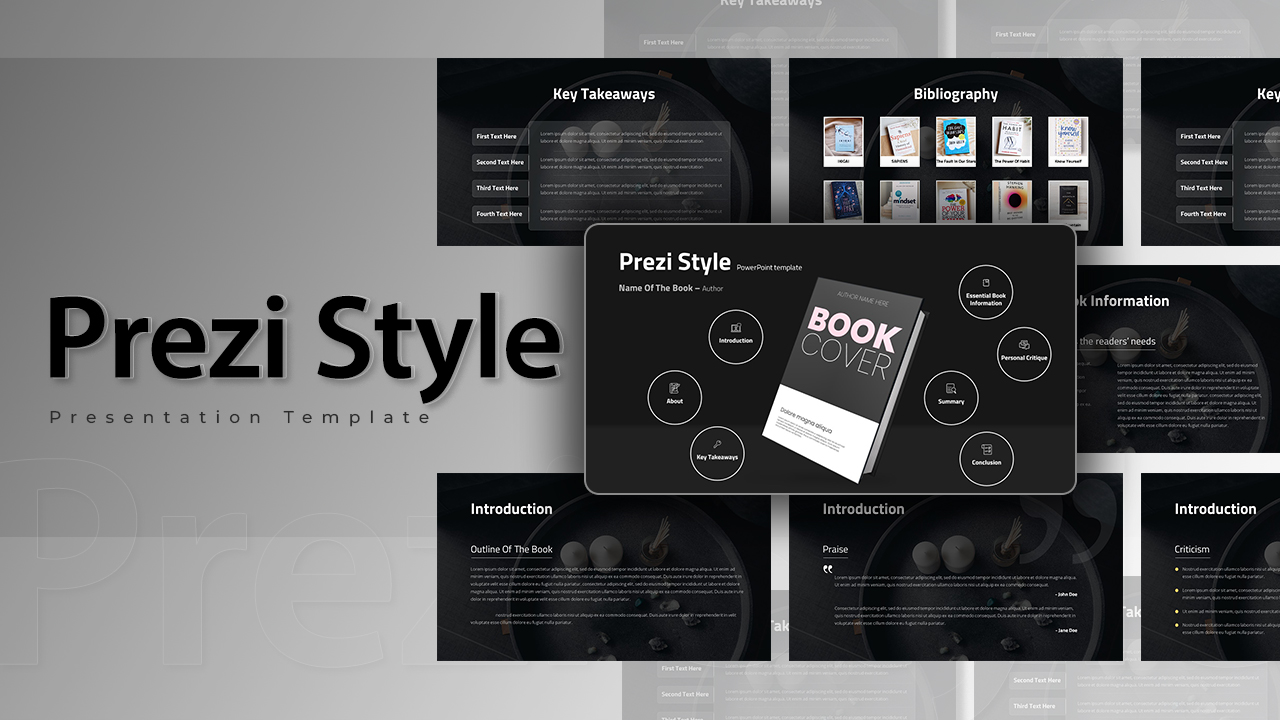
Prezi Style Presentation Template for PowerPoint & Google Slides
Pitch Deck
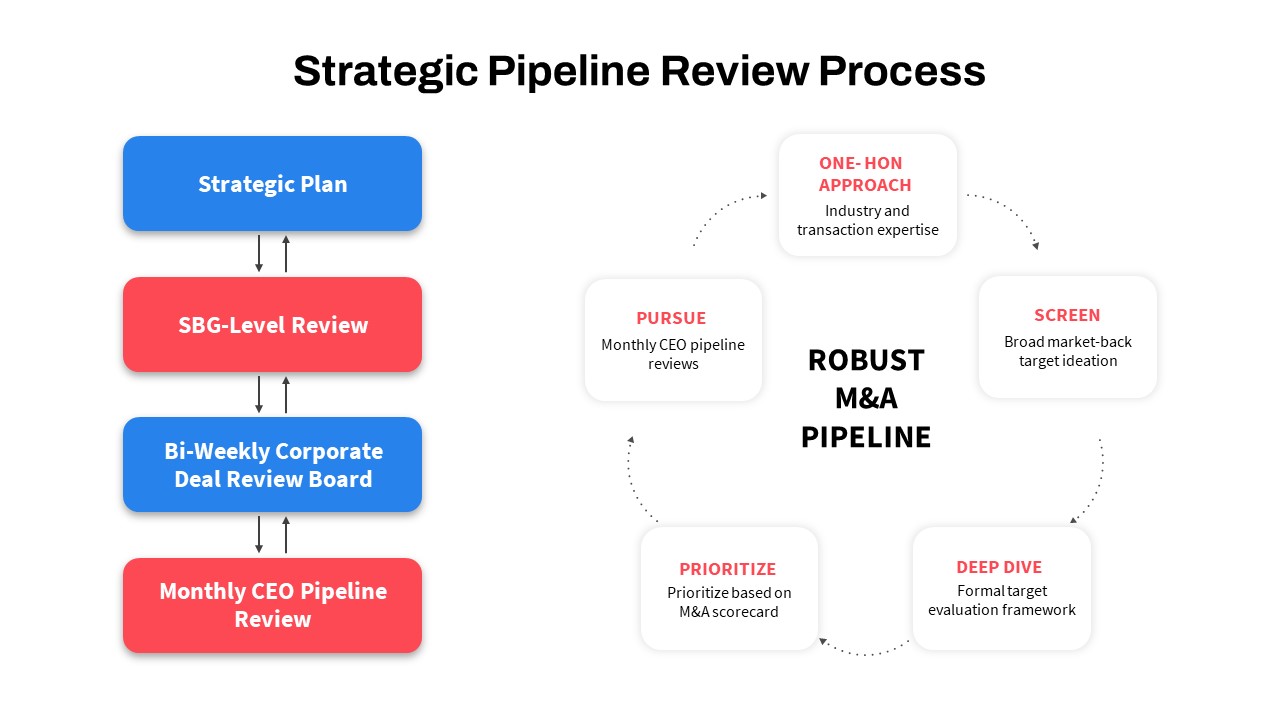
Strategic Pipeline Review Diagram Template for PowerPoint & Google Slides
Business Strategy
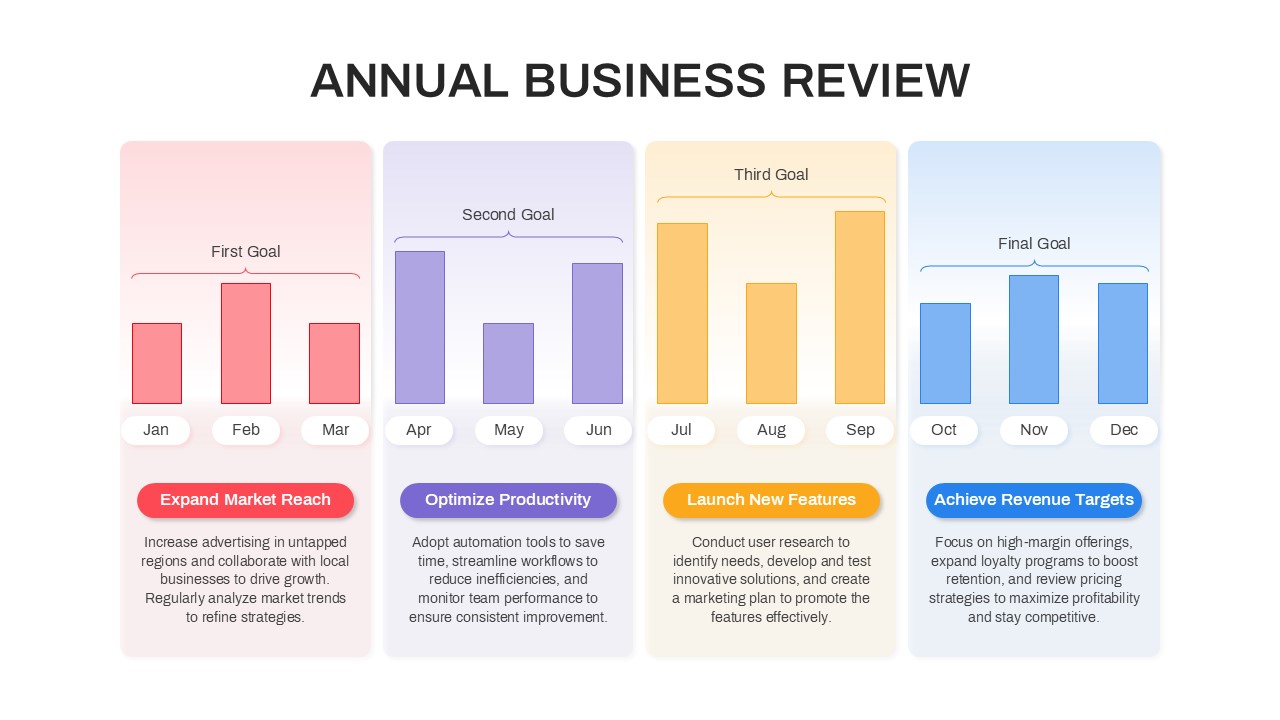
Annual Business Review Timeline Template for PowerPoint & Google Slides
Timeline
Quarterly Sales Review Bar Chart Template for PowerPoint & Google Slides
Bar/Column
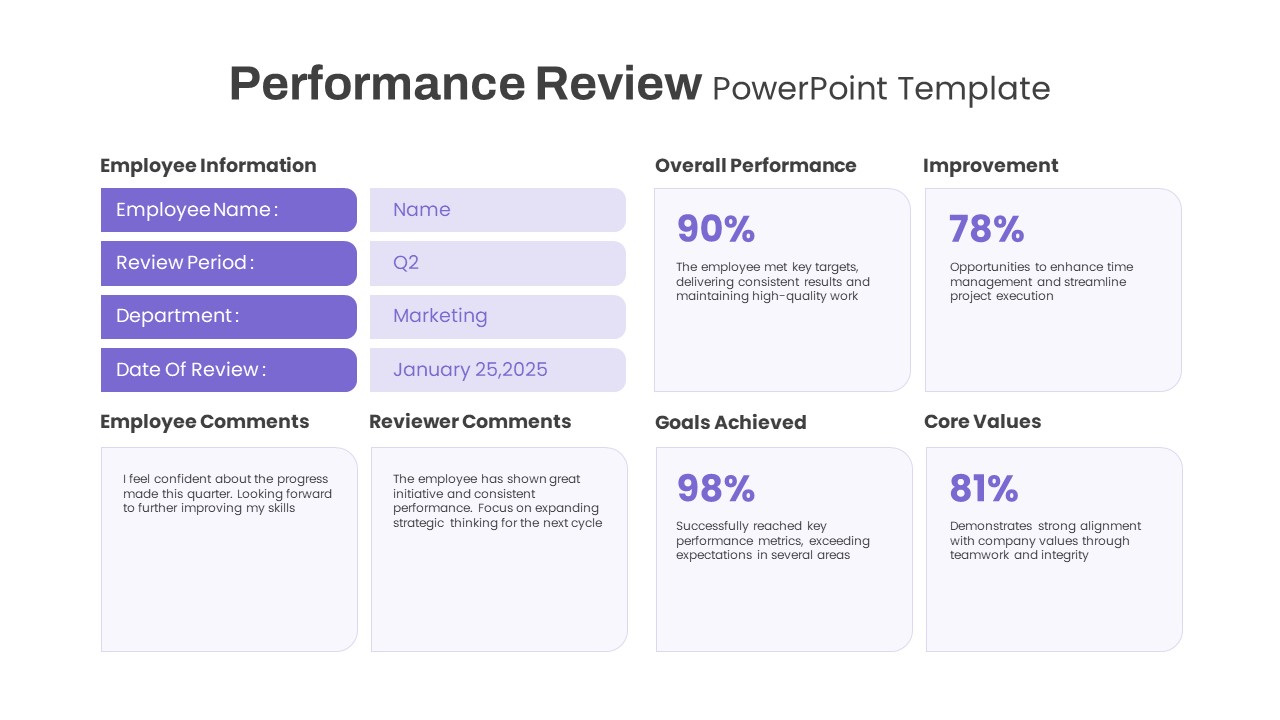
Performance Review template for PowerPoint & Google Slides
Employee Performance
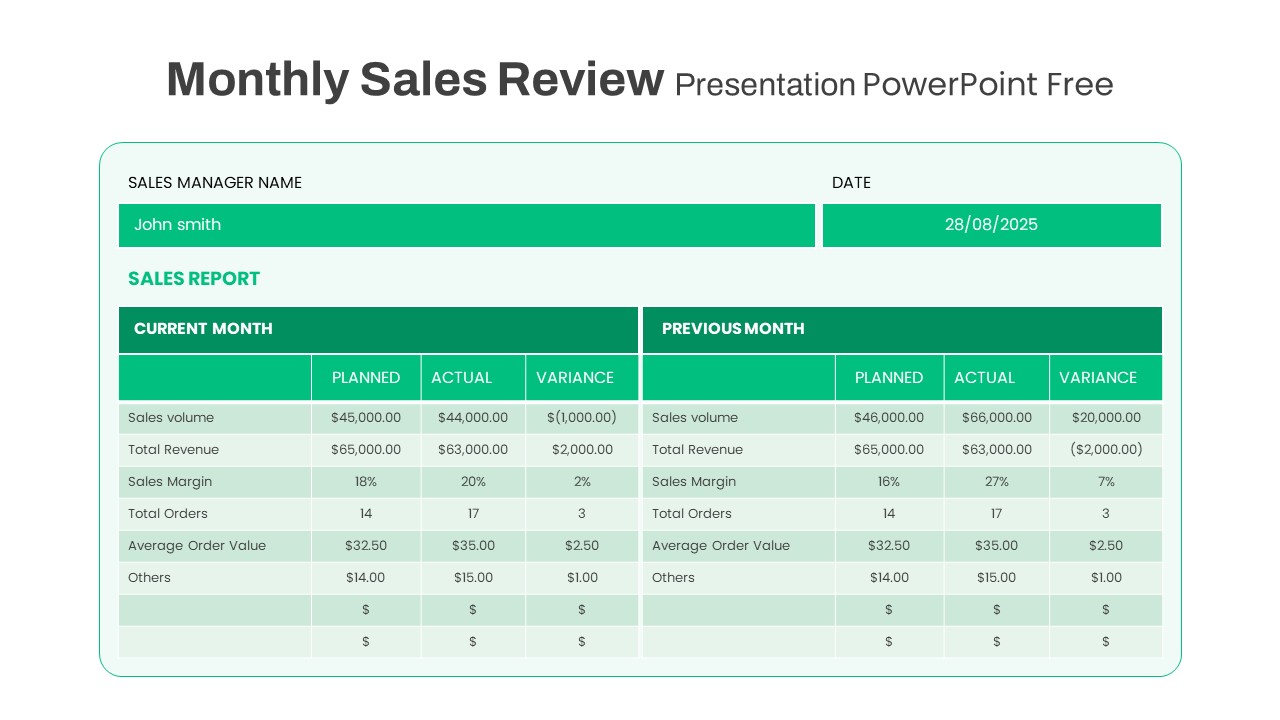
Free Monthly Sales Review template for PowerPoint & Google Slides
Business Report
Free
Sprint Review Meeting Agenda Table Template for PowerPoint & Google Slides
Agenda

Free Stylized Book Review Layout for PowerPoint & Google Slides
Company Profile
Free
Free Business Review Comparison Slide for PowerPoint & Google Slides
Business Report
Free
Plan Do Review (PDR) for PowerPoint & Google Slides
Process
Free KPI Dashboard PowerPoint Template for PowerPoint & Google Slides
Charts
Free
E-commerce Analytics Dashboard Template for PowerPoint & Google Slides
Bar/Column

Dynamic Data Dashboard Infographic Template for PowerPoint & Google Slides
Bar/Column
Product Usage Analytics Dashboard Chart Template for PowerPoint & Google Slides
Bar/Column
Data Analytics Dashboard Design template for PowerPoint & Google Slides
Bar/Column
Business Dashboard Analytics & KPIs Template for PowerPoint & Google Slides
Bar/Column

Professional Team Efficiency Dashboard Template for PowerPoint & Google Slides
Business Report
Project Management Dashboard Template for PowerPoint & Google Slides
Project
Website Performance Dashboard template for PowerPoint & Google Slides
Charts
Sales Performance Dashboard template for PowerPoint & Google Slides
Business Report
Immigration Data Dashboard Template for PowerPoint & Google Slides
Bar/Column
Employee Skill Analysis Dashboard Template for PowerPoint & Google Slides
Employee Performance
Social Media Performance Dashboard Template for PowerPoint & Google Slides
Bar/Column
Net Promoter Score Dashboard Template for PowerPoint & Google Slides
Customer Experience
Modern Project Status Report Dashboard Template for PowerPoint & Google Slides
Project Status
Performance KPI Dashboard Slide Template for PowerPoint & Google Slides
Business Report
KPI Dashboard template for PowerPoint & Google Slides
Business Report
KPI Dashboard Overview template for PowerPoint & Google Slides
Finance
KPI Dashboard Data Visualization Template for PowerPoint & Google Slides
Bar/Column
KPI Dashboard Data Overview Slide Template for PowerPoint & Google Slides
Bar/Column
Professional Nurse Infographic Dashboard Template for PowerPoint & Google Slides
Nursing
Interactive Benchmarking Gauge Dashboard Template for PowerPoint & Google Slides
Pie/Donut
Heat Map Risk Matrix Dashboard Template for PowerPoint & Google Slides
Comparison Chart
Project Status Dashboard Table Template for PowerPoint & Google Slides
Project Status
Project Status Dashboard with Metrics Template for PowerPoint & Google Slides
Project Status
Colorful Project Status Dashboard Template for PowerPoint & Google Slides
Project Status
Weekly Update Schedule Dashboard Template for PowerPoint & Google Slides
Agenda
Project Status Dashboard Template for PowerPoint & Google Slides
Project Status
Weekly Status Report Dashboard Template for PowerPoint & Google Slides
HR
Free Metro UI Dashboard Infographic Template for PowerPoint & Google Slides
Business Report
Free
Website Performance Monitoring Dashboard Template for PowerPoint & Google Slides
Business Report
One Pager Project Status Dashboard Template for PowerPoint & Google Slides
Project Status
One Pager Annual Report Dashboard Template for PowerPoint & Google Slides
Business Report
Social Media Analytics Dashboard Template for PowerPoint & Google Slides
Digital Marketing
Social Media Statistics 2023 Dashboard Template for PowerPoint & Google Slides
Comparison
Mastodon Metrics Infographic Dashboard Template for PowerPoint & Google Slides
Business Report
Soccer Match Stats Dashboard Slide Template for PowerPoint & Google Slides
Graphics
Employee Satisfaction Survey Dashboard Template for PowerPoint & Google Slides
Employee Performance
Customer Satisfaction KPI Dashboard Template for PowerPoint & Google Slides
Customer Experience
Weekly Project Status Dashboard Template for PowerPoint & Google Slides
Project Status
Freight Logistics Dashboard Infographic Template for PowerPoint & Google Slides
Comparison Chart
Cost Cutting Savings Dashboard Template for PowerPoint & Google Slides
Pie/Donut
Macroeconomic Indicators Dashboard Template for PowerPoint & Google Slides
PEST
Free Monthly Report PowerPoint Template for PowerPoint & Google Slides
Business Report
Free
Michigan County Map with KPI Dashboard Template for PowerPoint & Google Slides
World Maps
Quarterly Financial Summary Dashboard Template for PowerPoint & Google Slides
Business Report
Banking Financial Overview Dashboard Template for PowerPoint & Google Slides
Finance
DevOps KPI Dashboard Performance Metrics Template for PowerPoint & Google Slides
Software Development
Purchasing KPI Metrics Dashboard Template for PowerPoint & Google Slides
Business Report
Procurement KPI Dashboard & Metrics Template for PowerPoint & Google Slides
Business Report
Project Progress Dashboard Pie Charts Template for PowerPoint & Google Slides
Project
Monthly Sales Performance Dashboard Template for PowerPoint & Google Slides
Charts
HR Report Dashboard Template for PowerPoint & Google Slides
Employee Performance
Budget Forecast Dashboard & Donut Charts Template for PowerPoint & Google Slides
Pie/Donut
Risk Level Gauge Comparison Dashboard Template for PowerPoint & Google Slides
Comparison
Inventory Management Dashboard Template for PowerPoint & Google Slides
Process
Digital Marketing KPIs Dashboard Dark Template for PowerPoint & Google Slides
Business Report
Employee Performance Metrics Dashboard Template for PowerPoint & Google Slides
Employee Performance
Turnover Analysis Dashboard Template for PowerPoint & Google Slides
Employee Performance
Project Tracking Dashboard Table Template for PowerPoint & Google Slides
Project Status
Action Items Management Dashboard Table Template for PowerPoint & Google Slides
Project Status
Electronic Health Records Dashboard template for PowerPoint & Google Slides
Health
Customer Interview Insights Dashboard Template for PowerPoint & Google Slides
Customer Experience
Account Overview Dashboard template for PowerPoint & Google Slides
Business
Project Status Dashboard Report Template for PowerPoint & Google Slides
Project Status
Project Status Update Dashboard Table Template for PowerPoint & Google Slides
Project Status
Cohort Analysis Retention Dashboard Template for PowerPoint & Google Slides
Comparison Chart
Project Status Dashboard Template for PowerPoint & Google Slides
Project Status
Dashboard Project Status Template for PowerPoint & Google Slides
Project Status
Project Status Template Dashboard with Gauge for PowerPoint & Google Slides
Project Status
Project Status Dashboard with RAG Legend Template for PowerPoint & Google Slides
Project Status
Construction Project Dashboard Template for PowerPoint & Google Slides
Project
Employee Headcount Dashboard Report Template for PowerPoint & Google Slides
Employee Performance
4DX Scoreboard KPI Gauge Dashboard Template for PowerPoint & Google Slides
Business Strategy