Employee Headcount Dashboard Report Template for PowerPoint & Google Slides


Description
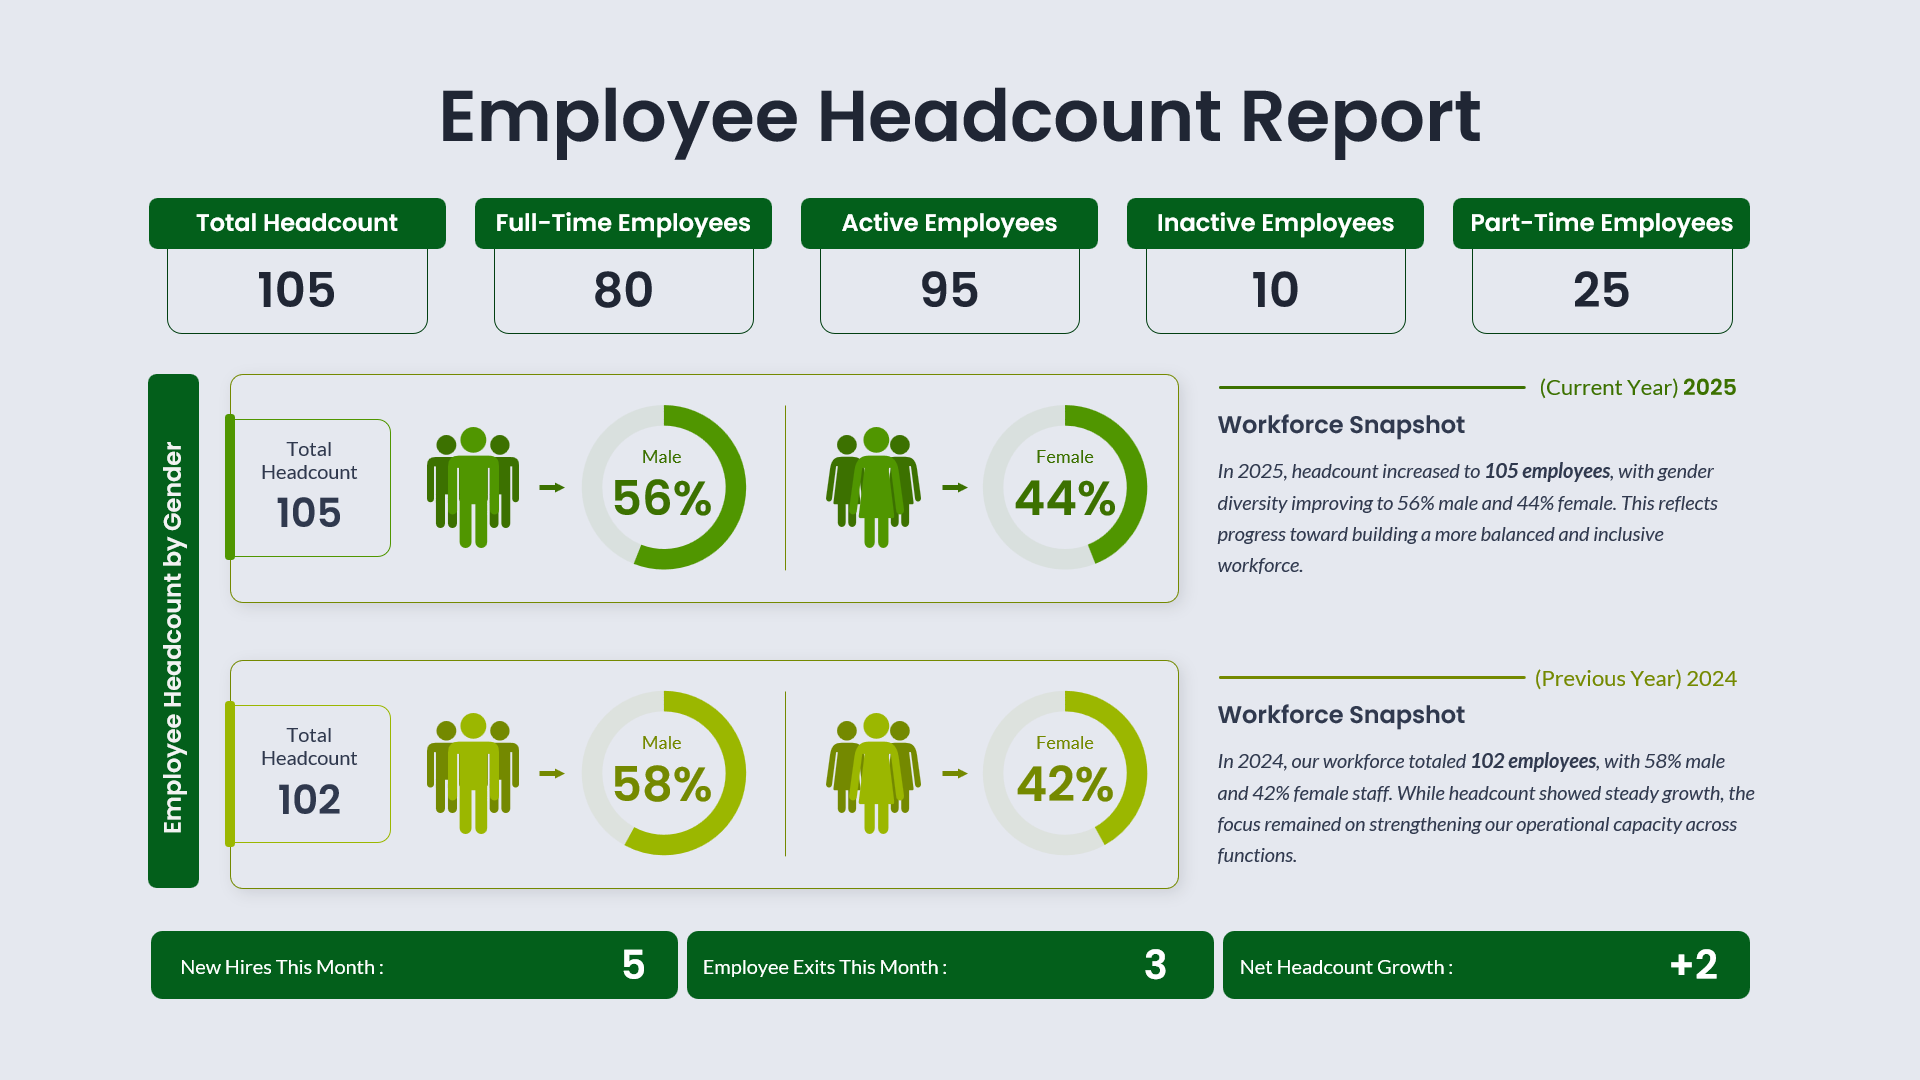
Present workforce metrics with clarity and executive-level polish using this Employee Headcount Dashboard Report slide. Designed with a dark, professional interface and high-contrast green highlight elements, this layout delivers a comprehensive snapshot of organizational staffing in a single view. Key metrics such as total headcount, full-time and part-time employees, active versus inactive staff, and monthly net growth are displayed in clearly separated KPI cards, ensuring fast comprehension during leadership reviews. The slide also includes gender-based headcount visualizations using circular progress charts, enabling teams to communicate diversity trends with precision and confidence. A built-in year-over-year comparison section supports strategic analysis by showing workforce changes between the current and previous year, accompanied by concise narrative placeholders for insights and interpretation.
Fully editable in both PowerPoint and Google Slides, this dashboard leverages structured grids, iconography, and clean typography to maintain visual consistency while allowing effortless customization. Users can quickly update figures, adjust colors to match brand guidelines, or duplicate sections to track additional time periods. Optimized for clarity and readability, the slide is ideal for data-driven discussions where accuracy, transparency, and visual impact matter.
Who is it for
This slide is ideal for HR managers, people operations teams, and business leaders who need to report workforce statistics to executives or stakeholders. Consultants, analysts, and department heads can also use it to support internal reviews, audits, and planning sessions.
Other Uses
Beyond headcount reporting, this dashboard can be adapted for monthly HR dashboards, diversity and inclusion summaries, workforce planning reviews, or board-level operational reports. It can also serve as a reusable KPI slide within broader company profile or business report decks.
Login to download this file

Item ID
SB05715Designed By
Niranjana
Related Templates

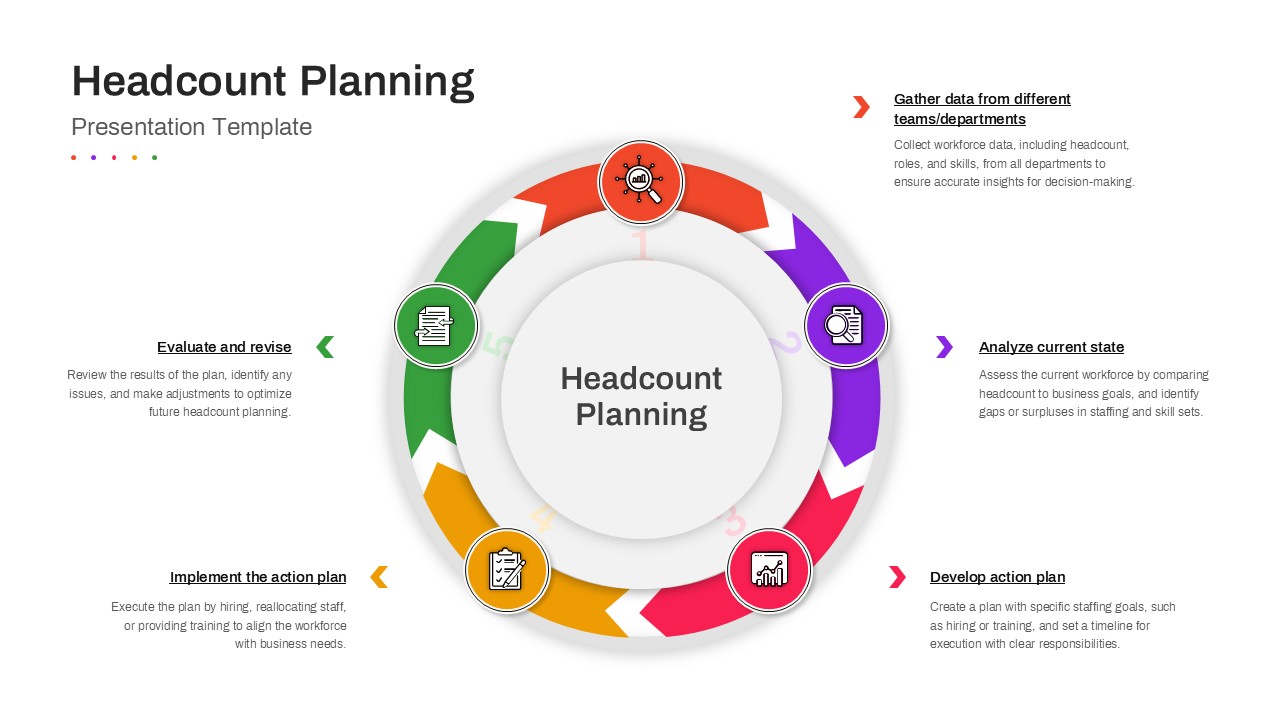
Headcount Planning Circular Process Diagram Template for PowerPoint & Google Slides
HR
Employee Skill Analysis Dashboard Template for PowerPoint & Google Slides
Employee Performance
Employee Satisfaction Survey Dashboard Template for PowerPoint & Google Slides
Employee Performance
Employee Performance Metrics Dashboard Template for PowerPoint & Google Slides
Employee Performance
Modern Project Status Report Dashboard Template for PowerPoint & Google Slides
Project Status
Weekly Status Report Dashboard Template for PowerPoint & Google Slides
HR
One Pager Annual Report Dashboard Template for PowerPoint & Google Slides
Business Report
HR Report Dashboard Template for PowerPoint & Google Slides
Employee Performance
Project Status Dashboard Report Template for PowerPoint & Google Slides
Project Status
Free KPI Dashboard PowerPoint Template for PowerPoint & Google Slides
Charts
Free
E-commerce Analytics Dashboard Template for PowerPoint & Google Slides
Bar/Column

Dynamic Data Dashboard Infographic Template for PowerPoint & Google Slides
Bar/Column
Product Usage Analytics Dashboard Chart Template for PowerPoint & Google Slides
Bar/Column
Data Analytics Dashboard Design template for PowerPoint & Google Slides
Bar/Column

Efficiency KPI Dashboard Metaphor Template for PowerPoint & Google Slides
Infographics
Business Dashboard Analytics & KPIs Template for PowerPoint & Google Slides
Bar/Column

Professional Team Efficiency Dashboard Template for PowerPoint & Google Slides
Business Report
Project Management Dashboard Template for PowerPoint & Google Slides
Project
Website Performance Dashboard template for PowerPoint & Google Slides
Charts
Sales Performance Dashboard template for PowerPoint & Google Slides
Business Report
Immigration Data Dashboard Template for PowerPoint & Google Slides
Bar/Column
Sales Growth Dashboard: KPI Gauge & Line Template for PowerPoint & Google Slides
Revenue
Social Media Performance Dashboard Template for PowerPoint & Google Slides
Bar/Column

Net Promoter Score Dashboard Template for PowerPoint & Google Slides
Customer Experience
Performance KPI Dashboard Slide Template for PowerPoint & Google Slides
Business Report
Bull and Bear Stock Market Dashboard Template for PowerPoint & Google Slides
Infographics
KPI Dashboard template for PowerPoint & Google Slides
Business Report
KPI Dashboard Overview template for PowerPoint & Google Slides
Finance
KPI Dashboard Data Visualization Template for PowerPoint & Google Slides
Bar/Column
KPI Dashboard Data Overview Slide Template for PowerPoint & Google Slides
Bar/Column
Professional Nurse Infographic Dashboard Template for PowerPoint & Google Slides
Nursing
Interactive Benchmarking Gauge Dashboard Template for PowerPoint & Google Slides
Pie/Donut
Heat Map Risk Matrix Dashboard Template for PowerPoint & Google Slides
Comparison Chart
Project Status Dashboard Table Template for PowerPoint & Google Slides
Project Status
Project Status Dashboard with Metrics Template for PowerPoint & Google Slides
Project Status
Colorful Project Status Dashboard Template for PowerPoint & Google Slides
Project Status
Weekly Update Schedule Dashboard Template for PowerPoint & Google Slides
Agenda
Project Status Dashboard Template for PowerPoint & Google Slides
Project Status
Free Metro UI Dashboard Infographic Template for PowerPoint & Google Slides
Business Report
Free
Website Performance Monitoring Dashboard Template for PowerPoint & Google Slides
Business Report
One Pager Project Status Dashboard Template for PowerPoint & Google Slides
Project Status
Social Media Analytics Dashboard Template for PowerPoint & Google Slides
Digital Marketing
Social Media Statistics 2023 Dashboard Template for PowerPoint & Google Slides
Comparison
Mastodon Metrics Infographic Dashboard Template for PowerPoint & Google Slides
Business Report
Soccer Match Stats Dashboard Slide Template for PowerPoint & Google Slides
Graphics
Customer Satisfaction KPI Dashboard Template for PowerPoint & Google Slides
Customer Experience
Weekly Project Status Dashboard Template for PowerPoint & Google Slides
Project Status
Freight Logistics Dashboard Infographic Template for PowerPoint & Google Slides
Comparison Chart
Free Quarterly Business Review Dashboard Template for PowerPoint & Google Slides
Business
Free
Cost Cutting Savings Dashboard Template for PowerPoint & Google Slides
Pie/Donut
Macroeconomic Indicators Dashboard Template for PowerPoint & Google Slides
PEST
Free Monthly Report PowerPoint Template for PowerPoint & Google Slides
Business Report
Free
Michigan County Map with KPI Dashboard Template for PowerPoint & Google Slides
World Maps
Quarterly Financial Summary Dashboard Template for PowerPoint & Google Slides
Business Report
Banking Financial Overview Dashboard Template for PowerPoint & Google Slides
Finance
Quarterly Business Review Dashboard Template for PowerPoint & Google Slides
Pitch Deck
Monthly Business Review Dashboard Deck Template for PowerPoint & Google Slides
Business Report
DevOps KPI Dashboard Performance Metrics Template for PowerPoint & Google Slides
Software Development
Purchasing KPI Metrics Dashboard Template for PowerPoint & Google Slides
Business Report
Procurement KPI Dashboard & Metrics Template for PowerPoint & Google Slides
Business Report
Project Progress Dashboard Pie Charts Template for PowerPoint & Google Slides
Project
Monthly Sales Performance Dashboard Template for PowerPoint & Google Slides
Charts
Budget Forecast Dashboard & Donut Charts Template for PowerPoint & Google Slides
Pie/Donut
Risk Level Gauge Comparison Dashboard Template for PowerPoint & Google Slides
Comparison
Inventory Management Dashboard Template for PowerPoint & Google Slides
Process
Digital Marketing KPIs Dashboard Dark Template for PowerPoint & Google Slides
Business Report
Turnover Analysis Dashboard Template for PowerPoint & Google Slides
Employee Performance
Project Tracking Dashboard Table Template for PowerPoint & Google Slides
Project Status
Action Items Management Dashboard Table Template for PowerPoint & Google Slides
Project Status
Electronic Health Records Dashboard template for PowerPoint & Google Slides
Health
Customer Interview Insights Dashboard Template for PowerPoint & Google Slides
Customer Experience
Account Overview Dashboard template for PowerPoint & Google Slides
Business
Project Status Update Dashboard Table Template for PowerPoint & Google Slides
Project Status
Cohort Analysis Retention Dashboard Template for PowerPoint & Google Slides
Comparison Chart
Project Status Dashboard Template for PowerPoint & Google Slides
Project Status
Dashboard Project Status Template for PowerPoint & Google Slides
Project Status
Project Status Template Dashboard with Gauge for PowerPoint & Google Slides
Project Status
Task Completion Rate Dashboard Template for PowerPoint & Google Slides
Business
Project Status Dashboard with RAG Legend Template for PowerPoint & Google Slides
Project Status
End of Year Review Dashboard Template for PowerPoint & Google Slides
Business Report
Construction Project Dashboard Template for PowerPoint & Google Slides
Project
4DX Scoreboard KPI Gauge Dashboard Template for PowerPoint & Google Slides
Business Strategy
Dashboard Templates for PowerPoint & Google Slides
Bar/Column
Free Infographic Statistics Dashboard Slide for PowerPoint & Google Slides
Bar/Column
Free
Engineering Maintenance Dashboard Slide for PowerPoint & Google Slides
Software Development
Incident Tracking Dashboard for PowerPoint & Google Slides
Business Plan
Patient-Satisfaction KPI Dashboard for PowerPoint & Google Slides
Business
MVP Product Roadmap Delivery Dashboard for PowerPoint & Google Slides
Roadmap
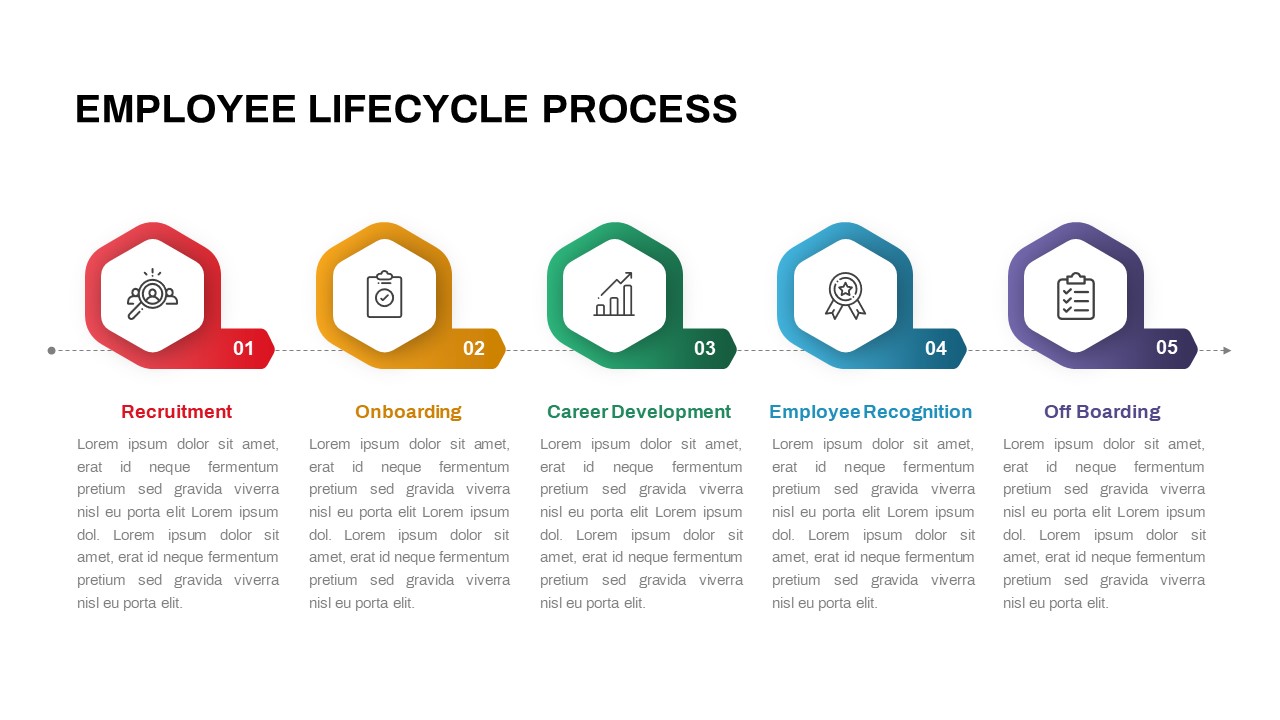
Employee Lifecycle Process Template for PowerPoint & Google Slides
Circular
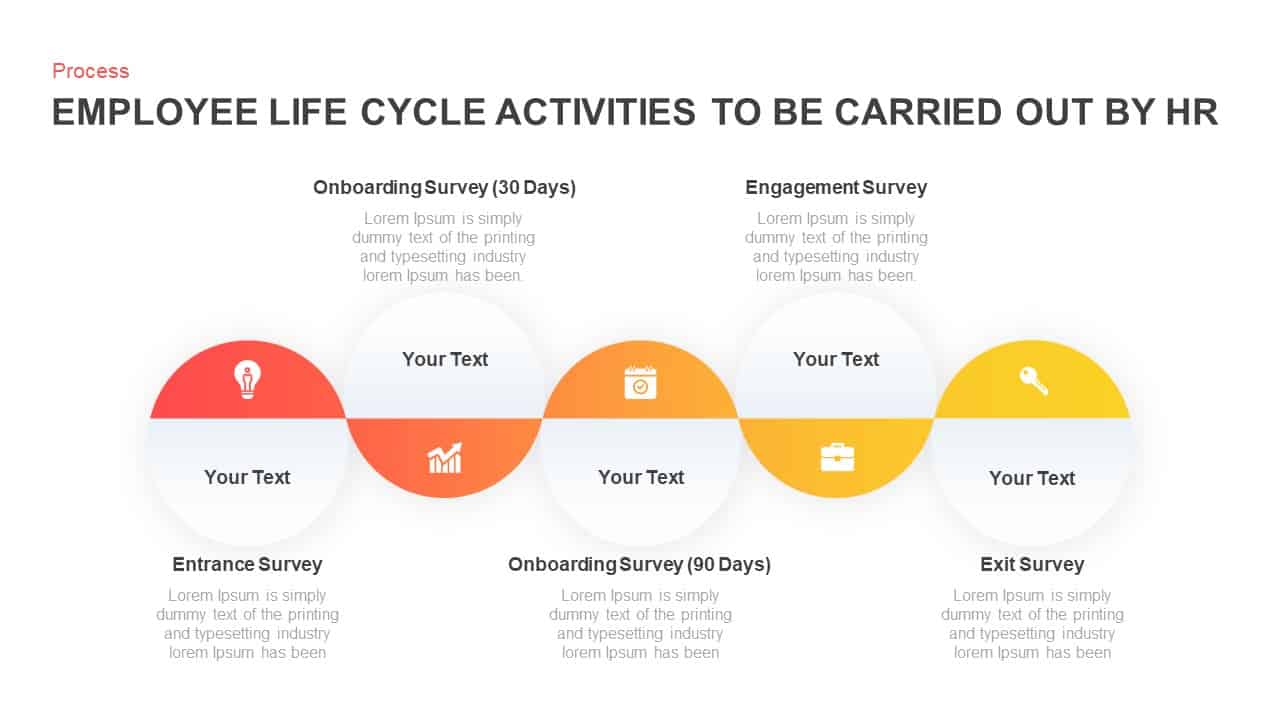
Employee Life Cycle Activities Process Template for PowerPoint & Google Slides
Employee Performance
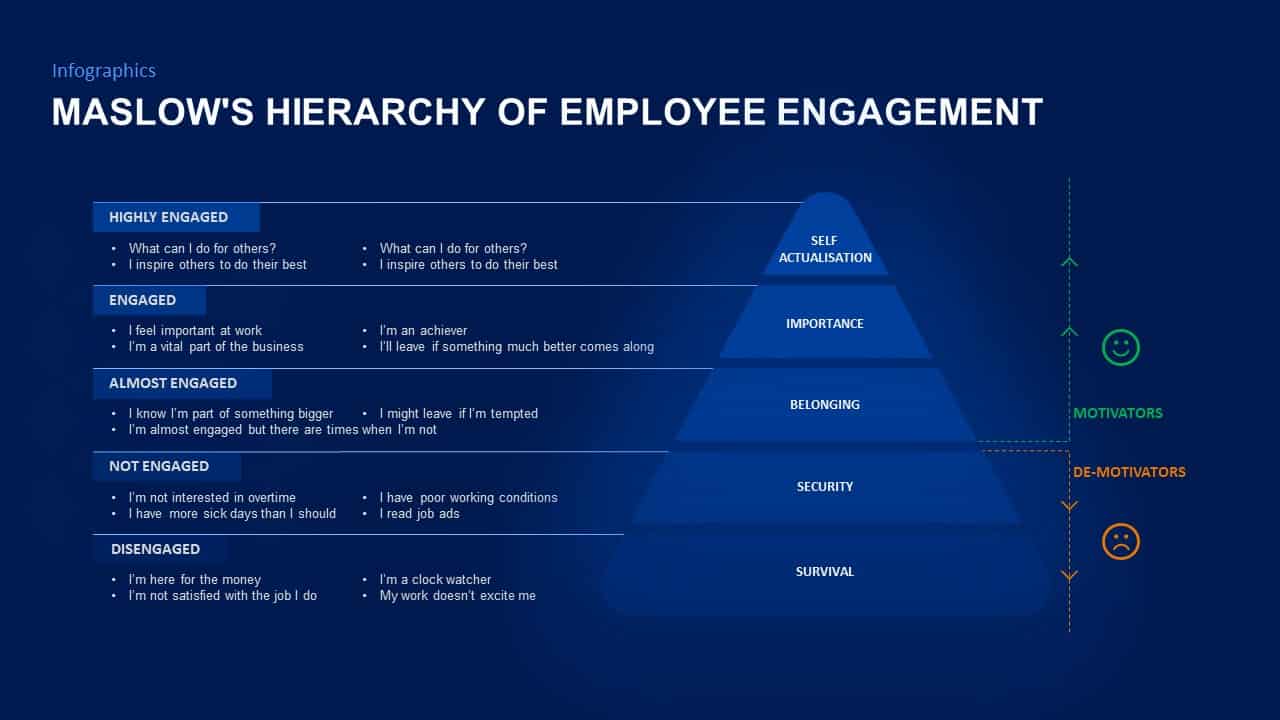
Maslow’s Employee Engagement Hierarchy Template for PowerPoint & Google Slides
Pyramid
Employee Training Overview template for PowerPoint & Google Slides
Recruitment
Employee Offboarding Process template for PowerPoint & Google Slides
Recruitment
Employee Retention Plan Overview template for PowerPoint & Google Slides
Company Profile
Employee Value Proposition Framework Template for PowerPoint & Google Slides
Recruitment
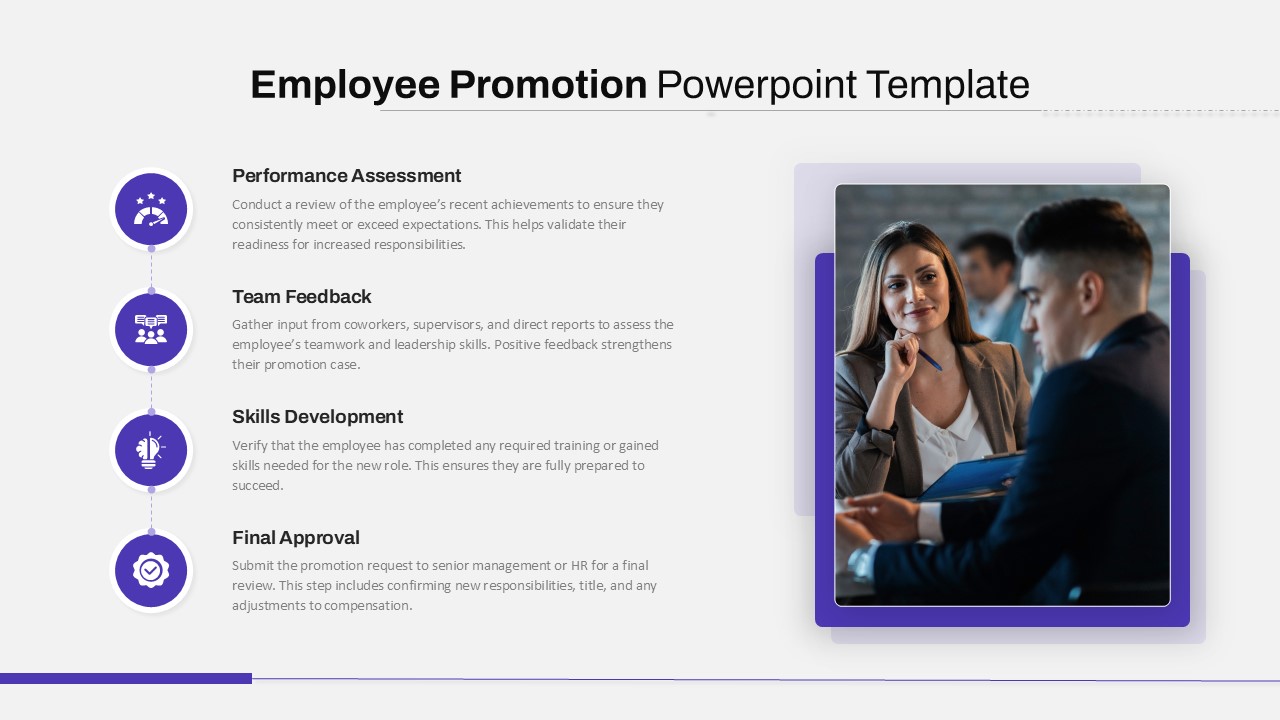
Employee Promotion Process Infographic Template for PowerPoint & Google Slides
Employee Performance
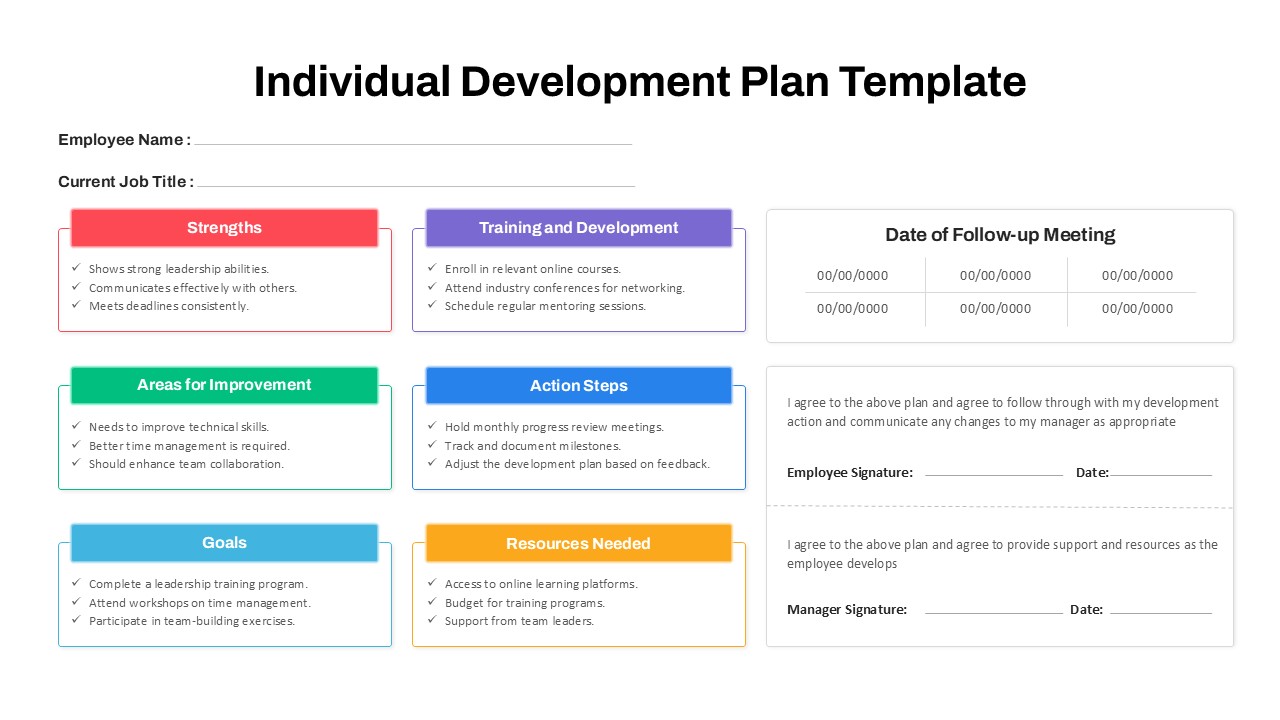
Employee Individual Development Plan Template for PowerPoint & Google Slides
Employee Performance
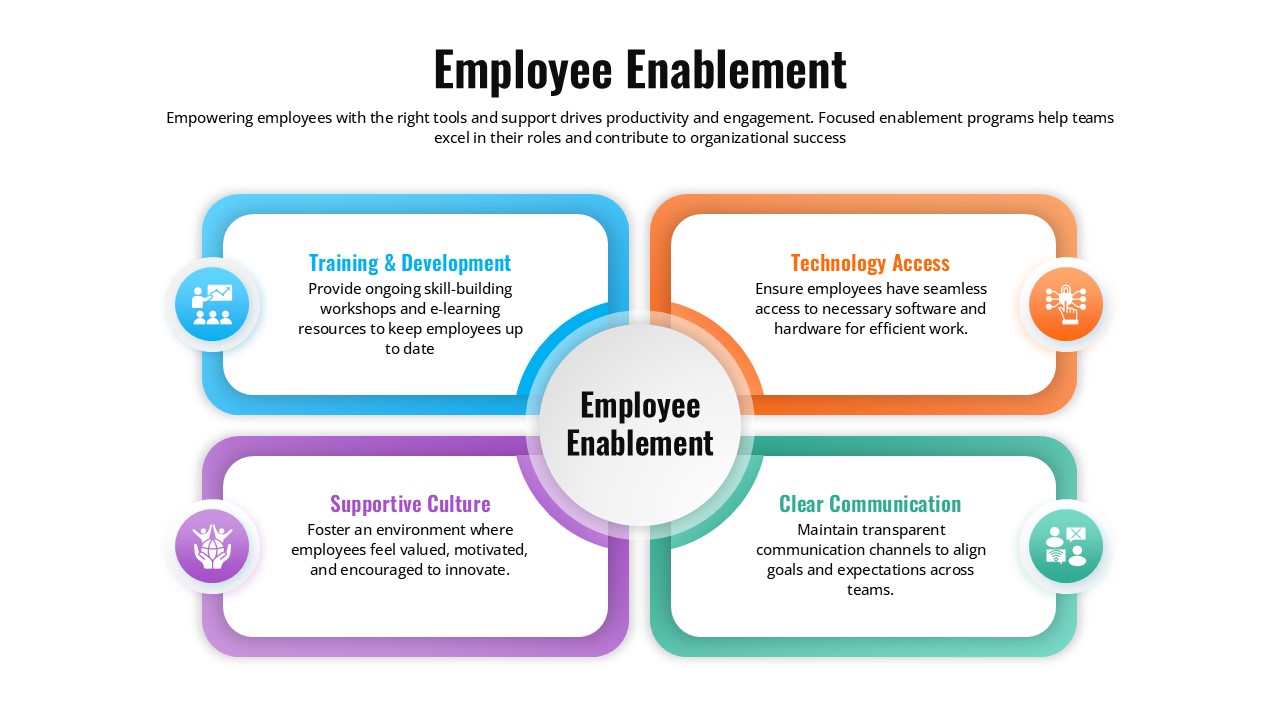
Employee Enablement Strategy template for PowerPoint & Google Slides
Business
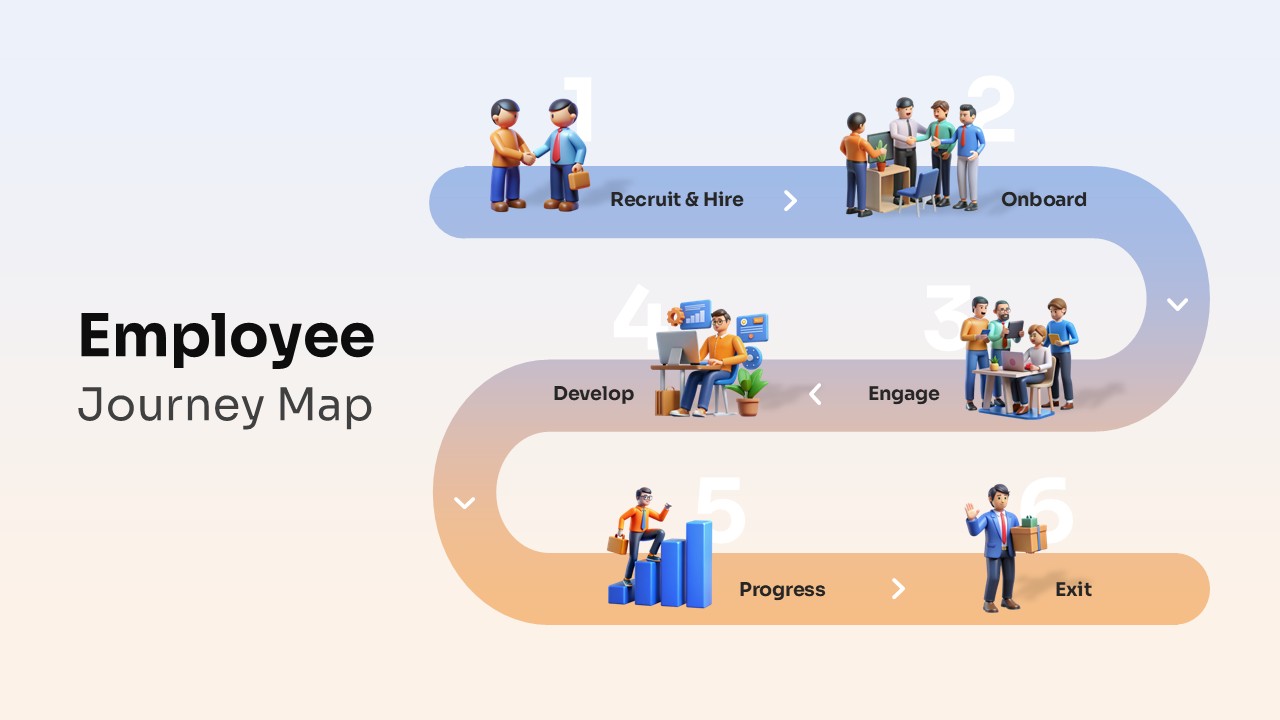
Employee Journey Map with Stages template for PowerPoint & Google Slides
Recruitment
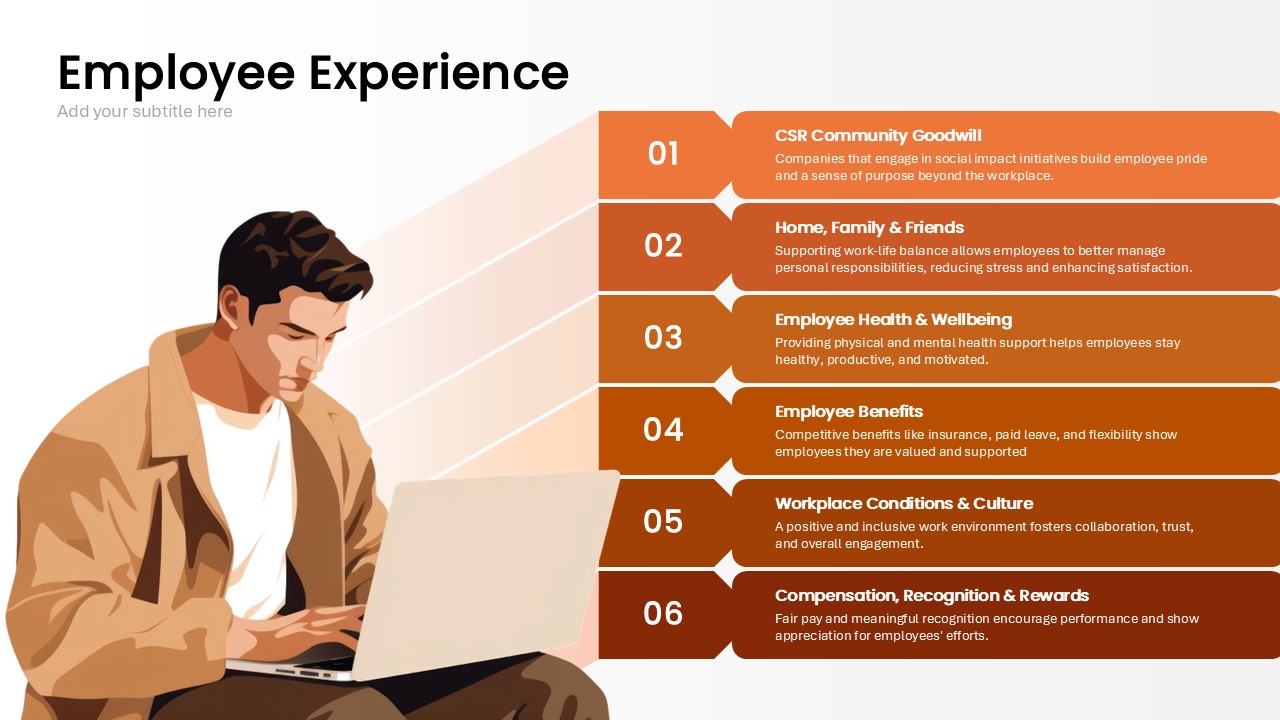
Employee Experience Template for PowerPoint & Google Slides
Employee Performance