Professional Drone Infographic Slide Template for PowerPoint & Google Slides

Description
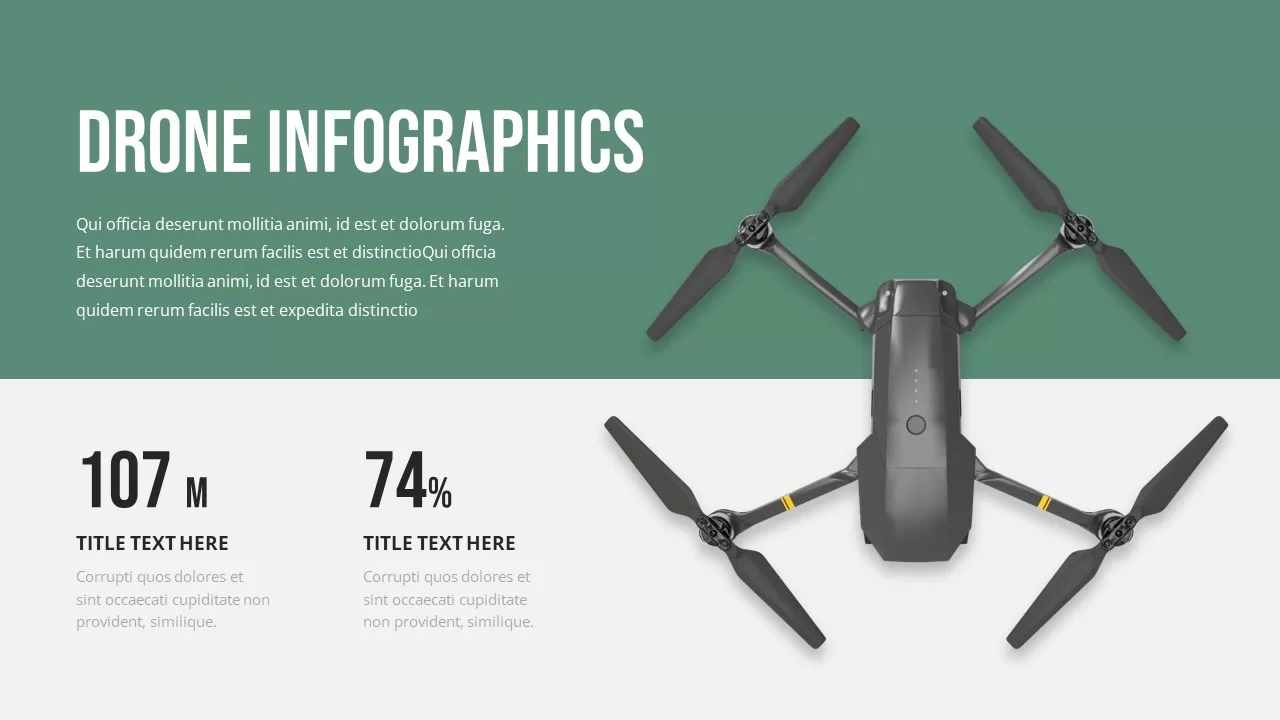
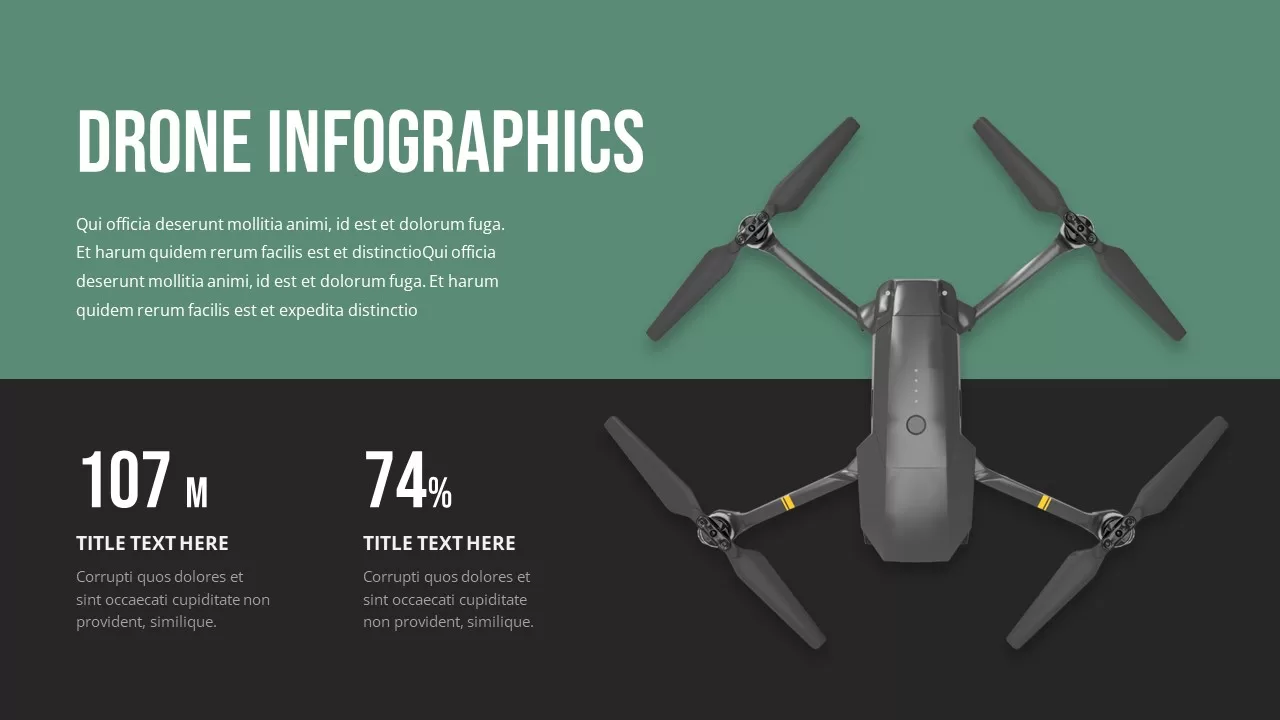
Leverage this professional drone infographic slide to present key metrics and performance data in a visually engaging format. The layout features a high-resolution drone photograph that dominates the right side, while a rich green banner across the top showcases a bold title and supporting text. Below, two large metric blocks display “107 M” and “74 %” in oversized type, each paired with a headline and concise description space to highlight distance covered, flight time utilization, battery efficiency, or other critical KPIs. Ample white space, clean sans-serif typography, and consistent alignment ensure readability, while subtle shadows on the drone image add depth and polish.
Built on master slides, this template enables rapid customization: swap in your own drone imagery, adjust the green accent to match your brand palette, relabel metric values or titles, and edit descriptive copy with ease. Use animations to fade in each metric sequentially, guiding audience focus during live presentations. Whether you’re reporting flight coverage statistics, showcasing battery performance, comparing model efficiencies, or illustrating survey area metrics, this slide adapts seamlessly. Duplicate it for multi-segment analyses, or combine with other infographic assets to build a comprehensive data-driven narrative.
Optimized for both PowerPoint and Google Slides, the slide guarantees pixel-perfect rendering across devices and platforms. Placeholder text and ready-made styles reduce design friction, so you can concentrate on your story rather than slide layout. Simply replace the drone image, update the title, insert your data, and apply your company’s fonts to produce a cohesive, on-brand presentation in minutes—no graphic design experience required.
Who is it for
Aerial-imaging specialists, GIS analysts, drone operators, project managers, and marketing teams who need to communicate flight metrics, performance KPIs, or operational data with clarity and impact.
Other Uses
Repurpose as a satellite-mapping report, sensor-performance dashboard, remote-survey overview, or IoT-device efficiency slide—just swap the central image and update metric blocks to suit any data-driven scenario.
Login to download this file

Item ID
SB03026
Related Templates

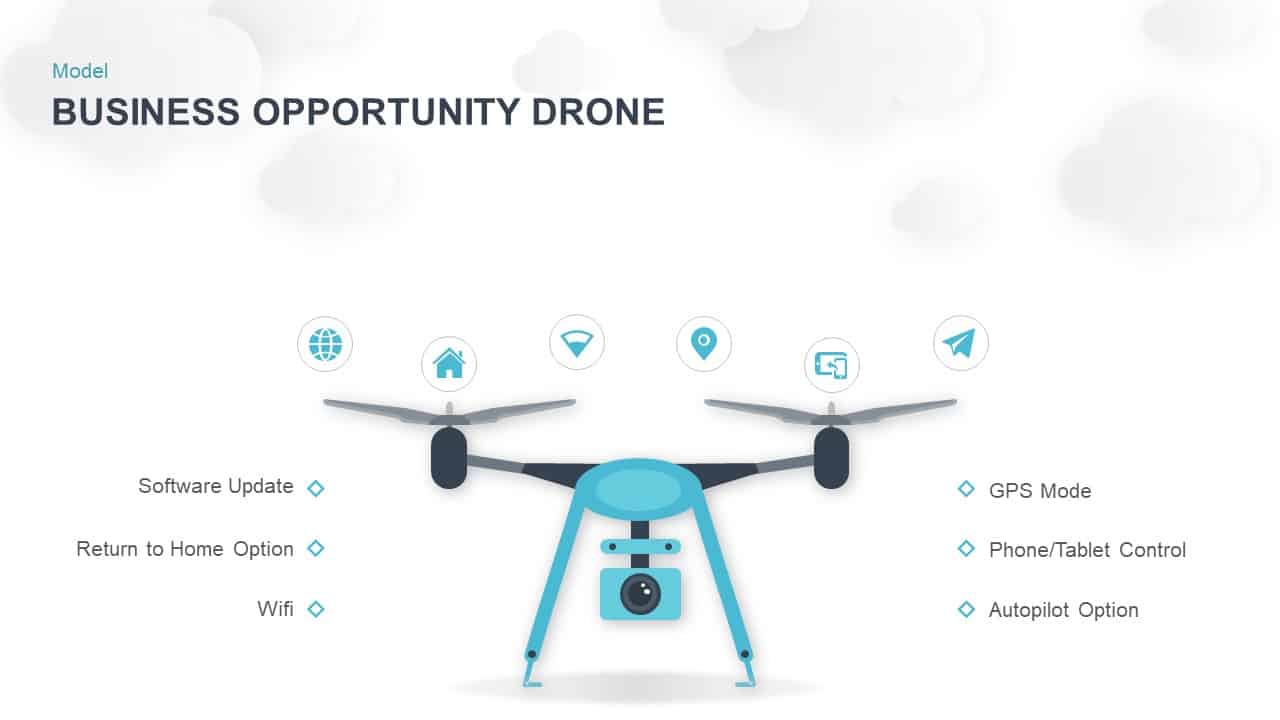
Business Opportunity Drone Infographic Template for PowerPoint & Google Slides
Opportunities Challenges
Dark Drone Product Description Slide Template for PowerPoint & Google Slides
Business Proposal
Drone Delivery Systems Overview Slide Template for PowerPoint & Google Slides
Business Models
Drone Business Company Profile Template for PowerPoint & Google Slides
Company Profile
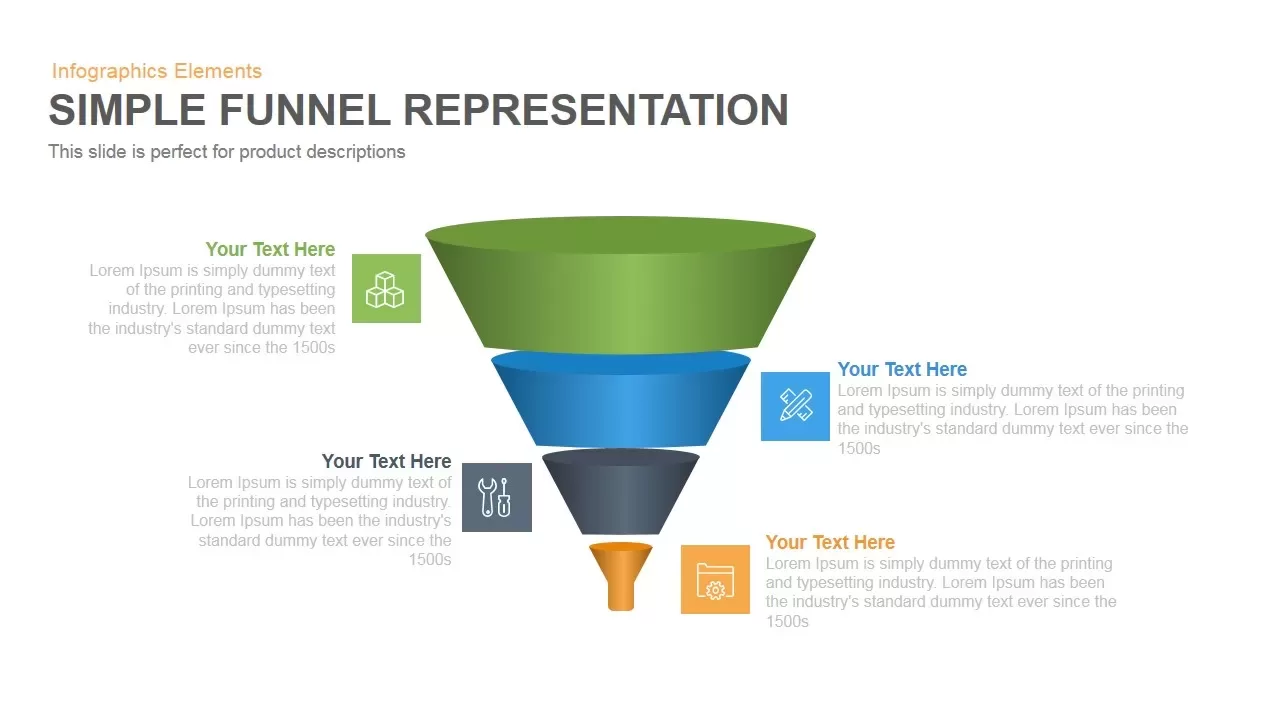
Professional 3D Funnel Infographic Template for PowerPoint & Google Slides
Funnel
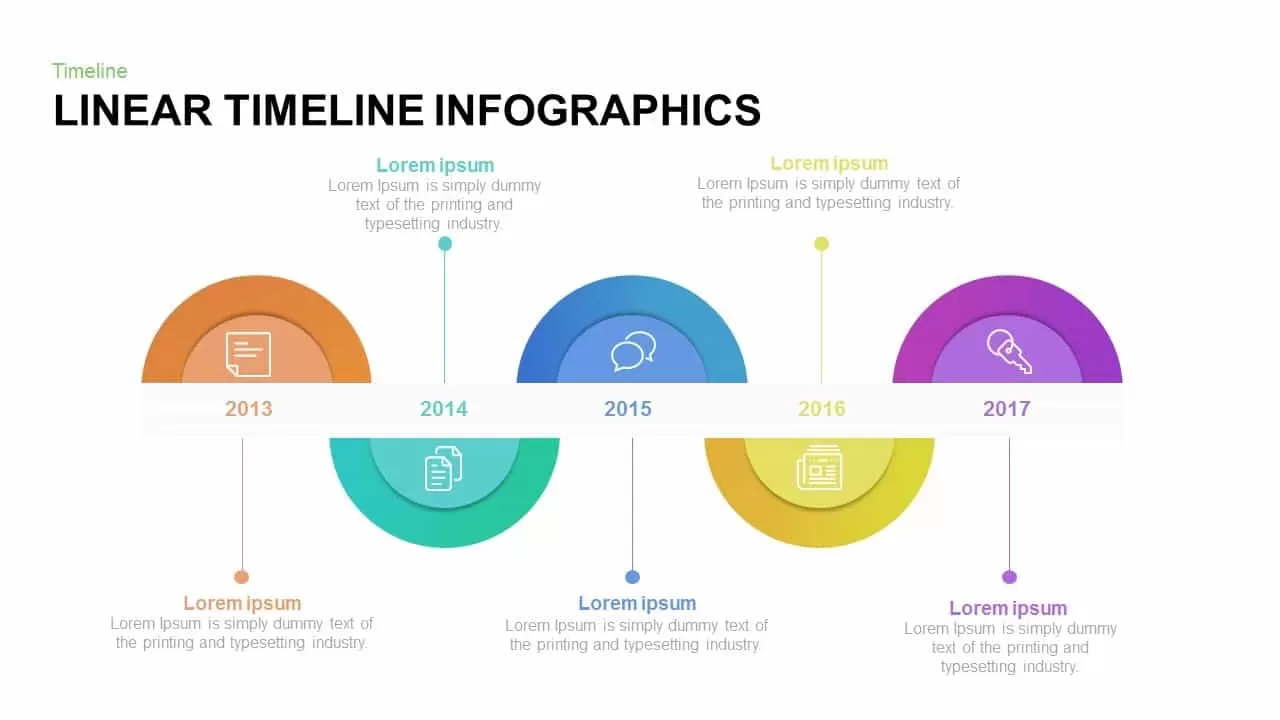
Professional Linear Timeline Infographic Template for PowerPoint & Google Slides
Timeline
Professional Book Review Infographic Template for PowerPoint & Google Slides
Business
Professional Nurse Infographic Dashboard Template for PowerPoint & Google Slides
Nursing
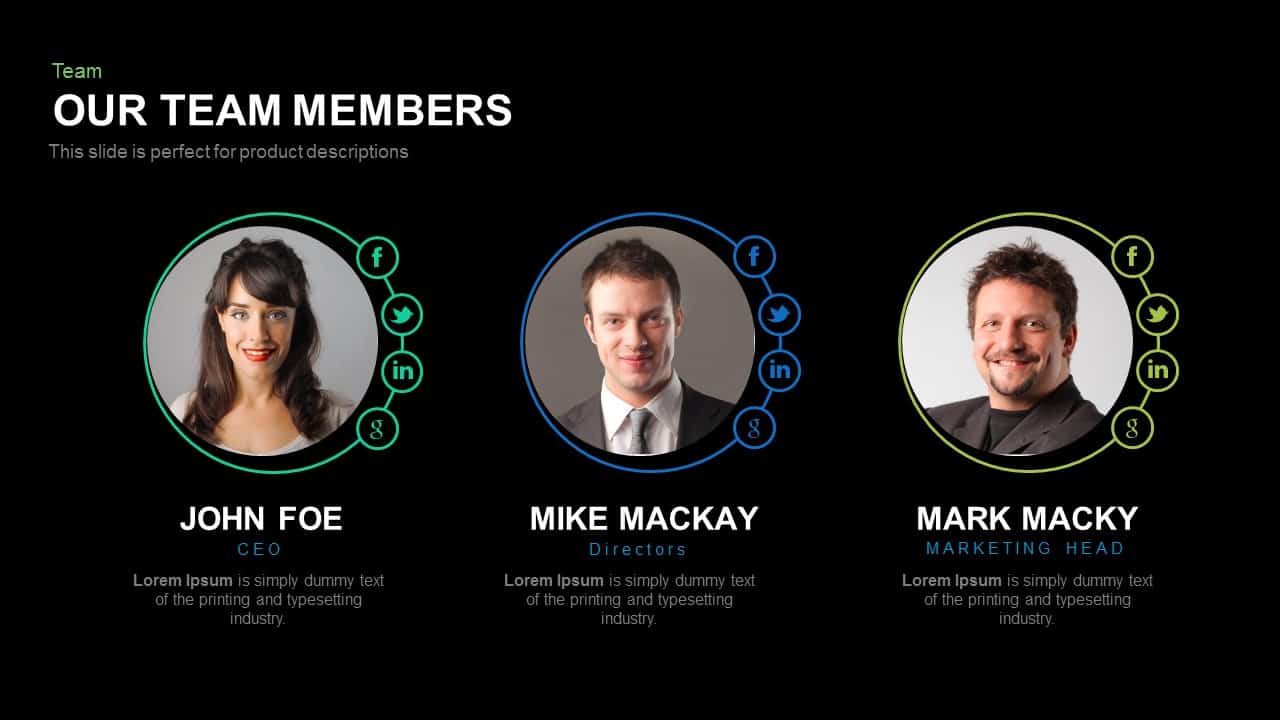
Professional Team Members Slide Template for PowerPoint & Google Slides
Our Team
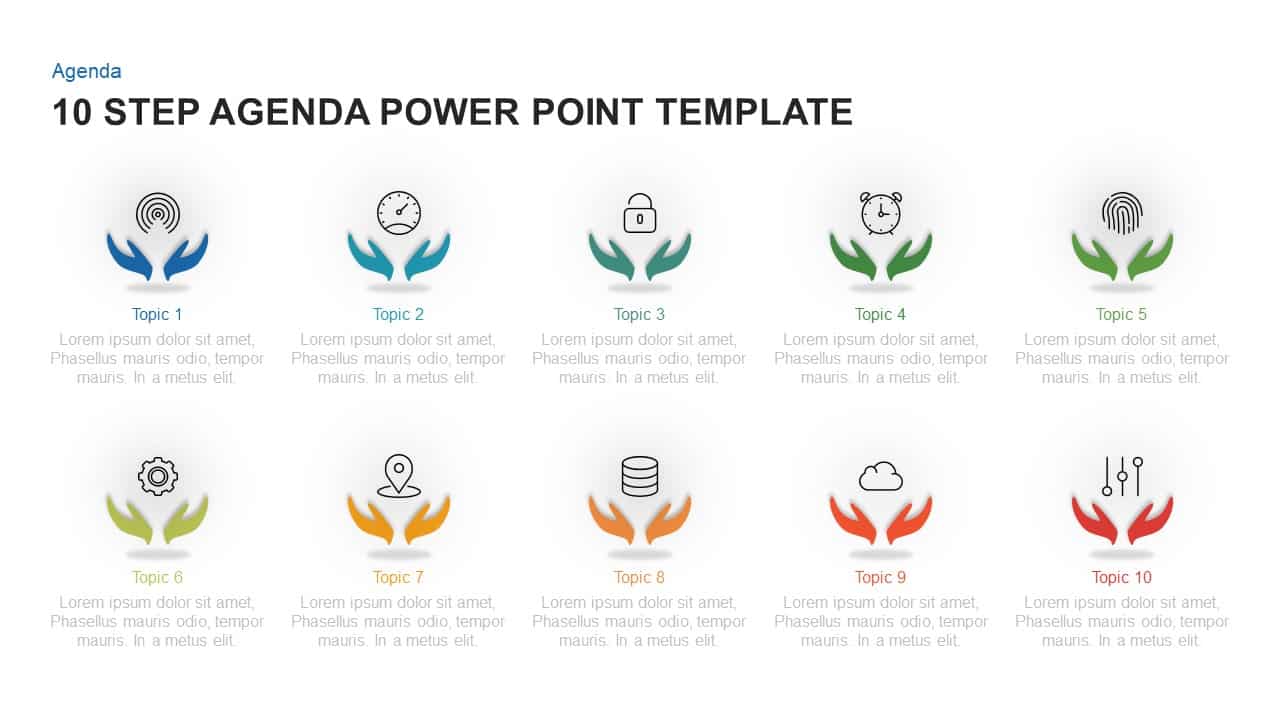
Professional Ten-Step Agenda Slide Template for PowerPoint & Google Slides
Agenda
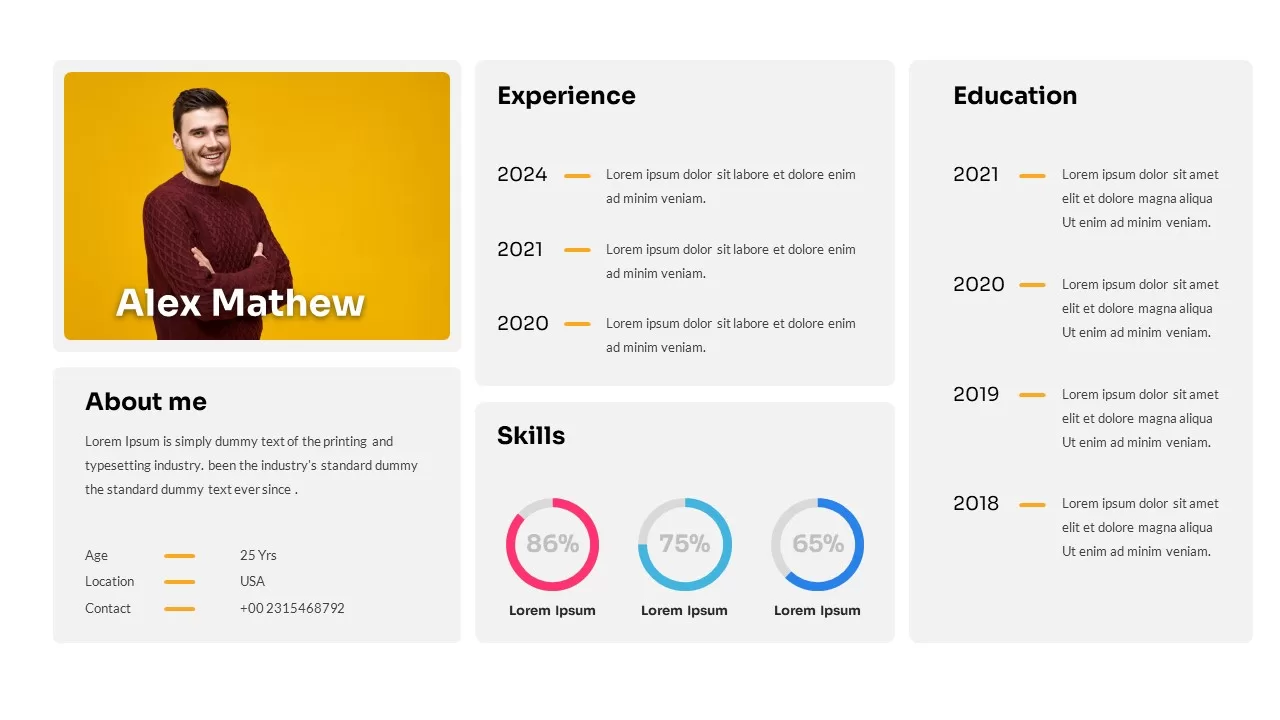
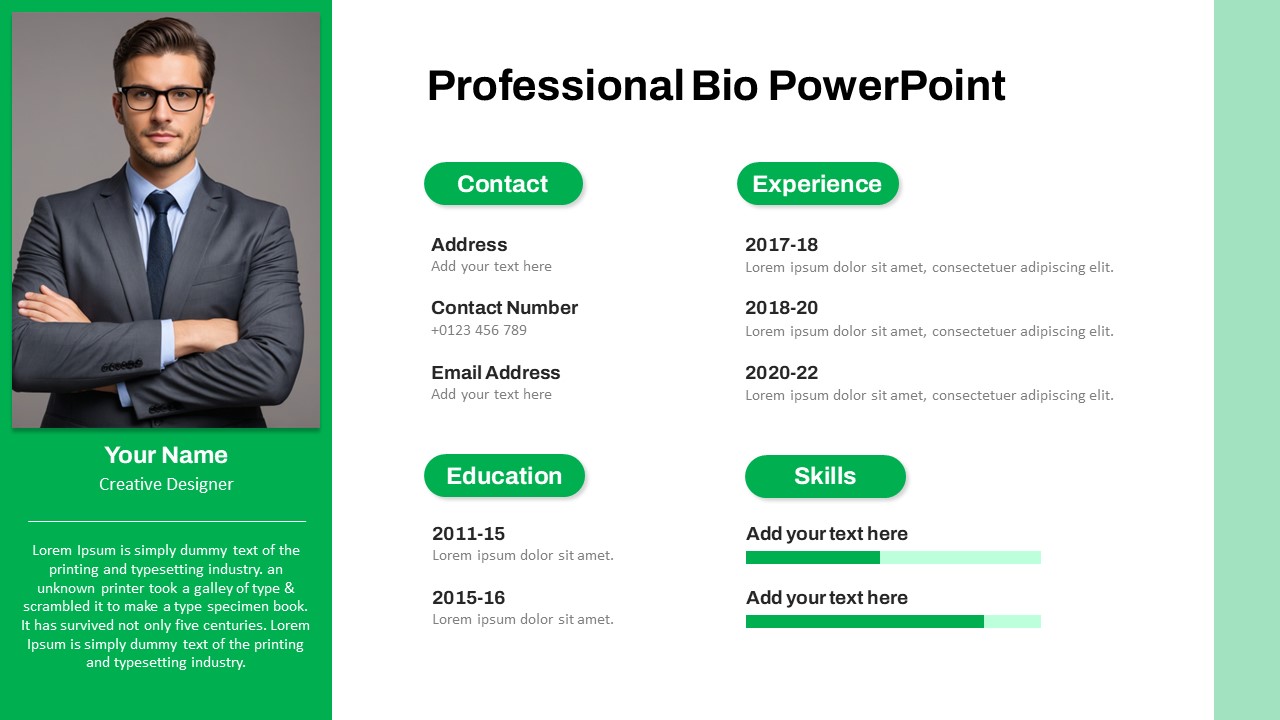
Professional Resume Profile Slide Template for PowerPoint & Google Slides
Recruitment
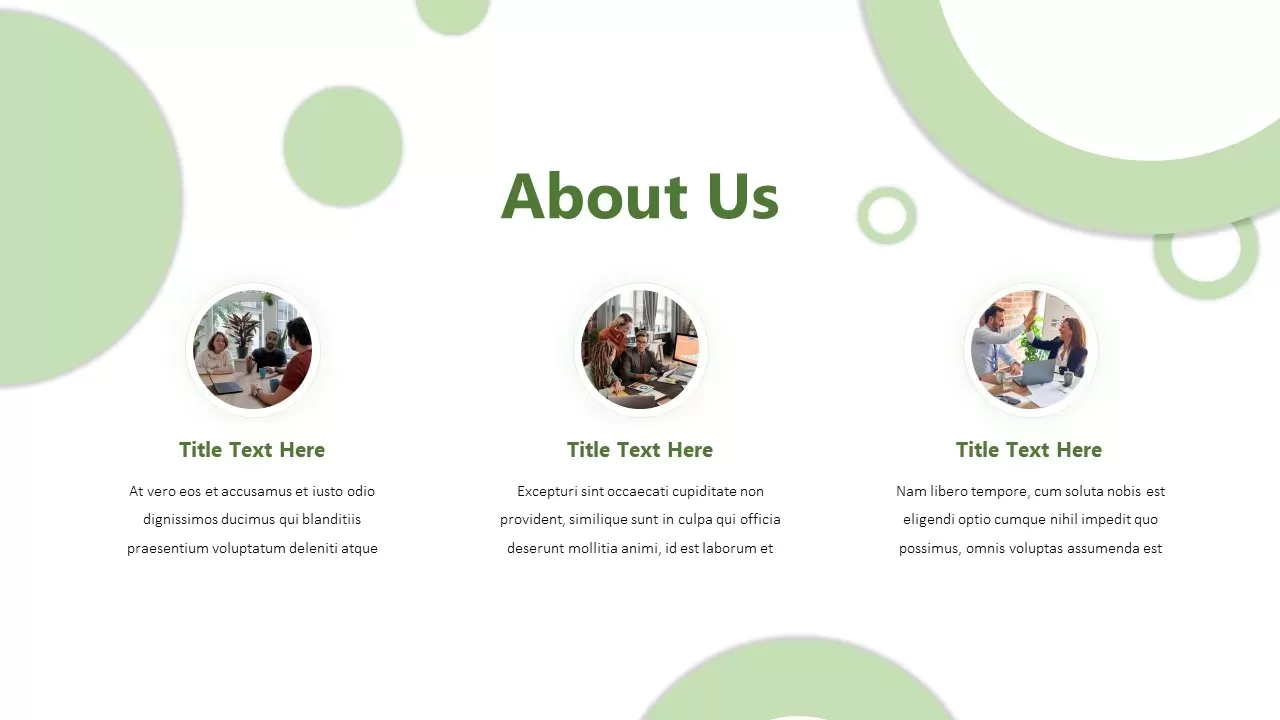
Professional Company About Us Slide Template for PowerPoint & Google Slides
Company Profile
Professional Team Collage & KPI Slide Template for PowerPoint & Google Slides
Business
Professional Corporate Cover Slide Template for PowerPoint & Google Slides
Company Profile
Professional Angular Cover Slide Template for PowerPoint & Google Slides
Company Profile
Professional References Slide Layout Template for PowerPoint & Google Slides
Infographics
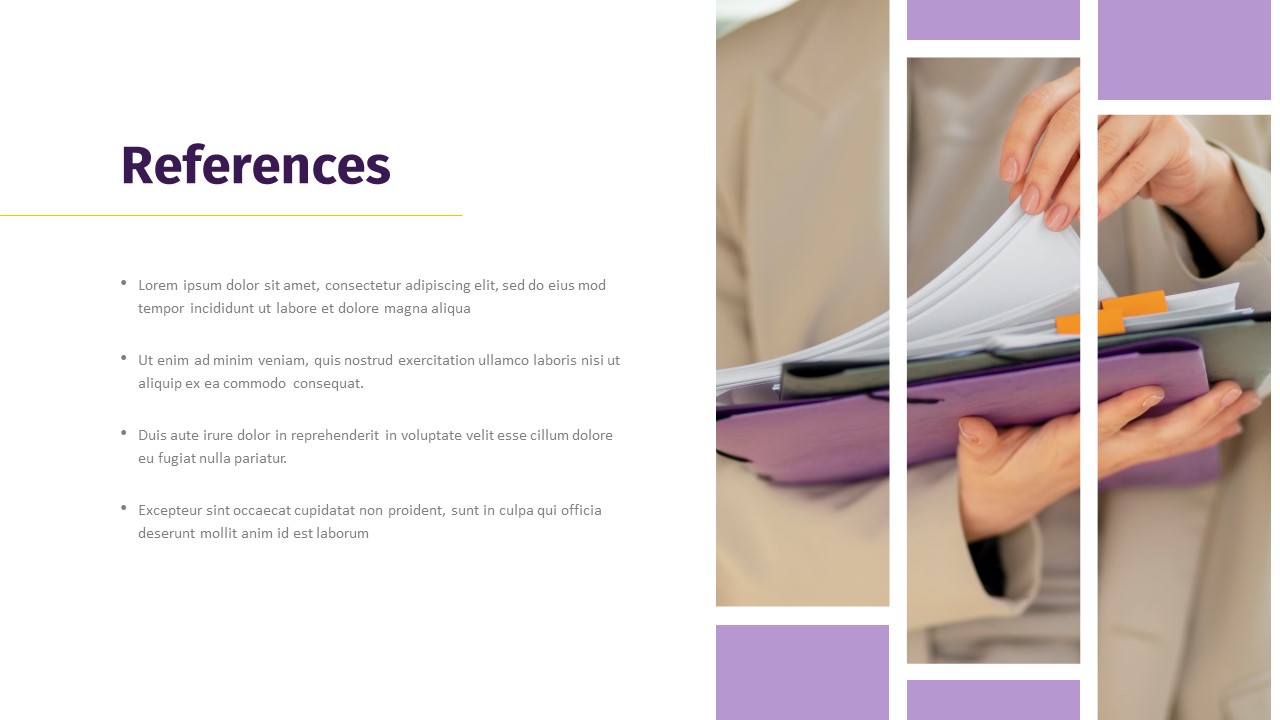
Professional Photo References Slide Template for PowerPoint & Google Slides
Business
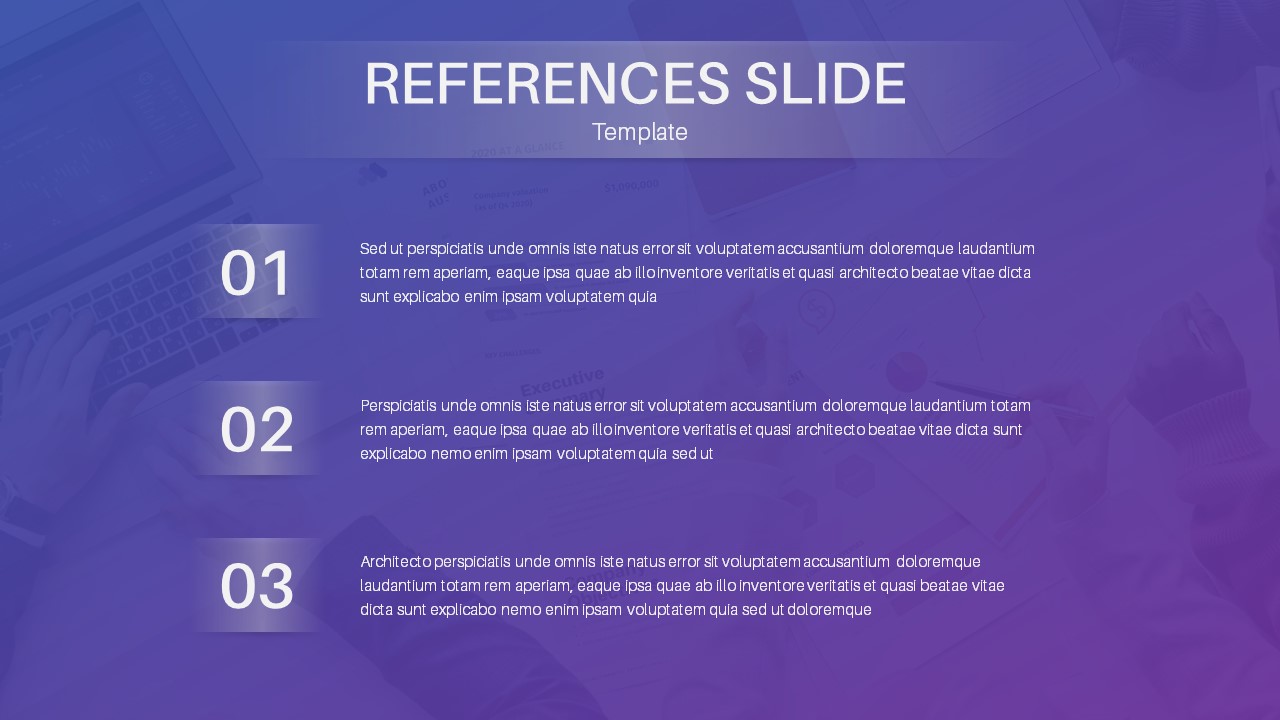
Modern Professional References Slide Template for PowerPoint & Google Slides
Business Report
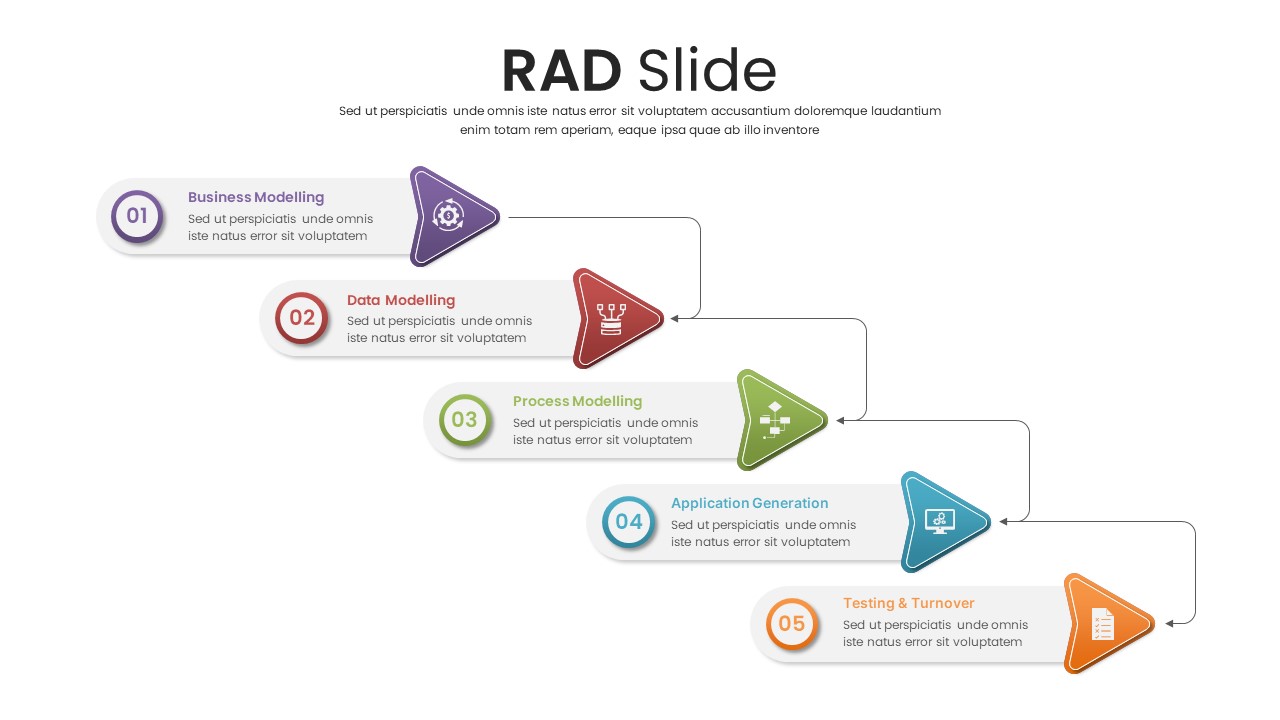
Professional Five-Step RAD Process Slide Template for PowerPoint & Google Slides
Process

Free Professional Event Planner Slide Deck Template for PowerPoint & Google Slides
Business
Free
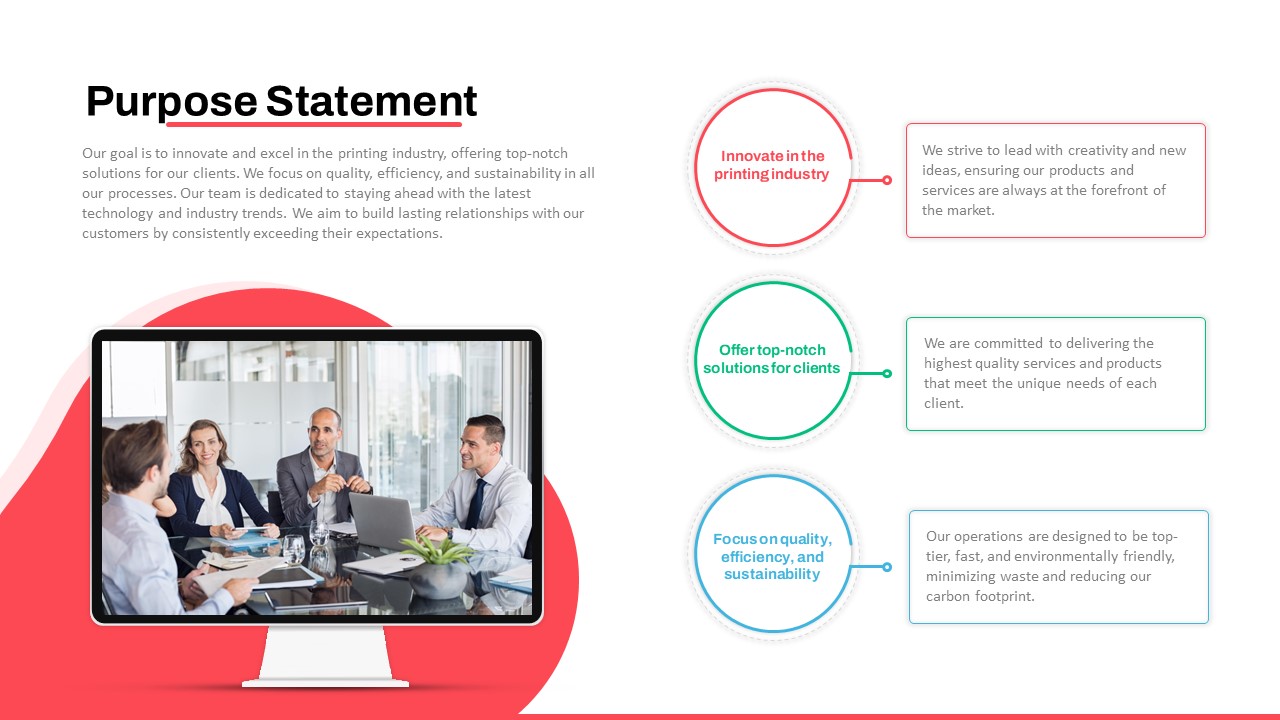
Professional Purpose Statement Slide Template for PowerPoint & Google Slides
Business Proposal
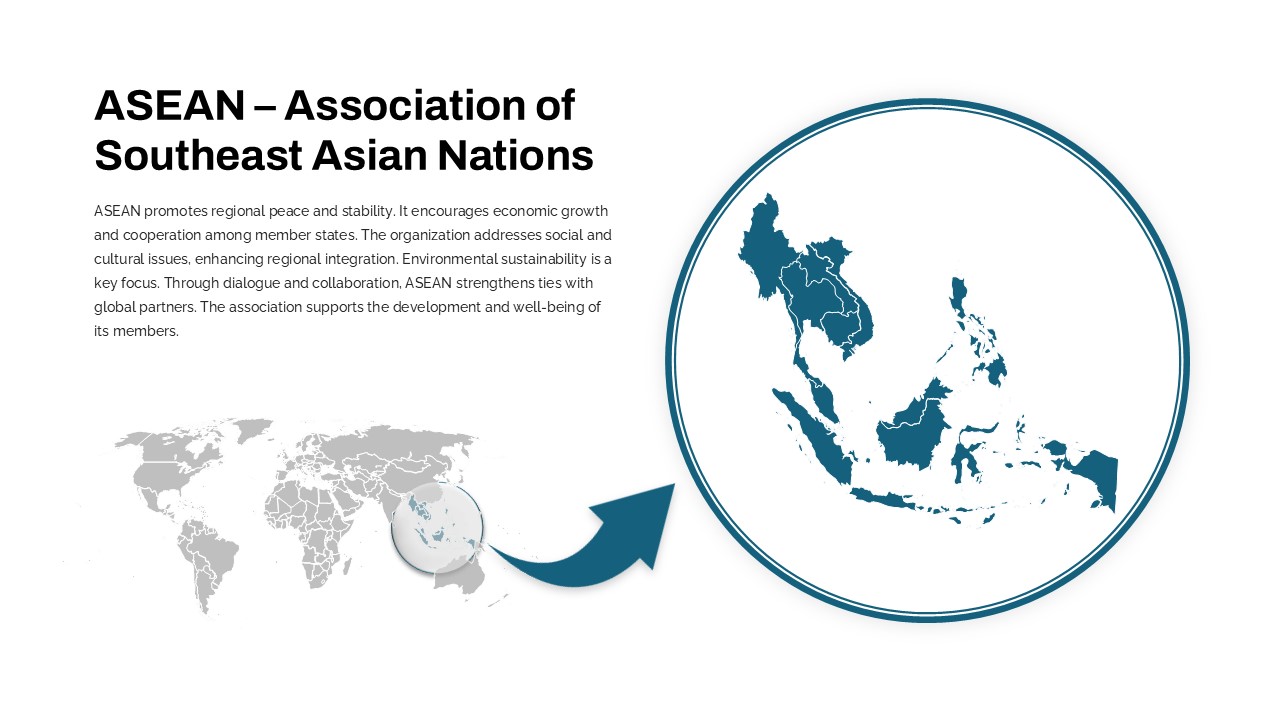
Professional ASEAN Region Zoom Map Slide Template for PowerPoint & Google Slides
World Maps
Professional Town Hall Cover Slide Template for PowerPoint & Google Slides
Graphics

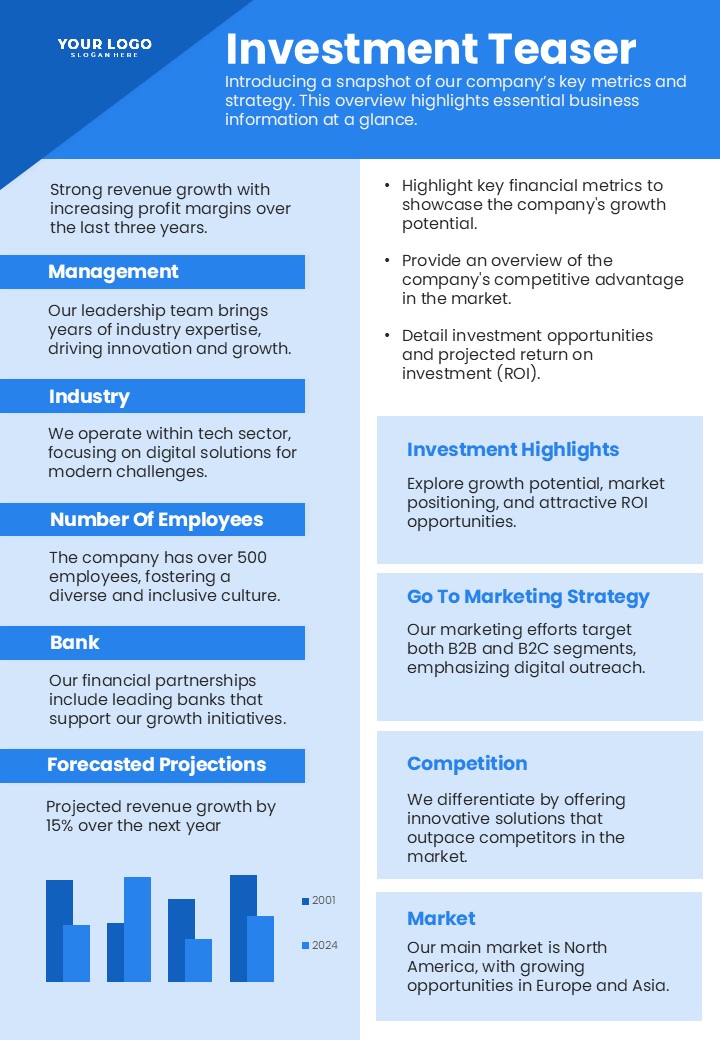
Professional Investment Teaser Slide Template for PowerPoint & Google Slides
Pitch Deck
Modern Professional Bio Resume Slide Template for PowerPoint & Google Slides
Recruitment
Professional Business Slide for PowerPoint & Google Slides
Company Profile
Free Professional Gantt Chart Pack – 4 Slides Template for PowerPoint & Google Slides
Gantt Chart
Free
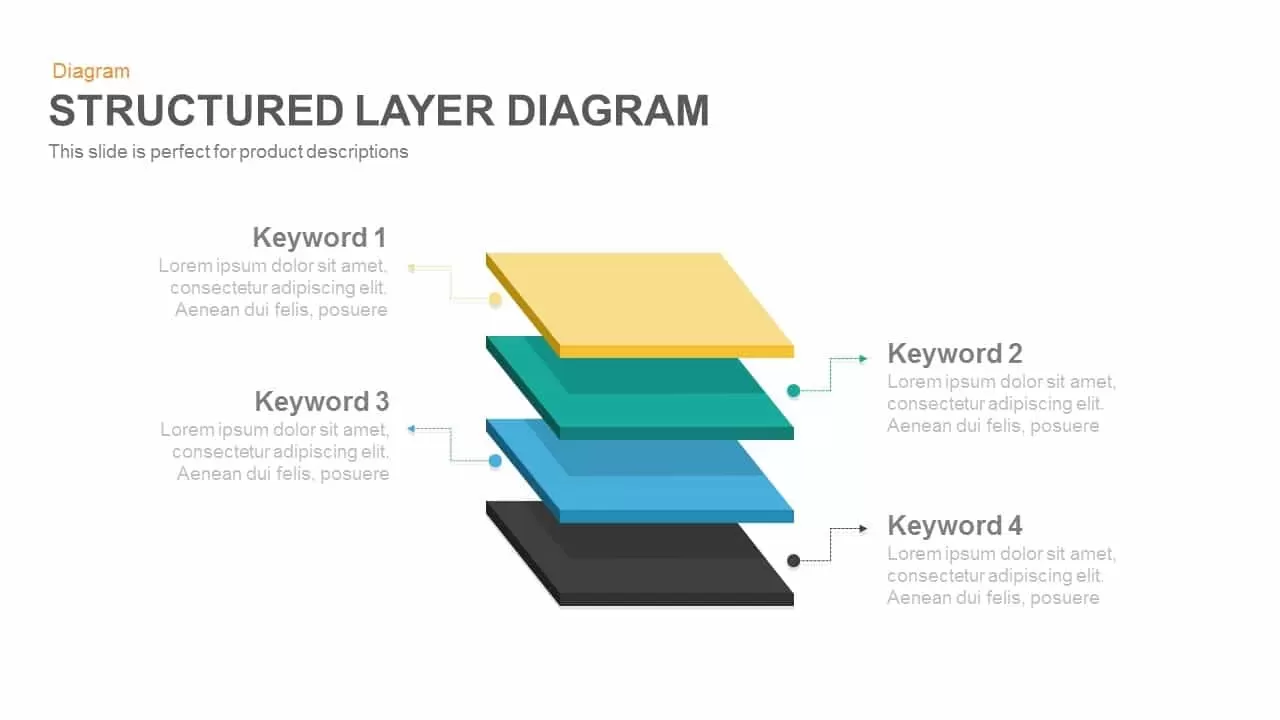
Professional Structured 3D Layer Diagram Template for PowerPoint & Google Slides
Process
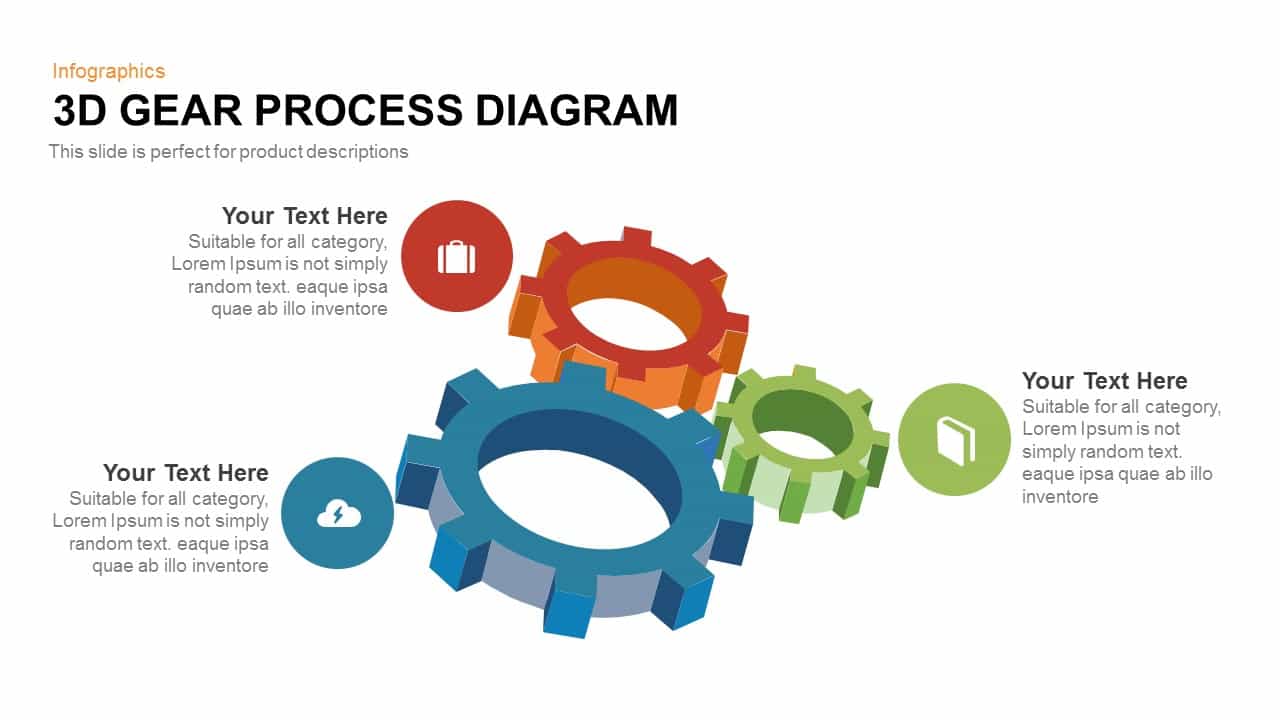
Professional 3D Gear Process Diagram Template for PowerPoint & Google Slides
Process
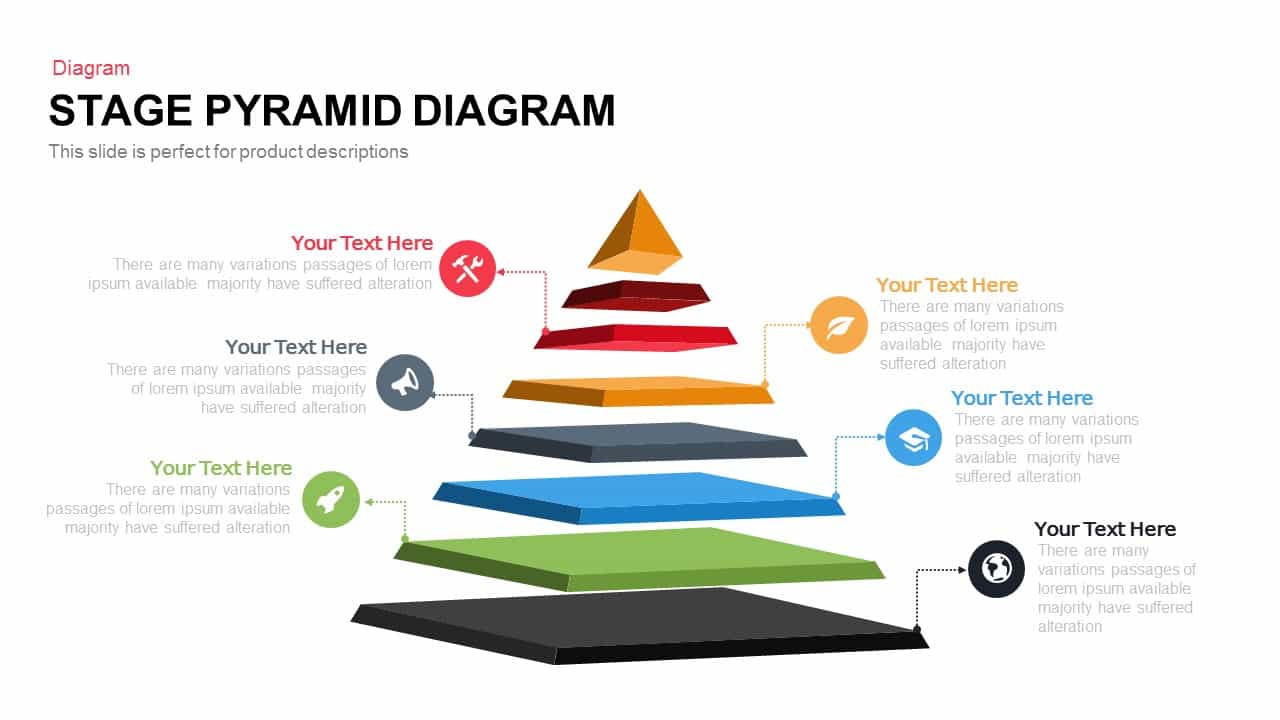
Professional 5-Stage Pyramid Diagram Template for PowerPoint & Google Slides
Pyramid
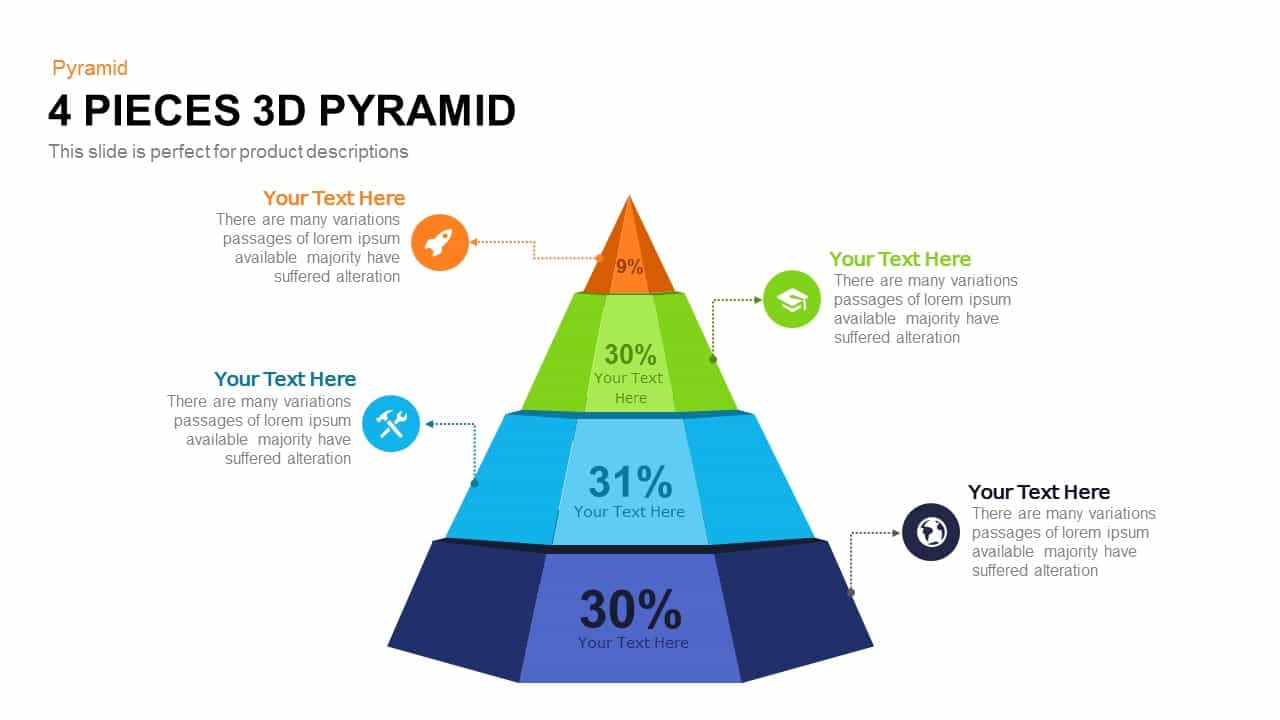
Professional 4-Piece 3D Pyramid Diagram Template for PowerPoint & Google Slides
Pyramid

Professional Team Efficiency Dashboard Template for PowerPoint & Google Slides
Business Report
Professional Four-Stage Funnel Diagram Template for PowerPoint & Google Slides
Funnel
Professional Security Metaphor Diagram Template for PowerPoint & Google Slides
Information Technology
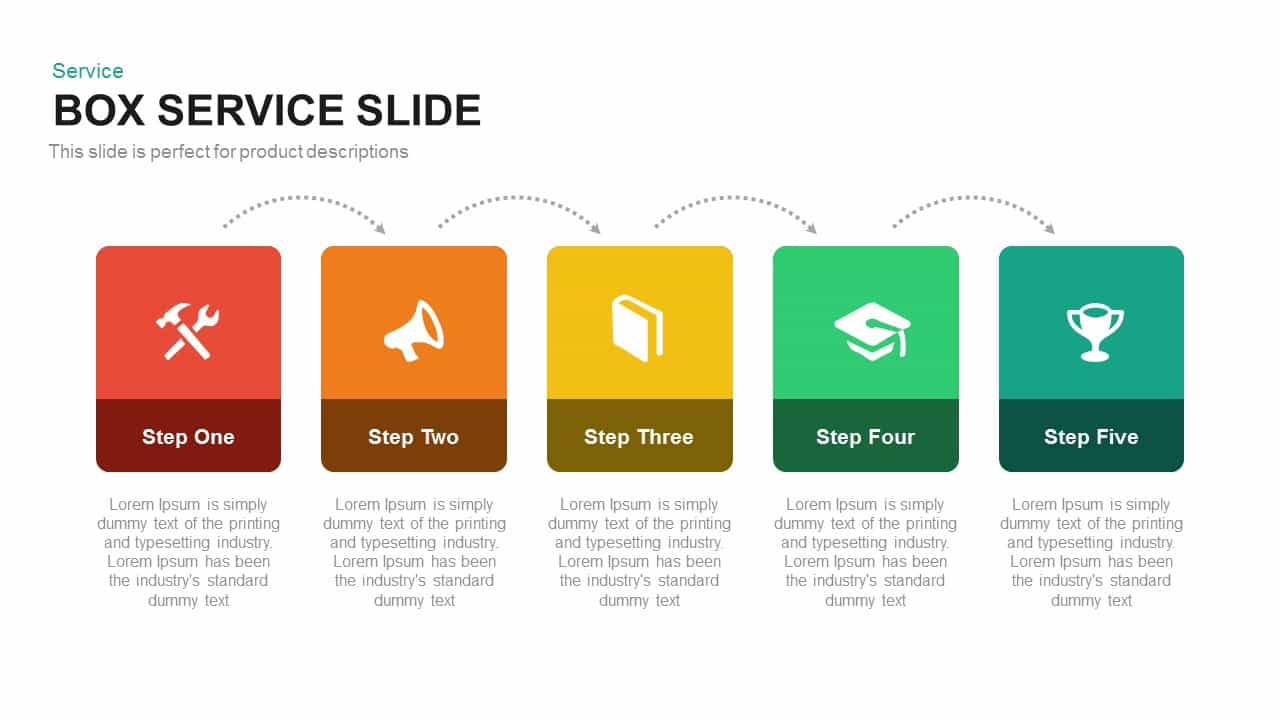
Professional Box Service Diagram Template for PowerPoint & Google Slides
Comparison

Professional PESTEL Analysis Diagram Template for PowerPoint & Google Slides
PEST

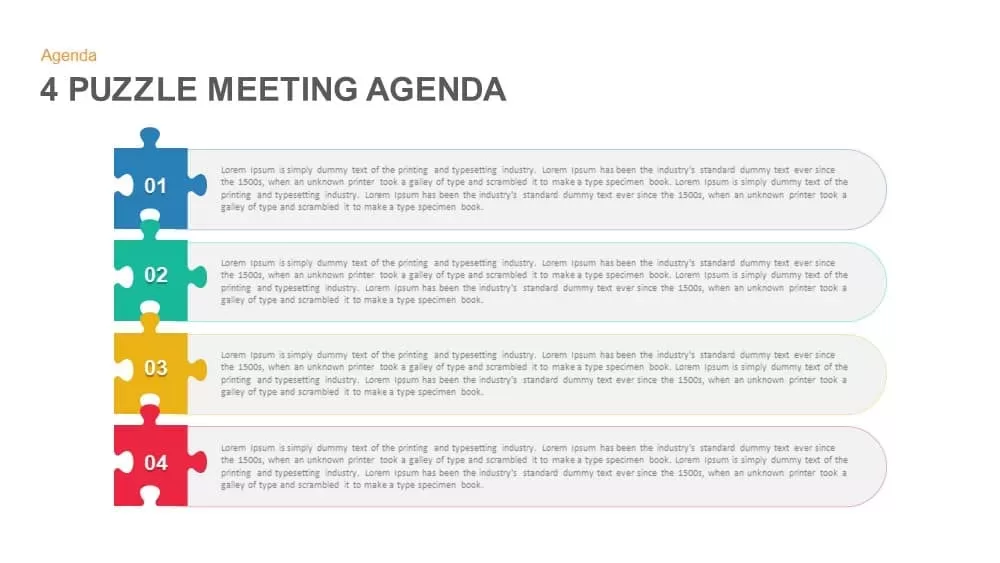
Professional Four Puzzle Meeting Agenda Template for PowerPoint & Google Slides
Agenda
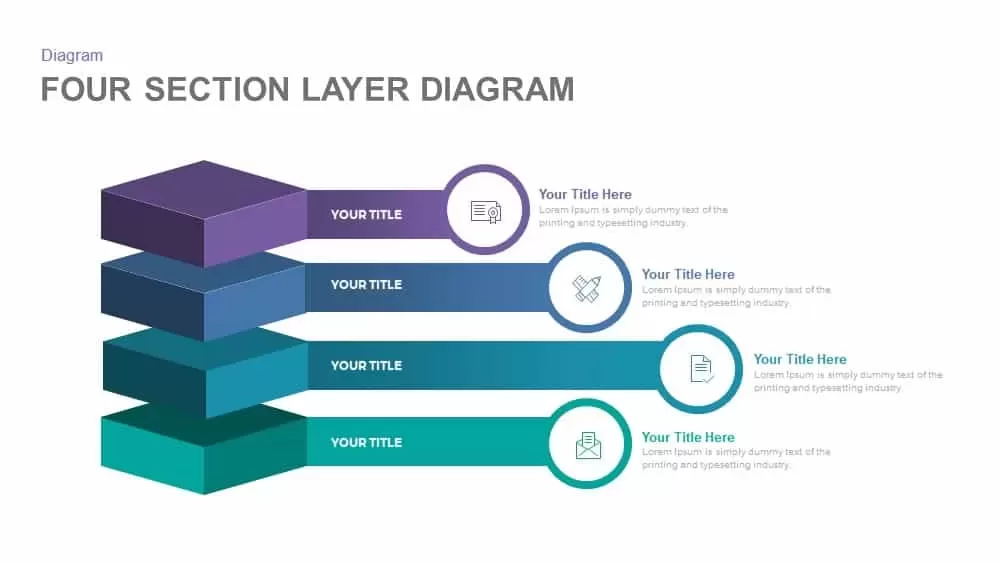
Professional Four-Section Layer Diagram Template for PowerPoint & Google Slides
Process
Free Professional Cloud Infographics Template for PowerPoint & Google Slides
Process
Free
Six-Section Professional Agenda Template for PowerPoint & Google Slides
Agenda
Professional Sales Funnel Diagram Template for PowerPoint & Google Slides
Funnel
Professional Pitch Deck Template for PowerPoint & Google Slides
Pitch Deck
Professional Sales Performance Report Template for PowerPoint & Google Slides
Business Report
Professional Personal CV Presentation Template for PowerPoint & Google Slides
Company Profile
Professional Mobile App Showcase Deck Template for PowerPoint & Google Slides
Pitch Deck
Professional Sales Meeting Presentation Template for PowerPoint & Google Slides
Pitch Deck
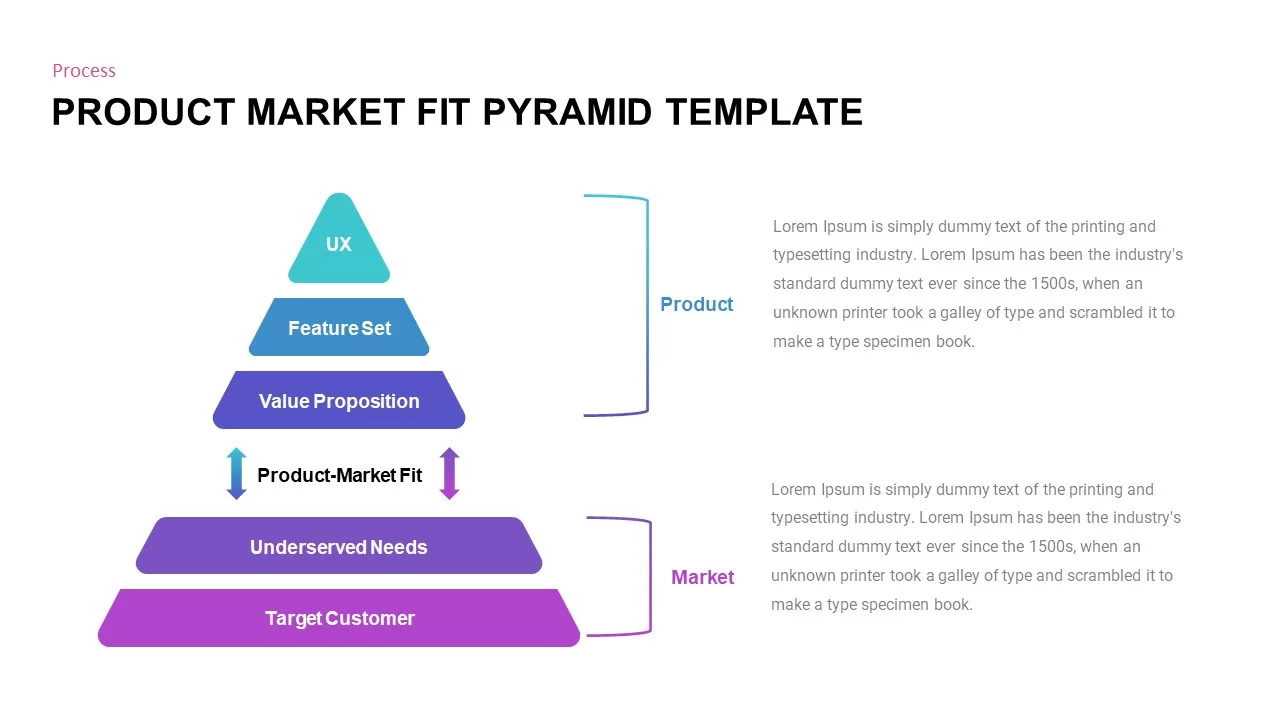
Professional Product Market Fit Pyramid Template for PowerPoint & Google Slides
Pyramid
Professional Portfolio Profile Template for PowerPoint & Google Slides
Decks
Professional Organizational Chart Diagram Template for PowerPoint & Google Slides
Org Chart
Professional Consulting Deck Presentation Template for PowerPoint & Google Slides
Pitch Deck
Professional Risk Heat Map Visualization Template for PowerPoint & Google Slides
Risk Management
Professional Interactive Heat Map Matrix Template for PowerPoint & Google Slides
Comparison Chart
Professional Nurse-Led Healthcare Template for PowerPoint & Google Slides
Nursing
Professional Corporate Company About Us Template for PowerPoint & Google Slides
Graphics
Professional Heatmap Data Visualization Template for PowerPoint & Google Slides
Infographics
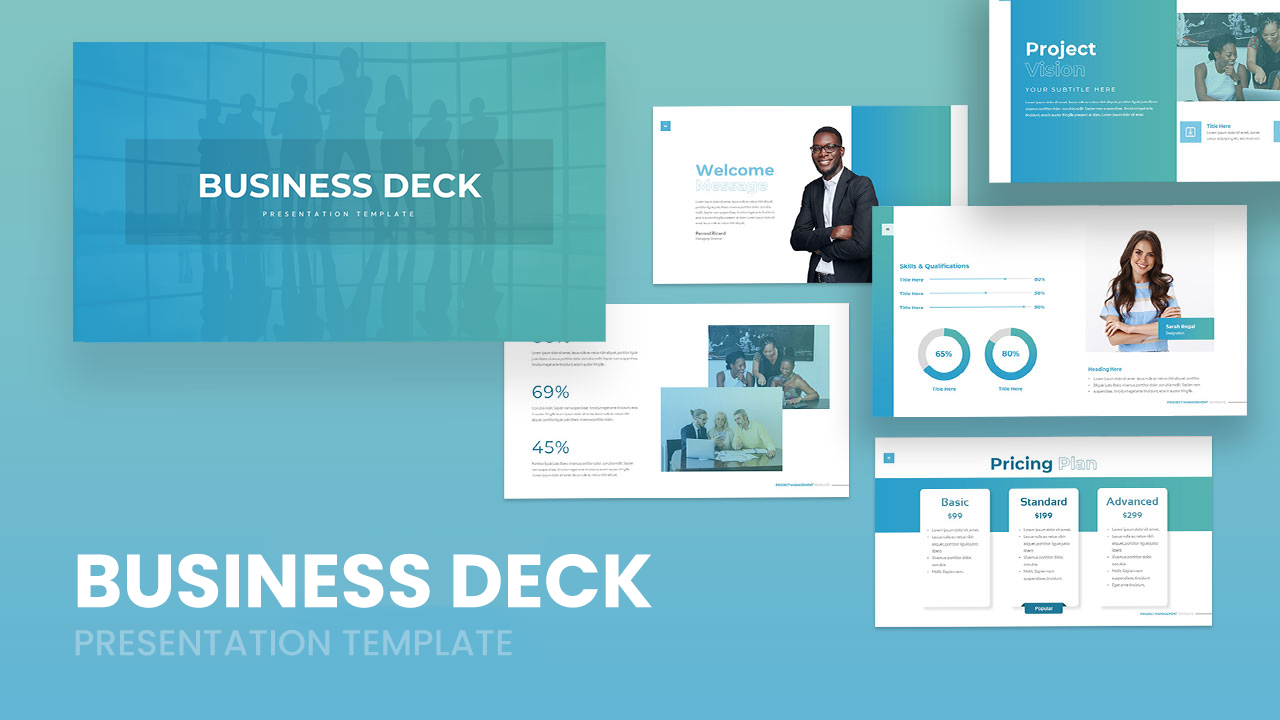
Professional Business Deck Presentation Template for PowerPoint & Google Slides
Company Profile
Professional Portfolio Presentation Deck Template for PowerPoint & Google Slides
Decks
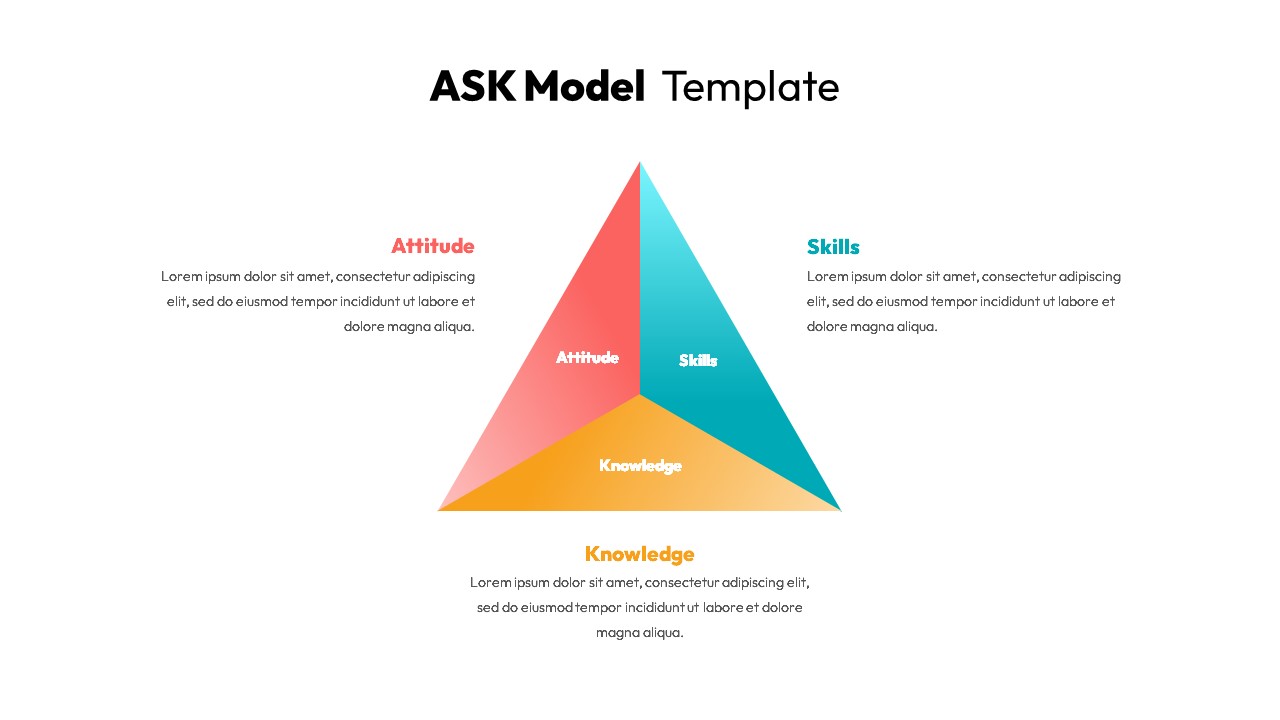
Professional ASK Model Template for PowerPoint & Google Slides
Employee Performance
Professional 6 Circle Venn Diagram Template for PowerPoint & Google Slides
Circular
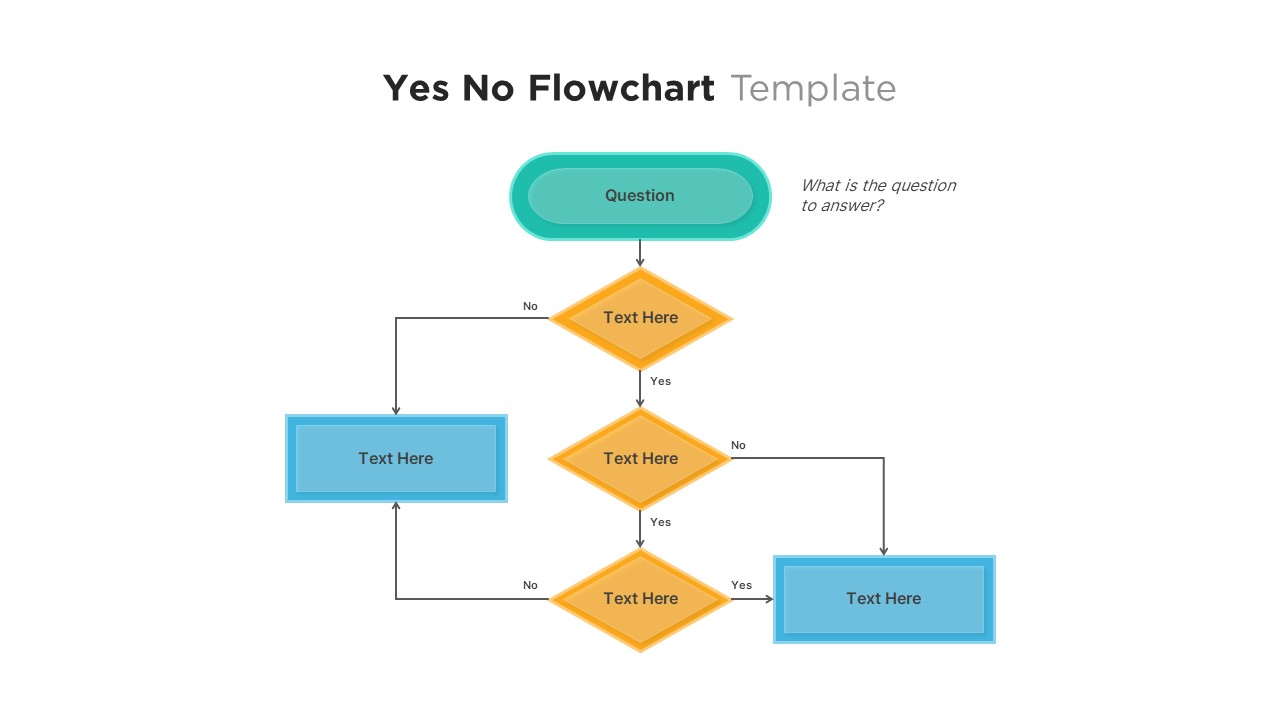
Professional Yes No Decision Flowchart Template for PowerPoint & Google Slides
Flow Charts
Professional Editable 6 Month Timeline Template for PowerPoint & Google Slides
Timeline
Professional Key Highlights Layout Template for PowerPoint & Google Slides
Business
Professional Golf Presentation Deck Template for PowerPoint & Google Slides
Graphics
Professional Mentoring Presentation Template for PowerPoint & Google Slides
Leadership
Professional Statement of Work Template for PowerPoint & Google Slides
Project
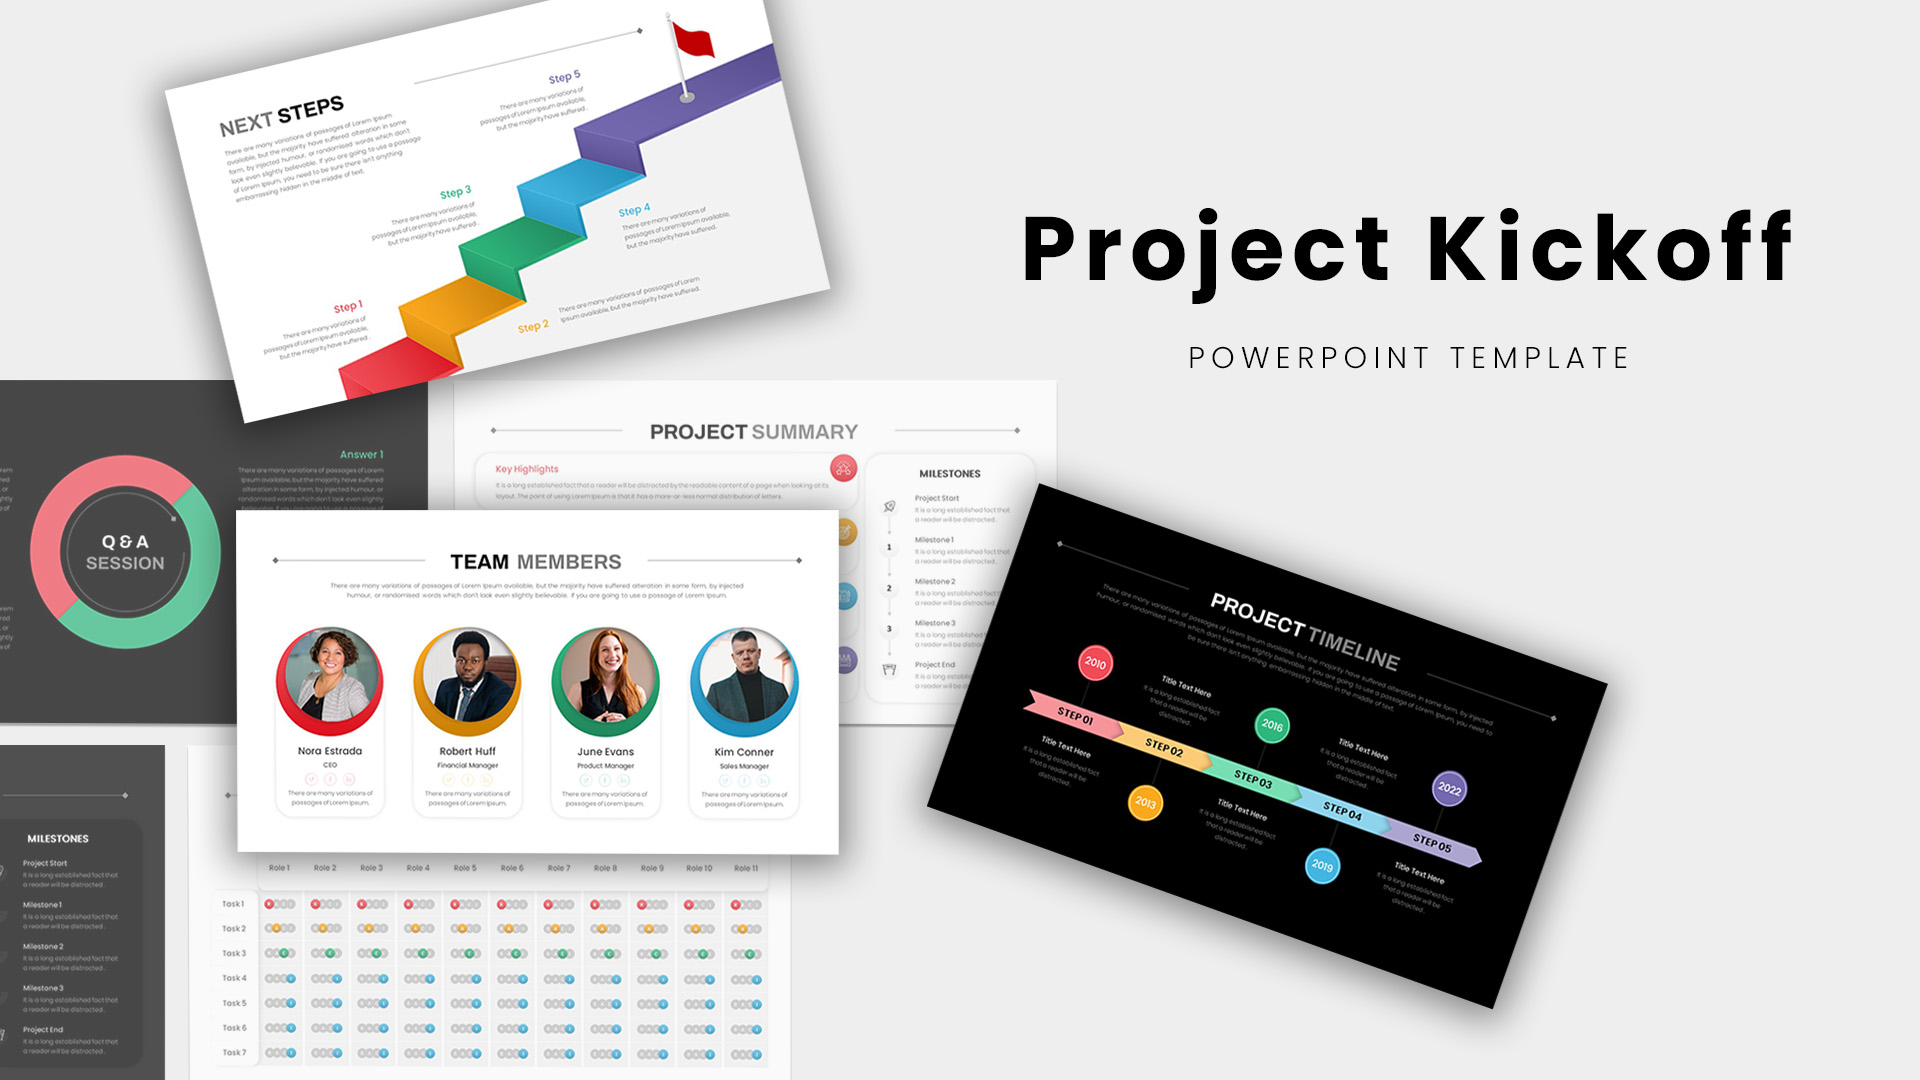
Professional Project Kickoff Deck Template for PowerPoint & Google Slides
Project
Professional Clustered Column Chart Template for PowerPoint & Google Slides
Bar/Column
Professional 100% Stacked Column Chart Template for PowerPoint & Google Slides
Bar/Column
Professional Quad Chart Layout Template for PowerPoint & Google Slides
Pie/Donut

Professional Dental Clinic Profile Template for PowerPoint & Google Slides
Company Profile
Professional Milestone Timeline Chart Template for PowerPoint & Google Slides
Timeline
Professional Law & Justice Presentation Template for PowerPoint & Google Slides
Company Profile
Professional HR Organization Chart Template for PowerPoint & Google Slides
Org Chart
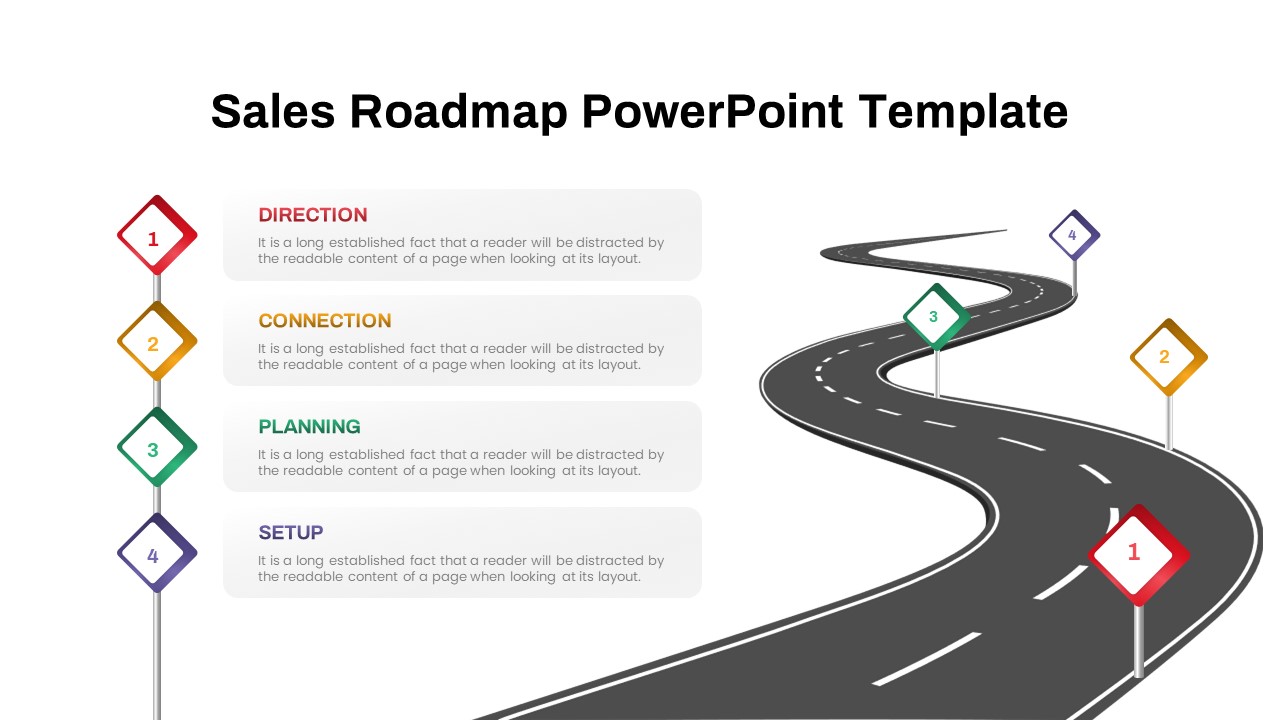
Professional Winding Road Sales Roadmap Template for PowerPoint & Google Slides
Roadmap
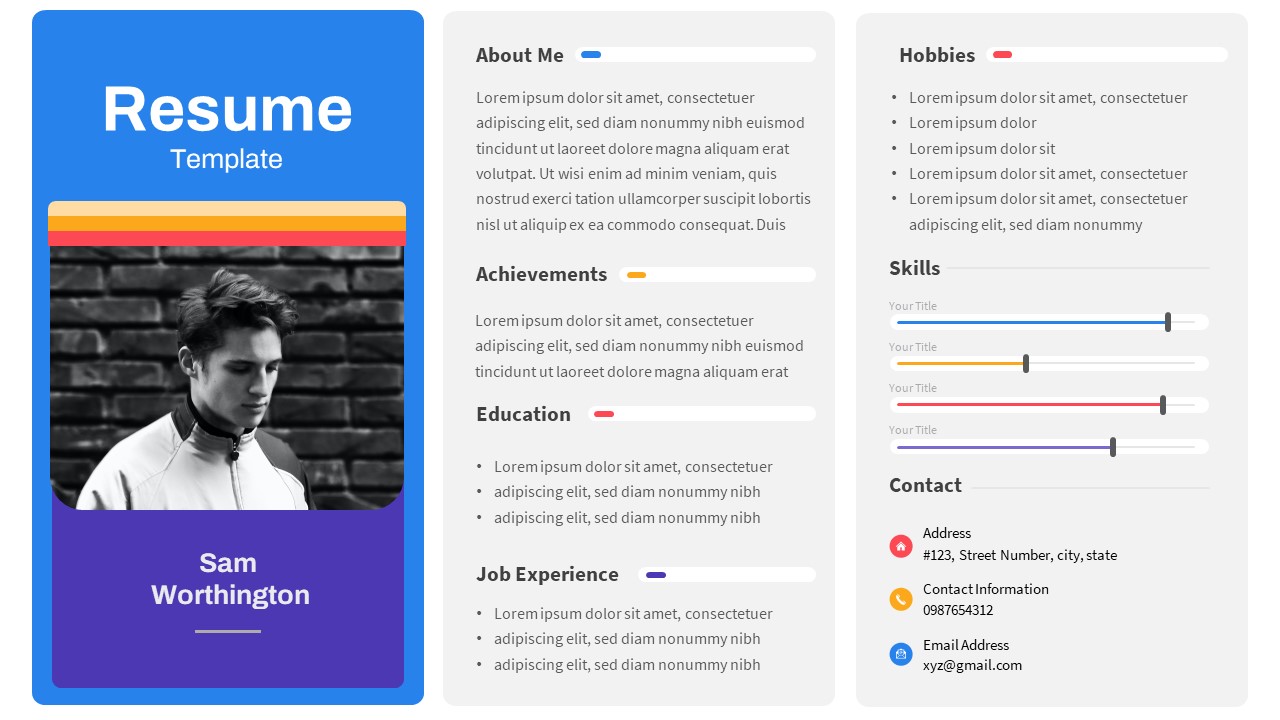
Professional Photo-Focused Resume Template for PowerPoint & Google Slides
Recruitment
Free
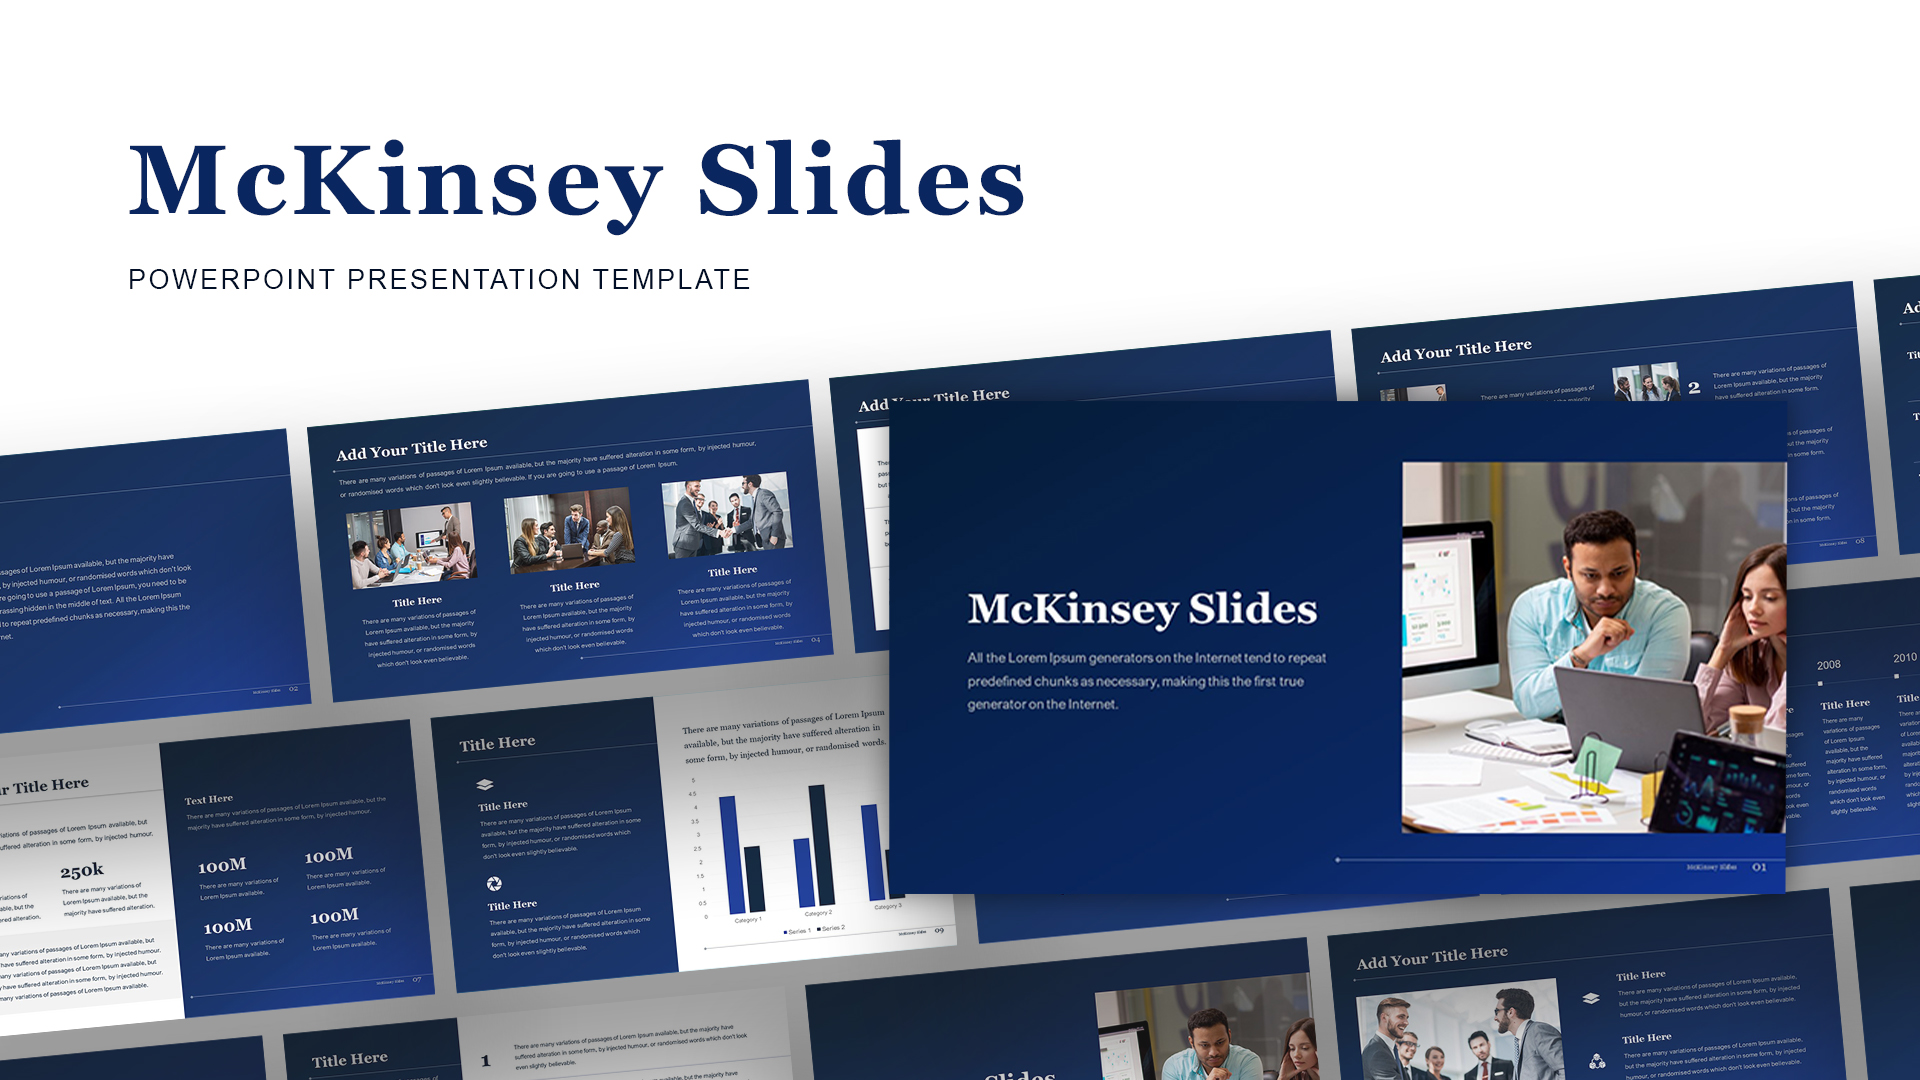
McKinsey-Style Professional Business Deck Template for PowerPoint & Google Slides
Business Report
Modern Professional Medical Service Template for PowerPoint & Google Slides
Health
Free Professional Carnival Pitch Deck Template for PowerPoint & Google Slides
Pitch Deck
Free
Free Forest-Themed Professional Presentation Template for PowerPoint & Google Slides
Company Profile
Free
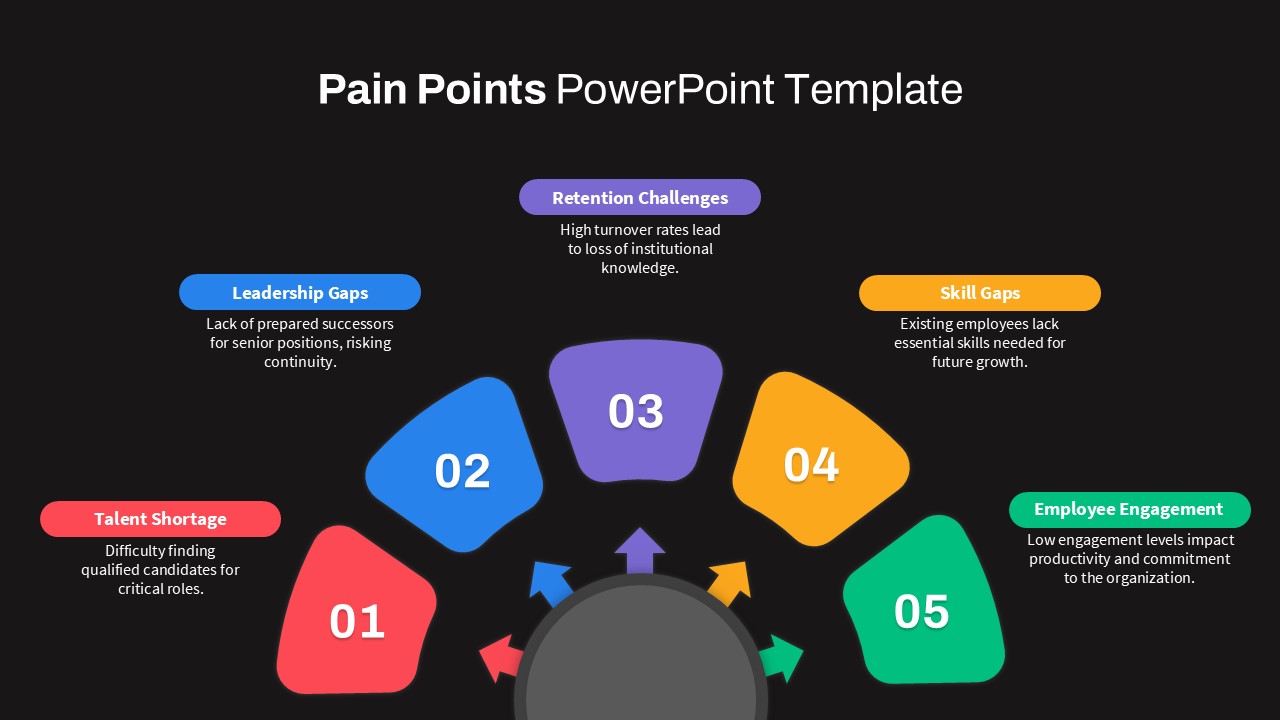
Professional Circular Pain Points Template for PowerPoint & Google Slides
Circular
Professional Green Geometric Background Template for PowerPoint & Google Slides
Background
Ansoff Growth Matrix Professional Template for PowerPoint & Google Slides
Comparison
Professional Animated Sales Presentation Template for PowerPoint & Google Slides
Pitch Deck
Professional Executive Board Meeting Template for PowerPoint & Google Slides
Business Report
Professional Table of Organization Chart Template for PowerPoint & Google Slides
Org Chart
Gray Professional Deck template for PowerPoint & Google Slides
Pitch Deck
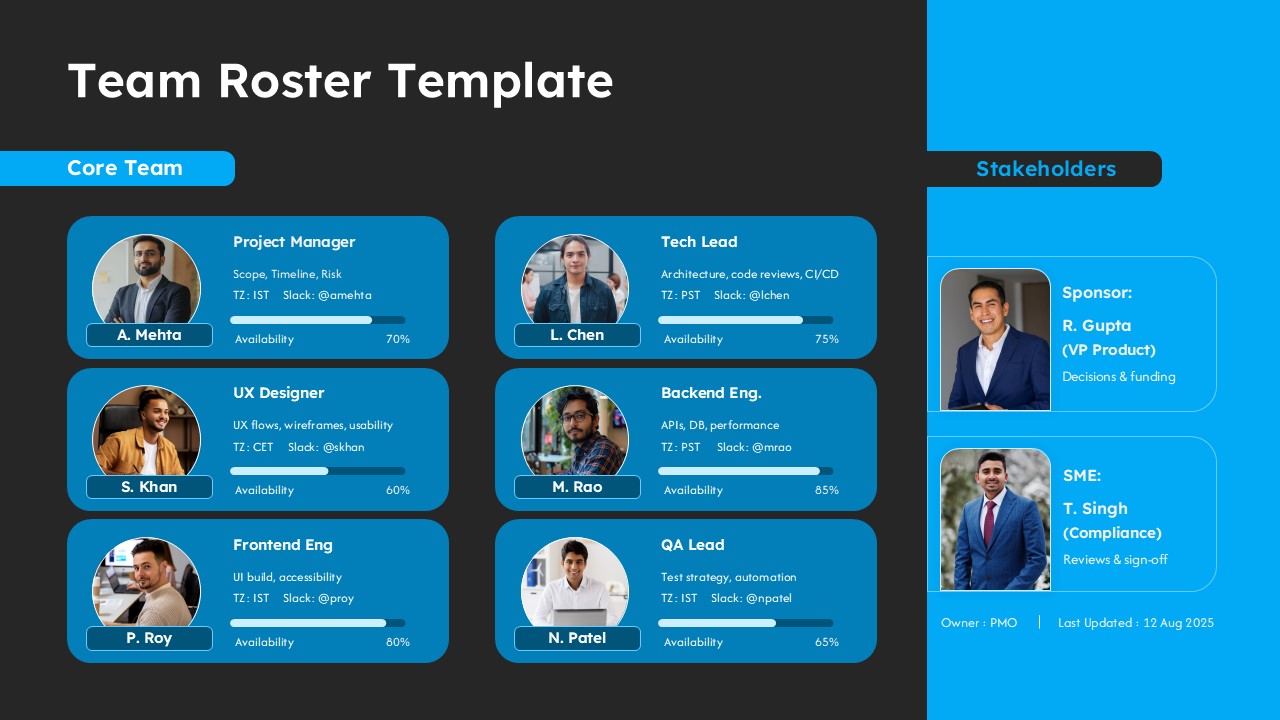
Professional Team Roster Template for PowerPoint & Google Slides
Our Team
Free Professional Background PowerPoint Template
Decks
Free
Five 3D Growth Arrow Infographic Slide Template for PowerPoint & Google Slides
Arrow
Key Metaphor Infographic Slide Template for PowerPoint & Google Slides
Process
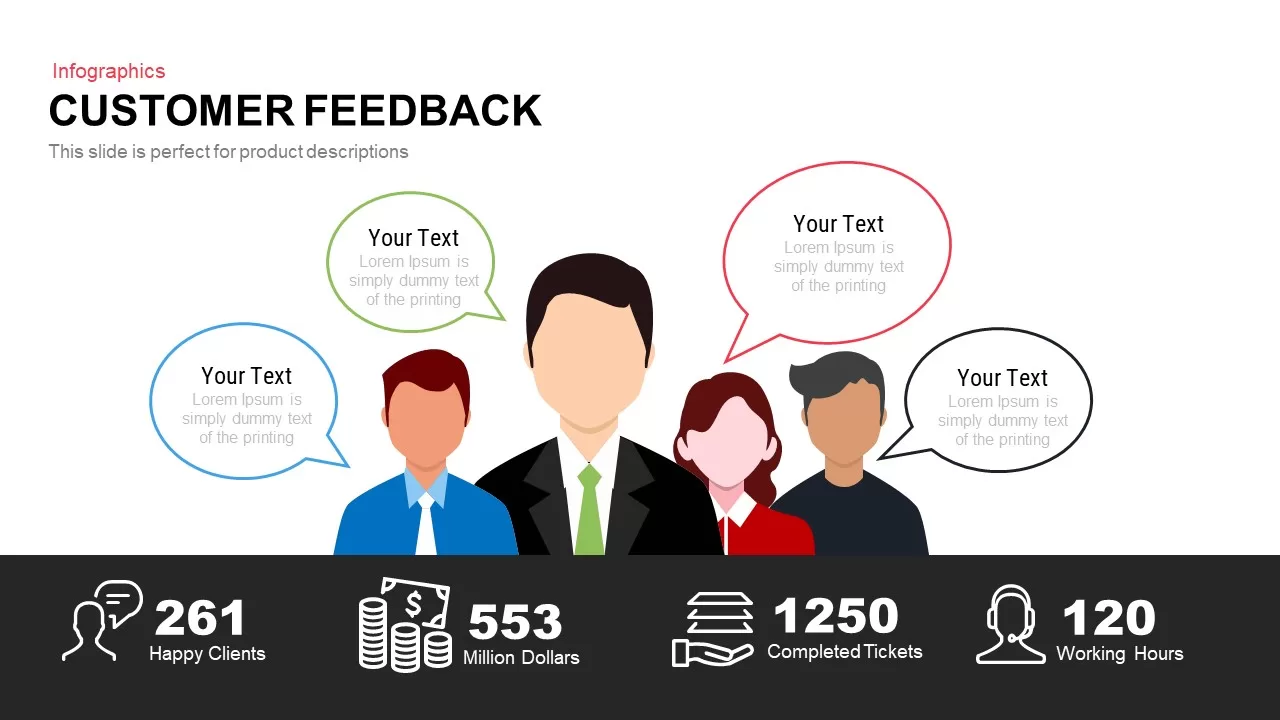
Customer Feedback Infographic Slide Template for PowerPoint & Google Slides
Customer Experience
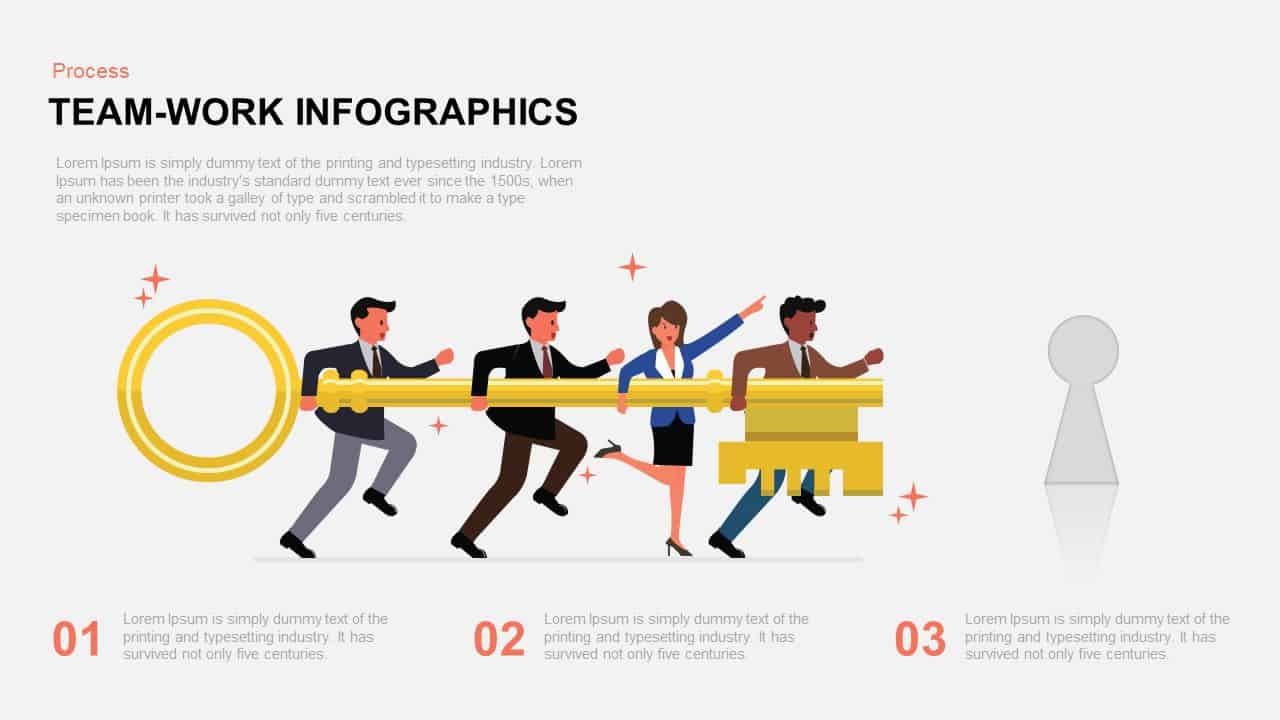
Teamwork Key Infographic Slide Template for PowerPoint & Google Slides
Process
Five-Step Growth Infographic Slide Template for PowerPoint & Google Slides
Process
Two-Column Comparison Infographic Slide Template for PowerPoint & Google Slides
Comparison
Shape Loop Four-Step Infographic Slide Template for PowerPoint & Google Slides
Process
Key Takeaway Slide Infographic Template for PowerPoint & Google Slides
Process
Animated 3D Dice Infographic Slide Template for PowerPoint & Google Slides
Process
8-Bell Curve Infographic Slide Template for PowerPoint & Google Slides
Comparison Chart
LinkedIn Metrics Infographic Slide Template for PowerPoint & Google Slides
Digital Marketing
Community Building Infographic Slide Template for PowerPoint & Google Slides
Leadership