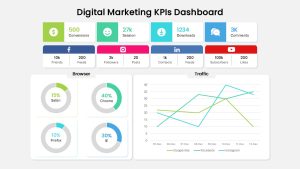
Digital Marketing KPIs Dashboard Dark Template for PowerPoint & Google Slides


Description
Use this dark-themed Digital Marketing KPI dashboard slide to track and visualize your campaign performance in one cohesive view. The top section features four metric cards—Conversions (500), Sessions (27k), Downloads (1,234), and Comments (3K)—each with an intuitive icon and contrasting accent color for instant recognition. Below, a social media panel displays follower counts and engagement metrics across Facebook, Instagram, LinkedIn, and YouTube, using branded color bars and dual-value callouts (e.g., 10k Friends / 200 Feeds) to highlight platform-specific insights.
The lower half of the slide splits into two data visualizations: a four-chart browser usage dashboard with donut graphs for Safari (15%), Chrome (40%), Firefox (10%), and IE (30%), and a traffic trend line chart plotting Google Ads, Facebook, and Instagram performance over time. Vertical and radial gridlines, subtle drop shadows, and neon-on-black contrasts ensure readability and draw attention to critical data points.
Built on master slides for both PowerPoint and Google Slides, this template offers easy-to-edit placeholders for text, icons, and chart data. Simply swap out values, adjust color accents to match your brand palette, or expand the social panel with additional platforms. The high-resolution export guarantees crisp on-screen and print quality, while the structured grid layout eliminates manual alignment headaches.
Engineered for C-suite presentations, marketing reviews, and weekly stand-ups, this KPI dashboard drives data-driven decision-making by consolidating diverse metrics into a unified visual narrative. Whether you’re analyzing channel performance, comparing browser behaviors, or forecasting traffic trends, this slide empowers your team to spot opportunities and course-correct with speed and precision.
Who is it for
Digital marketers, analytics teams, CMOs, and agency account managers will benefit from this dashboard when presenting campaign results, optimizing channel mix, or aligning stakeholders on performance goals.
Other Uses
Repurpose this layout for sales performance reports, product adoption metrics, executive scorecards, or operational dashboards. Swap icons and labels to track revenue streams, customer support KPIs, or project delivery milestones.
Login to download this file

Item ID
SB05369
Related Templates

Business Dashboard Analytics & KPIs Template for PowerPoint & Google Slides
Bar/Column

Modern Dark Digital Marketing Theme Template for PowerPoint & Google Slides
Digital Marketing
Digital Marketing Roadmap PowerPoint Template for PowerPoint & Google Slides
Digital Marketing

Digital Marketing Report Deck Template for PowerPoint & Google Slides
Pitch Deck
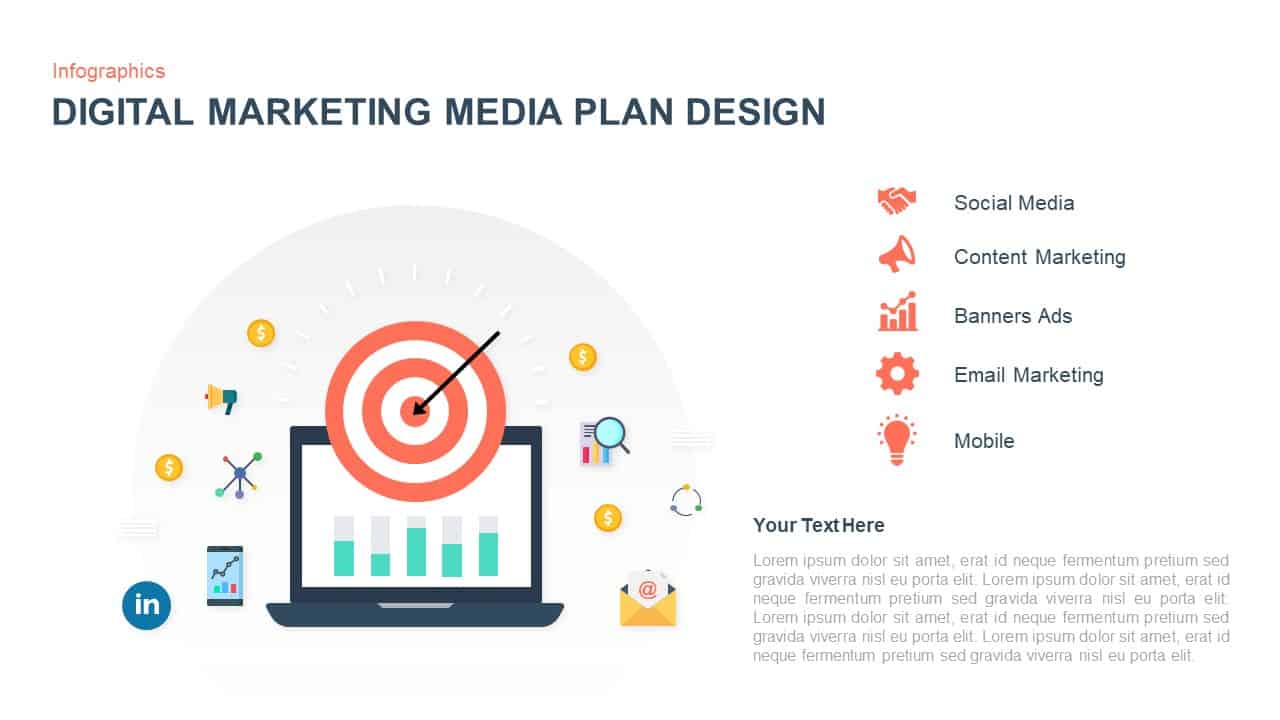
Digital Marketing Media Plan Infographic Template for PowerPoint & Google Slides
Digital Marketing
Vibrant Digital Marketing Metaphor Template for PowerPoint & Google Slides
Advertising

Modern Digital Marketing Strategy Template for PowerPoint & Google Slides
Pitch Deck
Digital Marketing Analytics Presentation Template for PowerPoint & Google Slides
Digital Marketing
Silver Fox Digital Marketing Proposal template for PowerPoint & Google Slides
Company Profile
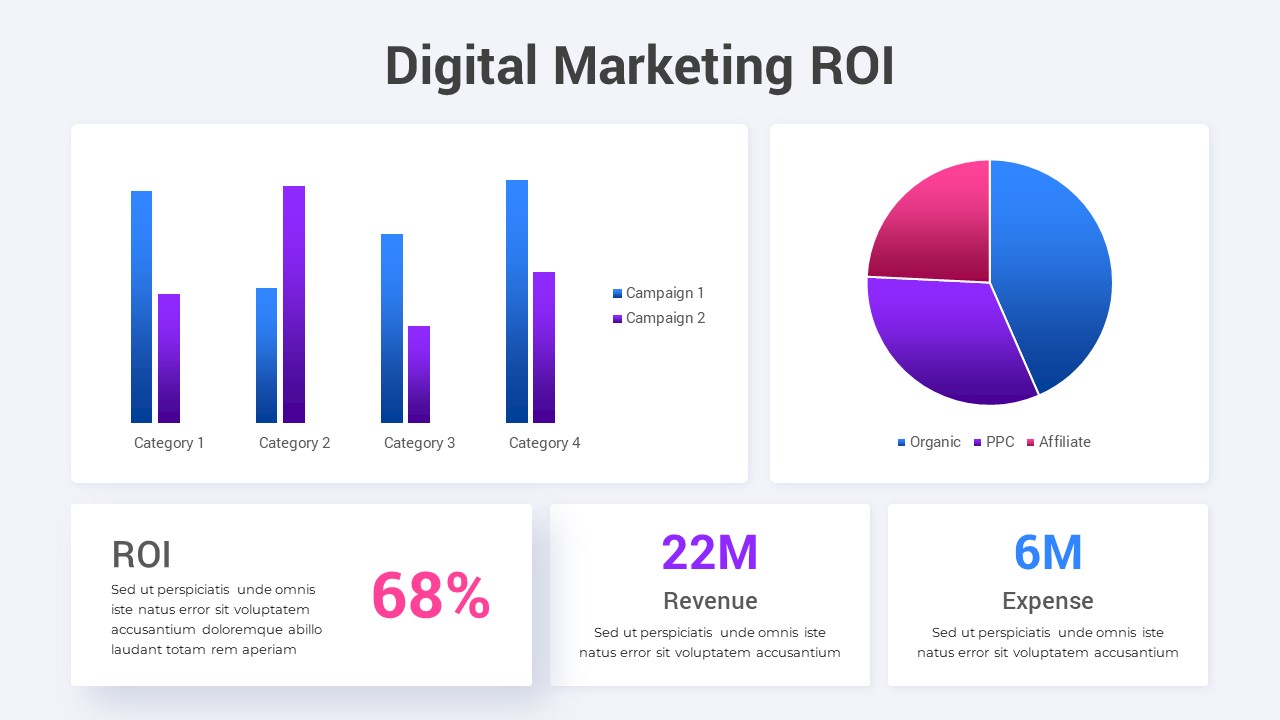
Digital Marketing ROI Analysis template for PowerPoint & Google Slides
Digital Marketing
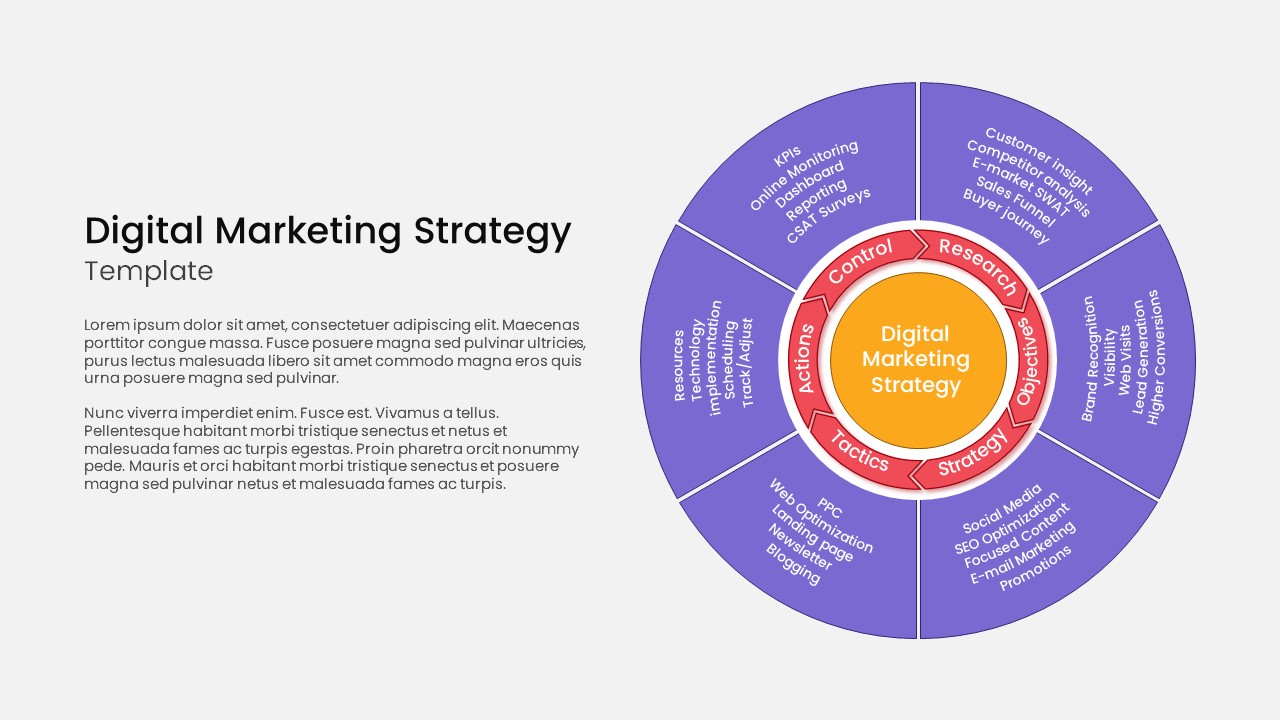
Circular Hub Digital Marketing Strategy Template for PowerPoint & Google Slides
Digital Marketing
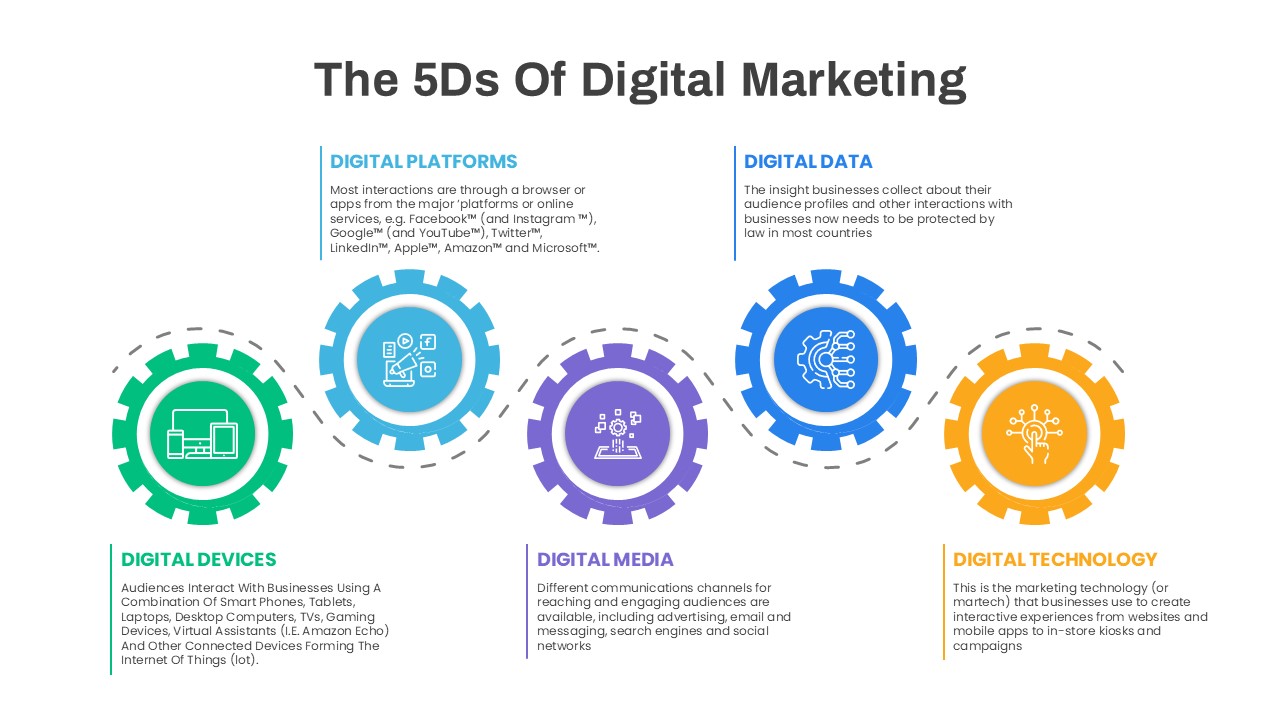
5D Digital Marketing Flow Diagram Template for PowerPoint & Google Slides
Digital Marketing
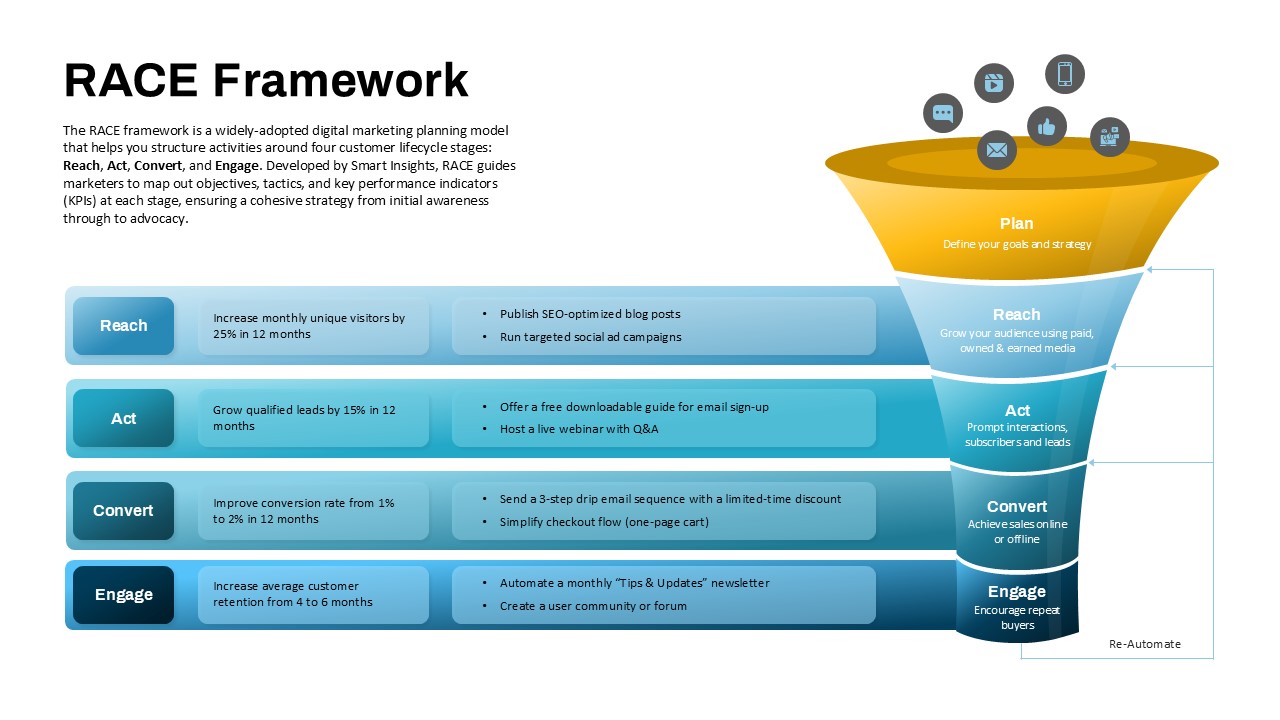
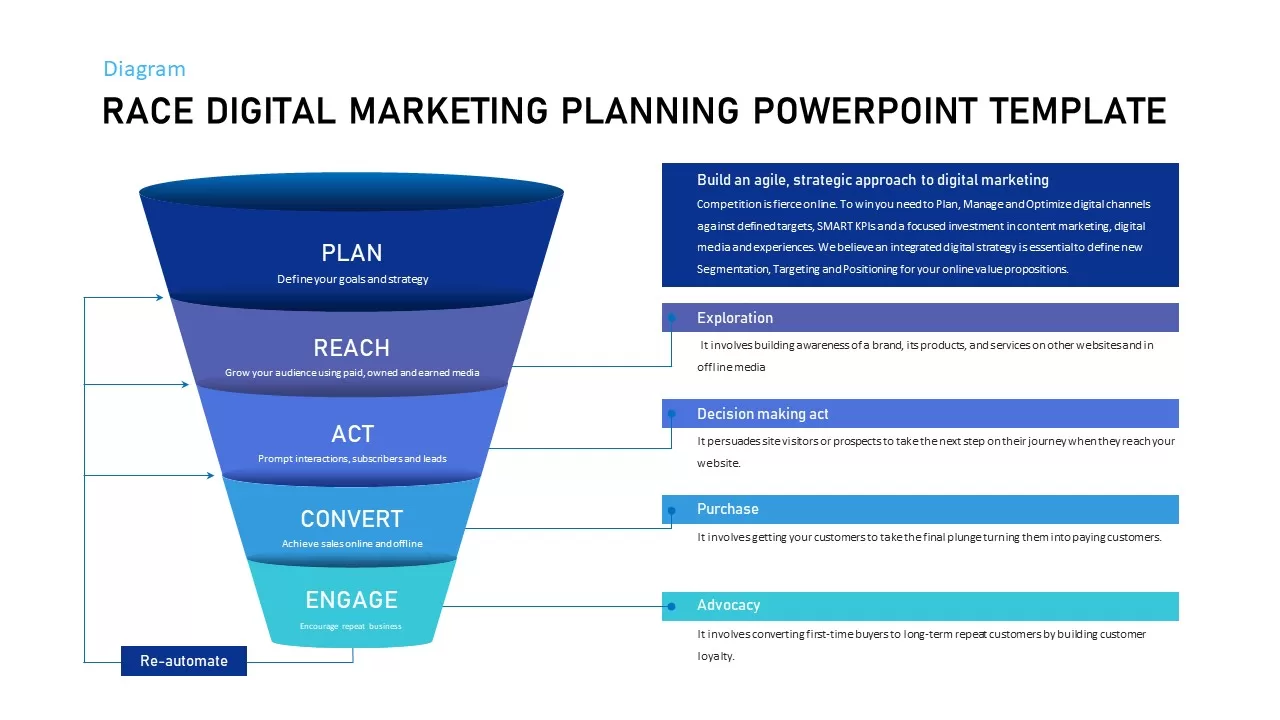
RACE Framework for Digital Marketing Strategy template for PowerPoint & Google Slides
Funnel
Digital Marketing Client Testimonials Template for PowerPoint & Google Slides
Accomplishment
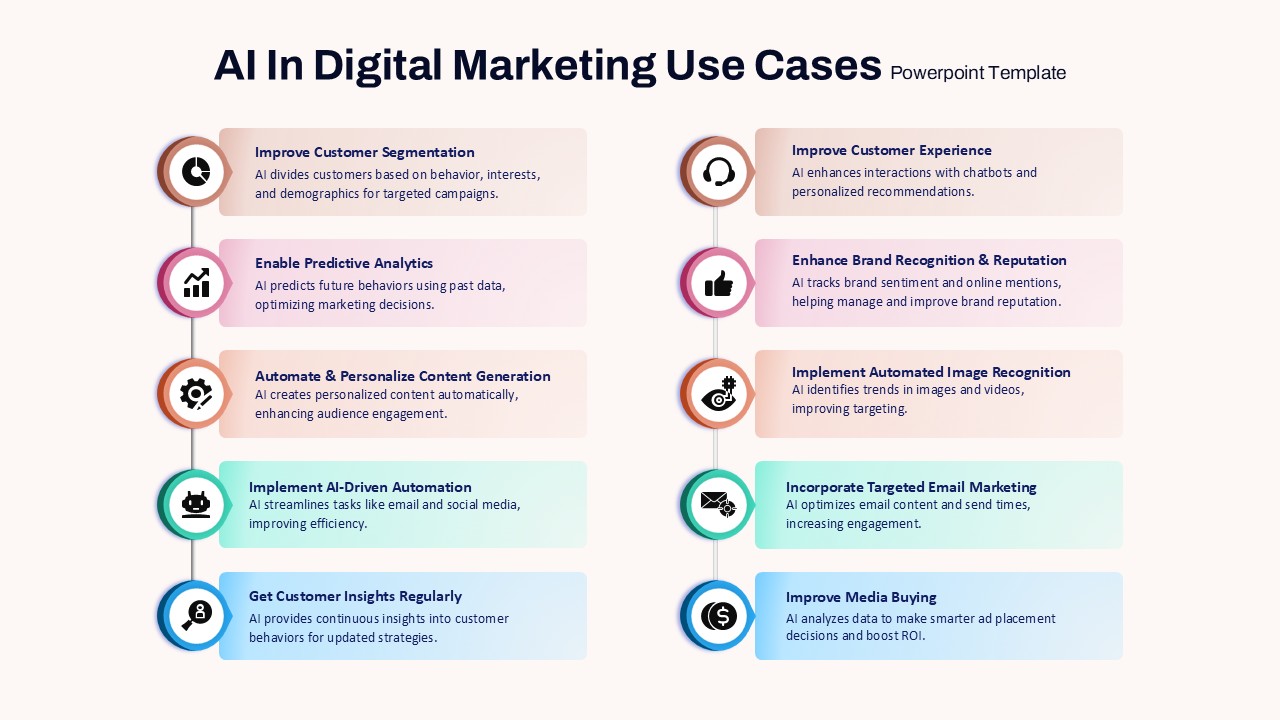
AI in Digital Marketing Use Cases Template for PowerPoint & Google Slides
AI
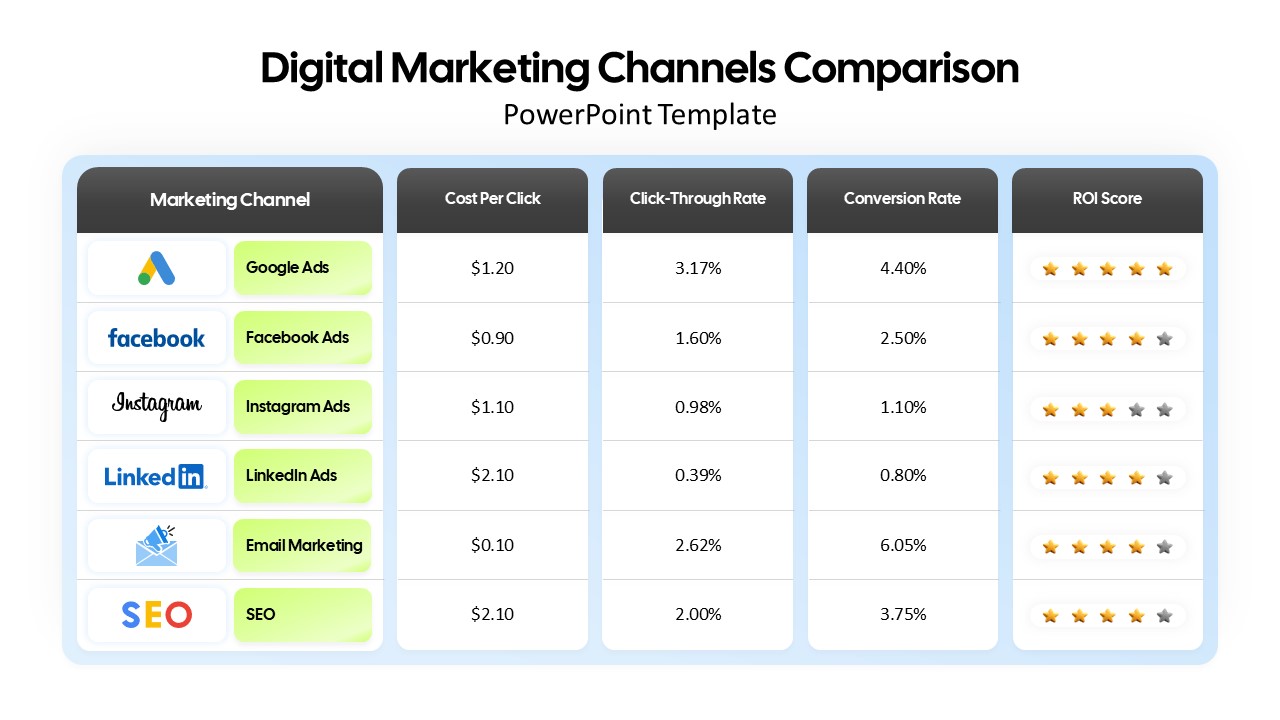
Digital Marketing Channels Comparison template for PowerPoint & Google Slides
Business
Digital Marketing Company Profile Template for PowerPoint & Google Slides
Digital Marketing
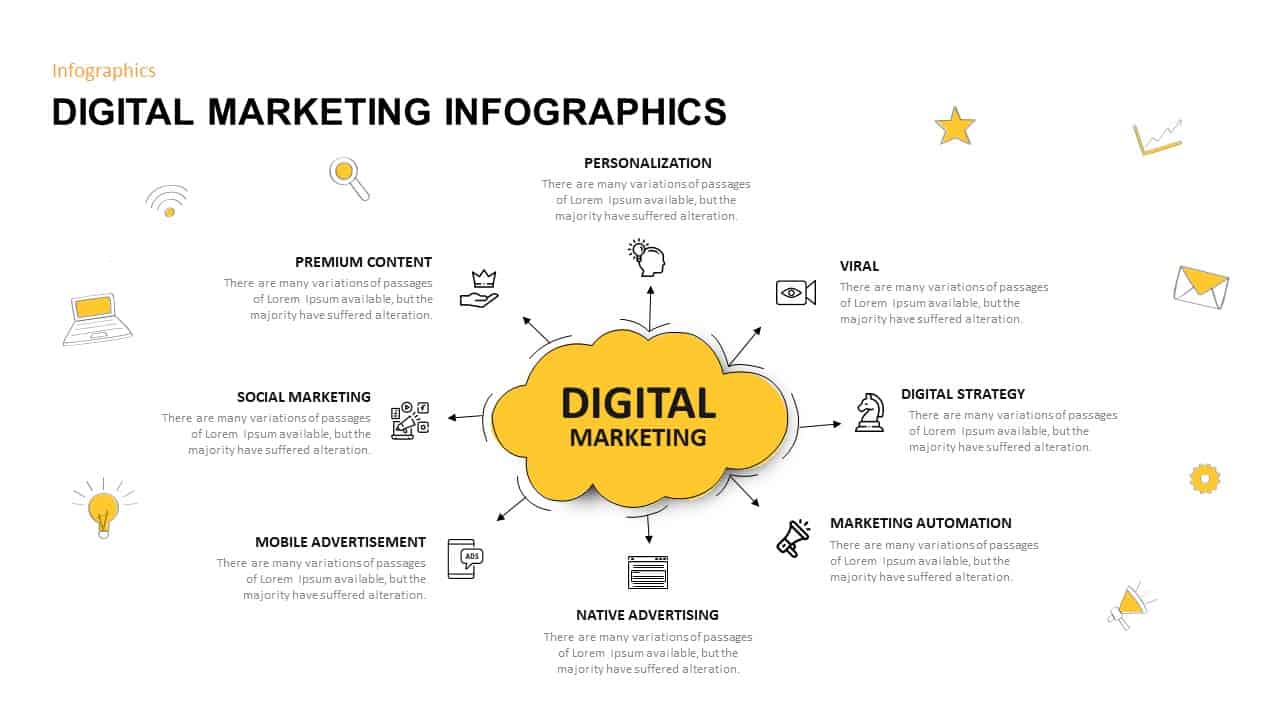
Digital Marketing Infographics Overview for PowerPoint & Google Slides
Digital Marketing
Race Digital Marketing Planning Templates for PowerPoint & Google Slides
Digital Marketing
Digital Marketing Presentation for PowerPoint & Google Slides
Digital Marketing
Free KPI Dashboard PowerPoint Template for PowerPoint & Google Slides
Charts
Free
E-commerce Analytics Dashboard Template for PowerPoint & Google Slides
Bar/Column

Dynamic Data Dashboard Infographic Template for PowerPoint & Google Slides
Bar/Column
Product Usage Analytics Dashboard Chart Template for PowerPoint & Google Slides
Bar/Column
Data Analytics Dashboard Design template for PowerPoint & Google Slides
Bar/Column

Efficiency KPI Dashboard Metaphor Template for PowerPoint & Google Slides
Infographics

Professional Team Efficiency Dashboard Template for PowerPoint & Google Slides
Business Report
Project Management Dashboard Template for PowerPoint & Google Slides
Project
Website Performance Dashboard template for PowerPoint & Google Slides
Charts
Sales Performance Dashboard template for PowerPoint & Google Slides
Business Report
Immigration Data Dashboard Template for PowerPoint & Google Slides
Bar/Column
Employee Skill Analysis Dashboard Template for PowerPoint & Google Slides
Employee Performance
Sales Growth Dashboard: KPI Gauge & Line Template for PowerPoint & Google Slides
Revenue
Social Media Performance Dashboard Template for PowerPoint & Google Slides
Bar/Column
Net Promoter Score Dashboard Template for PowerPoint & Google Slides
Customer Experience
Modern Project Status Report Dashboard Template for PowerPoint & Google Slides
Project Status
Performance KPI Dashboard Slide Template for PowerPoint & Google Slides
Business Report
Bull and Bear Stock Market Dashboard Template for PowerPoint & Google Slides
Infographics
KPI Dashboard template for PowerPoint & Google Slides
Business Report
KPI Dashboard Overview template for PowerPoint & Google Slides
Finance
KPI Dashboard Data Visualization Template for PowerPoint & Google Slides
Bar/Column
KPI Dashboard Data Overview Slide Template for PowerPoint & Google Slides
Bar/Column
Professional Nurse Infographic Dashboard Template for PowerPoint & Google Slides
Nursing
Interactive Benchmarking Gauge Dashboard Template for PowerPoint & Google Slides
Pie/Donut
Heat Map Risk Matrix Dashboard Template for PowerPoint & Google Slides
Comparison Chart
Project Status Dashboard Table Template for PowerPoint & Google Slides
Project Status
Project Status Dashboard with Metrics Template for PowerPoint & Google Slides
Project Status
Colorful Project Status Dashboard Template for PowerPoint & Google Slides
Project Status
Weekly Update Schedule Dashboard Template for PowerPoint & Google Slides
Agenda
Project Status Dashboard Template for PowerPoint & Google Slides
Project Status
Weekly Status Report Dashboard Template for PowerPoint & Google Slides
HR
Free Metro UI Dashboard Infographic Template for PowerPoint & Google Slides
Business Report
Free
Website Performance Monitoring Dashboard Template for PowerPoint & Google Slides
Business Report
One Pager Project Status Dashboard Template for PowerPoint & Google Slides
Project Status
One Pager Annual Report Dashboard Template for PowerPoint & Google Slides
Business Report
Social Media Analytics Dashboard Template for PowerPoint & Google Slides
Digital Marketing
Social Media Statistics 2023 Dashboard Template for PowerPoint & Google Slides
Comparison
Mastodon Metrics Infographic Dashboard Template for PowerPoint & Google Slides
Business Report
Soccer Match Stats Dashboard Slide Template for PowerPoint & Google Slides
Graphics
Employee Satisfaction Survey Dashboard Template for PowerPoint & Google Slides
Employee Performance
Customer Satisfaction KPI Dashboard Template for PowerPoint & Google Slides
Customer Experience
Weekly Project Status Dashboard Template for PowerPoint & Google Slides
Project Status
Freight Logistics Dashboard Infographic Template for PowerPoint & Google Slides
Comparison Chart
Free Quarterly Business Review Dashboard Template for PowerPoint & Google Slides
Business
Free
Cost Cutting Savings Dashboard Template for PowerPoint & Google Slides
Pie/Donut
Macroeconomic Indicators Dashboard Template for PowerPoint & Google Slides
PEST
Free Monthly Report PowerPoint Template for PowerPoint & Google Slides
Business Report
Free
Michigan County Map with KPI Dashboard Template for PowerPoint & Google Slides
World Maps
Quarterly Financial Summary Dashboard Template for PowerPoint & Google Slides
Business Report
Banking Financial Overview Dashboard Template for PowerPoint & Google Slides
Finance
Quarterly Business Review Dashboard Template for PowerPoint & Google Slides
Pitch Deck
Monthly Business Review Dashboard Deck Template for PowerPoint & Google Slides
Business Report
DevOps KPI Dashboard Performance Metrics Template for PowerPoint & Google Slides
Software Development
Purchasing KPI Metrics Dashboard Template for PowerPoint & Google Slides
Business Report
Procurement KPI Dashboard & Metrics Template for PowerPoint & Google Slides
Business Report
Project Progress Dashboard Pie Charts Template for PowerPoint & Google Slides
Project
Monthly Sales Performance Dashboard Template for PowerPoint & Google Slides
Charts
HR Report Dashboard Template for PowerPoint & Google Slides
Employee Performance
Budget Forecast Dashboard & Donut Charts Template for PowerPoint & Google Slides
Pie/Donut
Risk Level Gauge Comparison Dashboard Template for PowerPoint & Google Slides
Comparison
Inventory Management Dashboard Template for PowerPoint & Google Slides
Process
Employee Performance Metrics Dashboard Template for PowerPoint & Google Slides
Employee Performance
Turnover Analysis Dashboard Template for PowerPoint & Google Slides
Employee Performance
Project Tracking Dashboard Table Template for PowerPoint & Google Slides
Project Status
Action Items Management Dashboard Table Template for PowerPoint & Google Slides
Project Status
Electronic Health Records Dashboard template for PowerPoint & Google Slides
Health
Customer Interview Insights Dashboard Template for PowerPoint & Google Slides
Customer Experience
Account Overview Dashboard template for PowerPoint & Google Slides
Business
Project Status Dashboard Report Template for PowerPoint & Google Slides
Project Status
Project Status Update Dashboard Table Template for PowerPoint & Google Slides
Project Status
Cohort Analysis Retention Dashboard Template for PowerPoint & Google Slides
Comparison Chart
Project Status Dashboard Template for PowerPoint & Google Slides
Project Status
Dashboard Project Status Template for PowerPoint & Google Slides
Project Status
Project Status Template Dashboard with Gauge for PowerPoint & Google Slides
Project Status
Task Completion Rate Dashboard Template for PowerPoint & Google Slides
Business
Project Status Dashboard with RAG Legend Template for PowerPoint & Google Slides
Project Status
End of Year Review Dashboard Template for PowerPoint & Google Slides
Business Report
Construction Project Dashboard Template for PowerPoint & Google Slides
Project
Employee Headcount Dashboard Report Template for PowerPoint & Google Slides
Employee Performance
4DX Scoreboard KPI Gauge Dashboard Template for PowerPoint & Google Slides
Business Strategy