Data Flywheel Strategy template for PowerPoint & Google Slides


Description:
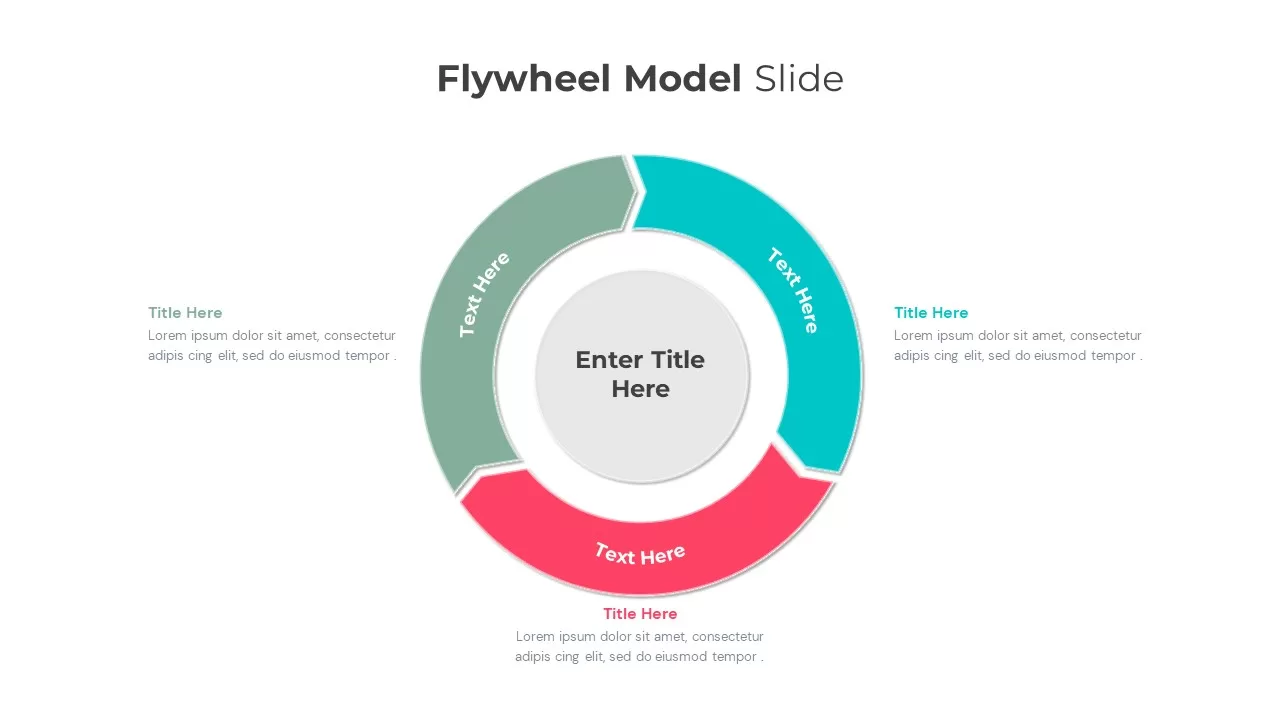
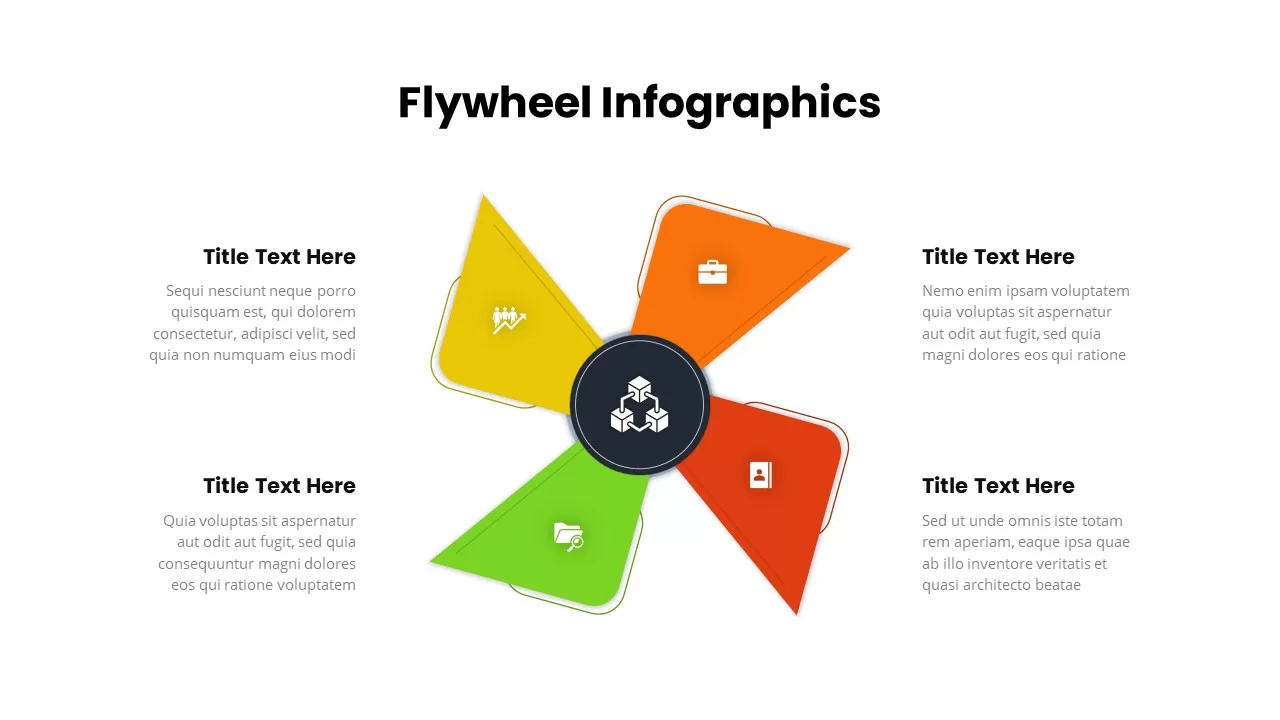
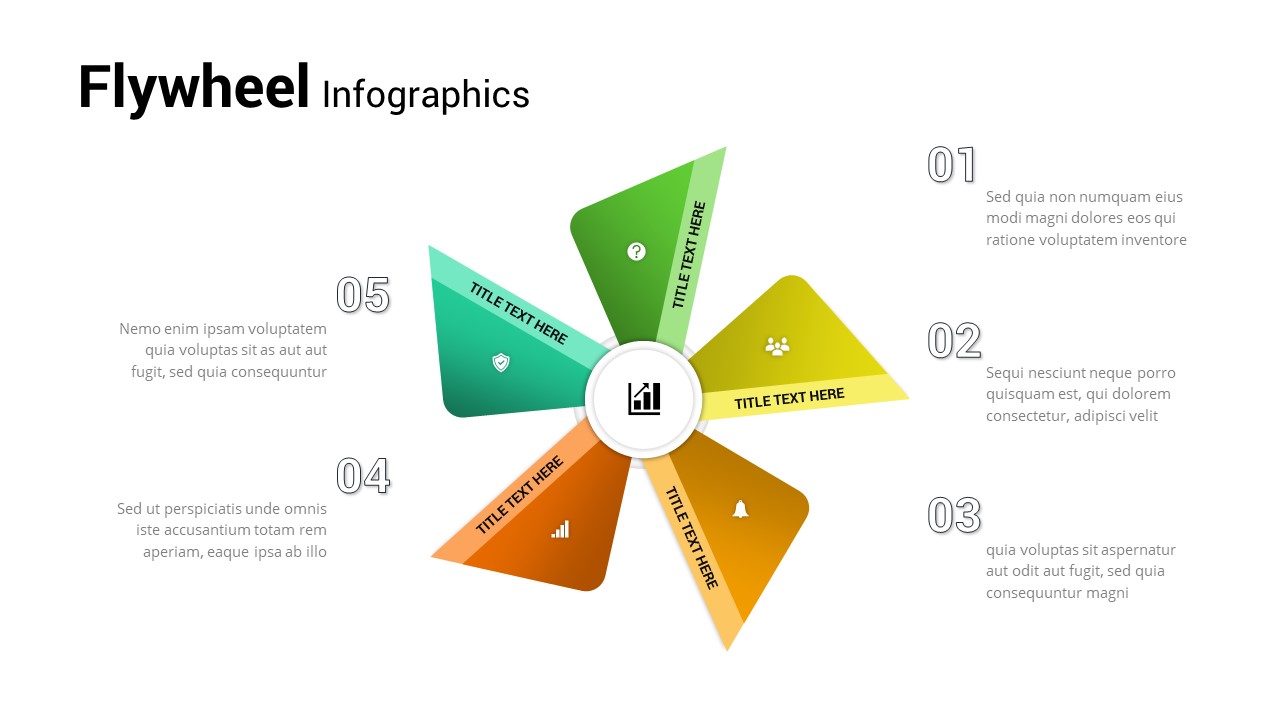
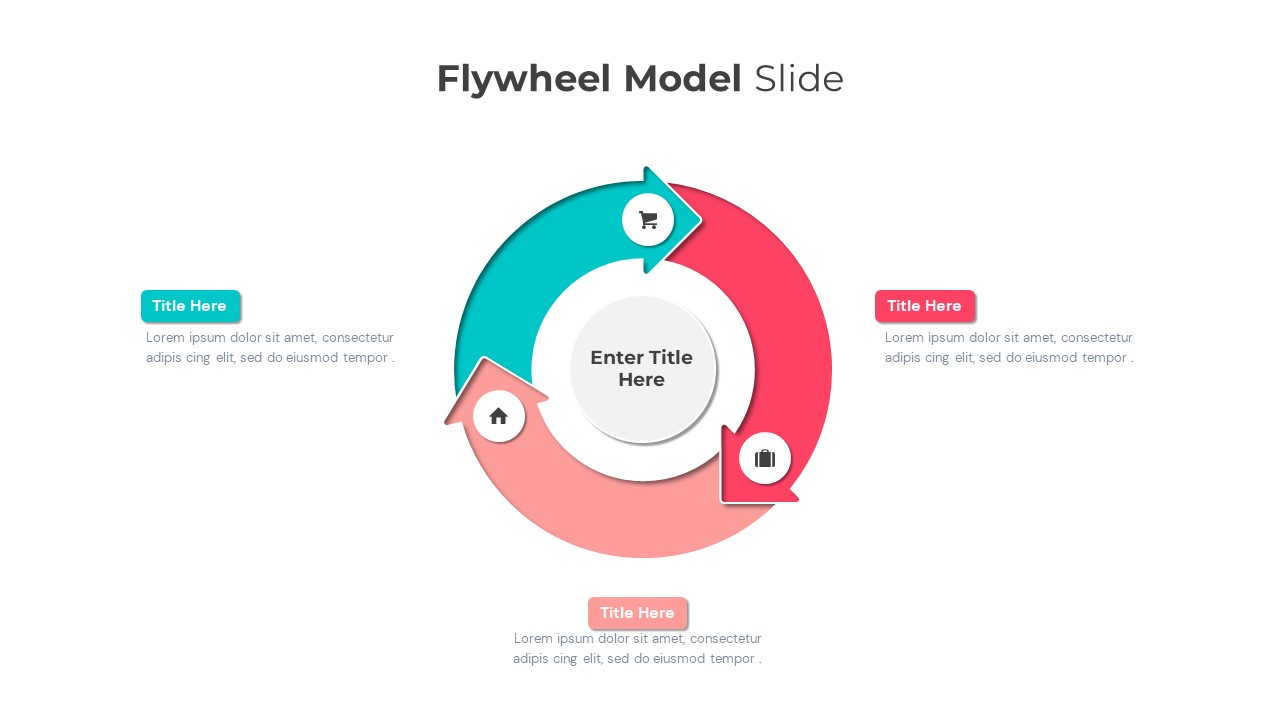
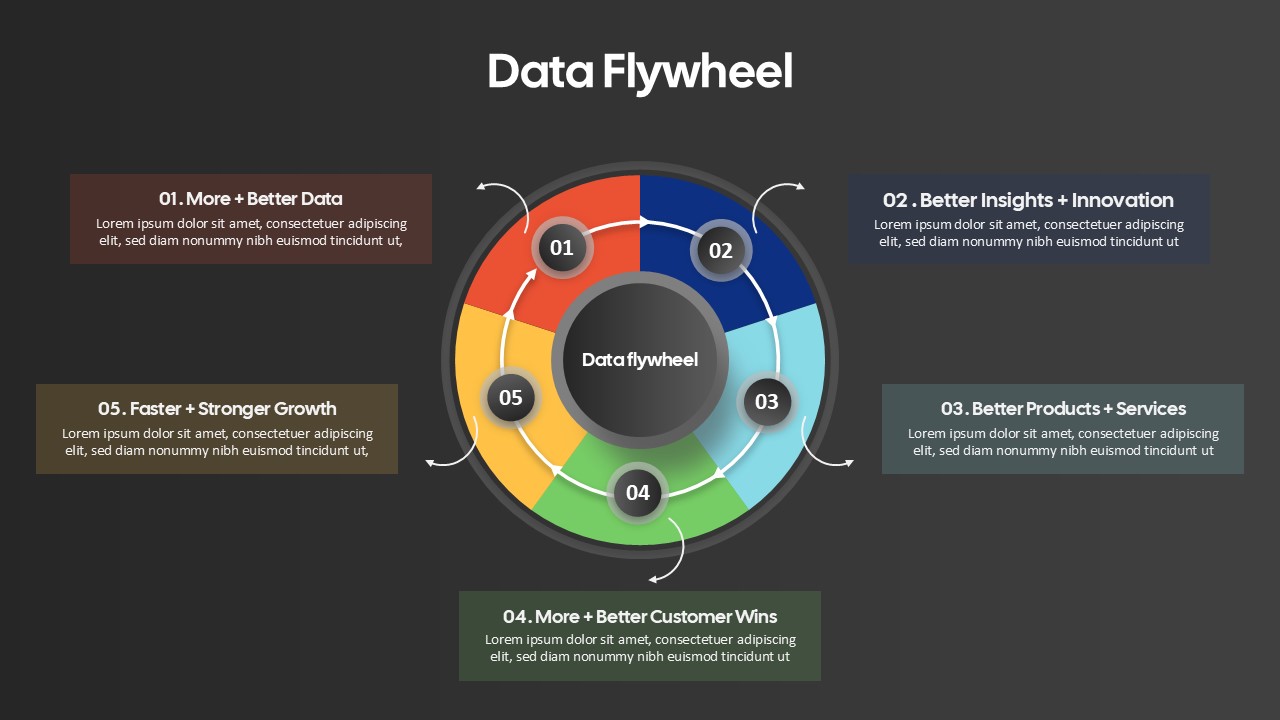
This dynamic and colorful slide illustrates the concept of a Data Flywheel, showcasing how continuous data improvement drives business success. The wheel is divided into five key sections, each representing an essential element of the flywheel: More + Better Data, Better Insights + Innovation, Better Products + Services, More + Better Customer Wins, and Faster + Stronger Growth. Each section is color-coded, making it easy to distinguish and understand how each component builds on the next in a continuous loop, driving the momentum for growth and innovation.
The sleek design, featuring vibrant colors, enables you to present complex strategies clearly and visually. The use of arrows emphasizes the cyclical nature of the data flywheel, reinforcing the idea of ongoing progress. This template is perfect for explaining data-driven strategies, business growth, product development, or marketing efforts, making it a great choice for strategy presentations, workshops, or client meetings.
Customizable and flexible, this template allows you to adapt the flywheel to your organization’s specific objectives, goals, and data initiatives, providing an effective tool for illustrating the power of data in driving business success.
Who is it for
This slide is ideal for data scientists, business analysts, marketers, and executives who want to present data-driven strategies for growth and innovation. It’s also suitable for consultants or teams working on digital transformation or data-centric business models.
Other Uses
Beyond data strategies, this flywheel model can be adapted for other processes that rely on continuous improvement, such as customer experience optimization, feedback loops, or business efficiency improvements. It can also be used for illustrating supply chain management, product development, and customer retention strategies.
Login to download this file

Item ID
SB05097
Related Templates

Flywheel Model Infographic Template for PowerPoint & Google Slides
Process
Four-Segment Flywheel Infographic Model Template for PowerPoint & Google Slides
Process
Five-Step Flywheel Infographic Diagram Template for PowerPoint & Google Slides
Process
Six-Step Colorful Flywheel Diagram Template for PowerPoint & Google Slides
Circular
Flywheel Infographics Pack Template for PowerPoint & Google Slides
Circular
Flywheel Infographics template for PowerPoint & Google Slides
Process
Flywheel Infographics template for PowerPoint & Google Slides
Business Strategy
Flywheel Infographics template for PowerPoint & Google Slides
Business Strategy
Flywheel Infographics template for PowerPoint & Google Slides
Business Strategy
Business Flywheel Lifecycle Model Template for PowerPoint & Google Slides
Circular
Funnel and Flywheel Thinking Comparison template for PowerPoint & Google Slides
Infographics
Flywheel Growth Cycle Diagram Template for PowerPoint & Google Slides
Circular
Data Science PowerPoint Presentation Template for PowerPoint & Google Slides
Pitch Deck
Data Center PowerPoint Template for PowerPoint & Google Slides
Information Technology

Creative data chart analytics template for PowerPoint & Google Slides
Charts
Mobile Data Analysis Chart template for PowerPoint & Google Slides
Charts
World Map Data template for PowerPoint & Google Slides
World Maps
Circle Chart Data template for PowerPoint & Google Slides
Pie/Donut
Creative Data Analysis Bar Chart template for PowerPoint & Google Slides
Bar/Column

Smartphone Data User template for PowerPoint & Google Slides
Charts
Interactive US Population Data Map Slide Template for PowerPoint & Google Slides
World Maps
3D Bar Chart Data Infographics Template for PowerPoint & Google Slides
Bar/Column
3D Stacked Infographic Layers Data Template for PowerPoint & Google Slides
Pyramid
Circle Graph Data Visualization Template for PowerPoint & Google Slides
Circular
Pencil Bar Chart Data Analysis Template for PowerPoint & Google Slides
Bar/Column
3D Cone Chart Data Visualization template for PowerPoint & Google Slides
Bar/Column
Creative Lab Beakers Data Infographic template for PowerPoint & Google Slides
Infographics

Dynamic Data Dashboard Infographic Template for PowerPoint & Google Slides
Bar/Column
Data Analytics Dashboard Design template for PowerPoint & Google Slides
Bar/Column
Gear Pie Diagram Data Visualization Template for PowerPoint & Google Slides
Pie/Donut
Data-Driven Marketing Cycle Diagram Template for PowerPoint & Google Slides
Customer Journey
Tornado Chart Data Comparison Slide Template for PowerPoint & Google Slides
Bar/Column
Bottle Data Percentage Infographic Template for PowerPoint & Google Slides
Infographics
Immigration Data Dashboard Template for PowerPoint & Google Slides
Bar/Column
Leaf Infographic Data Visualization Template for PowerPoint & Google Slides
Infographics
Mobile Infographics Data Visualization Template for PowerPoint & Google Slides
Infographics
Data Management and Analytics Diagram Template for PowerPoint & Google Slides
Circular
Data Migration Life Cycle Curved Diagram Template for PowerPoint & Google Slides
Process
Medical Infographics Data Visualization Template for PowerPoint & Google Slides
Health
DIKW Data to Wisdom Pyramid Model Template for PowerPoint & Google Slides
Pyramid
Data-driven GDP Growth Infographic Pack Template for PowerPoint & Google Slides
Infographics
KPI Dashboard Data Visualization Template for PowerPoint & Google Slides
Bar/Column
KPI Dashboard Data Overview Slide Template for PowerPoint & Google Slides
Bar/Column
North America Data Map Callouts Template for PowerPoint & Google Slides
World Maps
Professional Heatmap Data Visualization Template for PowerPoint & Google Slides
Infographics
Donut Chart Data Breakdown template for PowerPoint & Google Slides
Pie/Donut

Modern Big Data Infographic Deck Template for PowerPoint & Google Slides
Decks
Waffle Chart Data Visualization Template for PowerPoint & Google Slides
Comparison Chart
Layered Data Governance Maturity Model Template for PowerPoint & Google Slides
Process
Free Stacked Column Chart Data Visualization Template for PowerPoint & Google Slides
Bar/Column
Free
Simple Bar Chart Data Visualization Template for PowerPoint & Google Slides
Bar/Column
XY Bubble Chart Data Visualization Template for PowerPoint & Google Slides
Comparison Chart
Simple Area Chart Data Trends Analysis Template for PowerPoint & Google Slides
Comparison Chart
Data Over Time Line Chart template for PowerPoint & Google Slides
Charts
Waterfall Chart Data Visualization Template for PowerPoint & Google Slides
Comparison Chart
Multipurpose Spline Chart Data Trend Template for PowerPoint & Google Slides
Bar/Column
Editable Africa Map Infographic Data Template for PowerPoint & Google Slides
World Maps
UK Counties Map Data Visualization Template for PowerPoint & Google Slides
World Maps
Advanced Data Flow Diagram Pack Template for PowerPoint & Google Slides
Flow Charts
Interactive Jump Line Data Chart Template for PowerPoint & Google Slides
Comparison Chart
Segmented Scatter Chart Data Visualization Template for PowerPoint & Google Slides
Business Strategy
Free Big Data Network Visualization Template for PowerPoint & Google Slides
Circular
Free
Syria Regional Data Map Infographic Template for PowerPoint & Google Slides
World Maps
Data Analysis Bar Chart with Insights Template for PowerPoint & Google Slides
Bar/Column
Free
Data Lake Hub-and-Spoke Diagram Template for PowerPoint & Google Slides
Cloud Computing
ETL Data Pipeline Workflow Diagram Template for PowerPoint & Google Slides
Process
Data Privacy template for PowerPoint & Google Slides
Information Technology
Data Protection Strategies template for PowerPoint & Google Slides
Information Technology
Comprehensive Data & AI Capability Model Template for PowerPoint & Google Slides
AI
Data Privacy and Compliance in ML template for PowerPoint & Google Slides
Technology
Data-Driven AI in Insurance Infographic Template for PowerPoint & Google Slides
Circular
AI and Data Ecosystem Map Template for PowerPoint & Google Slides
AI
Data Studio Insights template for PowerPoint & Google Slides
Business Report
Data Protection & Encryption in the Cloud Overview template for PowerPoint & Google Slides
Cloud Computing
Customer Data Platform Workflow Diagram Template for PowerPoint & Google Slides
Information Technology
Data-Driven Marketing Lifecycle Diagram Template for PowerPoint & Google Slides
Process
Data-Driven Decision Making overview template for PowerPoint & Google Slides
Business
First Party Data Overview Template for PowerPoint & Google Slides
Business
Data Governance Roles Pyramid Diagram Template for PowerPoint & Google Slides
Pyramid
Business Data Table Template for PowerPoint & Google Slides
Table
Colorful Business Data Comparison Table Template for PowerPoint & Google Slides
Table
Six Column Data Table Template for PowerPoint & Google Slides
Table
Data Gap Analysis Template for PowerPoint & Google Slides
Business
Mobile User Data Analysis Infographic for PowerPoint & Google Slides
Process
Bar Data Chart Slide for PowerPoint & Google Slides
Bar/Column
Weekly Data Chart Slide for PowerPoint & Google Slides
Comparison Chart

3D Column Chart with Data Table for PowerPoint & Google Slides
Bar/Column

Cone Data Chart for PowerPoint & Google Slides
Charts
4 Business Data Infographics Diagram for PowerPoint & Google Slides
Process
Data-Driven Line Chart Diagram Template for PowerPoint
Comparison Chart
Clustered Column Chart Data Analysis Template for PowerPoint
Bar/Column
Free Data Analytics Dashboard Template for PowerPoint
Charts
Free
SQ3R Study Strategy Infographic Slides Template for PowerPoint & Google Slides
Business Strategy
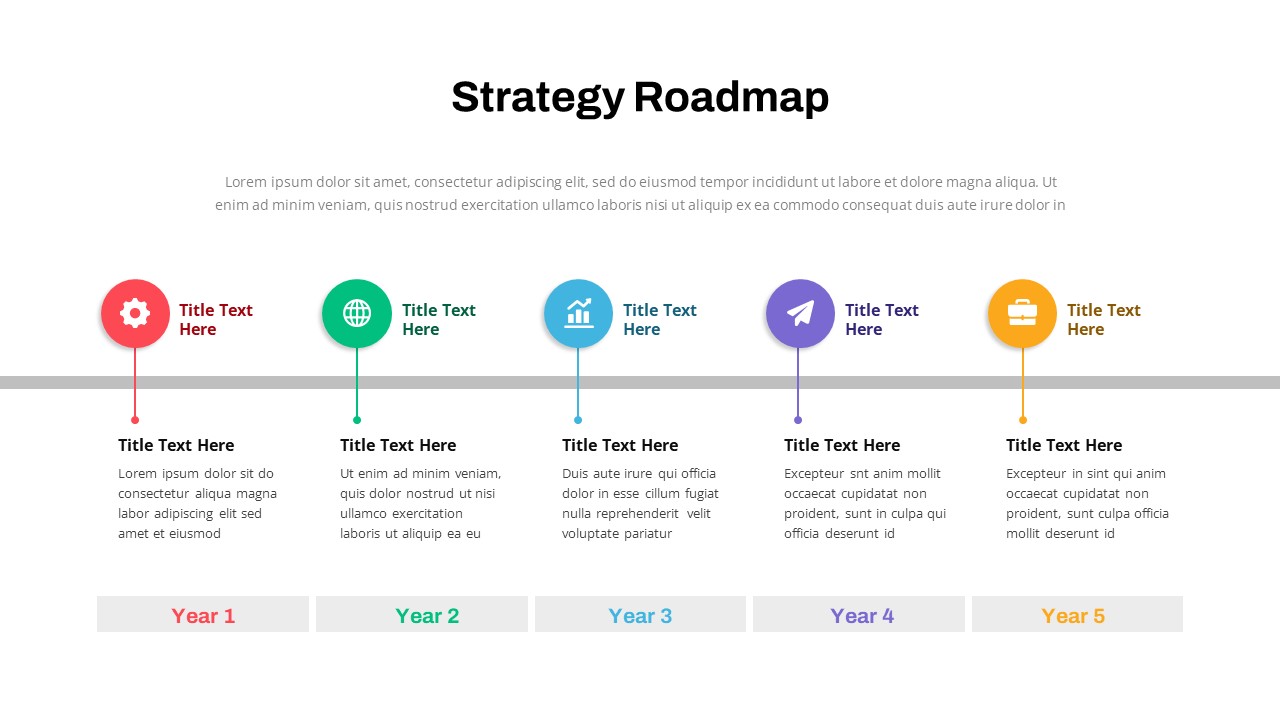
Strategy Roadmap Timeline Slides Template for PowerPoint & Google Slides
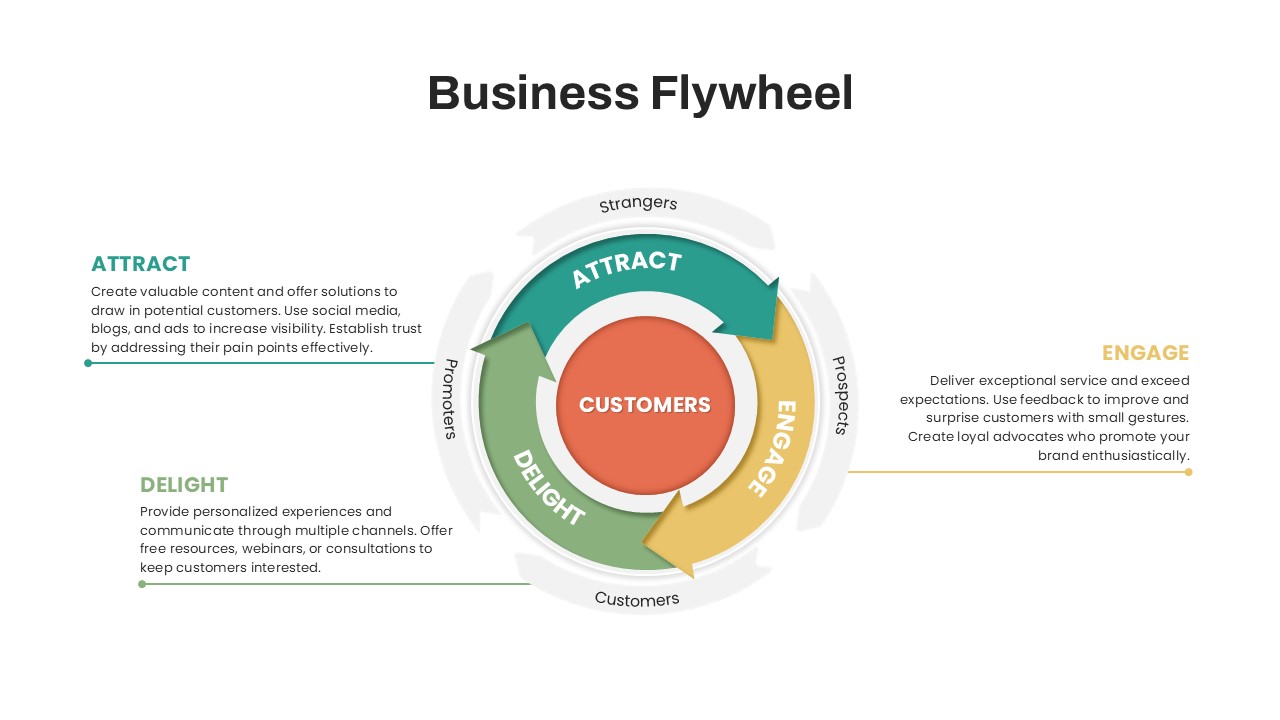
Roadmap

Innovation Ambition Matrix & Funnel Strategy Slides for PowerPoint & Google Slides
Process
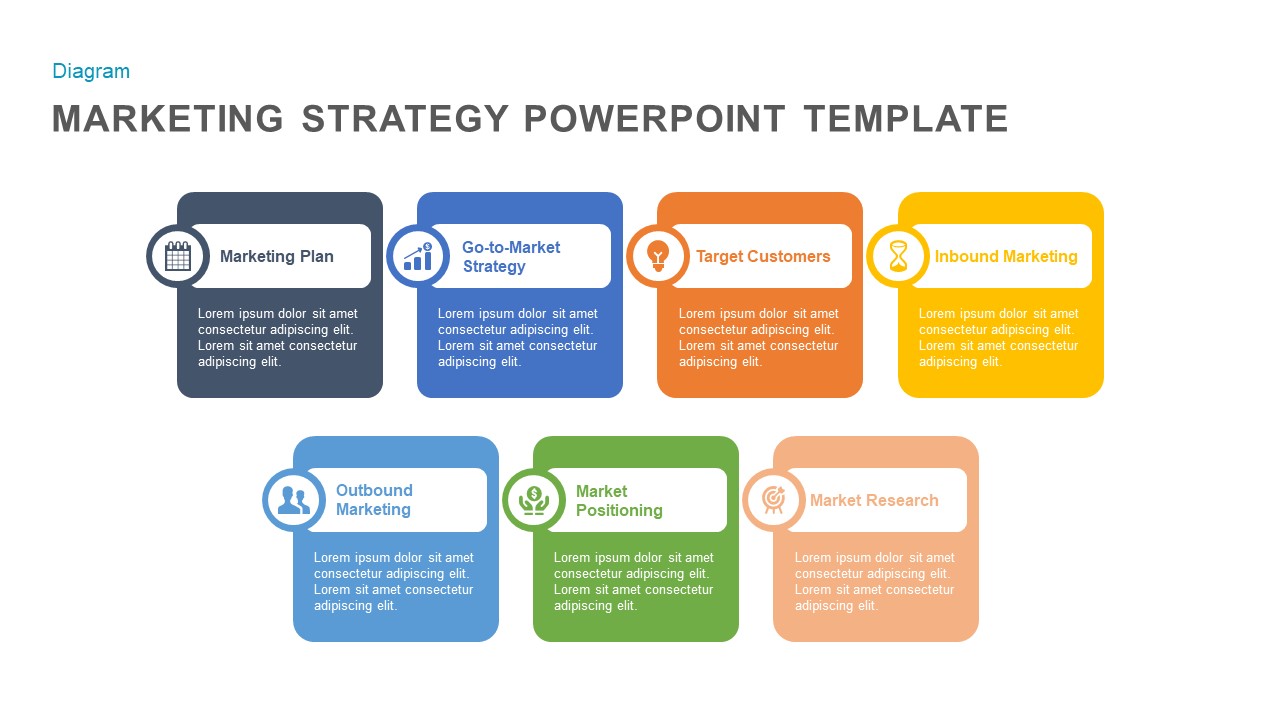
Marketing Strategy PowerPoint template for PowerPoint & Google Slides
Marketing
Go-to-Market Strategy PowerPoint Template for PowerPoint & Google Slides
Marketing
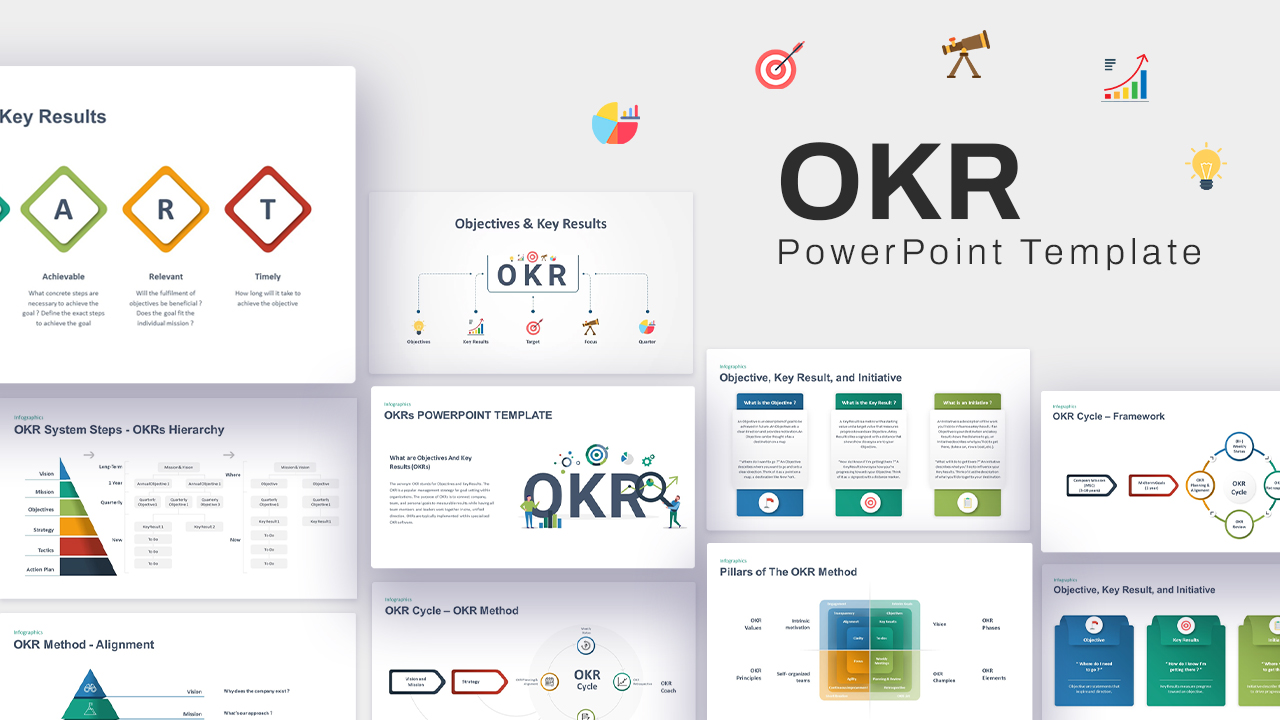
Interactive OKR Strategy Diagram Template for PowerPoint & Google Slides
Process
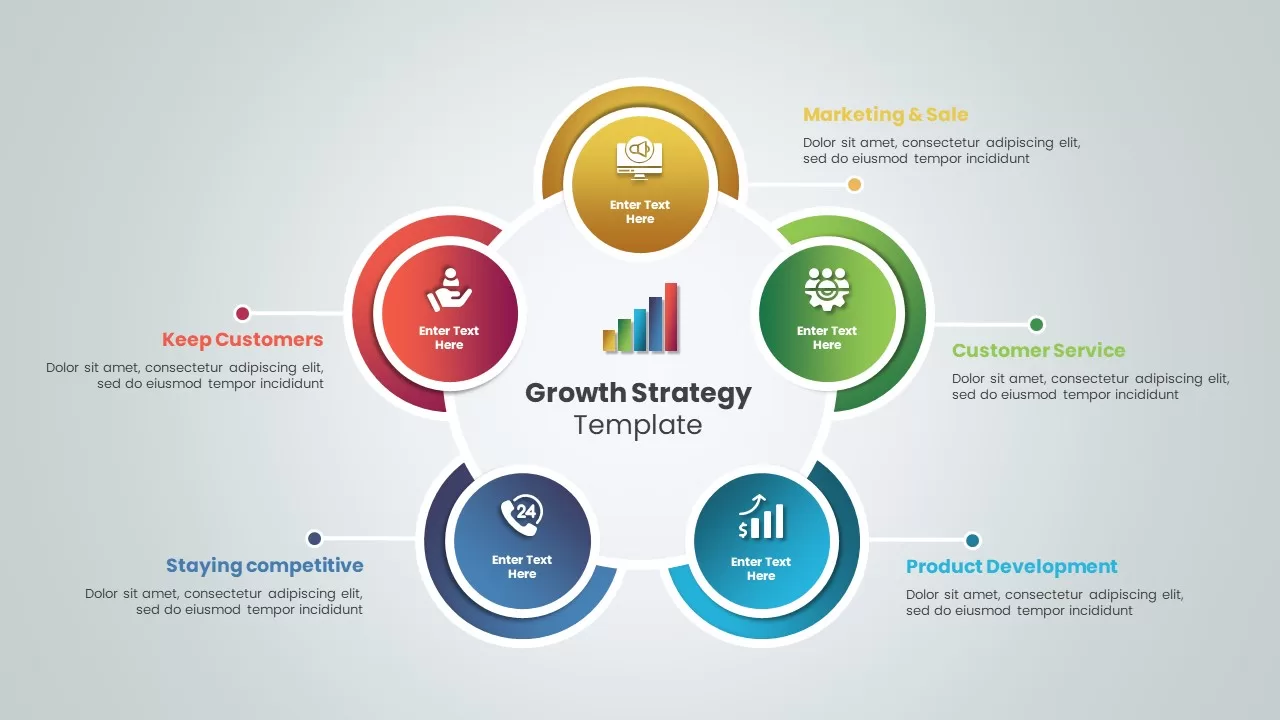
Growth Strategy Circular Diagram Template for PowerPoint & Google Slides
Circular
Self Motivation Strategy Infographic Template for PowerPoint & Google Slides
Leadership