Data-Driven Sales Strategy Diagram Template for PowerPoint & Google Slides

Description
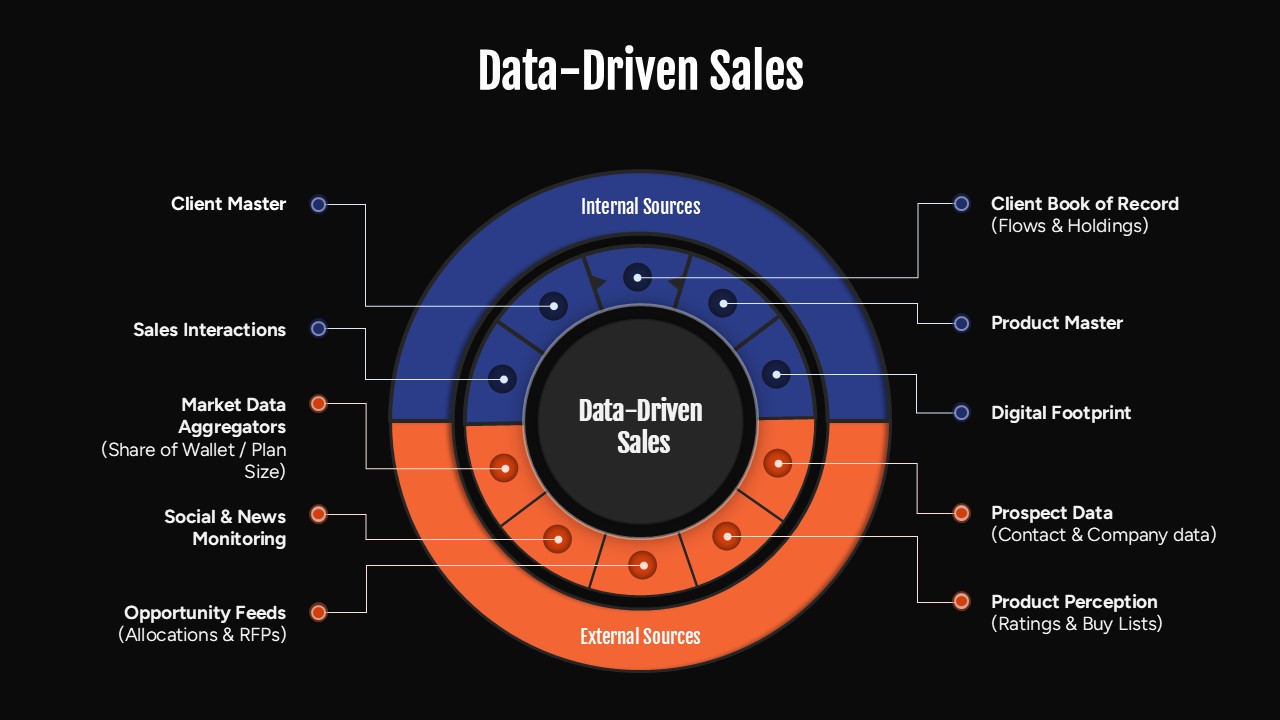
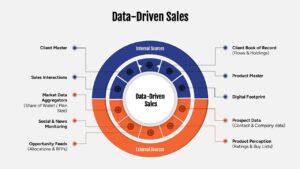
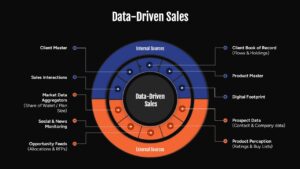
Visualize your sales intelligence ecosystem with this structured Data-Driven Sales diagram slide. Designed with a circular framework, the layout clearly distinguishes Internal Sources and External Sources that power modern revenue strategies. The inner hub highlights the central concept of data-driven decision-making, while segmented rings organize inputs such as Client Master, Sales Interactions, Product Master, Digital Footprint, Prospect Data, Market Data Aggregators, and Opportunity Feeds.
The dual-color design effectively separates internal and external data streams, helping audiences understand how diverse information sources integrate into a unified sales strategy. Clean connectors and labeled nodes ensure clarity, making it easy to explain complex data architectures during executive briefings or strategic planning sessions. Fully editable shapes, icons, and text placeholders allow you to tailor data categories, rename sources, or adapt the diagram to your organization’s CRM, analytics, and business intelligence systems. Optimized for PowerPoint and Google Slides, this slide maintains visual consistency and high-resolution clarity across platforms.
Who is it for
This slide is ideal for sales leaders, revenue operations teams, CRM managers, data analysts, and business strategists presenting modern sales enablement frameworks. Consultants and digital transformation teams can also use it to illustrate data integration models.
Other Uses
Beyond sales strategy, repurpose this diagram for marketing data ecosystems, customer journey analytics, product intelligence mapping, or enterprise data architecture overviews. It also supports investor presentations and digital transformation roadmaps.
Login to download this file

Item ID
SB05719Designed By
Anand
Related Templates

Data-Driven Marketing Cycle Diagram Template for PowerPoint & Google Slides
Customer Journey

Data-Driven Marketing Lifecycle Diagram Template for PowerPoint & Google Slides
Process
Data-Driven Line Chart Diagram Template for PowerPoint
Comparison Chart
Data-driven GDP Growth Infographic Pack Template for PowerPoint & Google Slides
Infographics
Data-Driven AI in Insurance Infographic Template for PowerPoint & Google Slides
Circular
Data-Driven Decision Making overview template for PowerPoint & Google Slides
Business
Excel-Driven Gradient Timeline Chart Template for PowerPoint & Google Slides
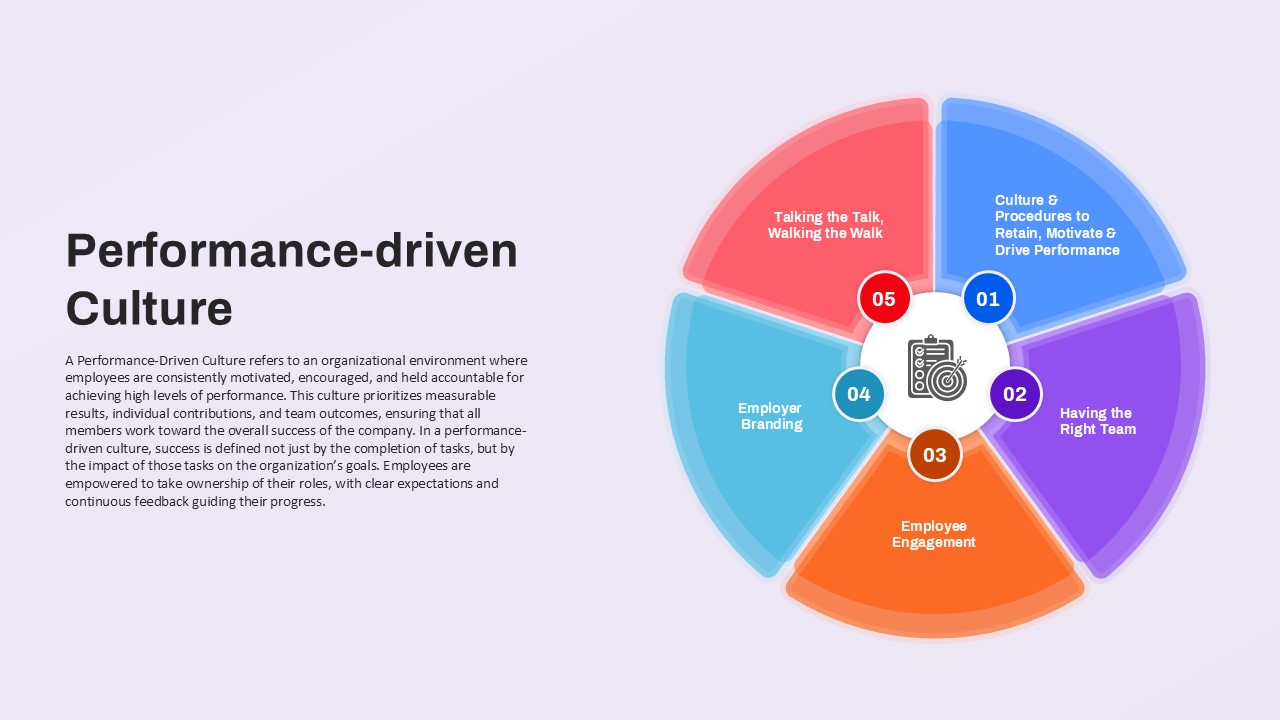
Performance-driven Culture framework template for PowerPoint & Google Slides
Leadership
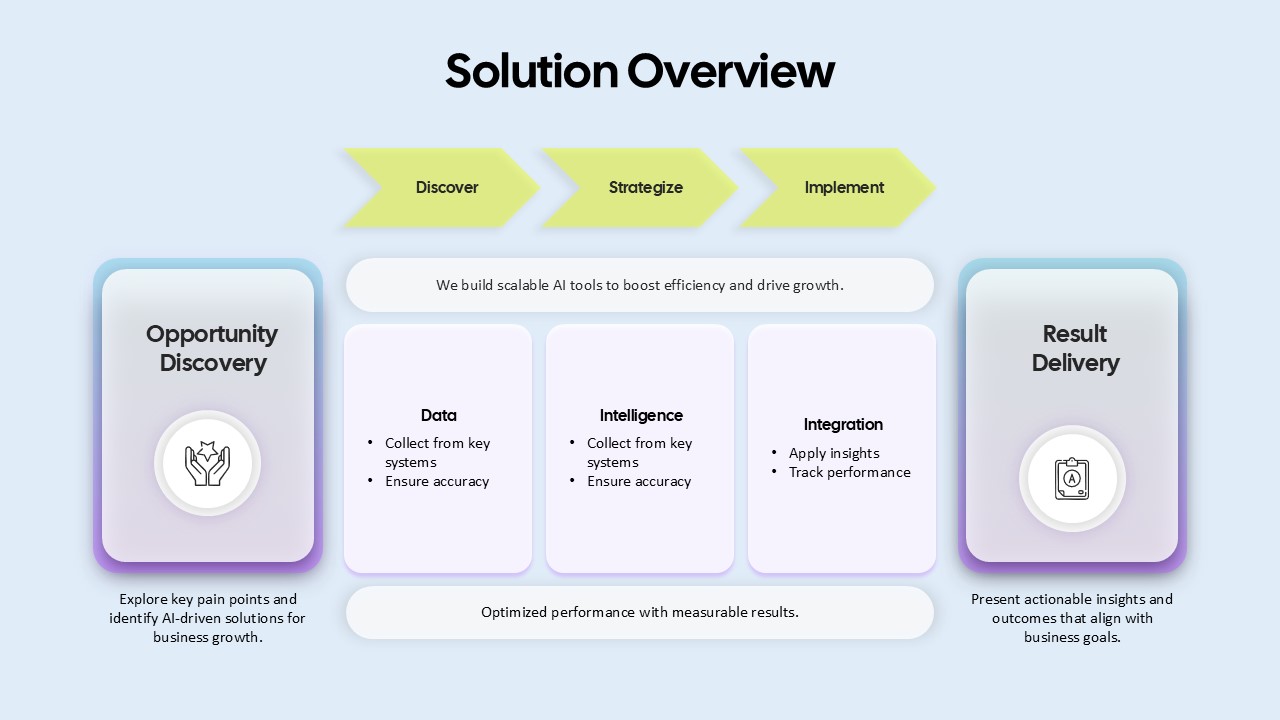
AI-Driven Solution Overview for PowerPoint & Google Slides
AI
Data Flywheel Strategy template for PowerPoint & Google Slides
Business
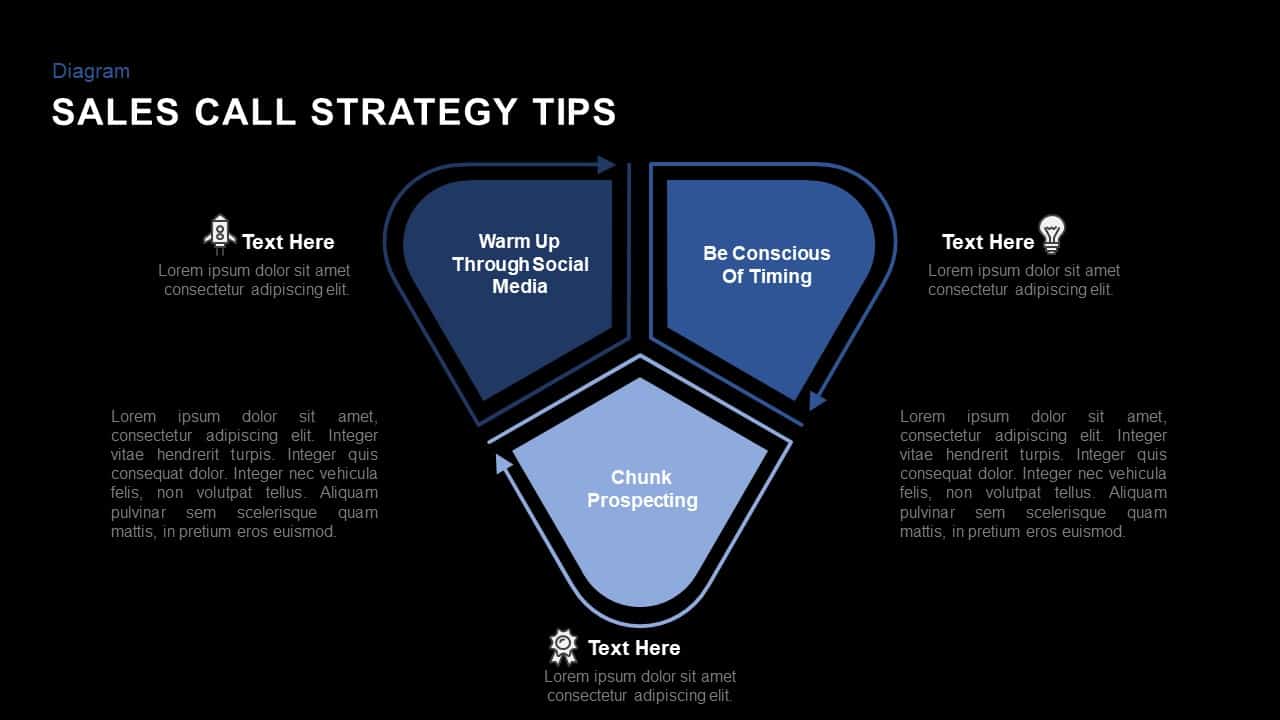
Sales Call Strategy Tips template for PowerPoint & Google Slides
Business Strategy
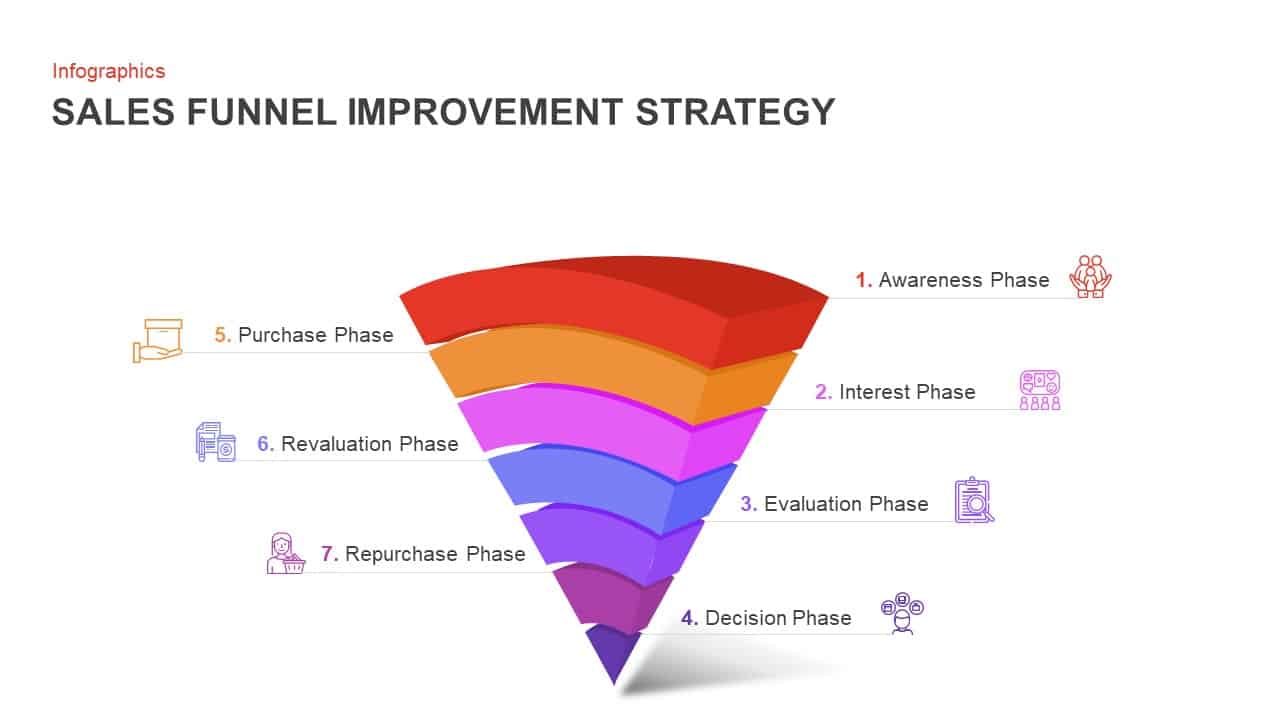
7-Step Sales Funnel Improvement Strategy Template for PowerPoint & Google Slides
Infographics
Sales Plan & Strategy Overview template for PowerPoint & Google Slides
Business Strategy
Semi-Circular Sales Strategy Roadmap Template for PowerPoint & Google Slides
Circular
Gear Pie Diagram Data Visualization Template for PowerPoint & Google Slides
Pie/Donut
Data Management and Analytics Diagram Template for PowerPoint & Google Slides
Circular
Data Migration Life Cycle Curved Diagram Template for PowerPoint & Google Slides
Process
Advanced Data Flow Diagram Pack Template for PowerPoint & Google Slides
Flow Charts
Data Lake Hub-and-Spoke Diagram Template for PowerPoint & Google Slides
Cloud Computing
ETL Data Pipeline Workflow Diagram Template for PowerPoint & Google Slides
Process
Customer Data Platform Workflow Diagram Template for PowerPoint & Google Slides
Information Technology
Data Governance Roles Pyramid Diagram Template for PowerPoint & Google Slides
Pyramid
4 Business Data Infographics Diagram for PowerPoint & Google Slides
Process
Data Science PowerPoint Presentation Template for PowerPoint & Google Slides
Pitch Deck
Data Center PowerPoint Template for PowerPoint & Google Slides
Information Technology
Creative data chart analytics template for PowerPoint & Google Slides
Charts
Mobile Data Analysis Chart template for PowerPoint & Google Slides
Charts
World Map Data template for PowerPoint & Google Slides
World Maps
Circle Chart Data template for PowerPoint & Google Slides
Pie/Donut
Creative Data Analysis Bar Chart template for PowerPoint & Google Slides
Bar/Column

Smartphone Data User template for PowerPoint & Google Slides
Charts
Interactive US Population Data Map Slide Template for PowerPoint & Google Slides
World Maps
3D Bar Chart Data Infographics Template for PowerPoint & Google Slides
Bar/Column
3D Stacked Infographic Layers Data Template for PowerPoint & Google Slides
Pyramid
Circle Graph Data Visualization Template for PowerPoint & Google Slides
Circular
Pencil Bar Chart Data Analysis Template for PowerPoint & Google Slides
Bar/Column
3D Cone Chart Data Visualization template for PowerPoint & Google Slides
Bar/Column
Creative Lab Beakers Data Infographic template for PowerPoint & Google Slides
Infographics

Dynamic Data Dashboard Infographic Template for PowerPoint & Google Slides
Bar/Column
Data Analytics Dashboard Design template for PowerPoint & Google Slides
Bar/Column
Tornado Chart Data Comparison Slide Template for PowerPoint & Google Slides
Bar/Column
Bottle Data Percentage Infographic Template for PowerPoint & Google Slides
Infographics
Immigration Data Dashboard Template for PowerPoint & Google Slides
Bar/Column
Leaf Infographic Data Visualization Template for PowerPoint & Google Slides
Infographics
Mobile Infographics Data Visualization Template for PowerPoint & Google Slides
Infographics
Medical Infographics Data Visualization Template for PowerPoint & Google Slides
Health
DIKW Data to Wisdom Pyramid Model Template for PowerPoint & Google Slides
Pyramid
KPI Dashboard Data Visualization Template for PowerPoint & Google Slides
Bar/Column
KPI Dashboard Data Overview Slide Template for PowerPoint & Google Slides
Bar/Column
North America Data Map Callouts Template for PowerPoint & Google Slides
World Maps
Professional Heatmap Data Visualization Template for PowerPoint & Google Slides
Infographics
Donut Chart Data Breakdown template for PowerPoint & Google Slides
Pie/Donut

Modern Big Data Infographic Deck Template for PowerPoint & Google Slides
Decks
Waffle Chart Data Visualization Template for PowerPoint & Google Slides
Comparison Chart
Layered Data Governance Maturity Model Template for PowerPoint & Google Slides
Process
Free Stacked Column Chart Data Visualization Template for PowerPoint & Google Slides
Bar/Column
Free
Simple Bar Chart Data Visualization Template for PowerPoint & Google Slides
Bar/Column
XY Bubble Chart Data Visualization Template for PowerPoint & Google Slides
Comparison Chart
Simple Area Chart Data Trends Analysis Template for PowerPoint & Google Slides
Comparison Chart
Data Over Time Line Chart template for PowerPoint & Google Slides
Charts
Waterfall Chart Data Visualization Template for PowerPoint & Google Slides
Comparison Chart
Multipurpose Spline Chart Data Trend Template for PowerPoint & Google Slides
Bar/Column
Editable Africa Map Infographic Data Template for PowerPoint & Google Slides
World Maps
UK Counties Map Data Visualization Template for PowerPoint & Google Slides
World Maps
Interactive Jump Line Data Chart Template for PowerPoint & Google Slides
Comparison Chart
Segmented Scatter Chart Data Visualization Template for PowerPoint & Google Slides
Business Strategy
Free Big Data Network Visualization Template for PowerPoint & Google Slides
Circular
Free
Syria Regional Data Map Infographic Template for PowerPoint & Google Slides
World Maps
Data Analysis Bar Chart with Insights Template for PowerPoint & Google Slides
Bar/Column
Free
Data Privacy template for PowerPoint & Google Slides
Information Technology
Data Protection Strategies template for PowerPoint & Google Slides
Information Technology
Comprehensive Data & AI Capability Model Template for PowerPoint & Google Slides
AI
Data Privacy and Compliance in ML template for PowerPoint & Google Slides
Technology
AI and Data Ecosystem Map Template for PowerPoint & Google Slides
AI
Data Studio Insights template for PowerPoint & Google Slides
Business Report
Data Protection & Encryption in the Cloud Overview template for PowerPoint & Google Slides
Cloud Computing
First Party Data Overview Template for PowerPoint & Google Slides
Business
Business Data Table Template for PowerPoint & Google Slides
Table
Colorful Business Data Comparison Table Template for PowerPoint & Google Slides
Table
Six Column Data Table Template for PowerPoint & Google Slides
Table
Data Gap Analysis Template for PowerPoint & Google Slides
Business
Sales Process Workflow Funnel Diagram PowerPoint Template for PowerPoint & Google Slides
Funnel
Mobile User Data Analysis Infographic for PowerPoint & Google Slides
Process
Bar Data Chart Slide for PowerPoint & Google Slides
Bar/Column
Weekly Data Chart Slide for PowerPoint & Google Slides
Comparison Chart

3D Column Chart with Data Table for PowerPoint & Google Slides
Bar/Column

Cone Data Chart for PowerPoint & Google Slides
Charts
Sales Activity Hexagon Process Diagram Template for PowerPoint & Google Slides
Process
Eight-Step Sales Cycle Diagram Template for PowerPoint & Google Slides
Process
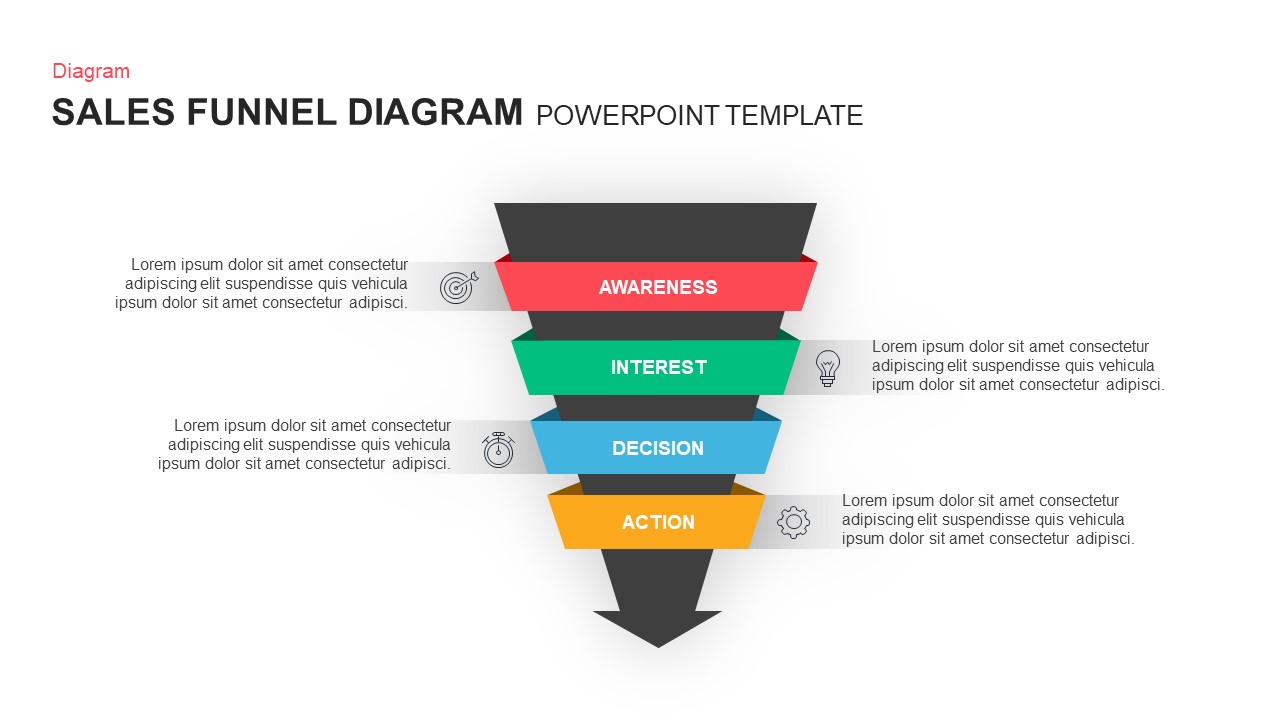
Professional Sales Funnel Diagram Template for PowerPoint & Google Slides
Funnel
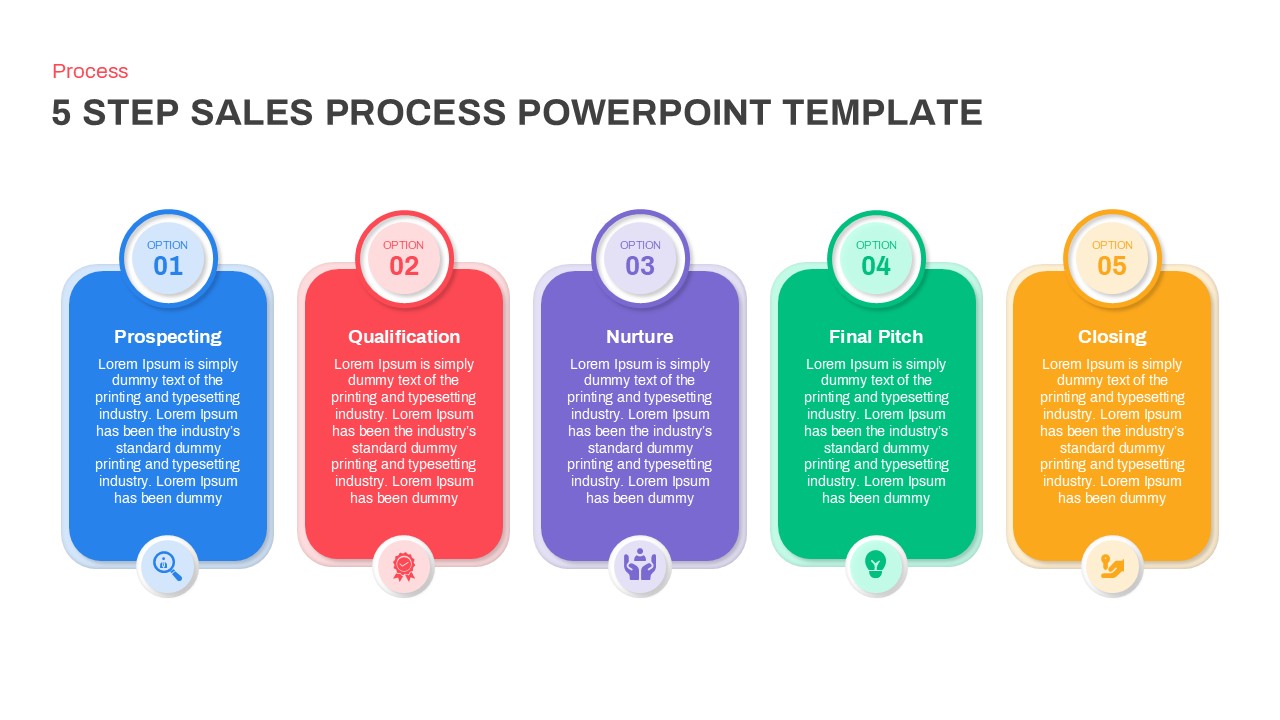
Modern 5-Step Sales Process Diagram Template for PowerPoint & Google Slides
Process
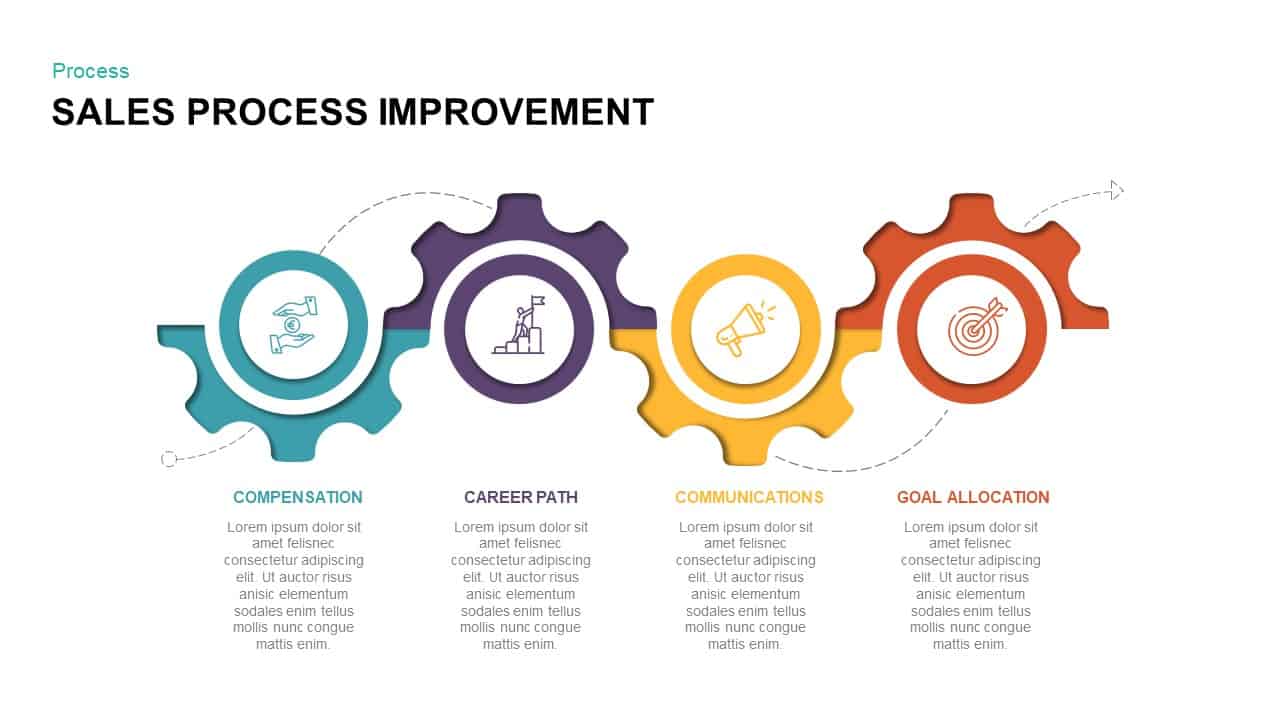
Sales Process Improvement Gear Diagram Template for PowerPoint & Google Slides
Process
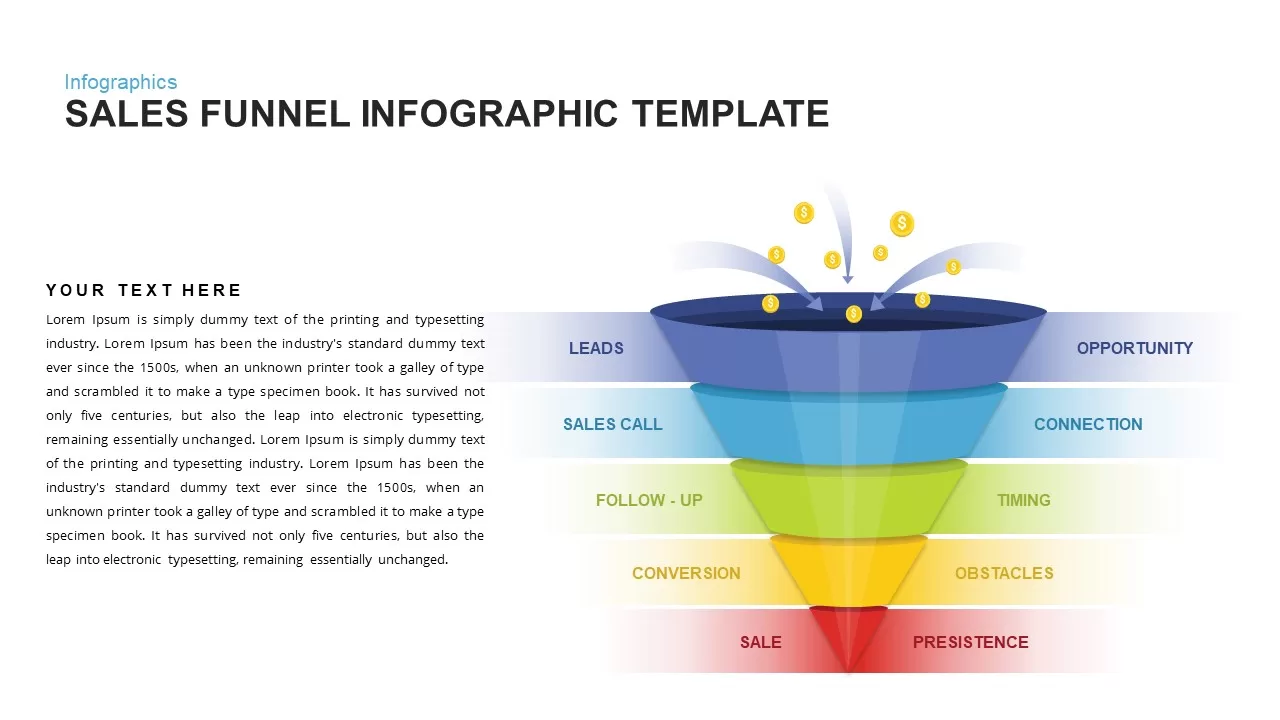
Sales Funnel Infographic Diagram Template for PowerPoint & Google Slides
Funnel
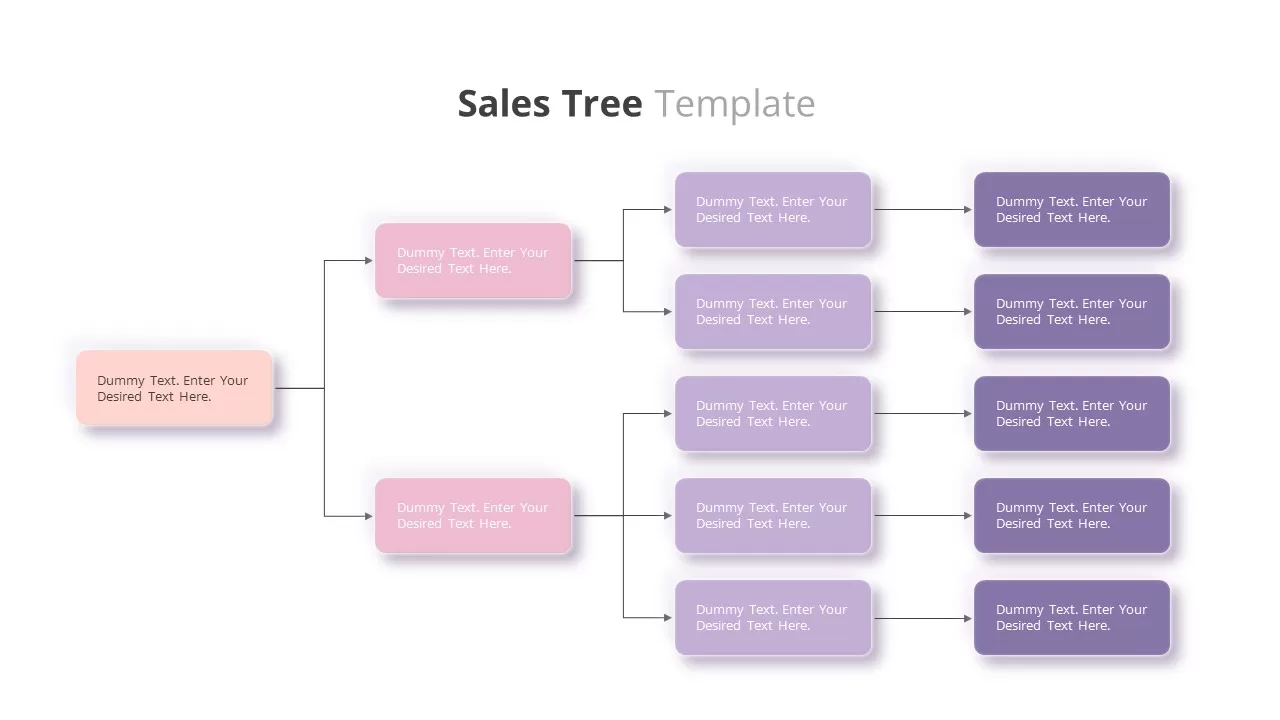
Customizable Sales Tree Diagram Template for PowerPoint & Google Slides
Org Chart
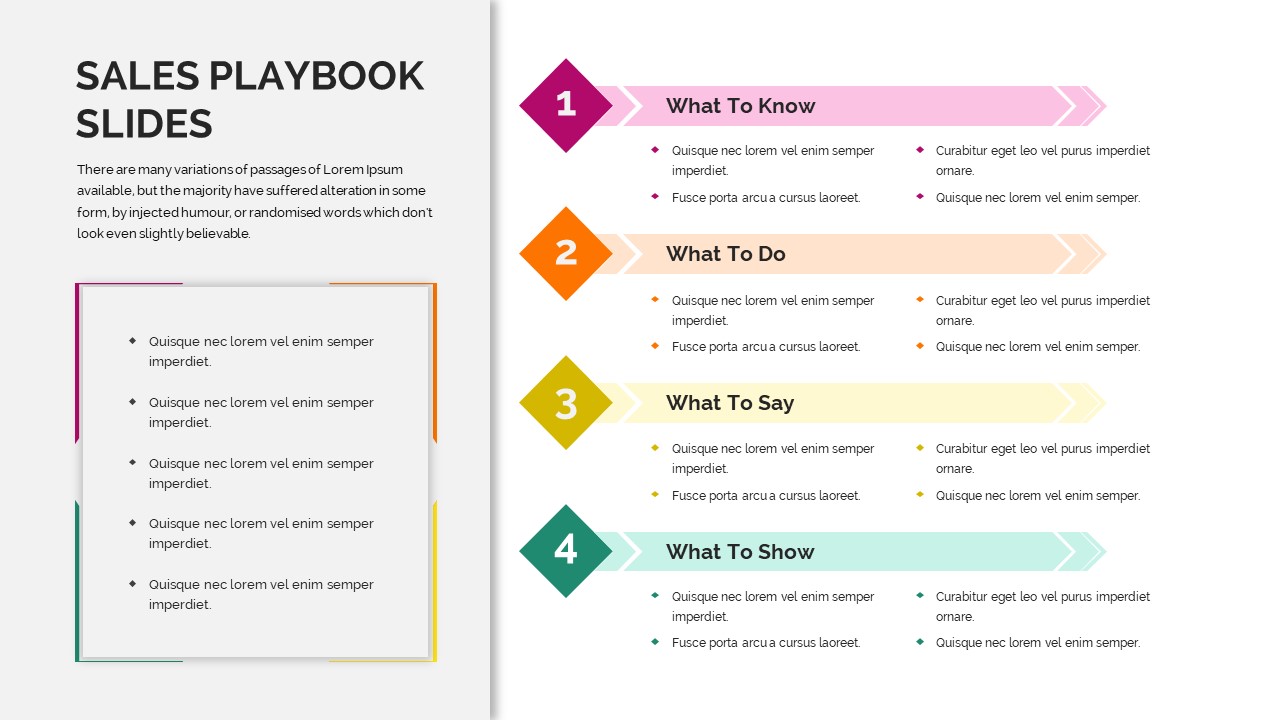
Sales Playbook Process Steps Diagram Template for PowerPoint & Google Slides
Marketing
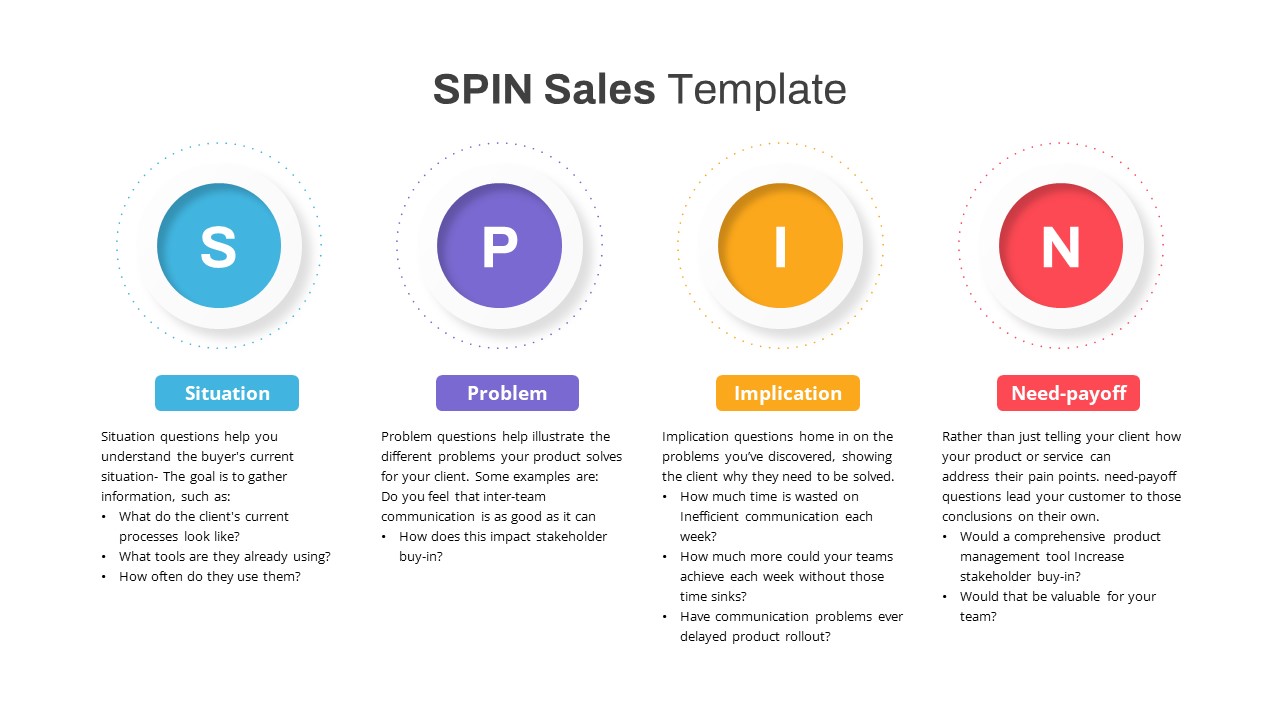
SPIN Sales Methodology Diagram Template for PowerPoint & Google Slides
Process
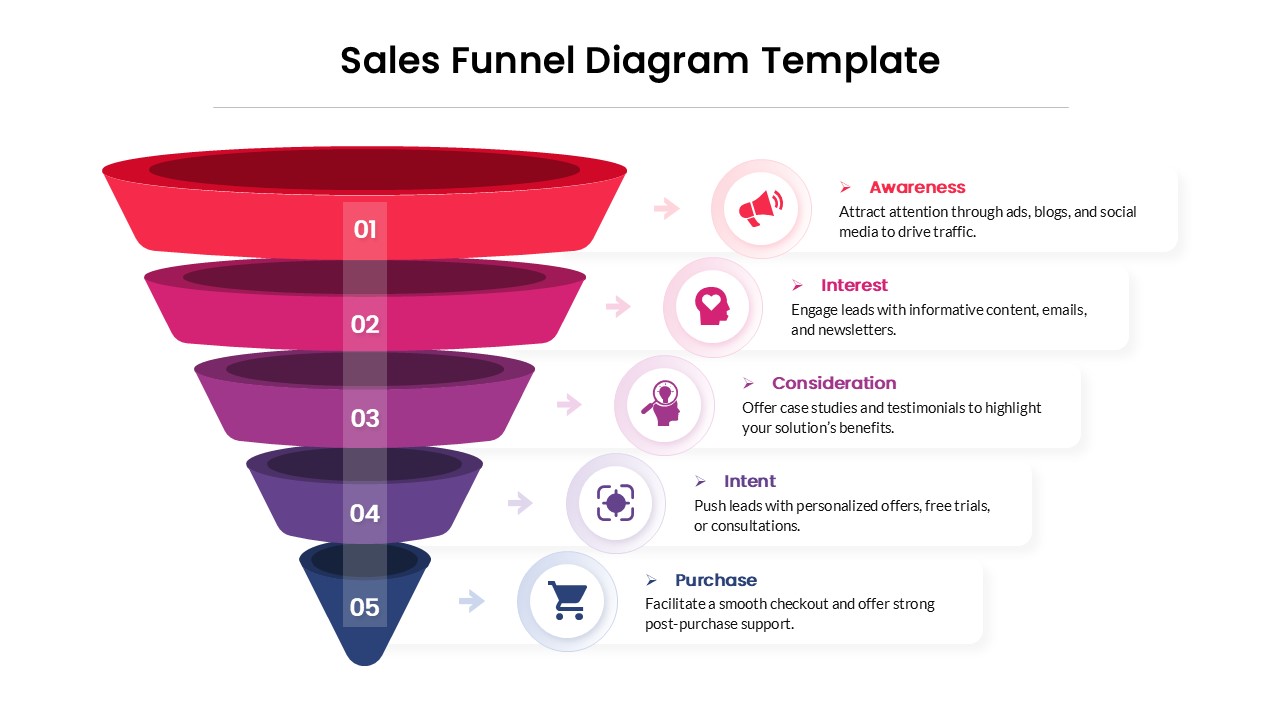
5 Stage Sales Funnel Diagram Template for PowerPoint & Google Slides
Funnel

Sales Funnel Diagram for PowerPoint & Google Slides
Marketing Funnel
4 Level Sales Funnel Diagram Design for PowerPoint & Google Slides
Marketing Funnel
Sales Enablement Funnel diagram for PowerPoint & Google Slides
Funnel