Data-Driven Marketing Lifecycle Diagram Template for PowerPoint & Google Slides


Description
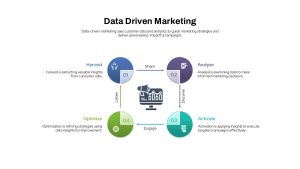
Map your entire data-driven marketing lifecycle with this vibrant four-phase circular diagram slide. At its center, a stylized computer graphic anchors four color-coded nodes—Harvest, Analyze, Activate, and Optimize—arranged clockwise around a segmented ring. Each node pairs a numbered circle and a clear icon with a concise callout description, while directional arrows labeled Share, Discover, Engage, and Listen guide viewers through the continuous feedback loop. Set on a clean white background, the design leverages bold blue, purple, teal, and green hues for each phase, creating immediate visual distinction while maintaining harmony through subtle gradients and consistent line weights.
Built on master slides with vector shapes, every element is fully editable: swap icons, update labels, or reassign colors in seconds without misaligning connectors. Text placeholders support rich formatting, and snap-to-grid guides ensure perfect spacing as you add or remove phases. The template also includes theme-color support, so a single click applies your brand palette globally. Whether illustrating how you harvest audience data, analyze trends, activate targeted campaigns, or optimize performance, this modular layout scales seamlessly across screen resolutions and presentation platforms.
Who is it for
Marketing managers, data analysts, digital strategists, and campaign planners will find this slide invaluable for pitching analytics roadmaps, training cross-functional teams, or briefing stakeholders on the lifecycle of data-driven initiatives.
Other Uses
Beyond marketing, repurpose this circular diagram for customer experience loops, product development sprints, continuous-improvement cycles, or any four-stage process that benefits from a clear, repeatable workflow visualization.
Login to download this file

Item ID
SB05208
Related Templates

Data-Driven Marketing Cycle Diagram Template for PowerPoint & Google Slides
Customer Journey

Data-Driven Sales Strategy Diagram Template for PowerPoint & Google Slides
Marketing
Data-Driven Line Chart Diagram Template for PowerPoint
Comparison Chart
Data-driven GDP Growth Infographic Pack Template for PowerPoint & Google Slides
Infographics
Data-Driven AI in Insurance Infographic Template for PowerPoint & Google Slides
Circular
Data-Driven Decision Making overview template for PowerPoint & Google Slides
Business
Excel-Driven Gradient Timeline Chart Template for PowerPoint & Google Slides
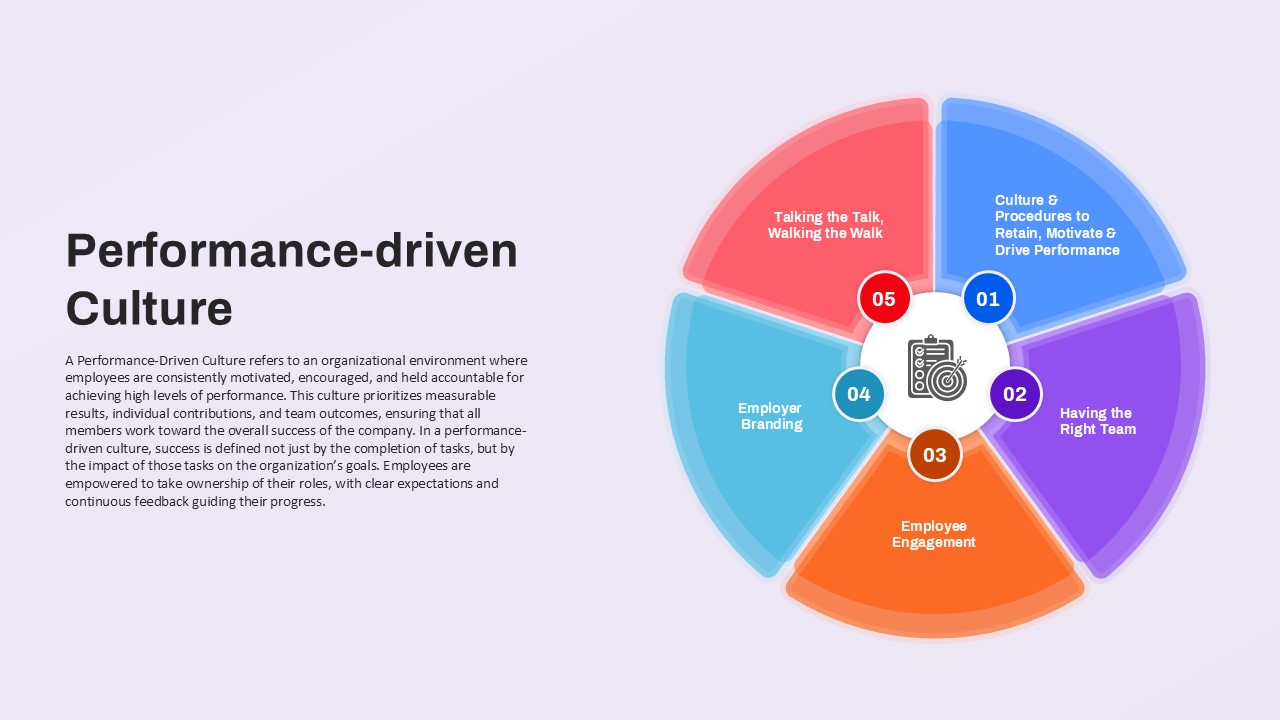
Performance-driven Culture framework template for PowerPoint & Google Slides
Leadership
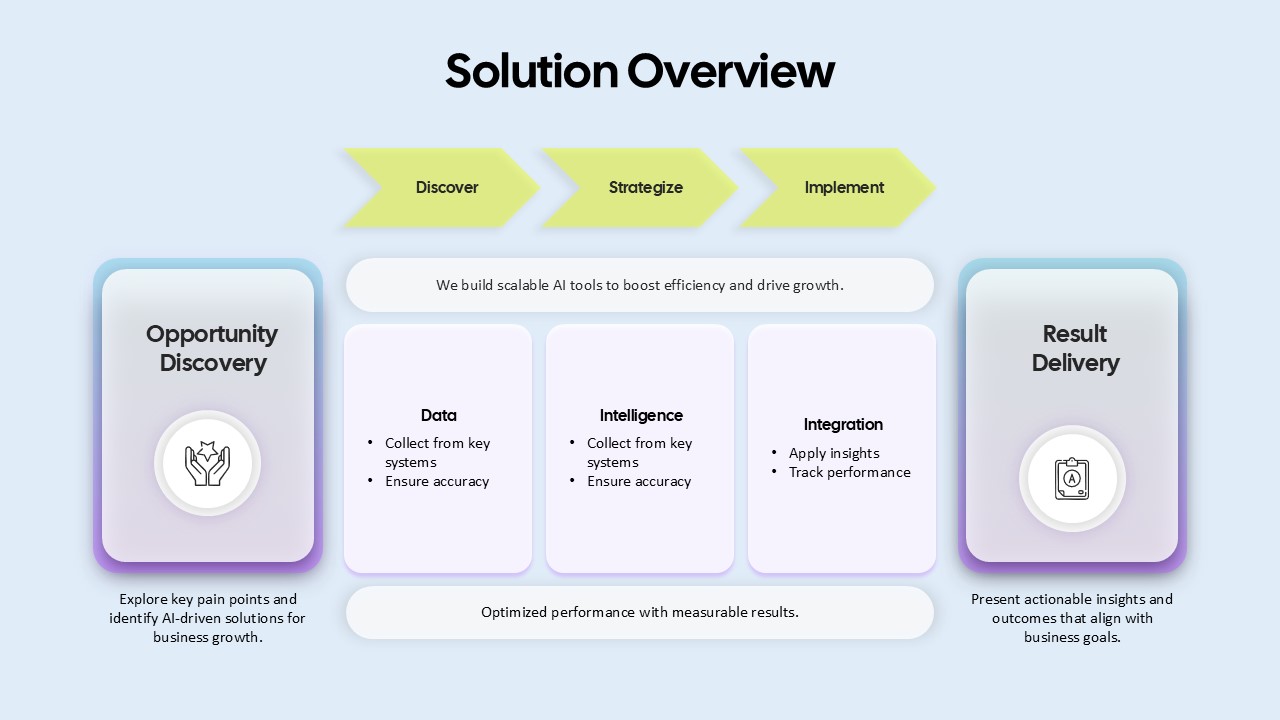
AI-Driven Solution Overview for PowerPoint & Google Slides
AI
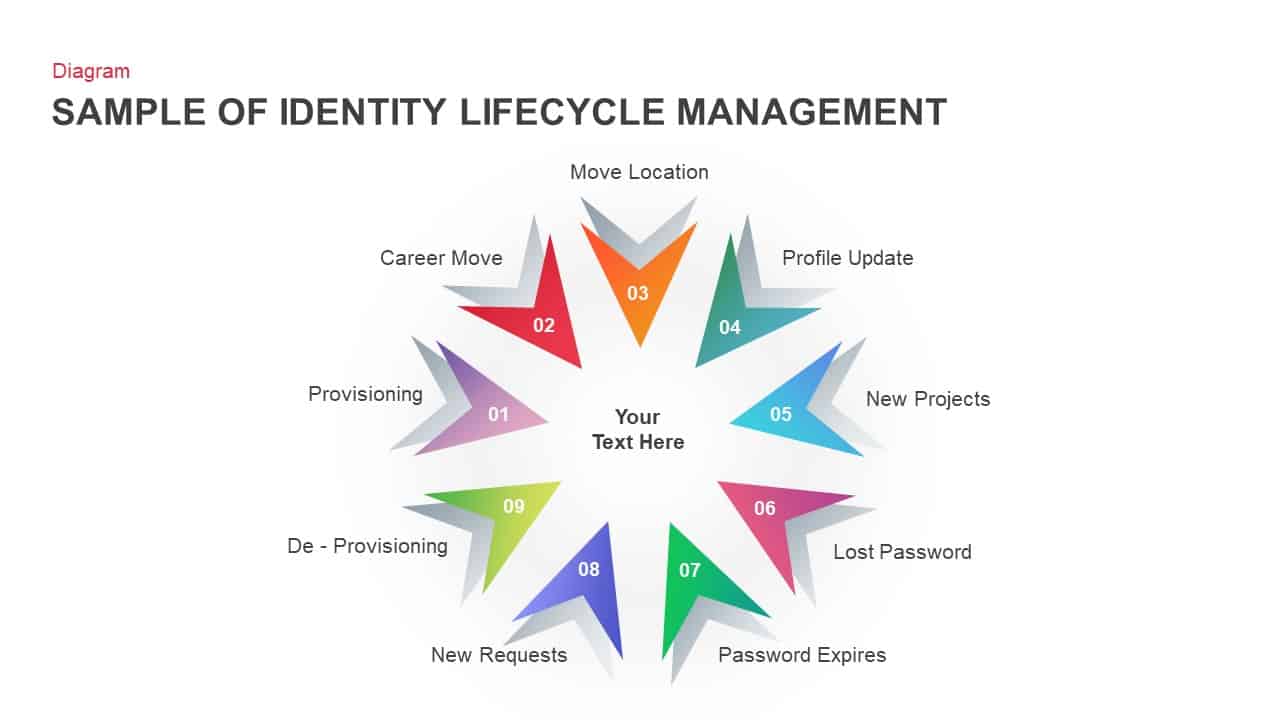
Identity Lifecycle Diagram Template for PowerPoint & Google Slides
Circular

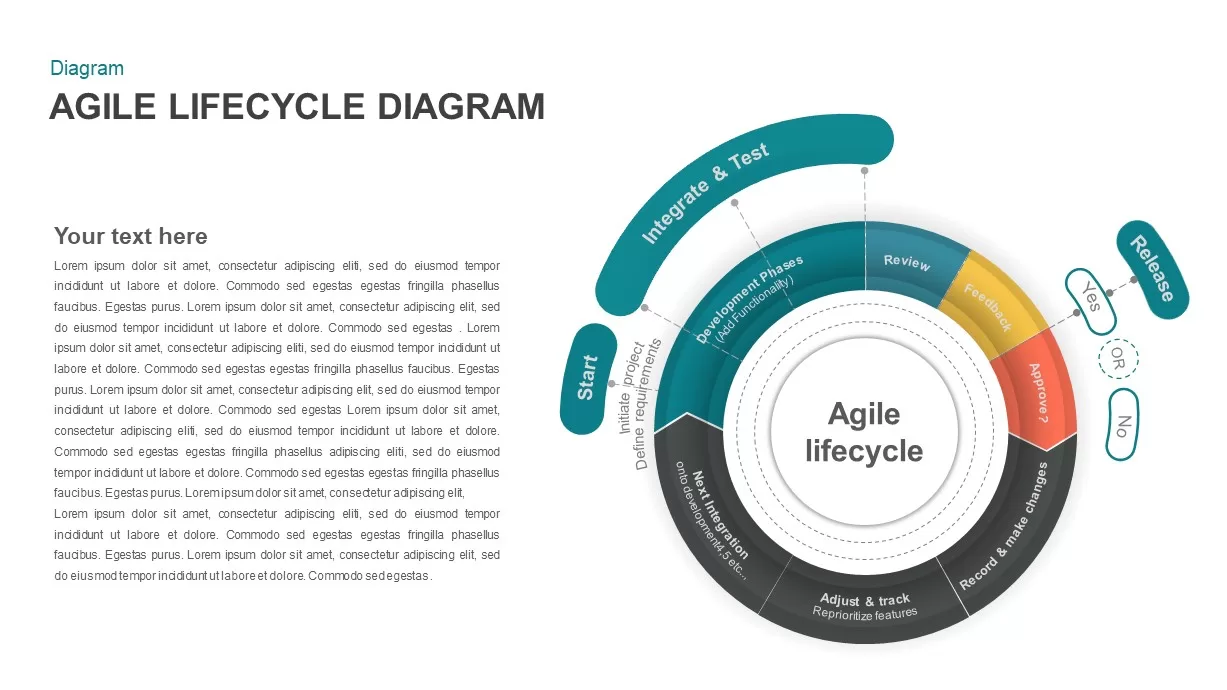
Agile Lifecycle Circular Diagram Template for PowerPoint & Google Slides
Circular
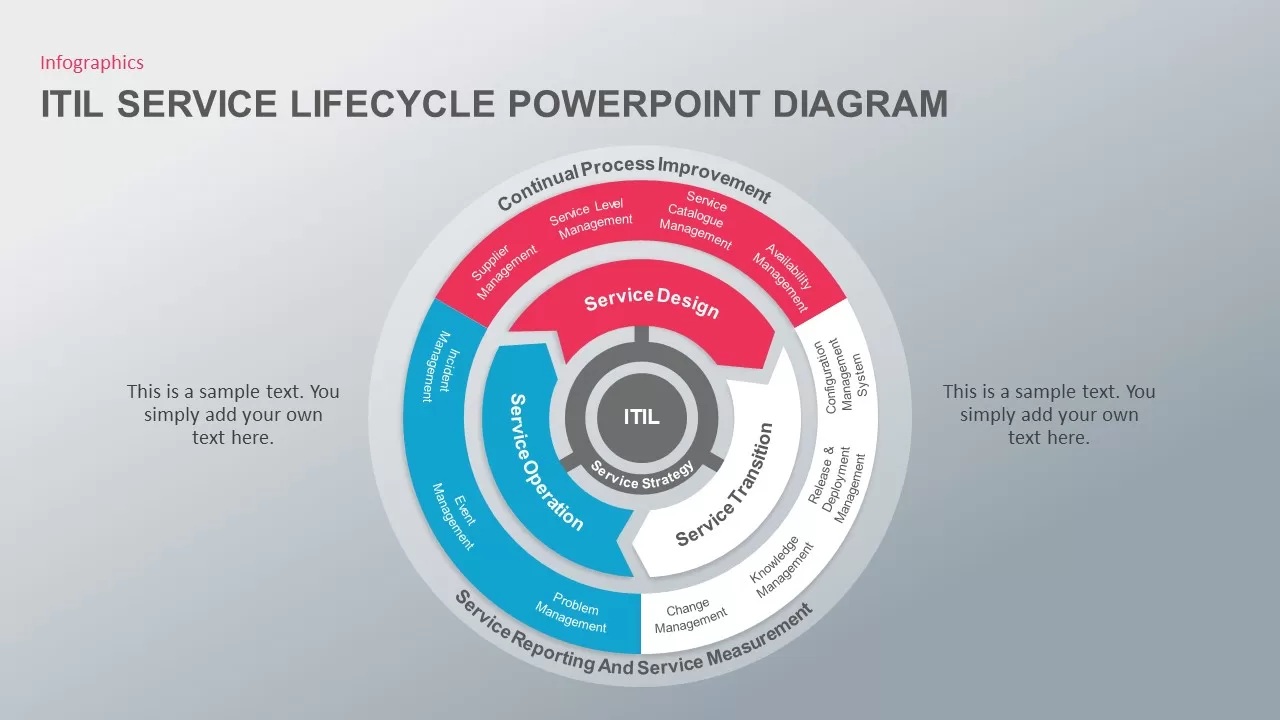
ITIL Service Lifecycle Circular Diagram Template for PowerPoint & Google Slides
Circular
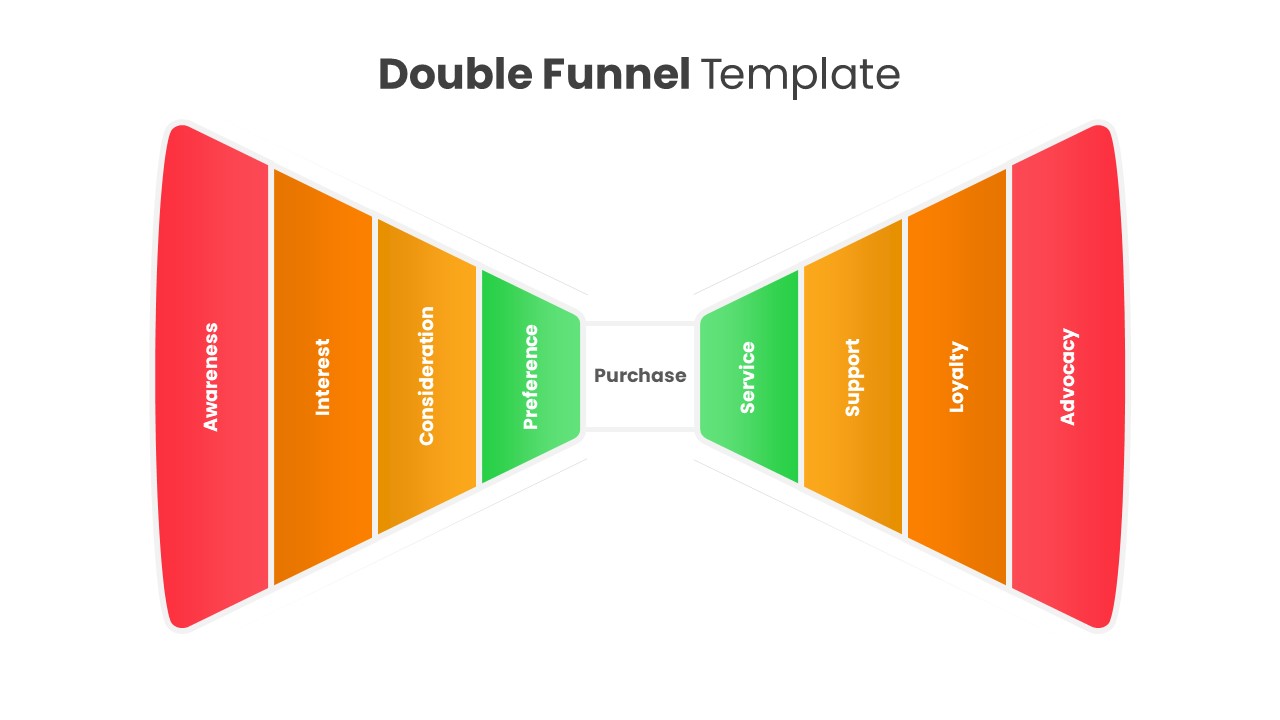
Double Funnel Lifecycle Diagram Template for PowerPoint & Google Slides
Funnel
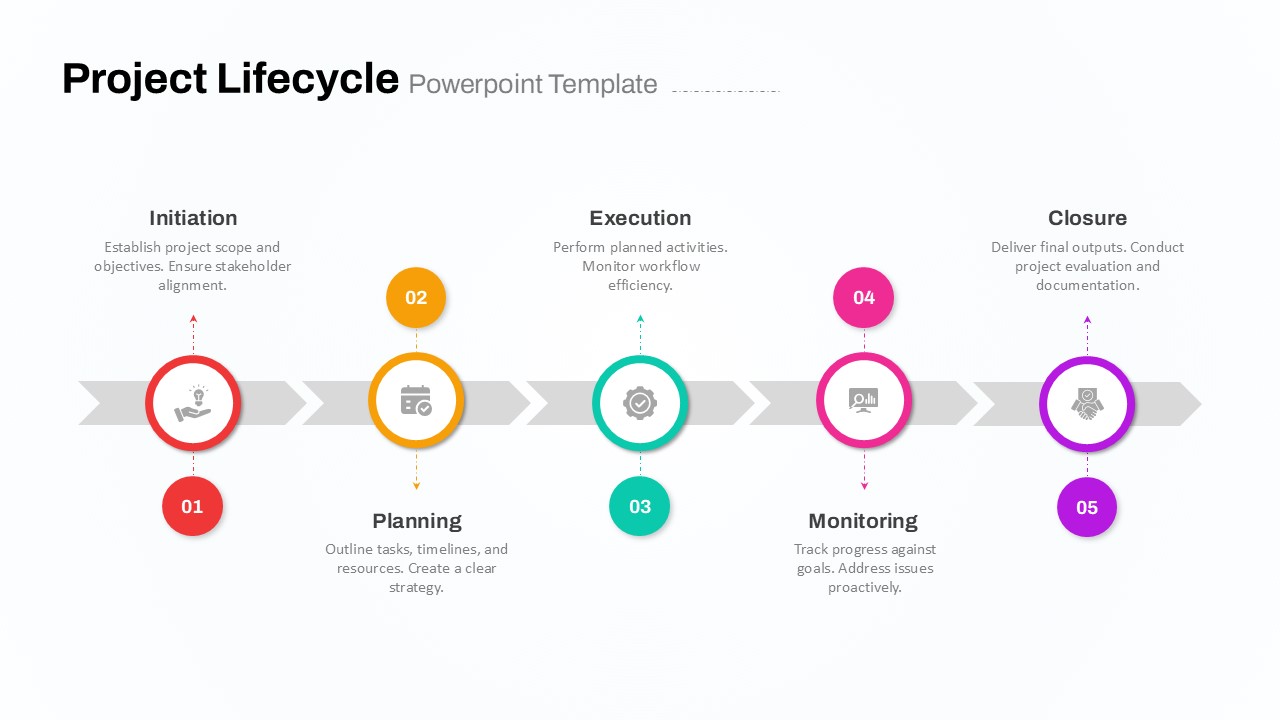
Five-Phase Project Lifecycle Diagram Template for PowerPoint & Google Slides
Infographics
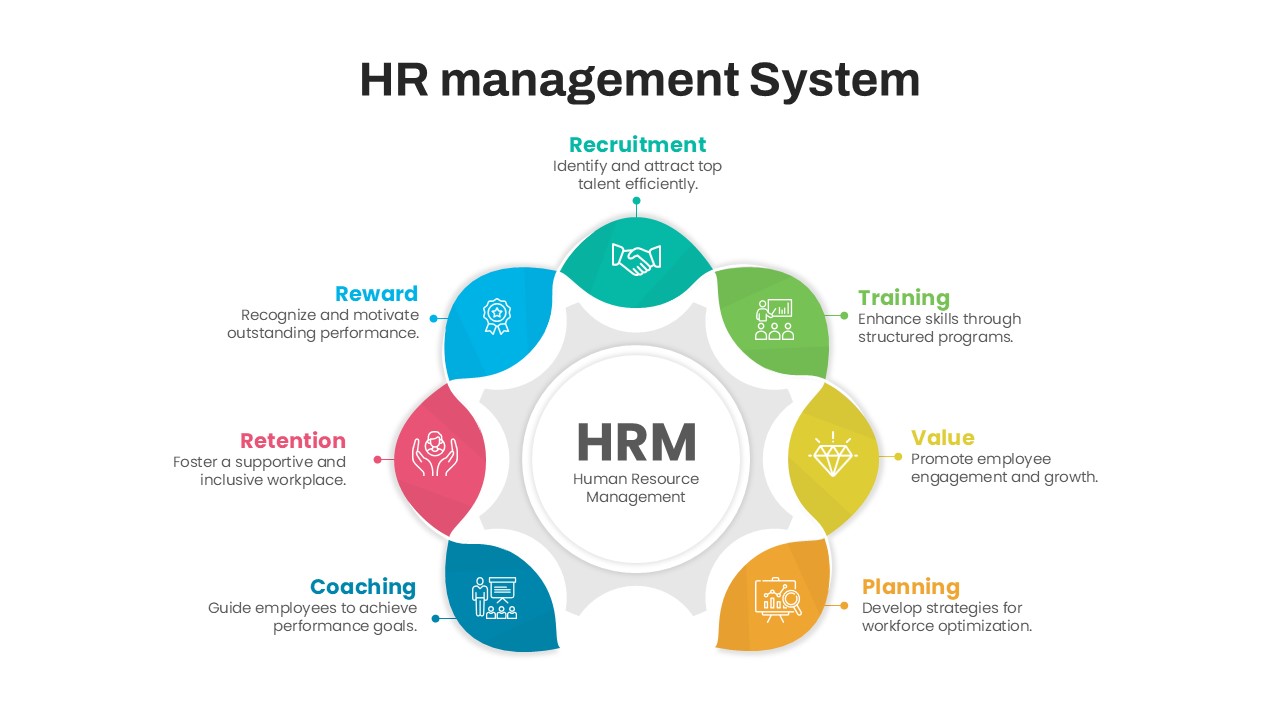
HR Management System Lifecycle Diagram Template for PowerPoint & Google Slides
Recruitment
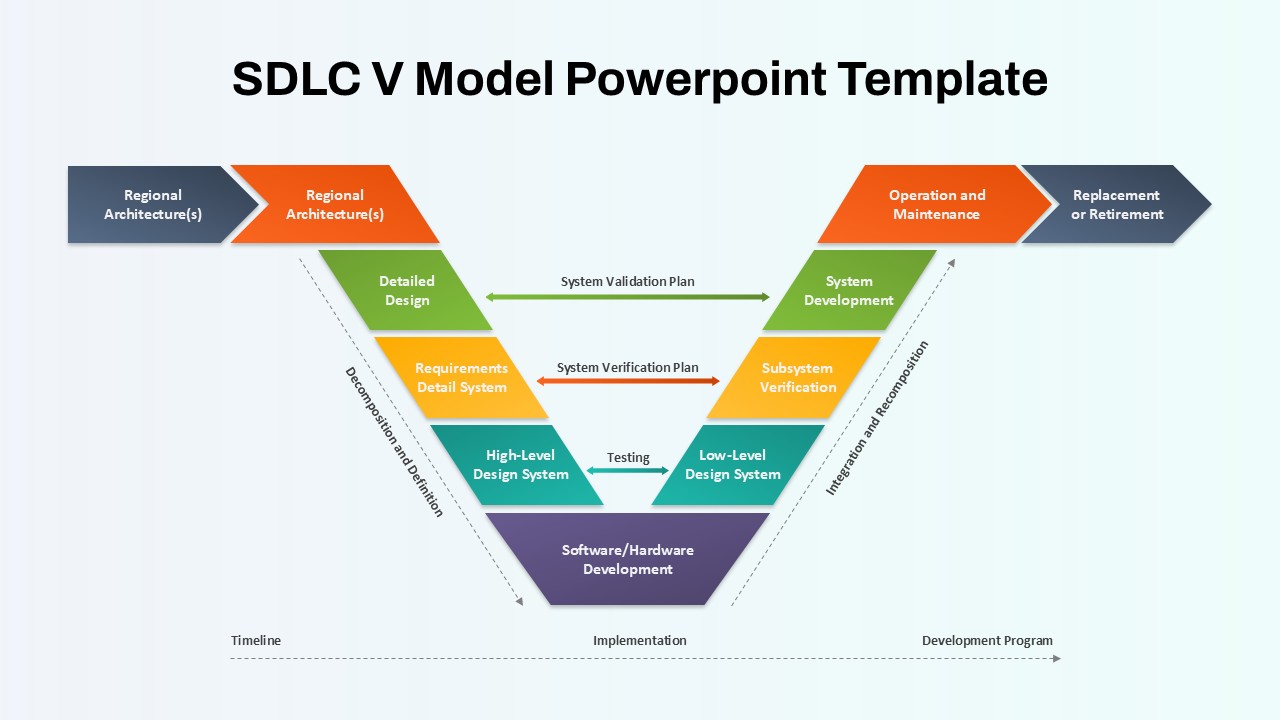
SDLC V Model Lifecycle Diagram Template for PowerPoint & Google Slides
Process
Business Lifecycle Arrow Template for PowerPoint & Google Slides
Infographics
Plant Growth Lifecycle Infographic Template for PowerPoint & Google Slides
Process
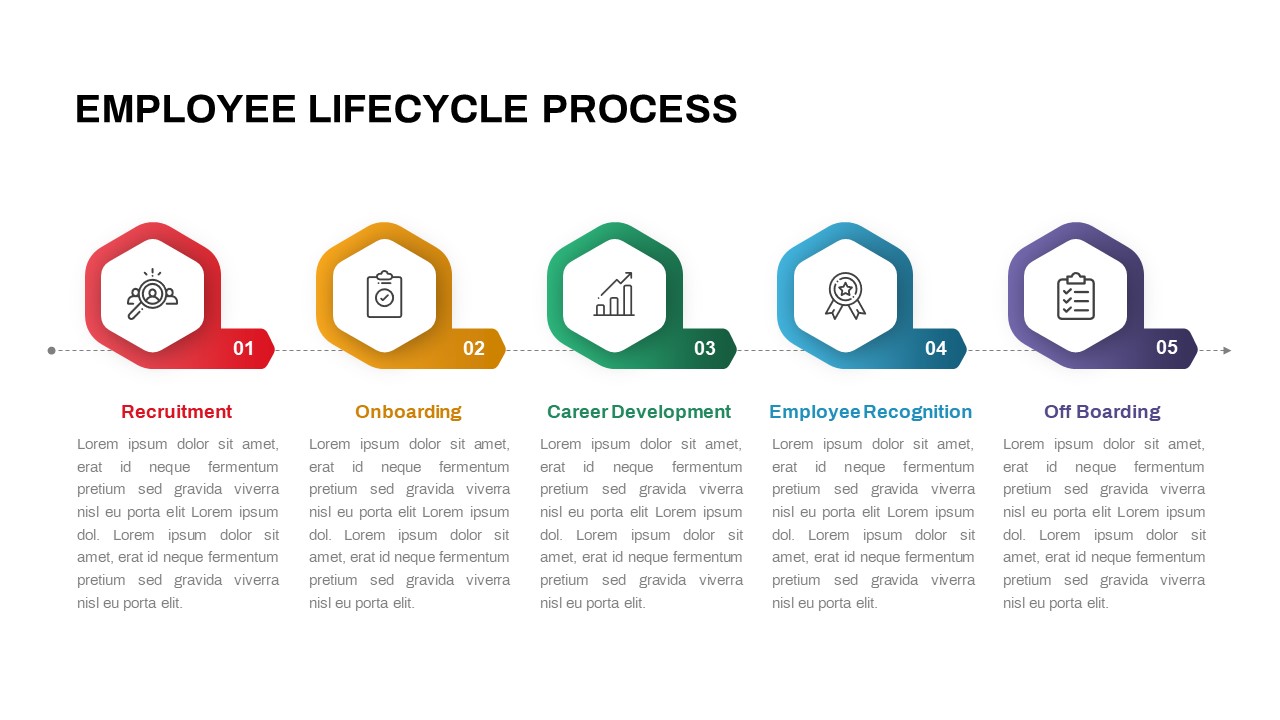
Employee Lifecycle Process Template for PowerPoint & Google Slides
Circular
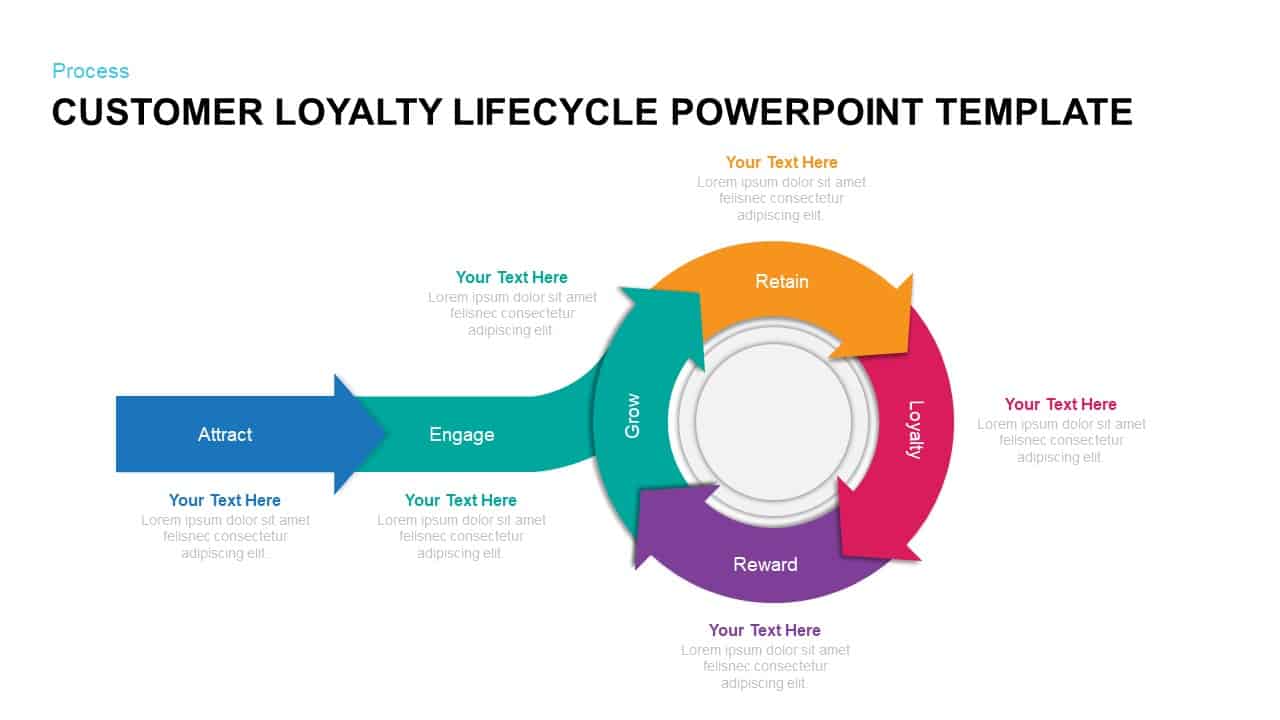
Customer Loyalty Lifecycle Process Template for PowerPoint & Google Slides
Process
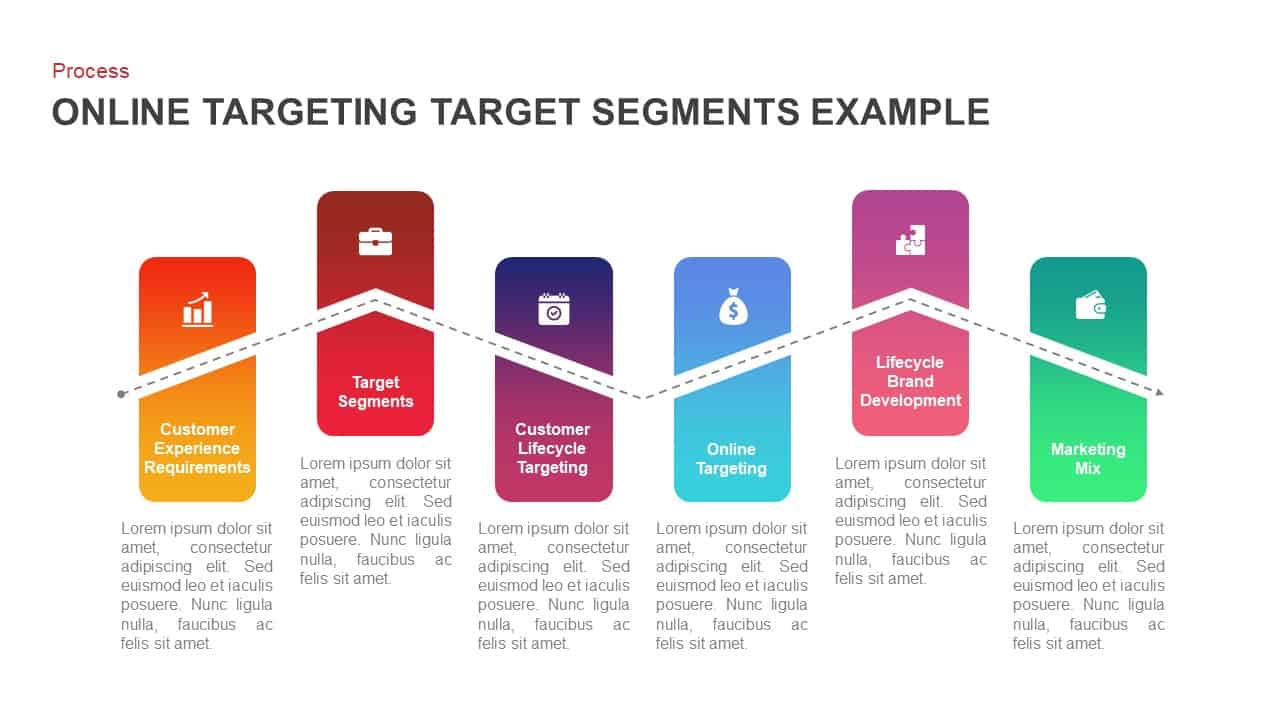
Online Targeting Lifecycle Six-Step Template for PowerPoint & Google Slides
Digital Marketing
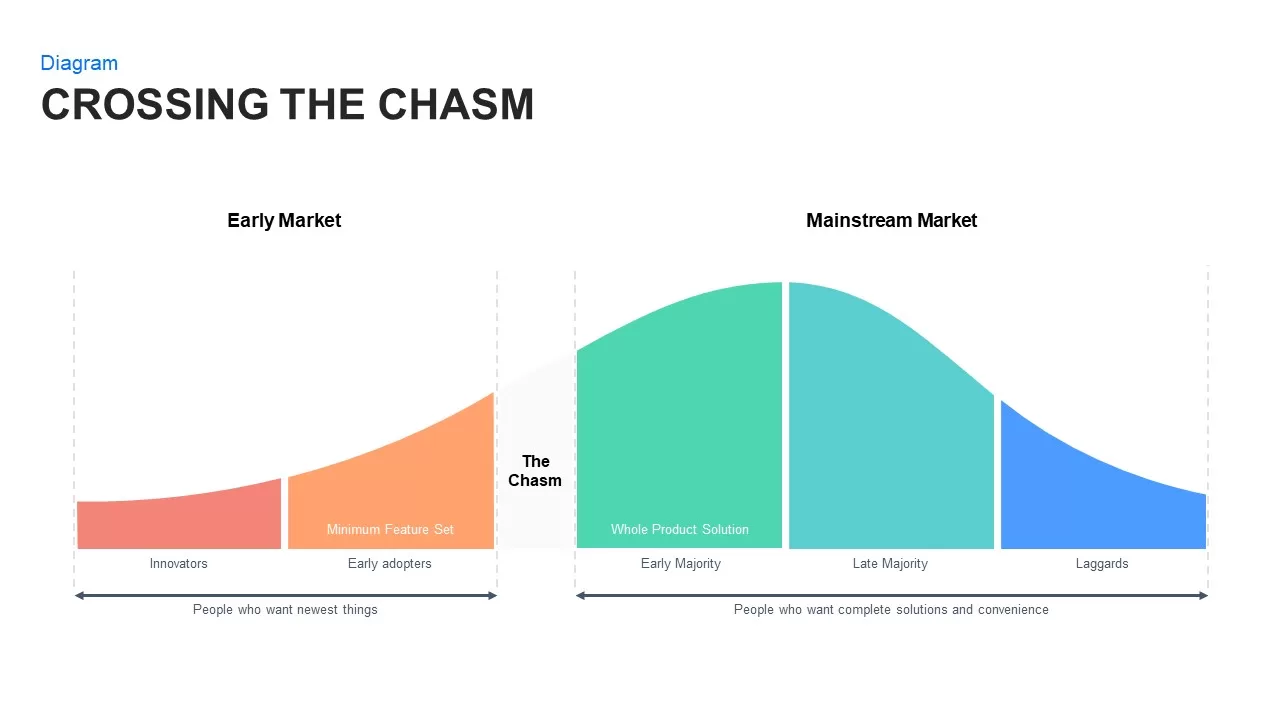
Crossing the Chasm: Technology Adoption Lifecycle template for PowerPoint & Google Slides
Business Strategy
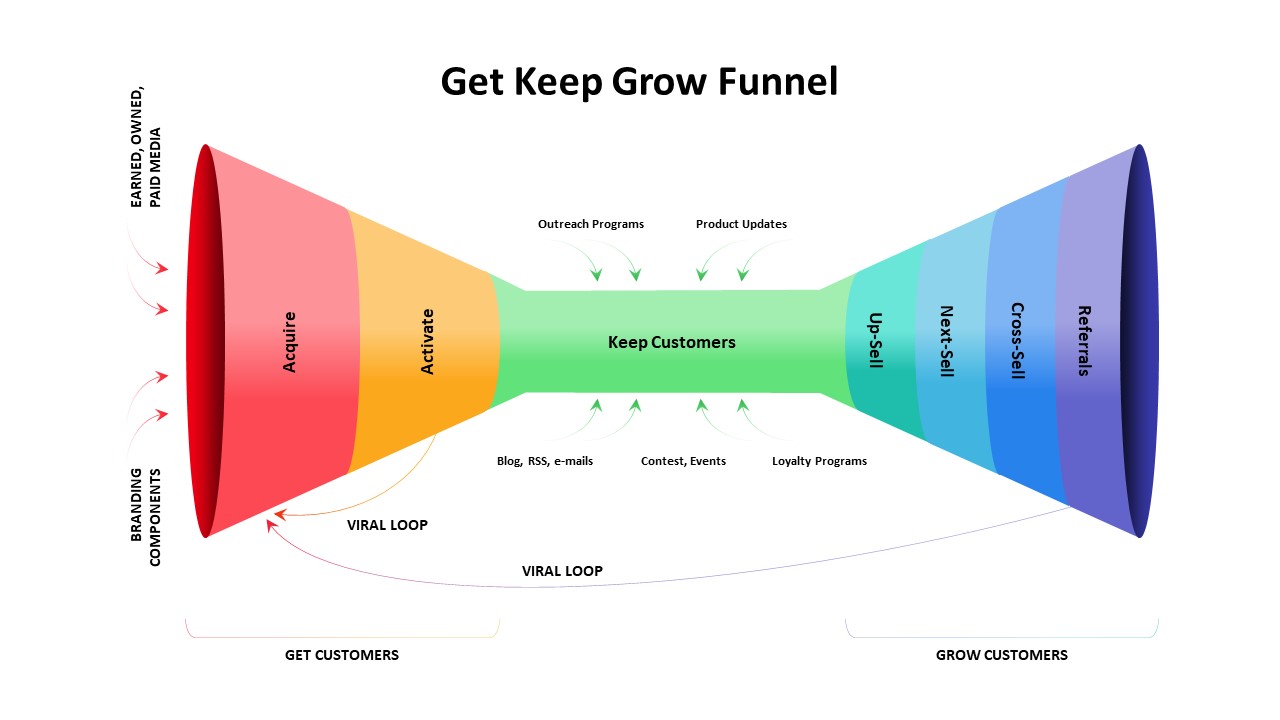
Get Keep Grow Customer Funnel Lifecycle Template for PowerPoint & Google Slides
Funnel
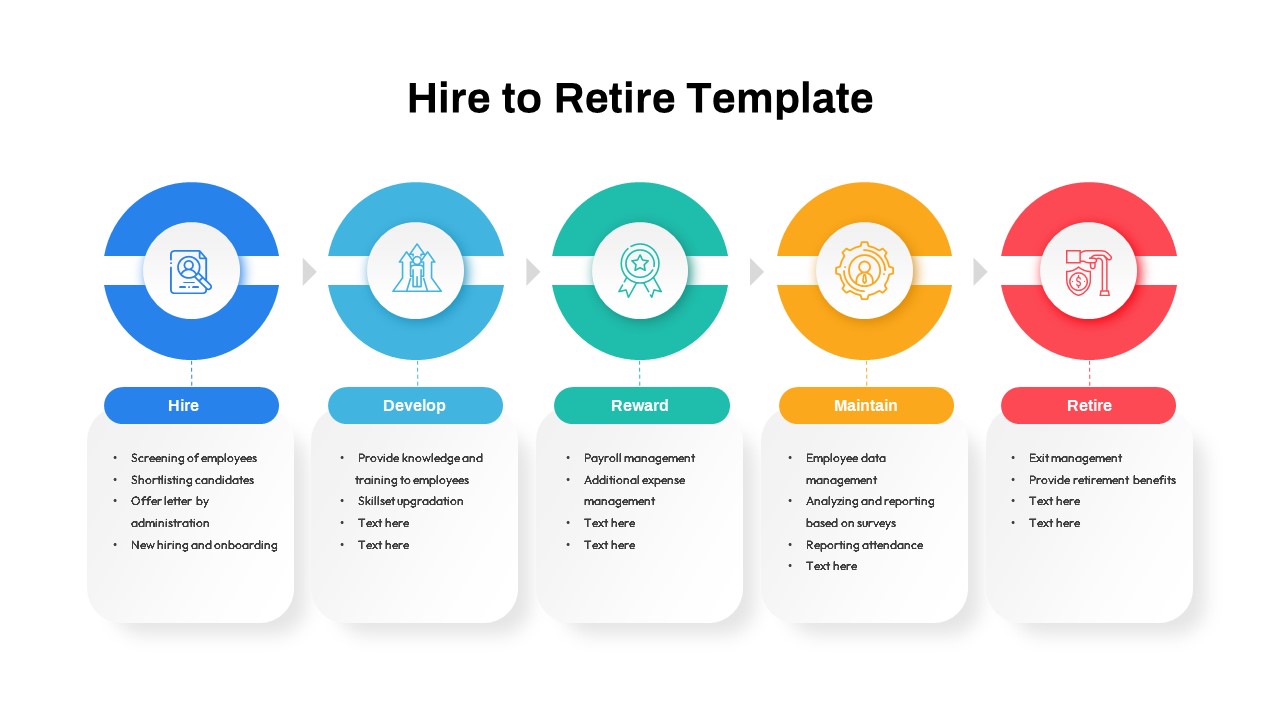
Five-Stage Hire to Retire HR Lifecycle Template for PowerPoint & Google Slides
Recruitment
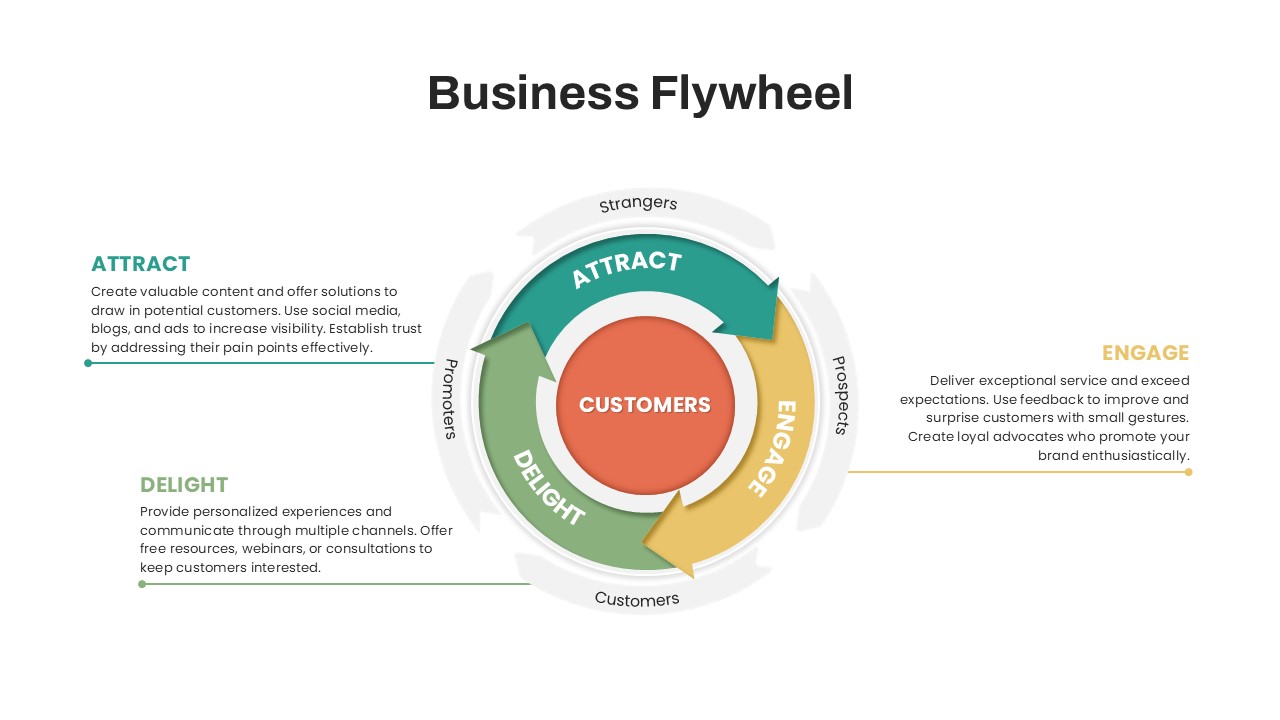
Business Flywheel Lifecycle Model Template for PowerPoint & Google Slides
Circular
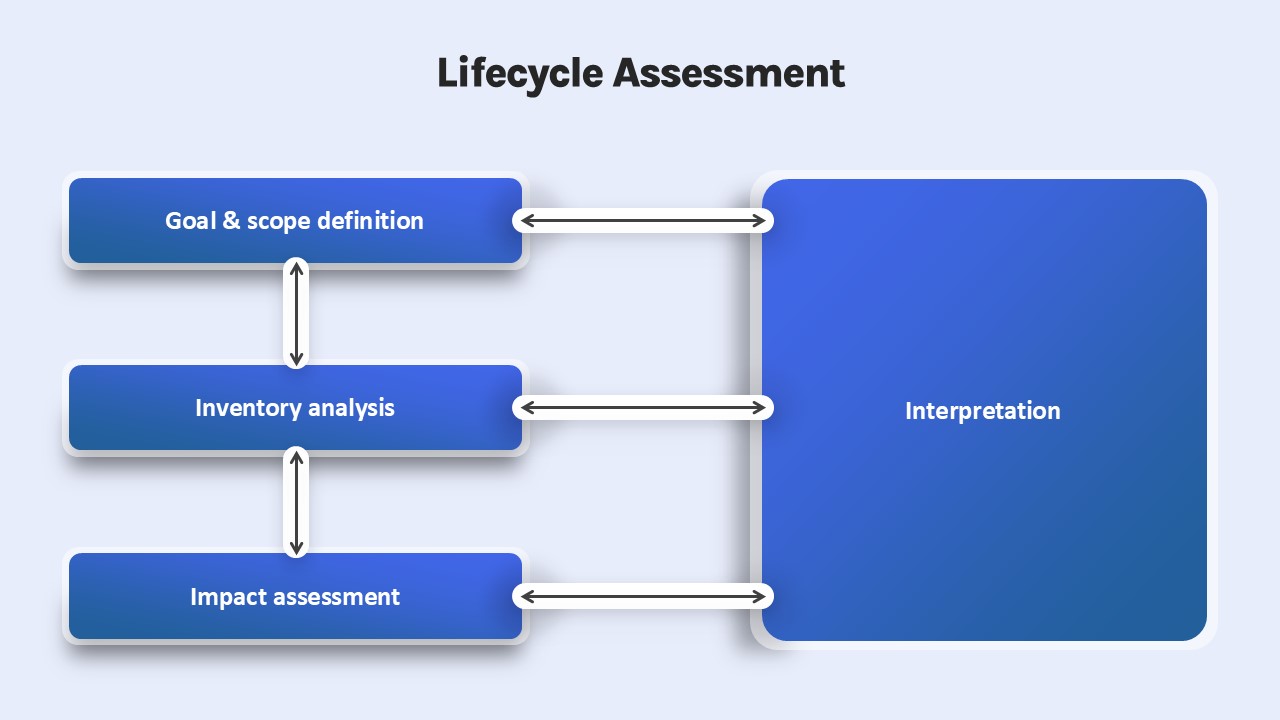
Lifecycle Assessment template for PowerPoint & Google Slides
Process
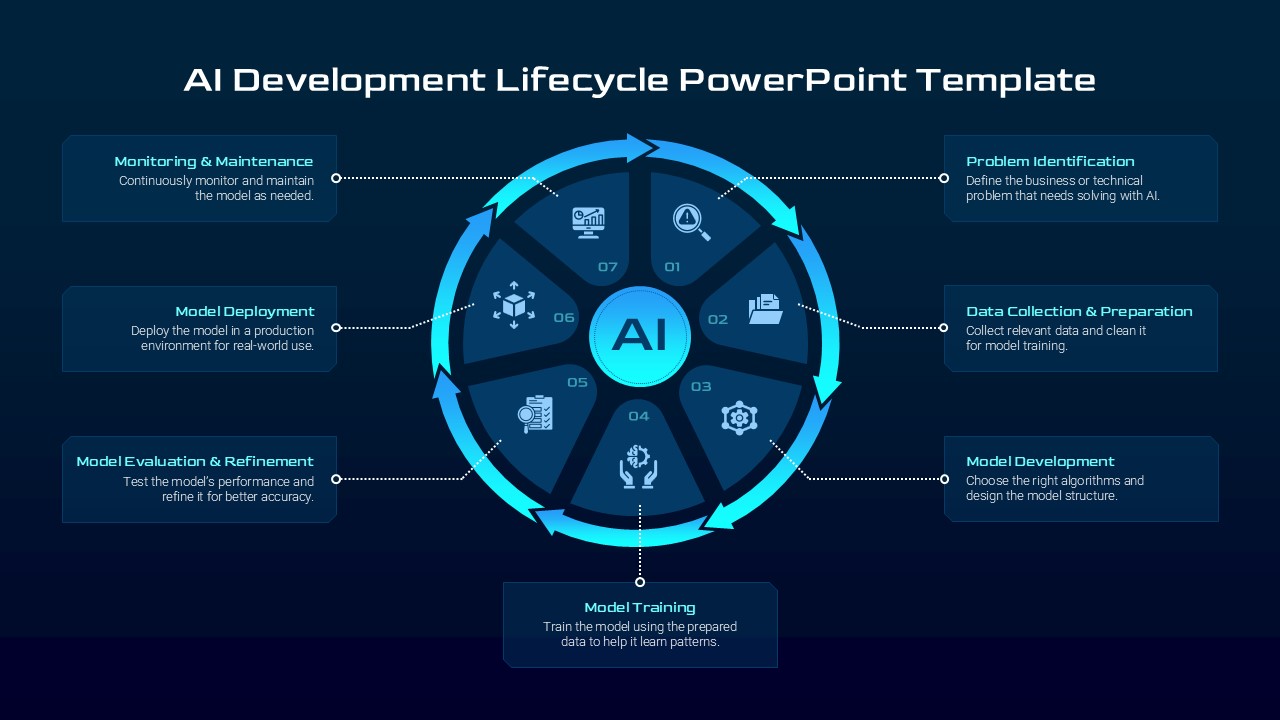
AI Development Lifecycle Dark Circular Template for PowerPoint & Google Slides
Circular
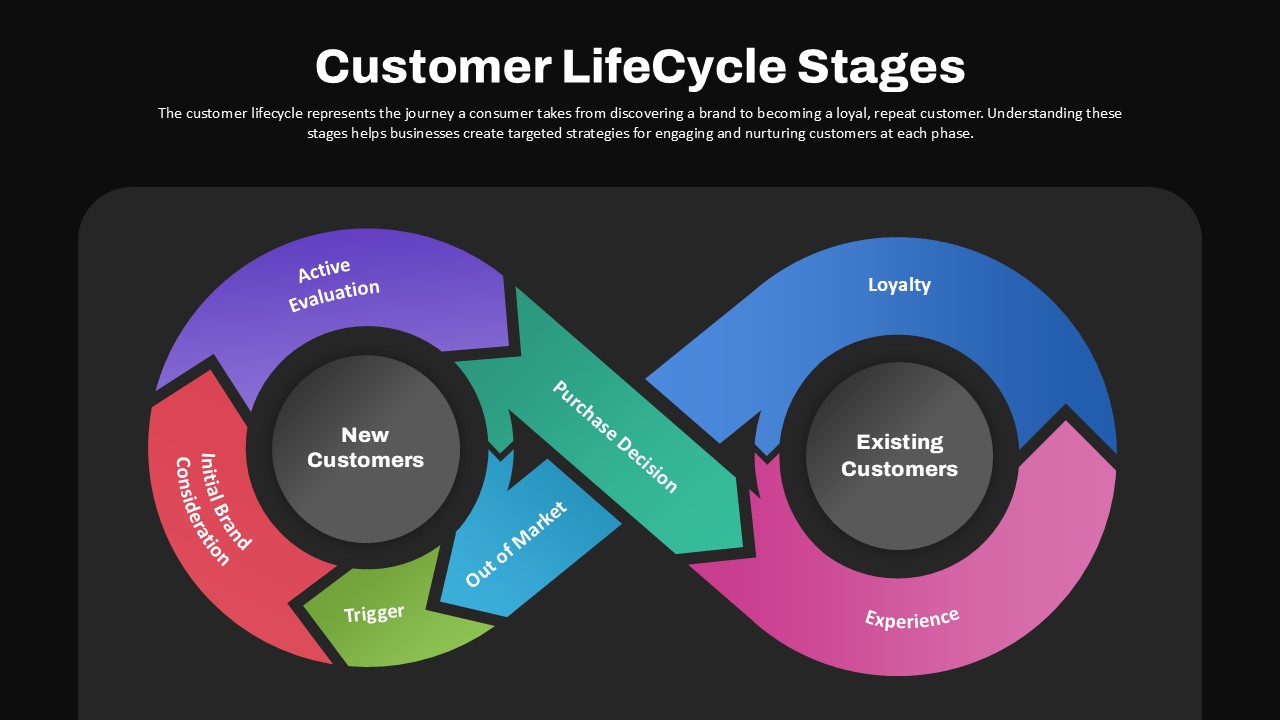
Customer Lifecycle Stages Infinity Loop Template for PowerPoint & Google Slides
Customer Journey
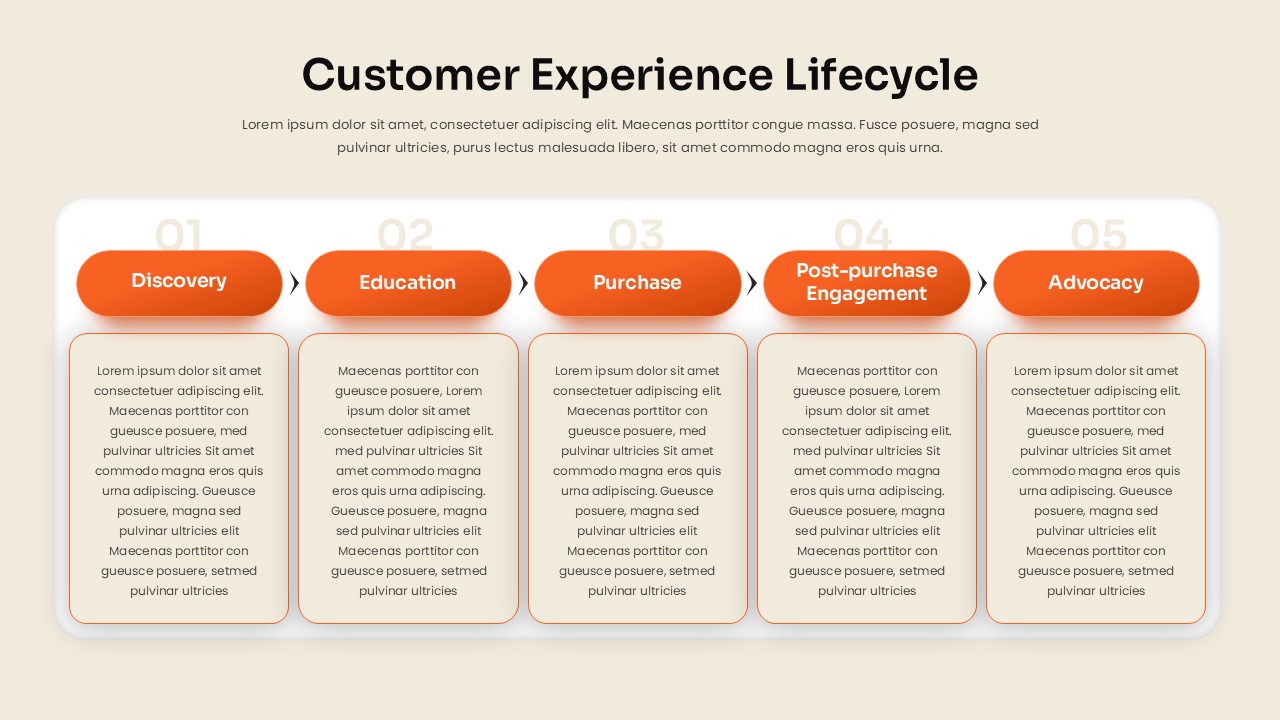
Customer Experience Lifecycle Template for PowerPoint & Google Slides
Customer Journey
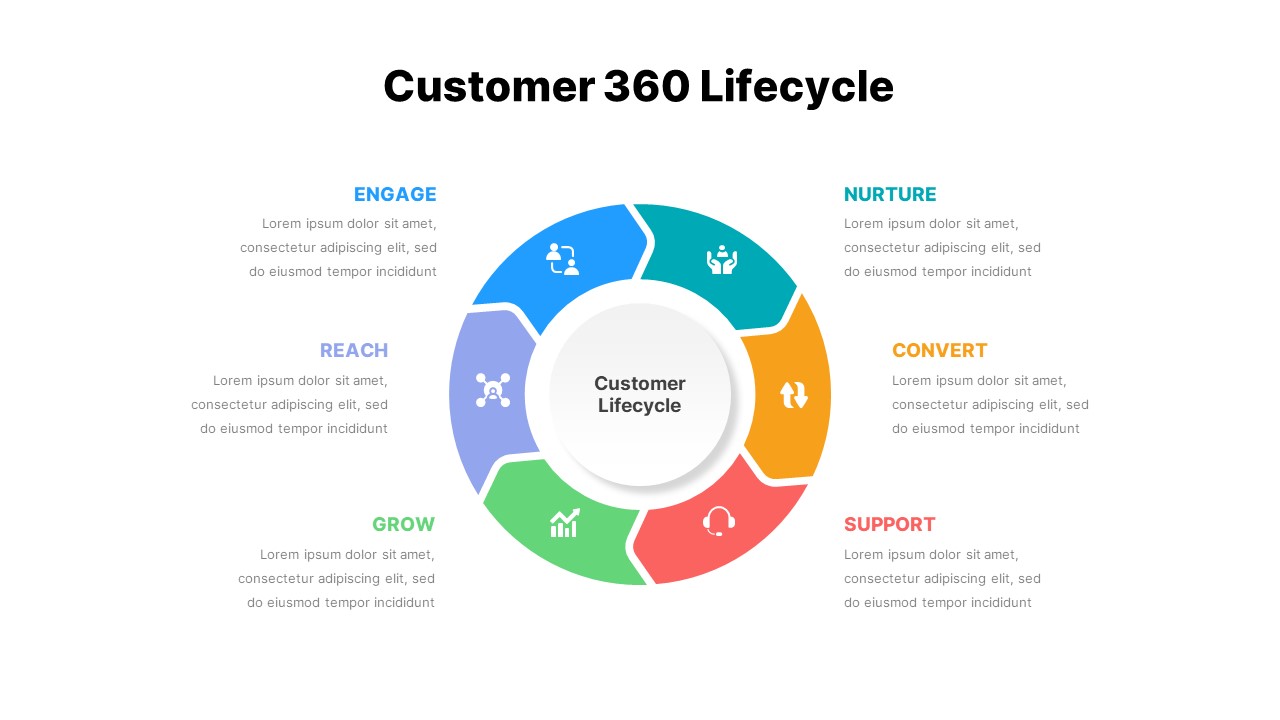
Customer 360 Lifecycle Slide for PowerPoint & Google Slides
Customer Journey
Gear Pie Diagram Data Visualization Template for PowerPoint & Google Slides
Pie/Donut
Data Management and Analytics Diagram Template for PowerPoint & Google Slides
Circular
Data Migration Life Cycle Curved Diagram Template for PowerPoint & Google Slides
Process
Advanced Data Flow Diagram Pack Template for PowerPoint & Google Slides
Flow Charts
Data Lake Hub-and-Spoke Diagram Template for PowerPoint & Google Slides
Cloud Computing
ETL Data Pipeline Workflow Diagram Template for PowerPoint & Google Slides
Process
Customer Data Platform Workflow Diagram Template for PowerPoint & Google Slides
Information Technology
Data Governance Roles Pyramid Diagram Template for PowerPoint & Google Slides
Pyramid
4 Business Data Infographics Diagram for PowerPoint & Google Slides
Process
Data Science PowerPoint Presentation Template for PowerPoint & Google Slides
Pitch Deck
Data Center PowerPoint Template for PowerPoint & Google Slides
Information Technology
Creative data chart analytics template for PowerPoint & Google Slides
Charts
Mobile Data Analysis Chart template for PowerPoint & Google Slides
Charts
World Map Data template for PowerPoint & Google Slides
World Maps
Circle Chart Data template for PowerPoint & Google Slides
Pie/Donut
Creative Data Analysis Bar Chart template for PowerPoint & Google Slides
Bar/Column

Smartphone Data User template for PowerPoint & Google Slides
Charts
Interactive US Population Data Map Slide Template for PowerPoint & Google Slides
World Maps
3D Bar Chart Data Infographics Template for PowerPoint & Google Slides
Bar/Column
3D Stacked Infographic Layers Data Template for PowerPoint & Google Slides
Pyramid
Circle Graph Data Visualization Template for PowerPoint & Google Slides
Circular
Pencil Bar Chart Data Analysis Template for PowerPoint & Google Slides
Bar/Column
3D Cone Chart Data Visualization template for PowerPoint & Google Slides
Bar/Column
Creative Lab Beakers Data Infographic template for PowerPoint & Google Slides
Infographics

Dynamic Data Dashboard Infographic Template for PowerPoint & Google Slides
Bar/Column
Data Analytics Dashboard Design template for PowerPoint & Google Slides
Bar/Column
Tornado Chart Data Comparison Slide Template for PowerPoint & Google Slides
Bar/Column
Bottle Data Percentage Infographic Template for PowerPoint & Google Slides
Infographics
Immigration Data Dashboard Template for PowerPoint & Google Slides
Bar/Column
Leaf Infographic Data Visualization Template for PowerPoint & Google Slides
Infographics
Mobile Infographics Data Visualization Template for PowerPoint & Google Slides
Infographics
Medical Infographics Data Visualization Template for PowerPoint & Google Slides
Health
DIKW Data to Wisdom Pyramid Model Template for PowerPoint & Google Slides
Pyramid
KPI Dashboard Data Visualization Template for PowerPoint & Google Slides
Bar/Column
KPI Dashboard Data Overview Slide Template for PowerPoint & Google Slides
Bar/Column
North America Data Map Callouts Template for PowerPoint & Google Slides
World Maps
Professional Heatmap Data Visualization Template for PowerPoint & Google Slides
Infographics
Donut Chart Data Breakdown template for PowerPoint & Google Slides
Pie/Donut

Modern Big Data Infographic Deck Template for PowerPoint & Google Slides
Decks
Waffle Chart Data Visualization Template for PowerPoint & Google Slides
Comparison Chart
Layered Data Governance Maturity Model Template for PowerPoint & Google Slides
Process
Free Stacked Column Chart Data Visualization Template for PowerPoint & Google Slides
Bar/Column
Free
Simple Bar Chart Data Visualization Template for PowerPoint & Google Slides
Bar/Column
XY Bubble Chart Data Visualization Template for PowerPoint & Google Slides
Comparison Chart
Simple Area Chart Data Trends Analysis Template for PowerPoint & Google Slides
Comparison Chart
Data Over Time Line Chart template for PowerPoint & Google Slides
Charts
Waterfall Chart Data Visualization Template for PowerPoint & Google Slides
Comparison Chart
Multipurpose Spline Chart Data Trend Template for PowerPoint & Google Slides
Bar/Column
Editable Africa Map Infographic Data Template for PowerPoint & Google Slides
World Maps
UK Counties Map Data Visualization Template for PowerPoint & Google Slides
World Maps
Interactive Jump Line Data Chart Template for PowerPoint & Google Slides
Comparison Chart
Segmented Scatter Chart Data Visualization Template for PowerPoint & Google Slides
Business Strategy
Free Big Data Network Visualization Template for PowerPoint & Google Slides
Circular
Free
Syria Regional Data Map Infographic Template for PowerPoint & Google Slides
World Maps
Data Analysis Bar Chart with Insights Template for PowerPoint & Google Slides
Bar/Column
Free
Data Privacy template for PowerPoint & Google Slides
Information Technology
Data Protection Strategies template for PowerPoint & Google Slides
Information Technology
Comprehensive Data & AI Capability Model Template for PowerPoint & Google Slides
AI
Data Flywheel Strategy template for PowerPoint & Google Slides
Business
Data Privacy and Compliance in ML template for PowerPoint & Google Slides
Technology
AI and Data Ecosystem Map Template for PowerPoint & Google Slides
AI
Data Studio Insights template for PowerPoint & Google Slides
Business Report
Data Protection & Encryption in the Cloud Overview template for PowerPoint & Google Slides
Cloud Computing
First Party Data Overview Template for PowerPoint & Google Slides
Business
Business Data Table Template for PowerPoint & Google Slides
Table
Colorful Business Data Comparison Table Template for PowerPoint & Google Slides
Table
Six Column Data Table Template for PowerPoint & Google Slides
Table
Data Gap Analysis Template for PowerPoint & Google Slides
Business
Bar Data Chart Slide for PowerPoint & Google Slides
Bar/Column

Cone Data Chart for PowerPoint & Google Slides
Charts