Free Cycle Object Infographics template for PowerPoint & Google Slides
Description
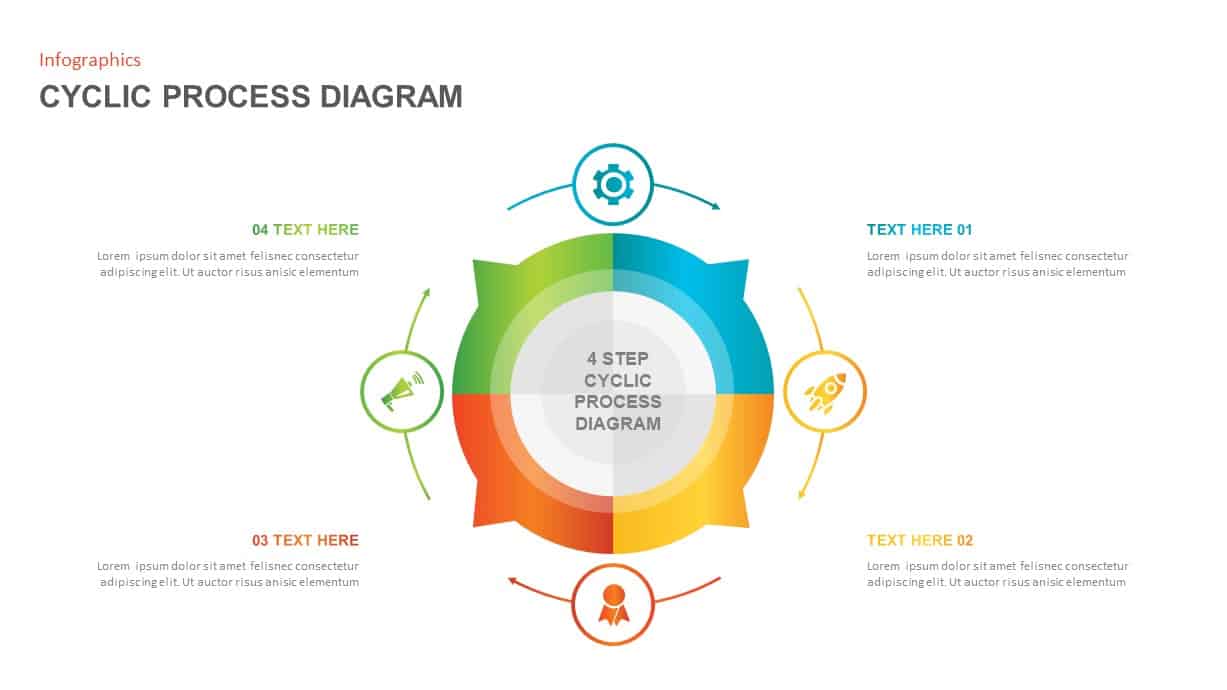
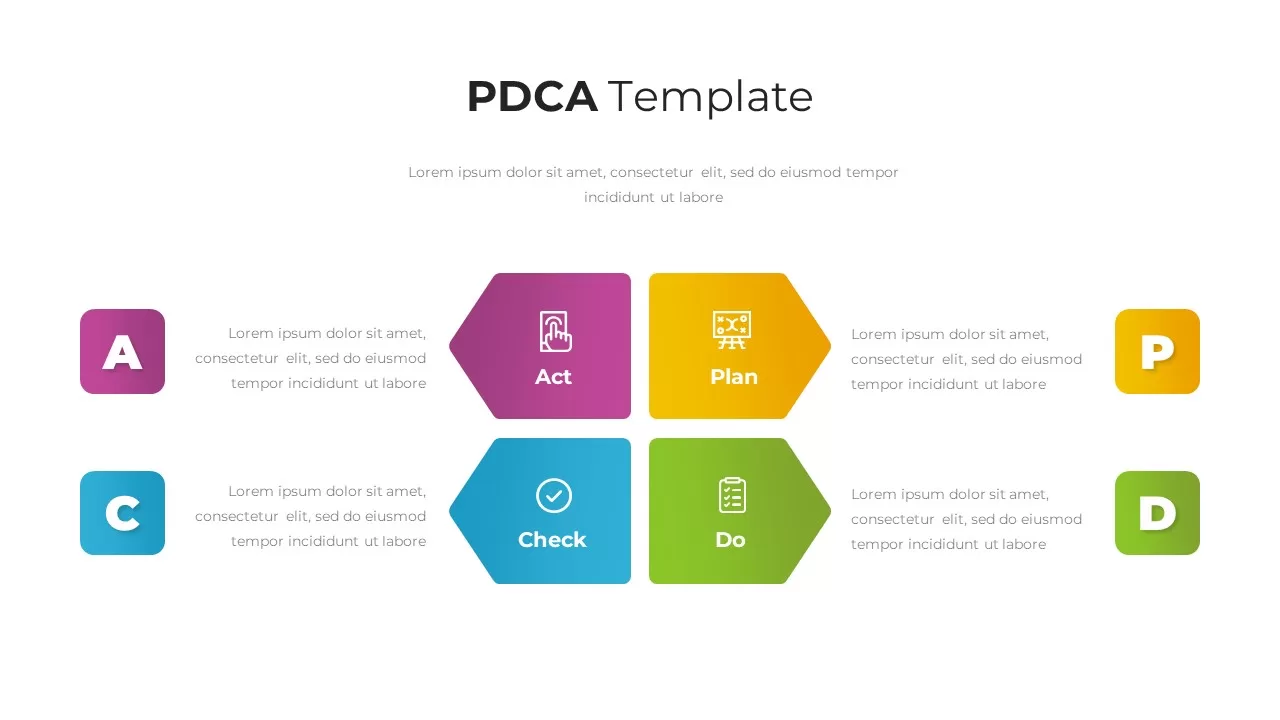
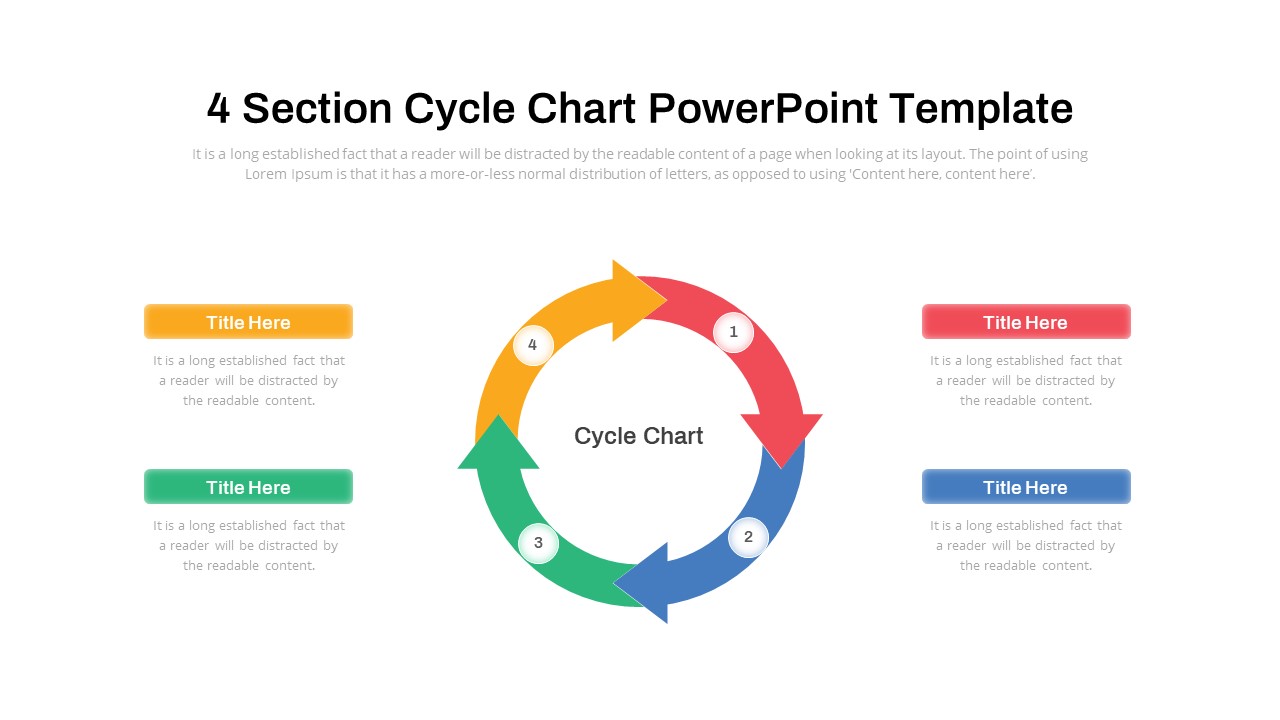
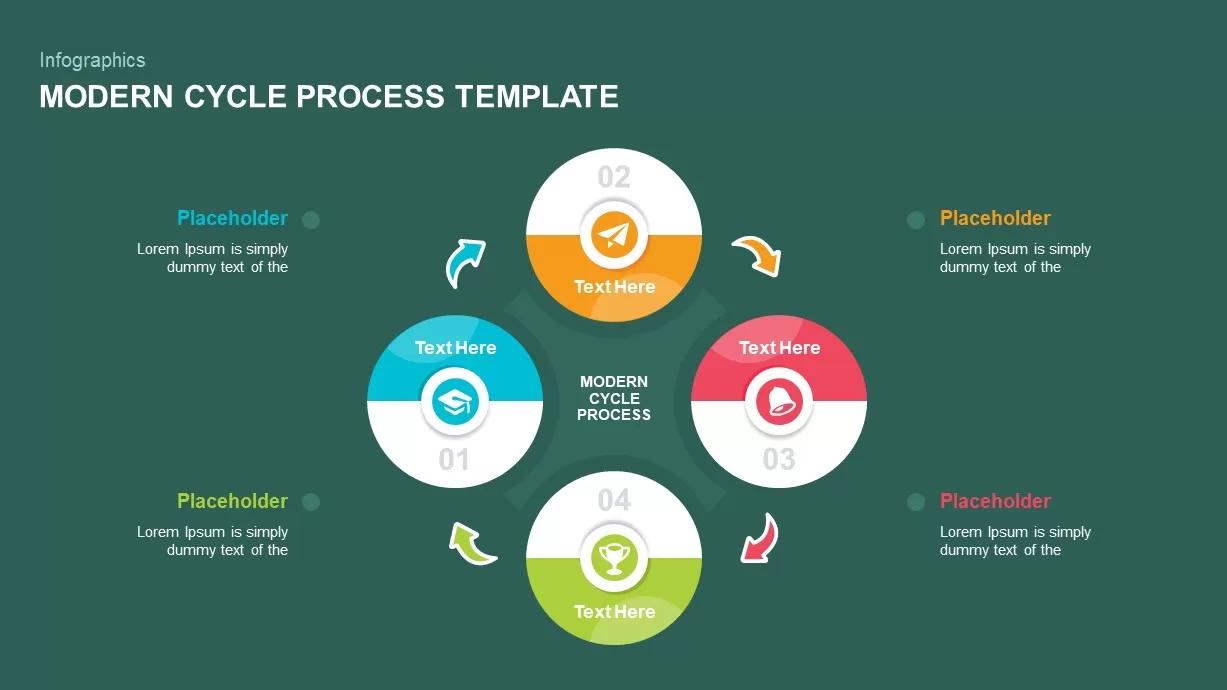
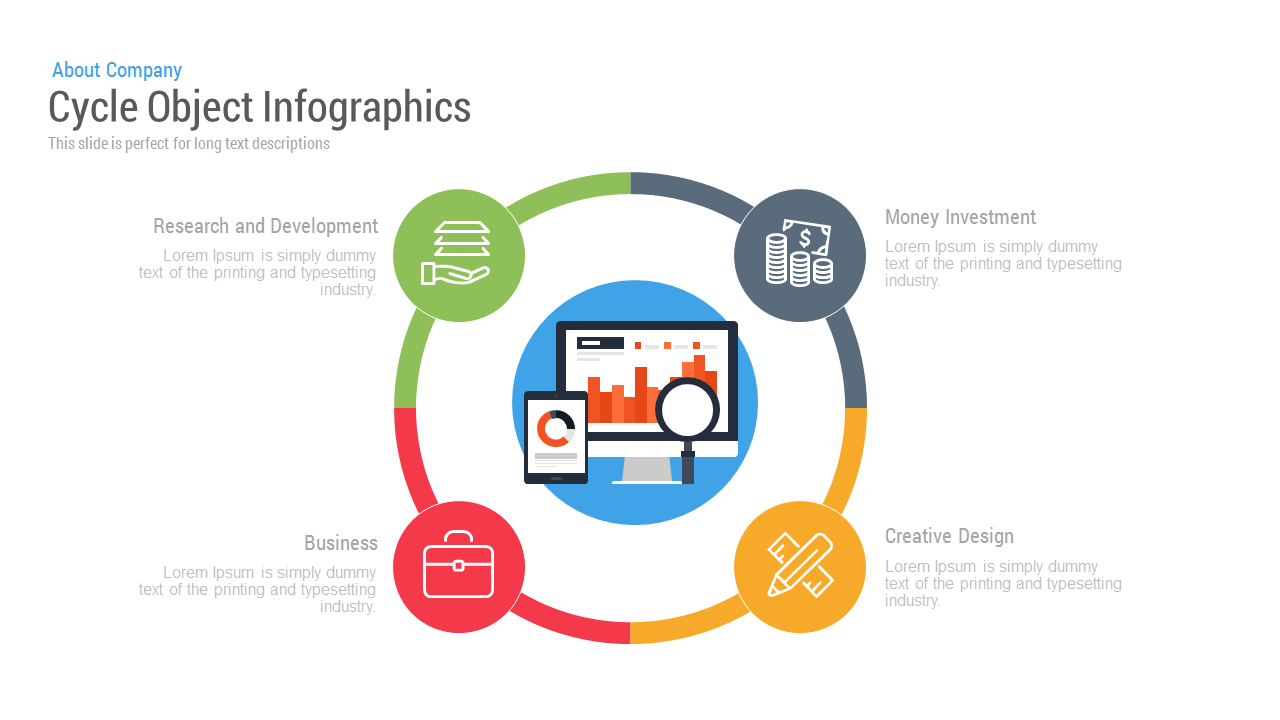
The Cycle Object Infographics slide is designed to represent cyclical processes or interconnected concepts, using a clean and visually engaging circular layout. This slide features four key stages—Research and Development, Money Investment, Creative Design, and Business—arranged around a central circle with a visual representing data analysis, such as graphs and screens. Each stage is color-coded (green, red, yellow, and blue) and paired with a relevant icon, making the structure visually clear and easy to follow.
This slide is perfect for demonstrating processes, workflows, or strategies that involve multiple interconnected stages. The central focus of the design helps to emphasize the cyclical nature of the information, making it ideal for discussing iterative processes, project phases, or feedback loops. The space within each section allows for detailed descriptions, ensuring that each stage of the cycle is clearly explained.
With its professional design and colorful accents, this slide is versatile and can be used in business, marketing, or educational contexts to showcase strategies, project developments, or product development processes.
Who is it for
This slide is ideal for project managers, business strategists, and marketers who need to present a multi-phase process or cycle. It’s also suitable for educators or trainers explaining interconnected steps in a system, workflow, or methodology.
Other Uses
This slide can be repurposed for visualizing business operations, product life cycles, customer journey maps, or service delivery processes. It’s flexible enough for various industries, including IT, marketing, finance, or education, wherever cyclical or process-driven information needs to be presented.
Login to download this file

Item ID
SBF00003
Related Templates

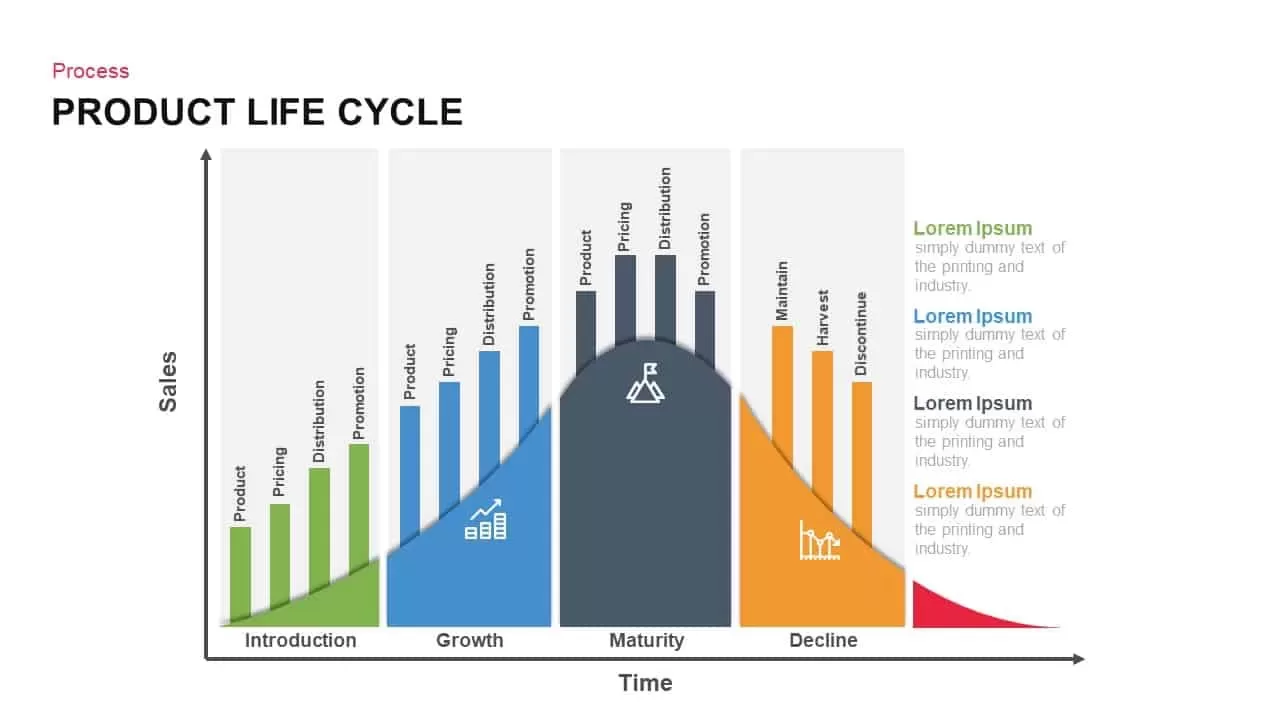
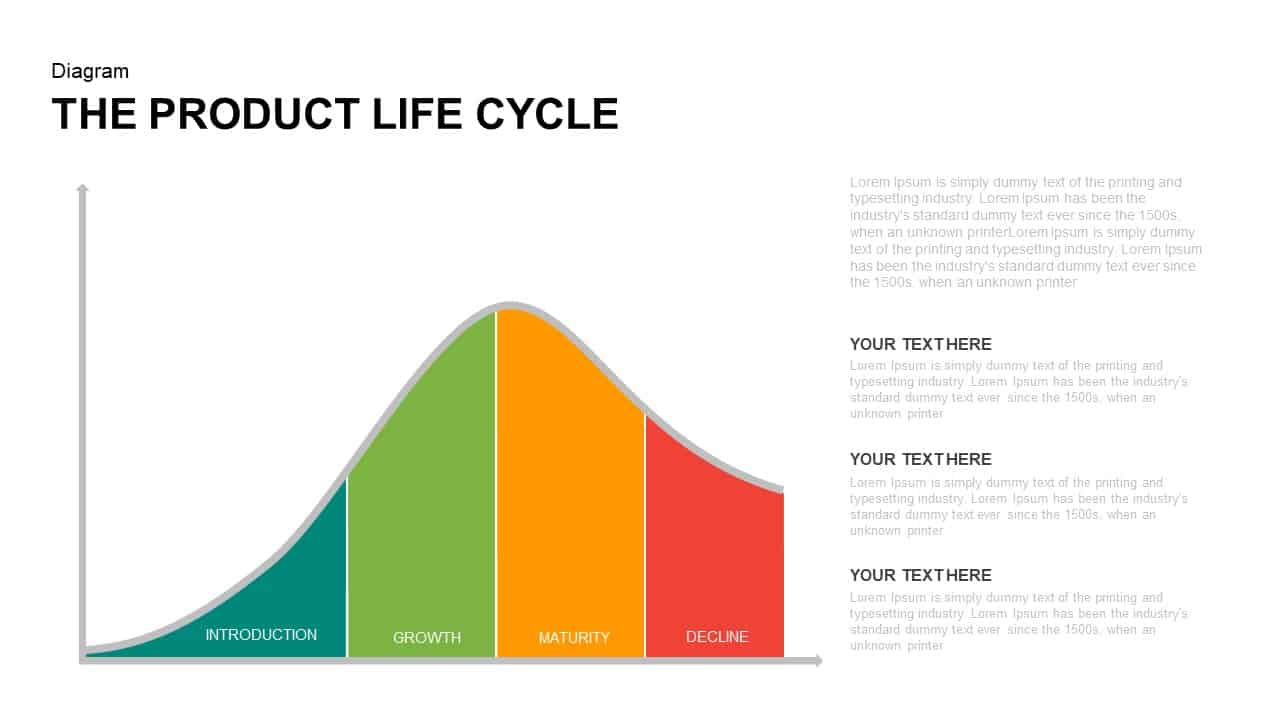
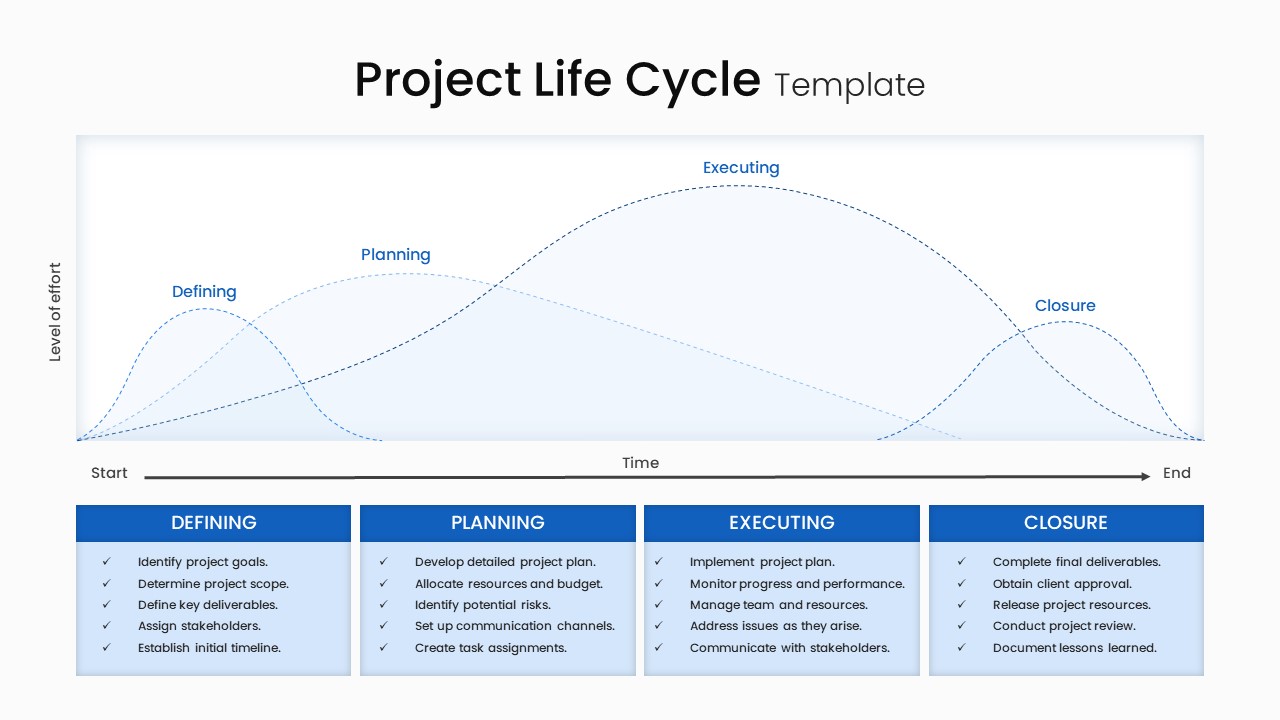
Product Life Cycle Infographics template for PowerPoint & Google Slides
Business

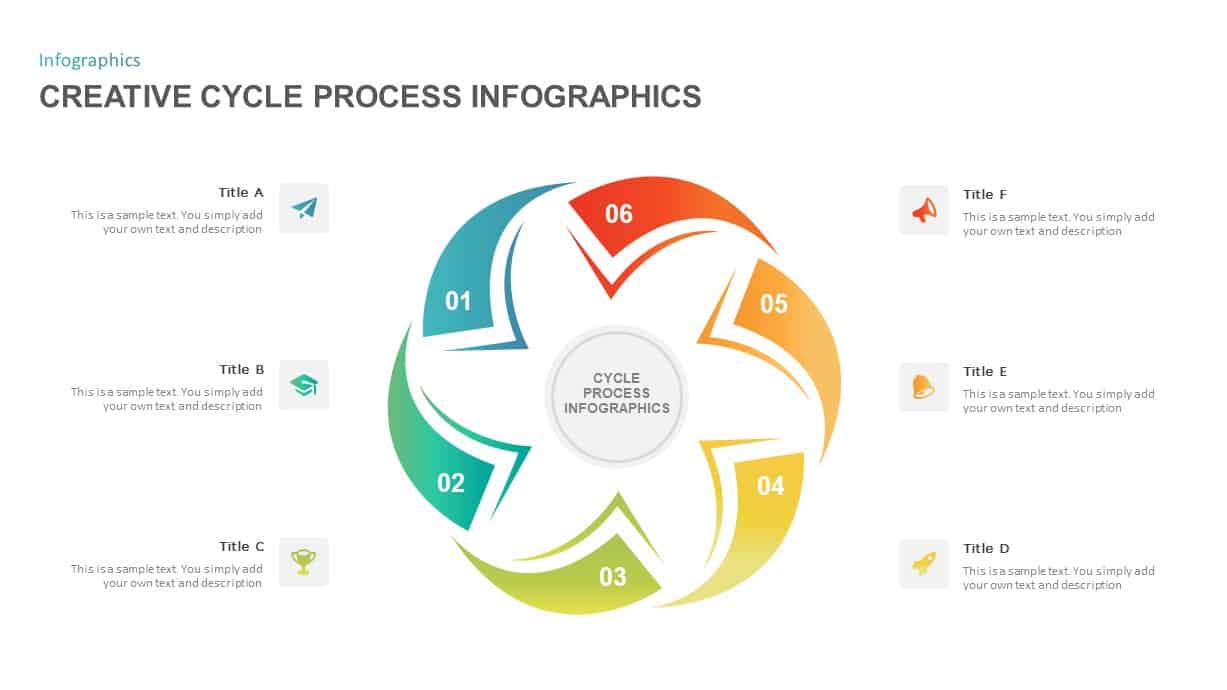
Creative Cycle Process Infographics Template for PowerPoint & Google Slides
Process
Free Time Management Clock Cycle Diagram Template for PowerPoint & Google Slides
Process
Free
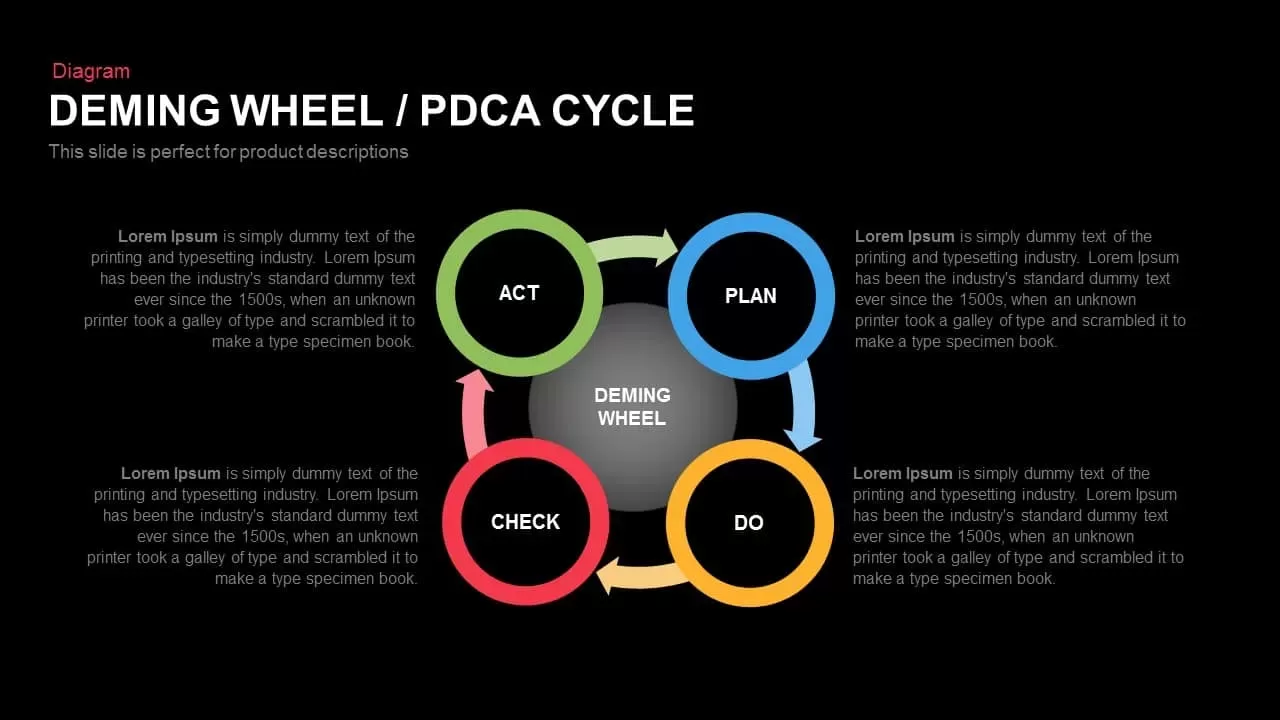
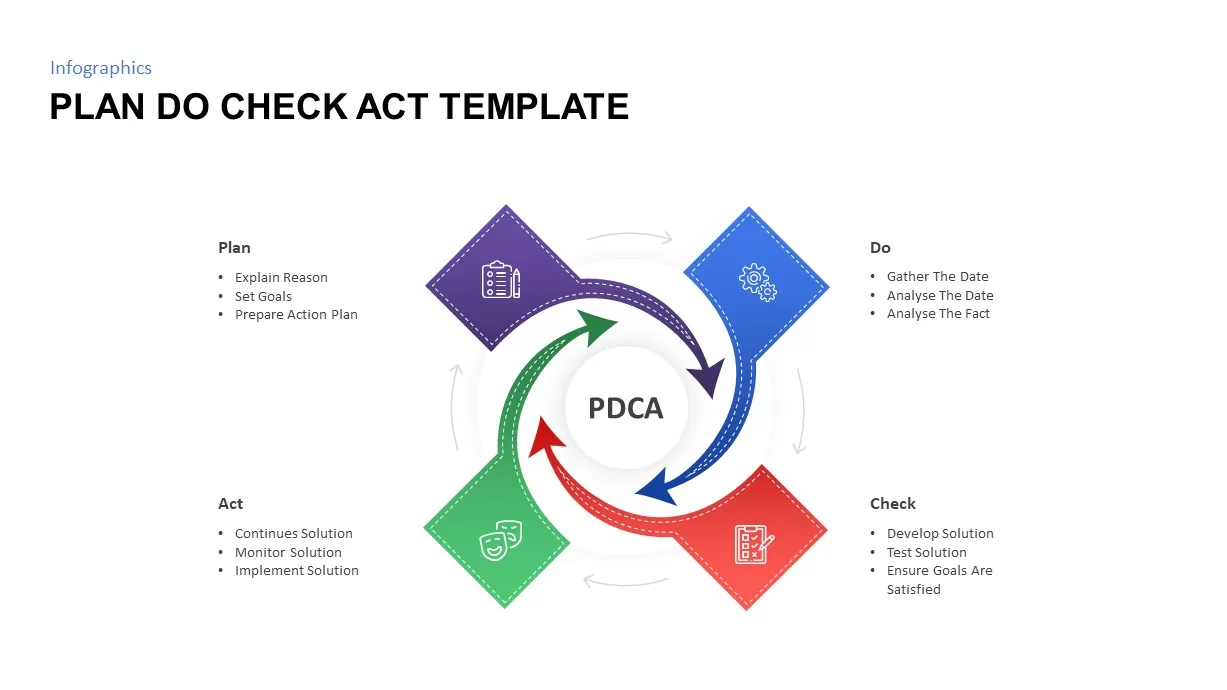
Deming Wheel PDCA Cycle Diagram Template for PowerPoint & Google Slides
Business Plan
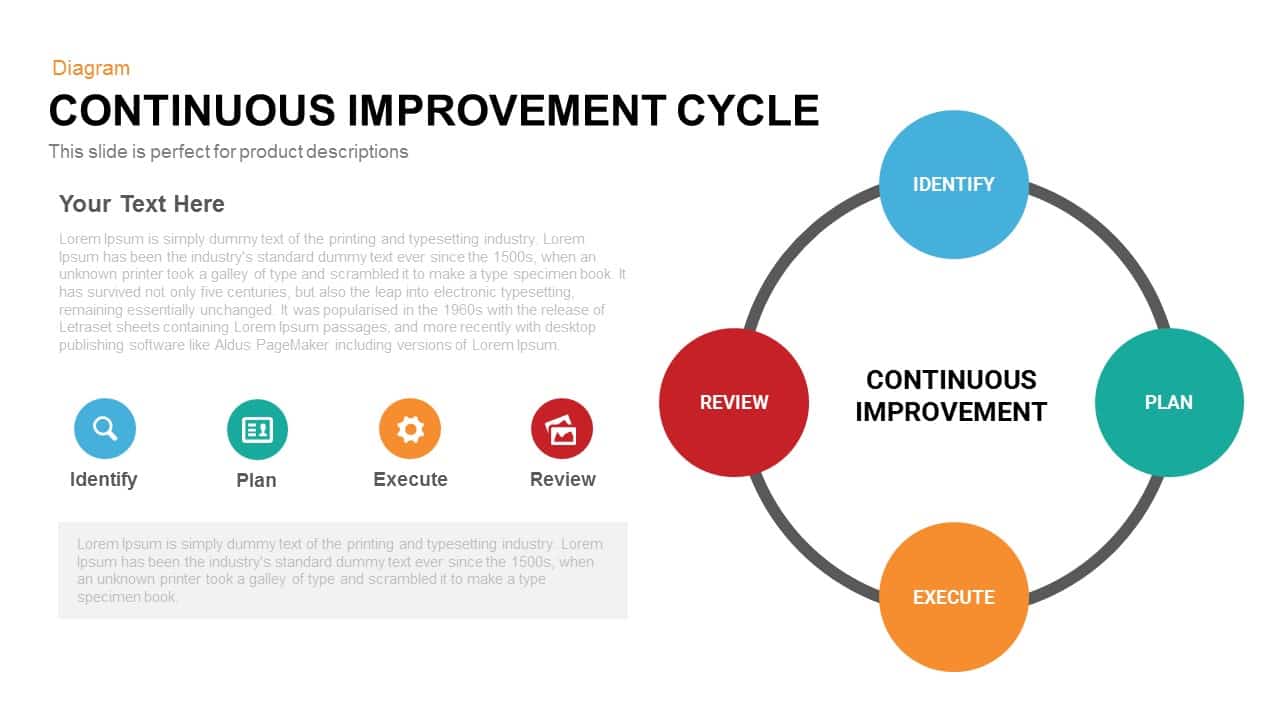
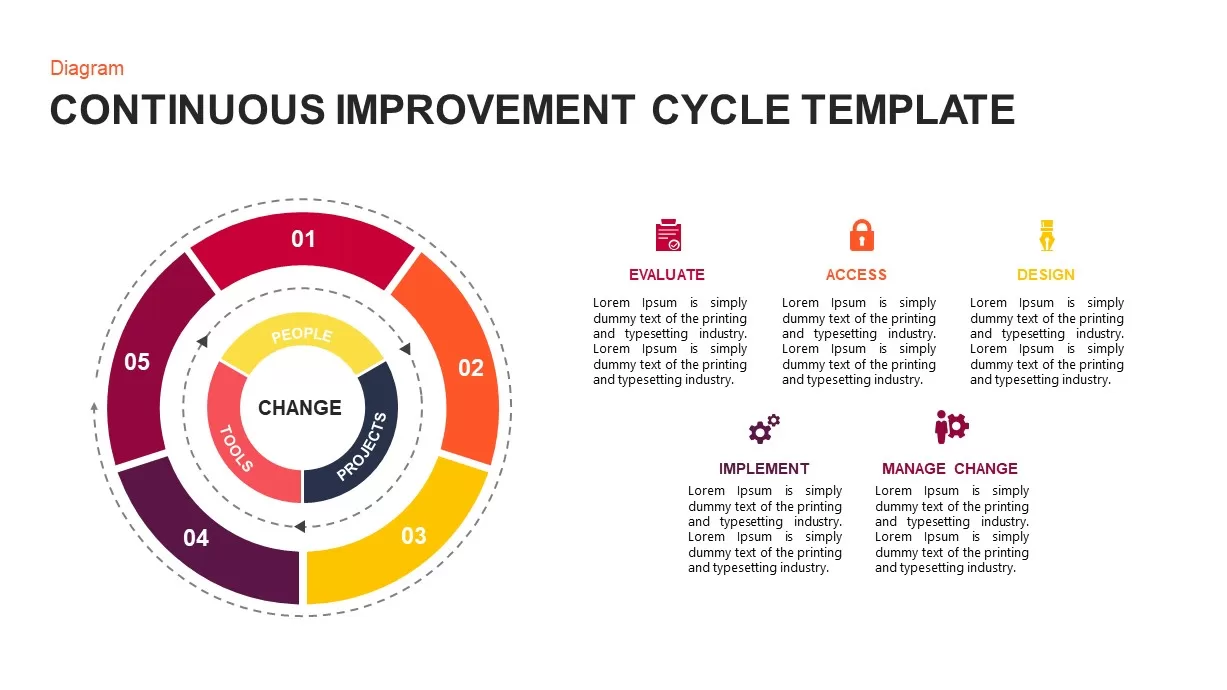
Continuous Improvement Cycle Diagram Template for PowerPoint & Google Slides
Circular
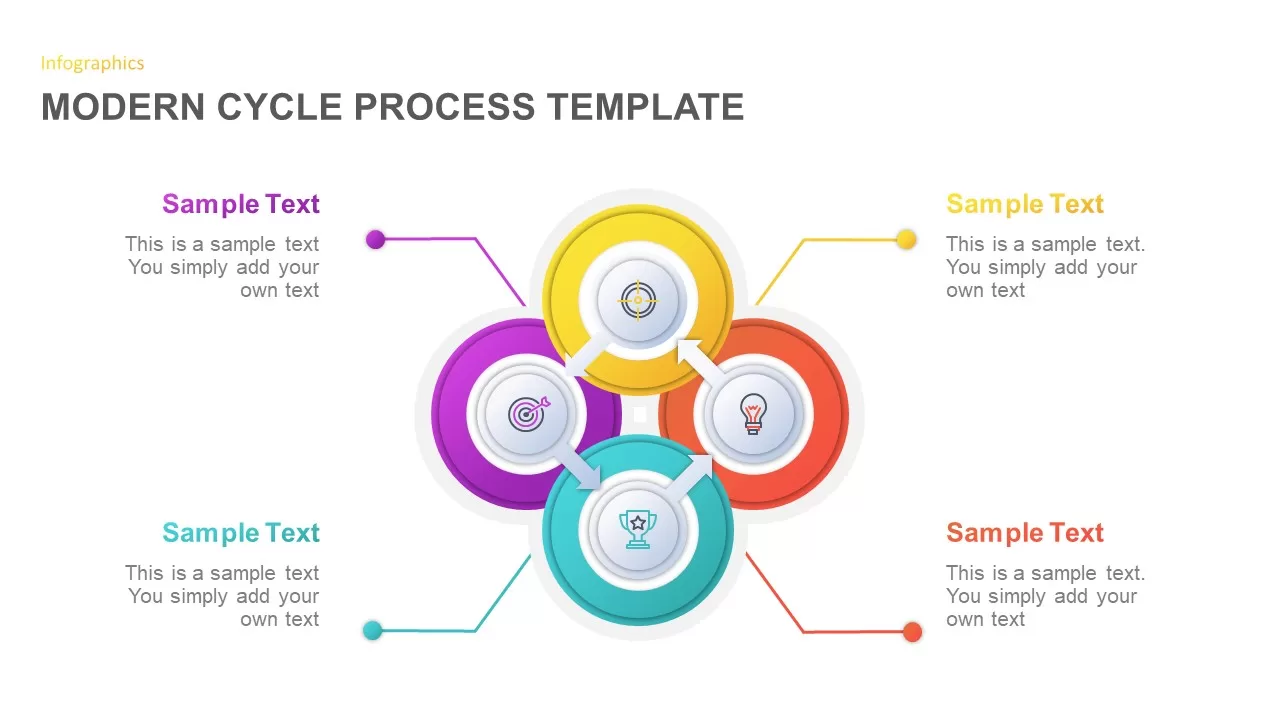
Modern Five-Stage Cycle Process Diagram Template for PowerPoint & Google Slides
Process
Six-Stage Circular Cycle Diagram Template for PowerPoint & Google Slides
Process
Four-Point Arrow Cycle Diagram Template for PowerPoint & Google Slides
Arrow

Data-Driven Marketing Cycle Diagram Template for PowerPoint & Google Slides
Customer Journey
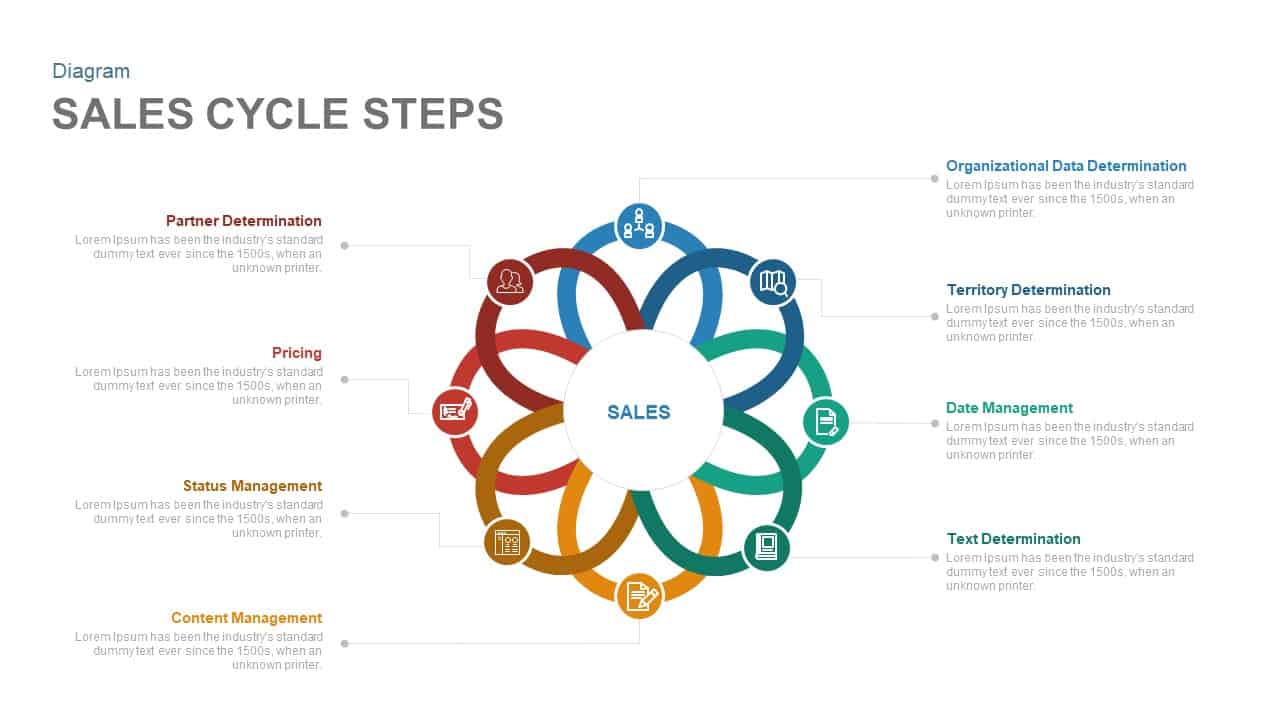
Eight-Step Sales Cycle Diagram Template for PowerPoint & Google Slides
Process
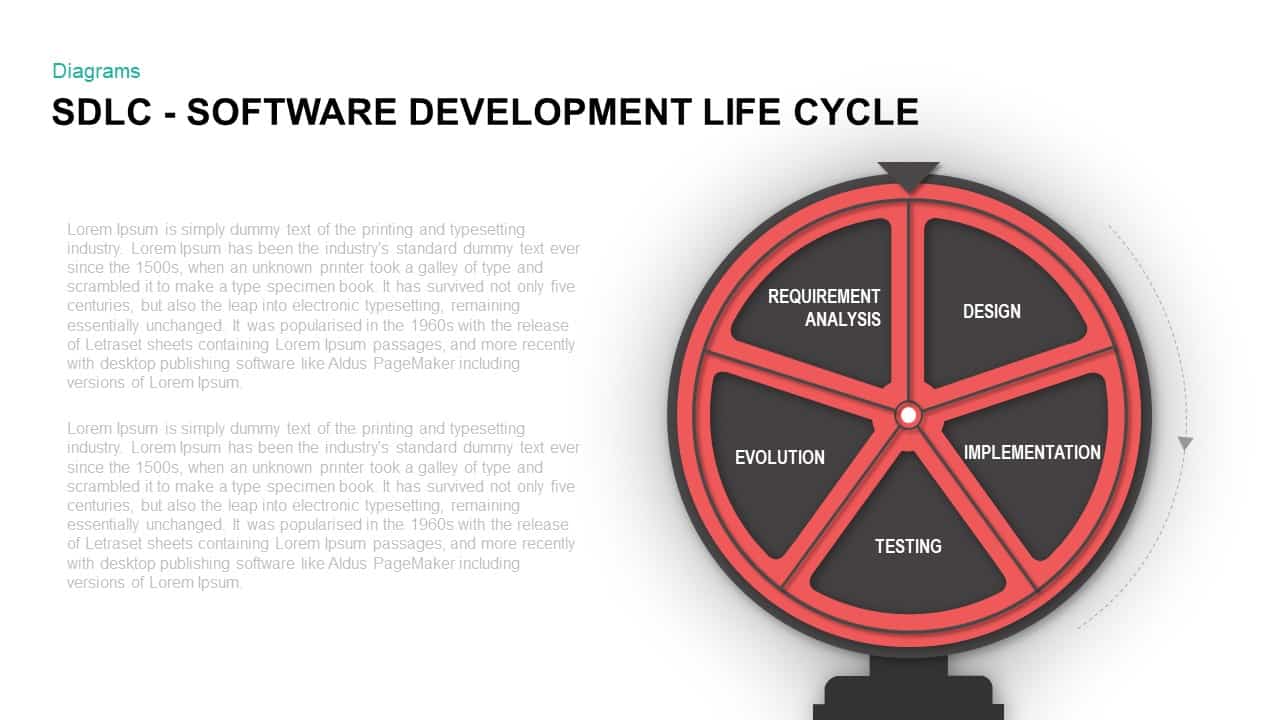
Software Development Life Cycle Diagram Template for PowerPoint & Google Slides
Circular
Performance Review Process Management Cycle template for PowerPoint & Google Slides
Employee Performance
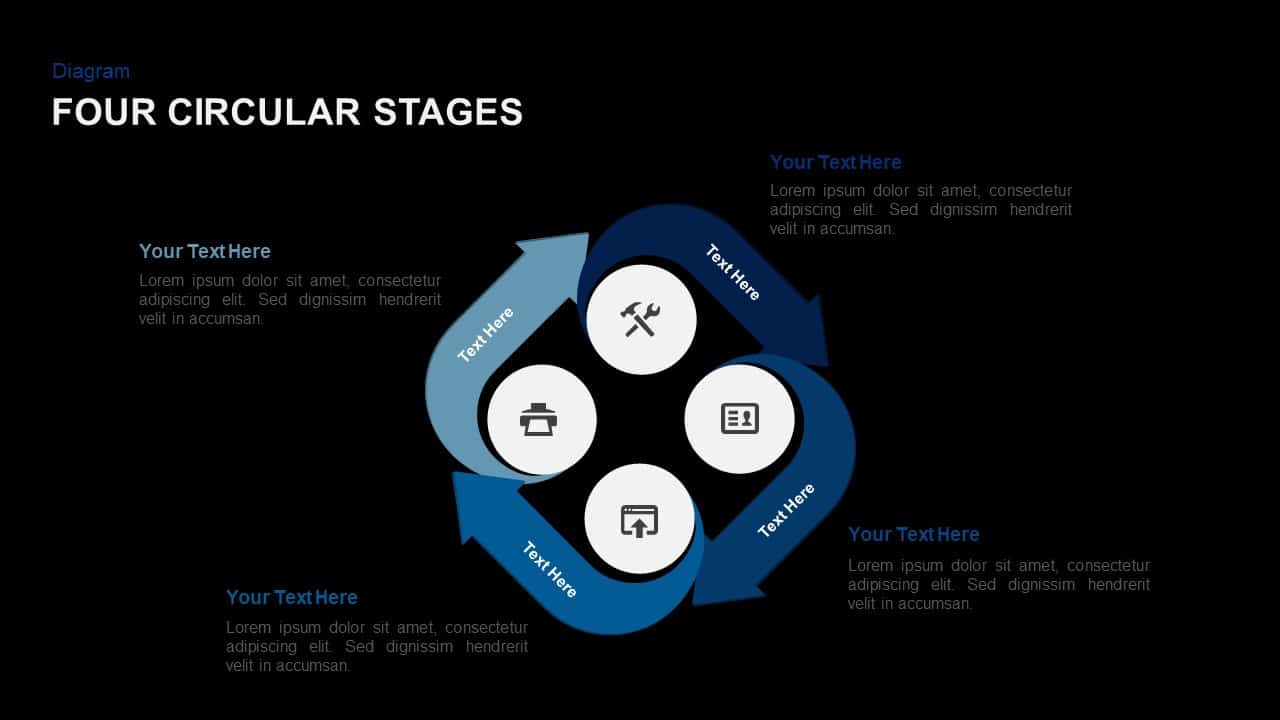
3, 4 & 5 Circular Stages Cycle Diagram Deck Template for PowerPoint & Google Slides
Circular
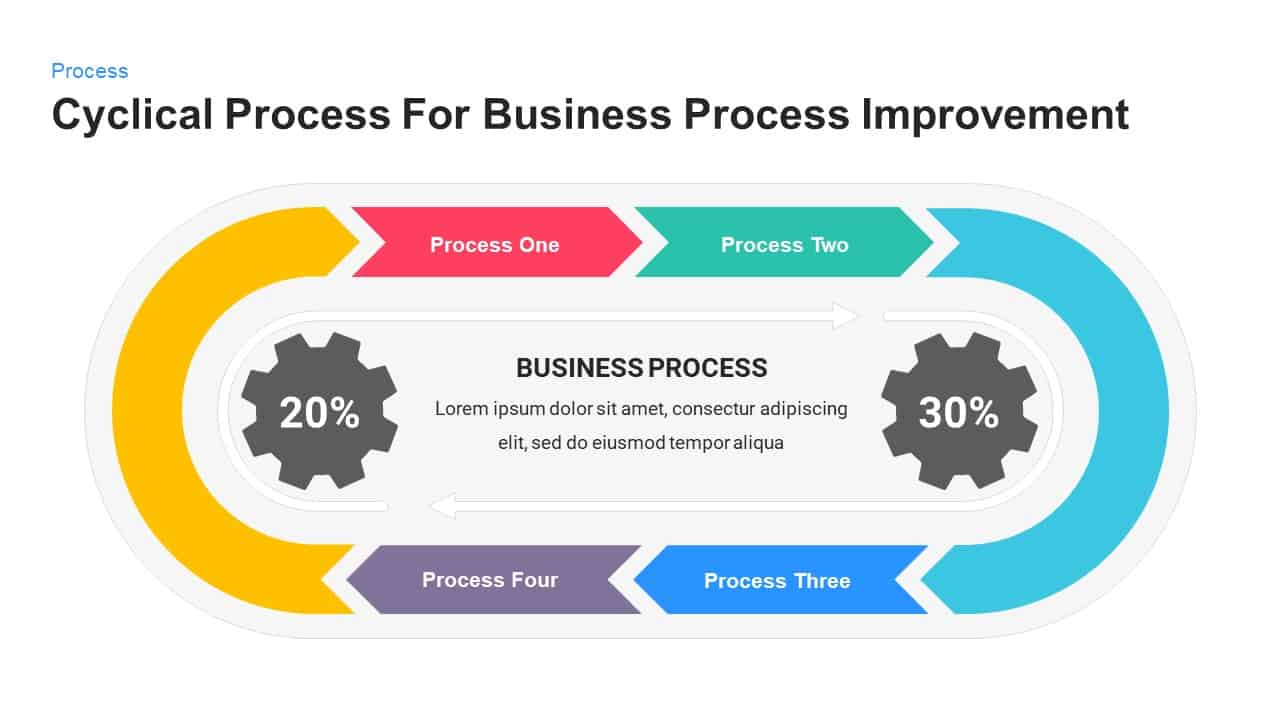
Business Process Improvement Cycle Template for PowerPoint & Google Slides
Process
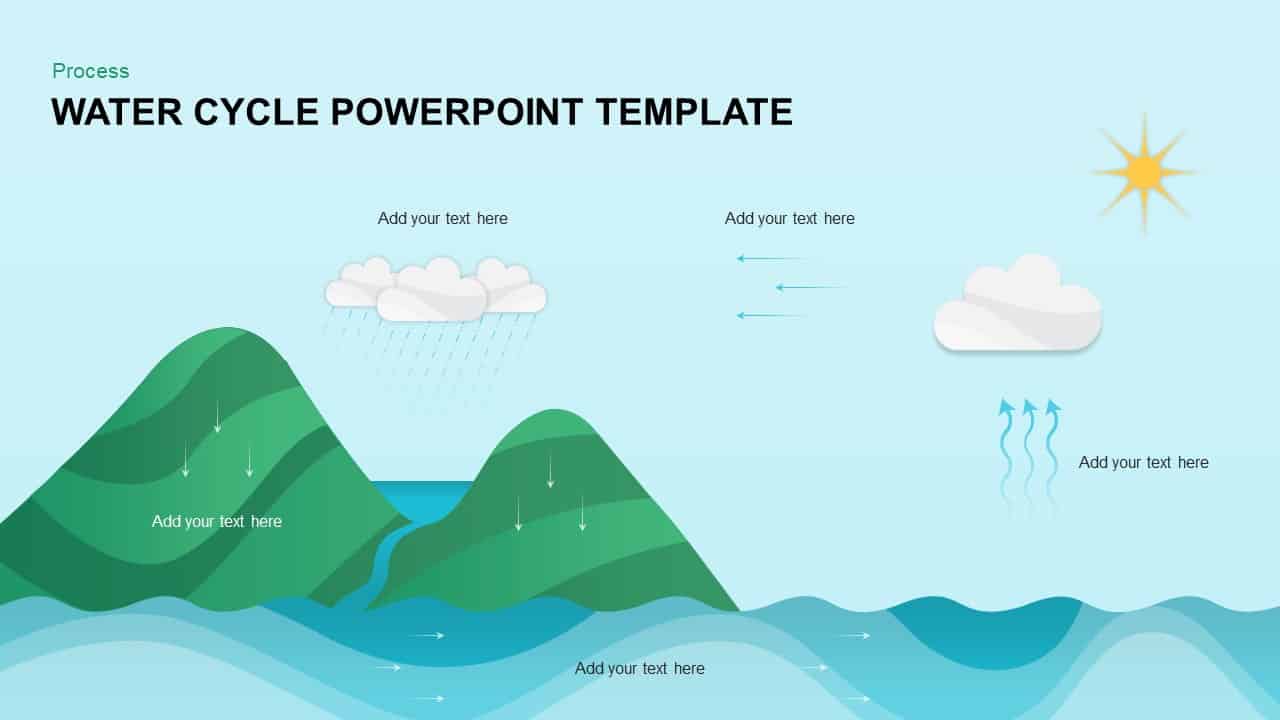
Water Cycle Process Infographic Template for PowerPoint & Google Slides
Process
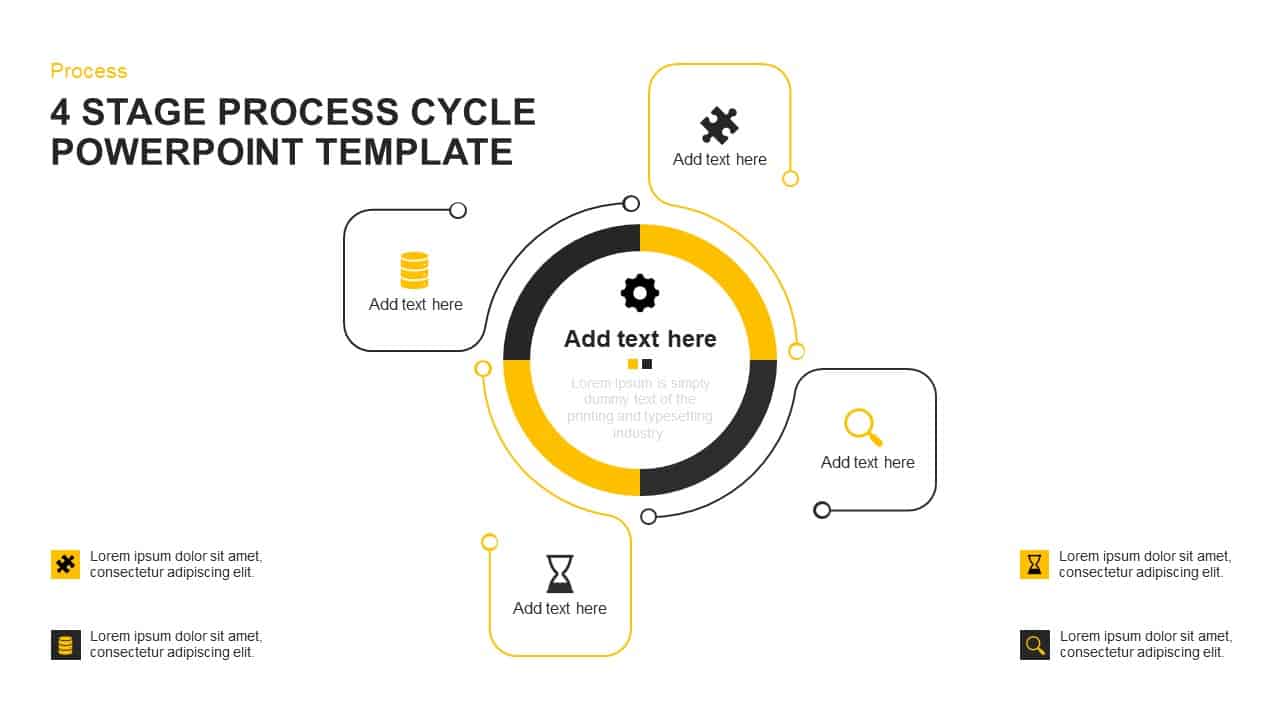
Four-Stage Cycle Process Diagram Template for PowerPoint & Google Slides
Process
Four-Stage Process Cycle Variations Pack Template for PowerPoint & Google Slides
Process
Data Migration Life Cycle Curved Diagram Template for PowerPoint & Google Slides
Process
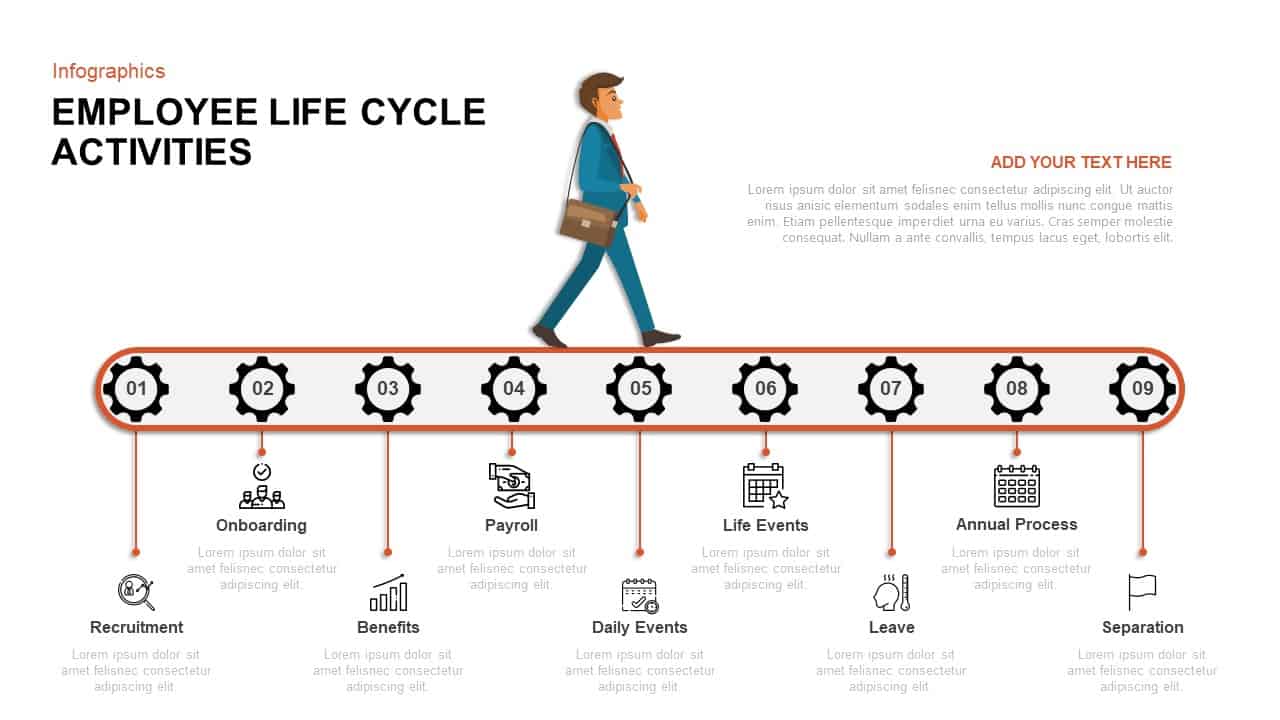
Employee Life Cycle Activities Template for PowerPoint & Google Slides
Timeline
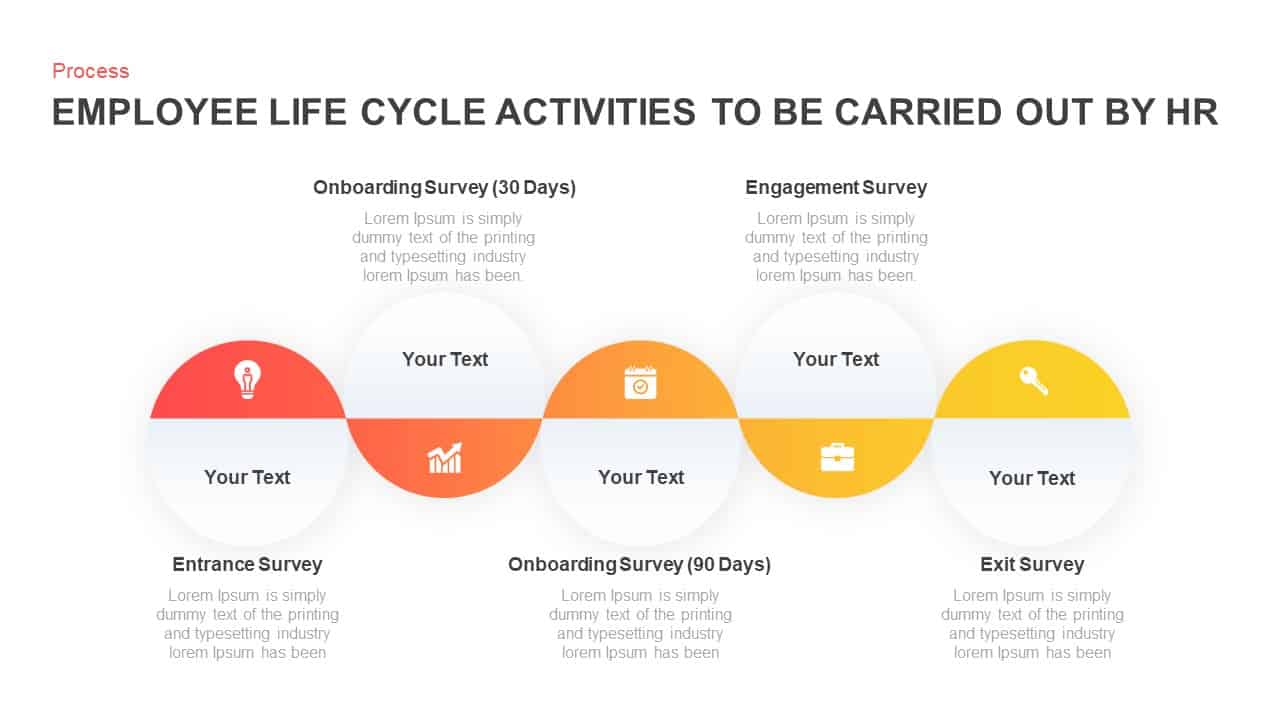
Employee Life Cycle Activities Process Template for PowerPoint & Google Slides
Employee Performance
Business Process Improvement Cycle Template for PowerPoint & Google Slides
Circular
8-Step Circular Accounting Cycle Diagram Template for PowerPoint & Google Slides
Accounting
Multi-Style Project Life Cycle Diagram Template for PowerPoint & Google Slides
Process
Supply and Demand Creation Cycle Diagram Template for PowerPoint & Google Slides
Process
Strategic ADL Matrix by Industry Life Cycle & Position Template for PowerPoint & Google Slides
Business Strategy
Modern 6-Step Cycle Diagram Slide Deck Template for PowerPoint & Google Slides
Process
Corporate Product Life Cycle Diagram Template for PowerPoint & Google Slides
Process
Plan Do Check Act PDCA Cycle Infographic Template for PowerPoint & Google Slides
Process
Enterprise Risk Management Cycle Diagram Template for PowerPoint & Google Slides
Process
4MAT Learning Cycle Circular Diagram Template for PowerPoint & Google Slides
Circular
4-Step Circular PDCA Cycle Diagram Template for PowerPoint & Google Slides
Process
Continuous Improvement Cycle Diagram Template for PowerPoint & Google Slides
Process
Modern Cycle Process Template for PowerPoint & Google Slides
Business Proposal
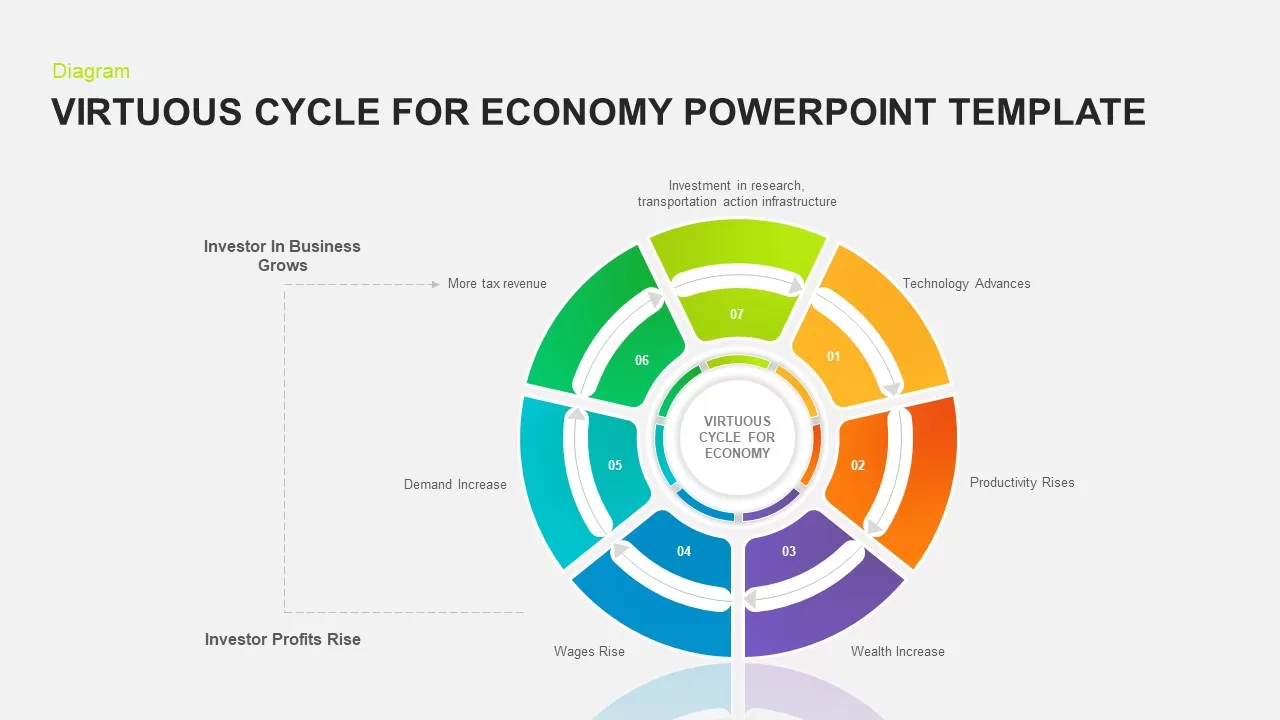
7-Step Virtuous Economy Cycle Diagram Template for PowerPoint & Google Slides
Process
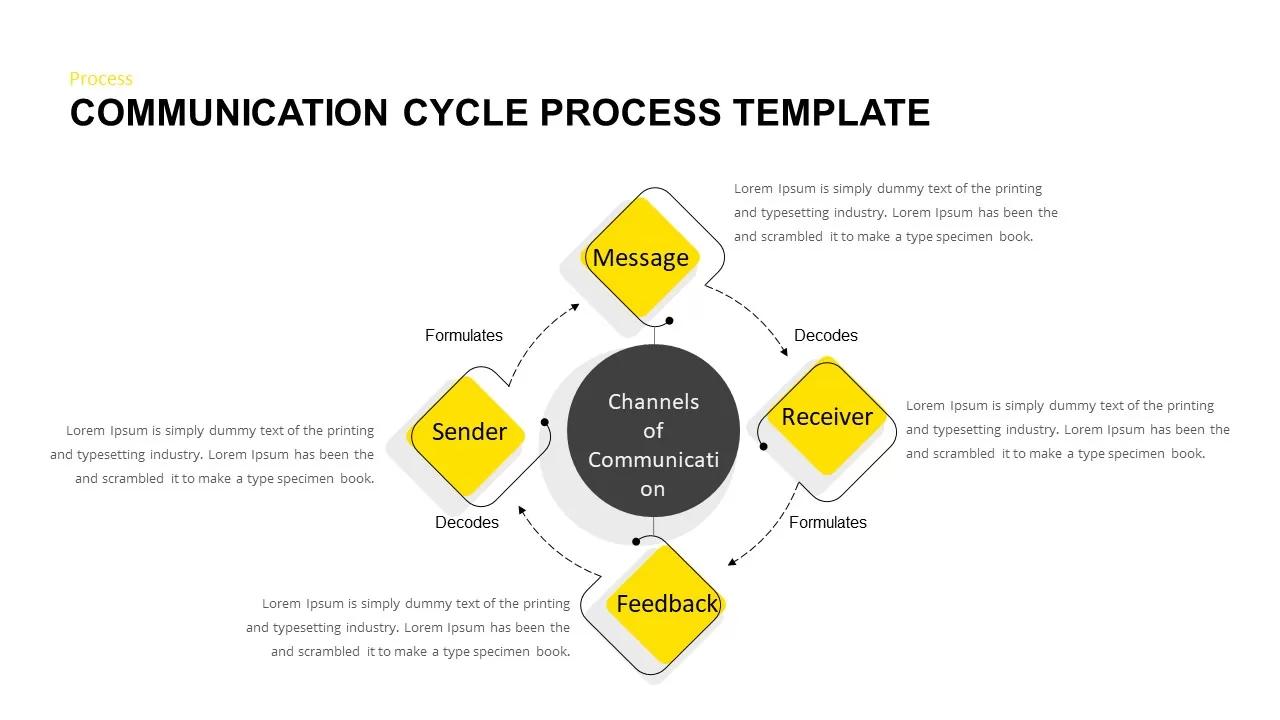
Communication Cycle Process Diagram template for PowerPoint & Google Slides
Business
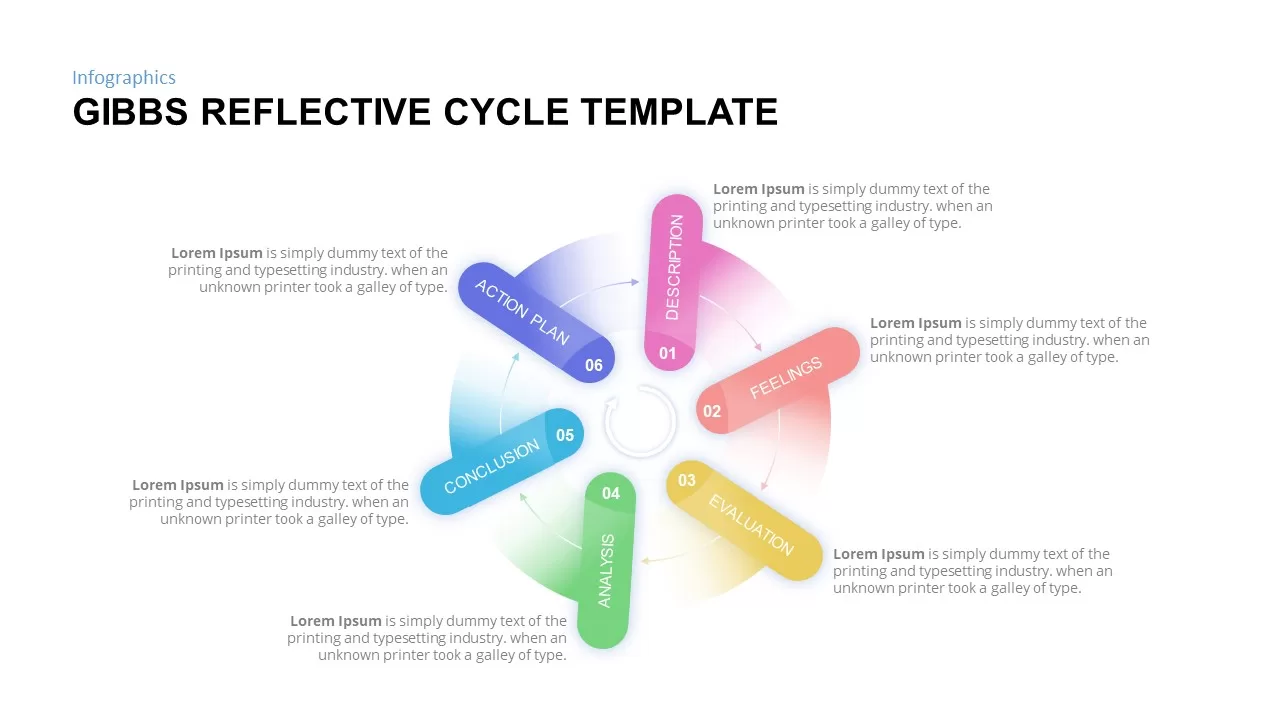
Gibbs Reflective Cycle Overview Template for PowerPoint & Google Slides
Process
Concentric Circular Arrow Cycle Diagram Template for PowerPoint & Google Slides
Process
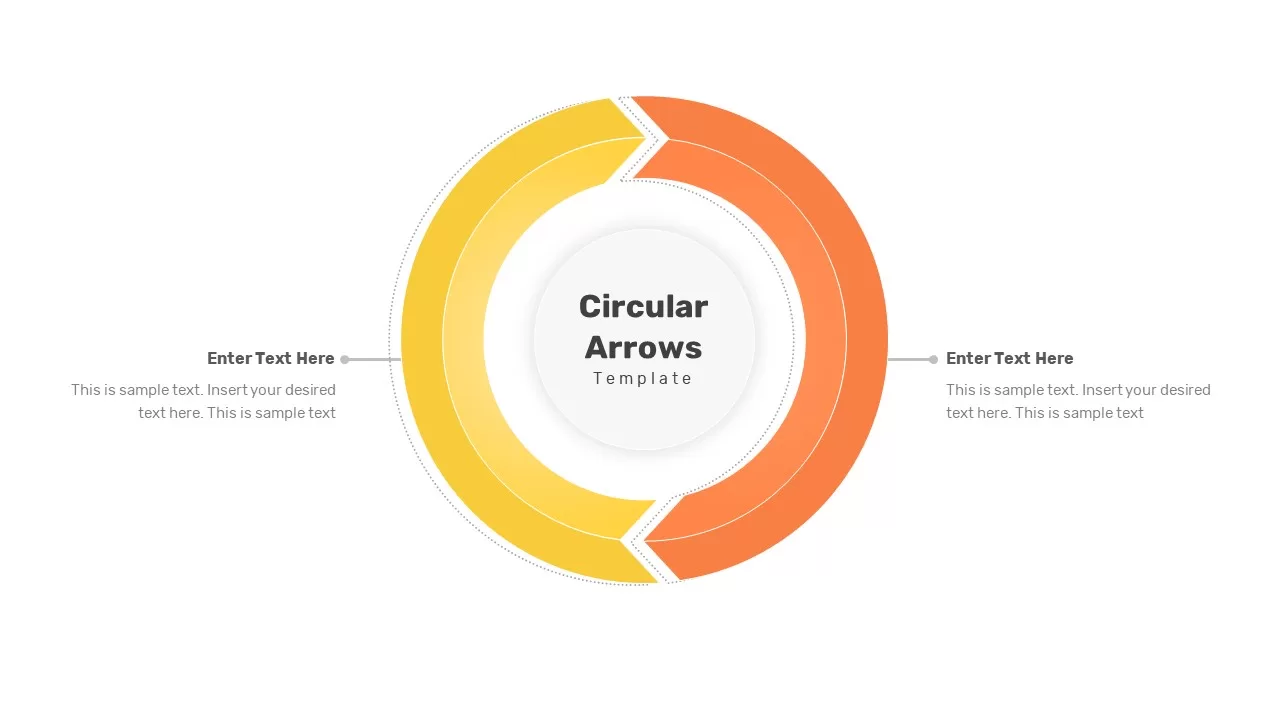
Dual-Stage Circular Arrow Cycle Template for PowerPoint & Google Slides
Process
Three-Segment Circular Arrow Cycle Template for PowerPoint & Google Slides
Circular
Four-Segment Circular Arrow Cycle Template for PowerPoint & Google Slides
Circular
Six-Segment Circular Arrow Cycle Template for PowerPoint & Google Slides
Circular
PDCA Cycle Infographic with Four Stages Template for PowerPoint & Google Slides
Process
PDCA Plan Do Check Act Cycle Infographic Template for PowerPoint & Google Slides
Process
PDCA Four-Stage Cycle Infographic Template for PowerPoint & Google Slides
Process
Robotics Process Cycle Infographic Template for PowerPoint & Google Slides
Process
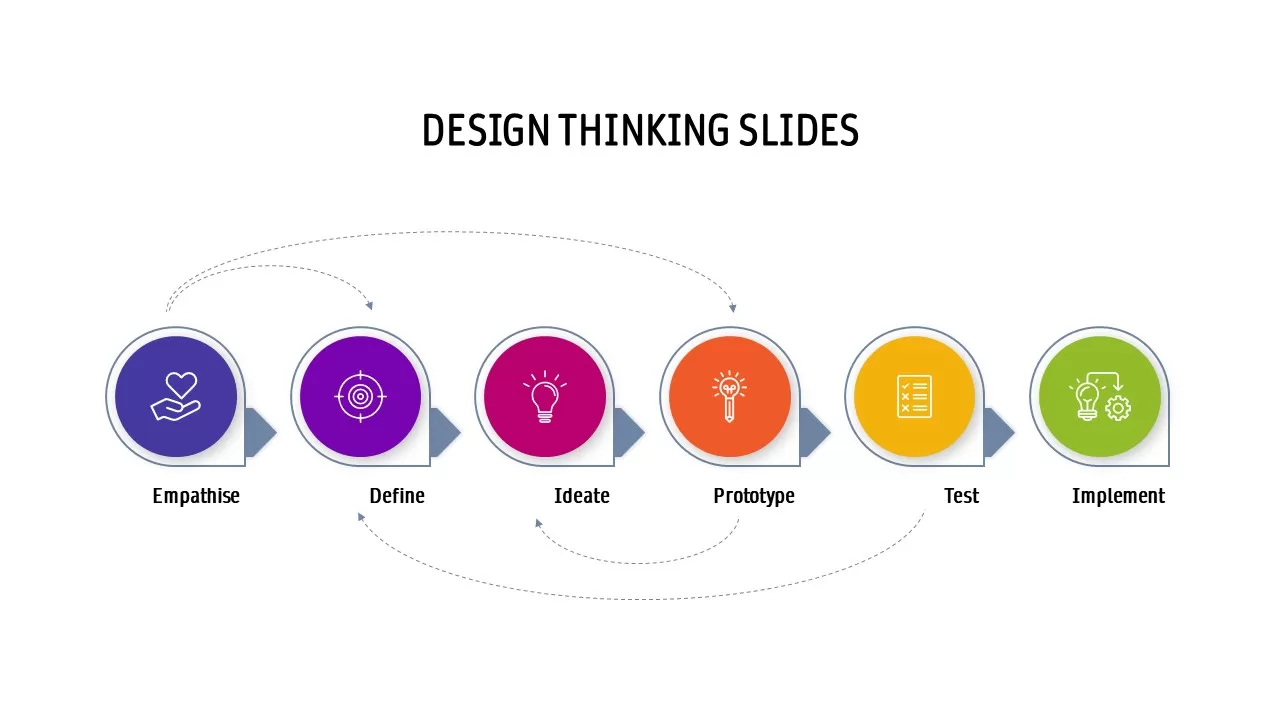
Design Thinking Process Cycle Slide Template for PowerPoint & Google Slides
Process
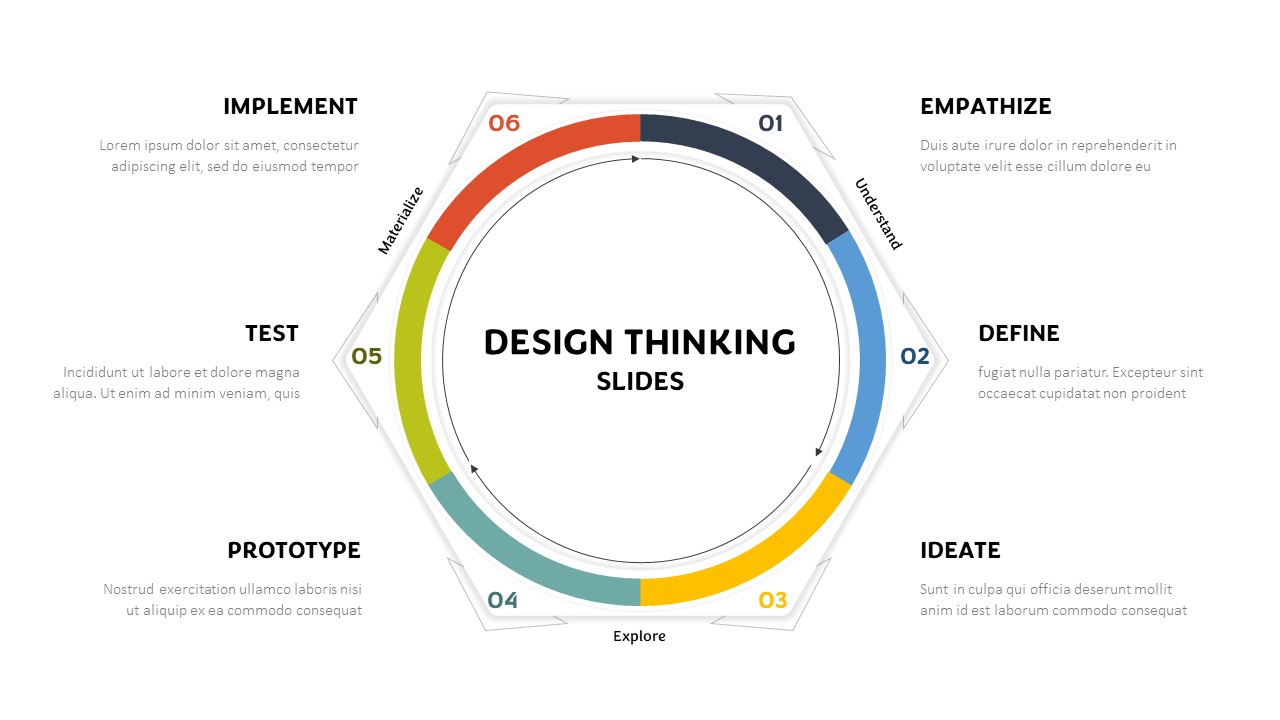
Hexagonal Design Thinking Cycle Template for PowerPoint & Google Slides
Process
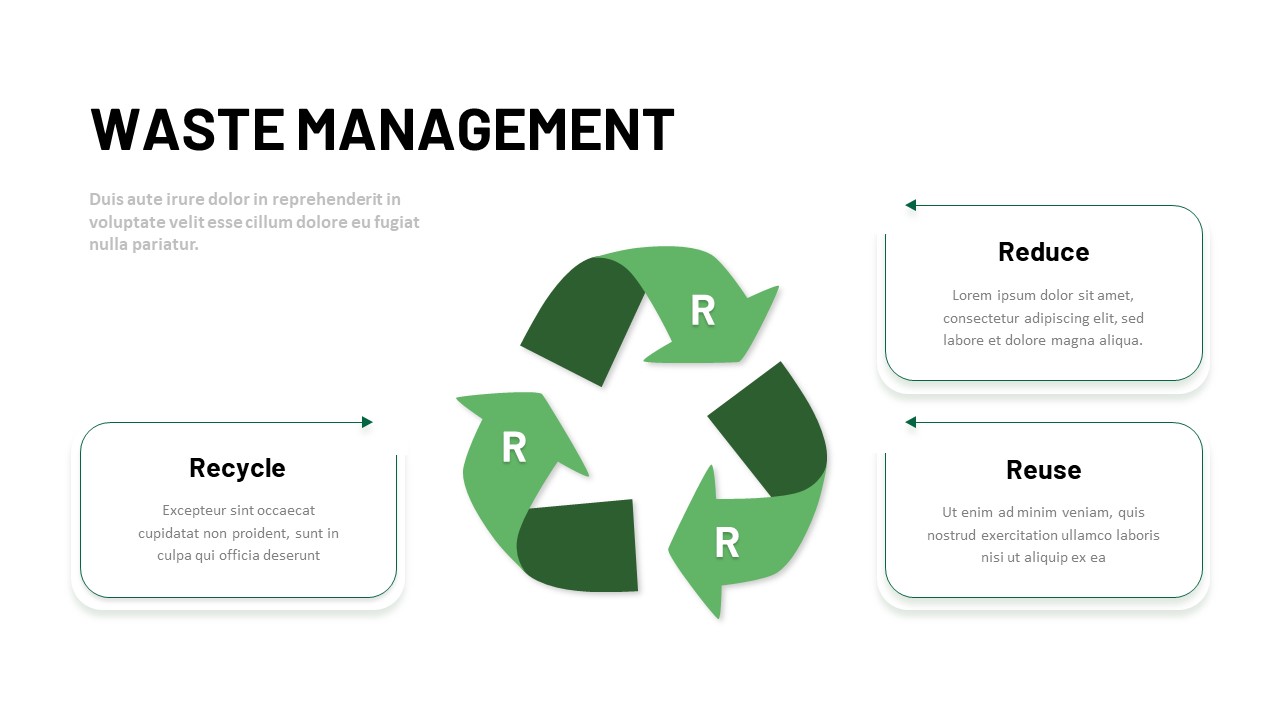
3R Waste Management Cycle Diagram Template for PowerPoint & Google Slides
Circular
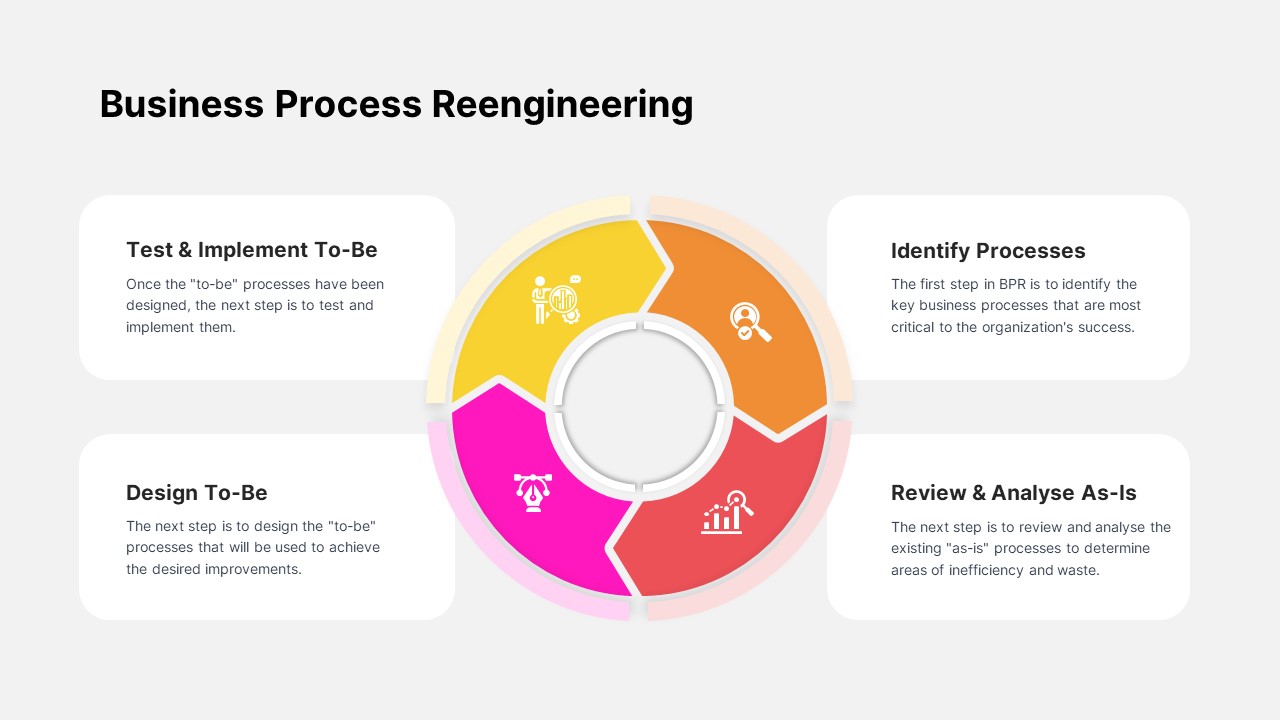
Business Process Reengineering Cycle Template for PowerPoint & Google Slides
Circular
Strategic Dialogue Model Cycle Template for PowerPoint & Google Slides
Circular
3R Waste Management Cycle Overview template for PowerPoint & Google Slides
Process
Release Management Cycle Circular Diagram Template for PowerPoint & Google Slides
Software Development
Business Process Analysis Cycle Diagram Template for PowerPoint & Google Slides
Business Strategy
Iterative Strategic Planning Cycle Template for PowerPoint & Google Slides
Business Strategy
Cycle Chart Template for PowerPoint & Google Slides
Circular
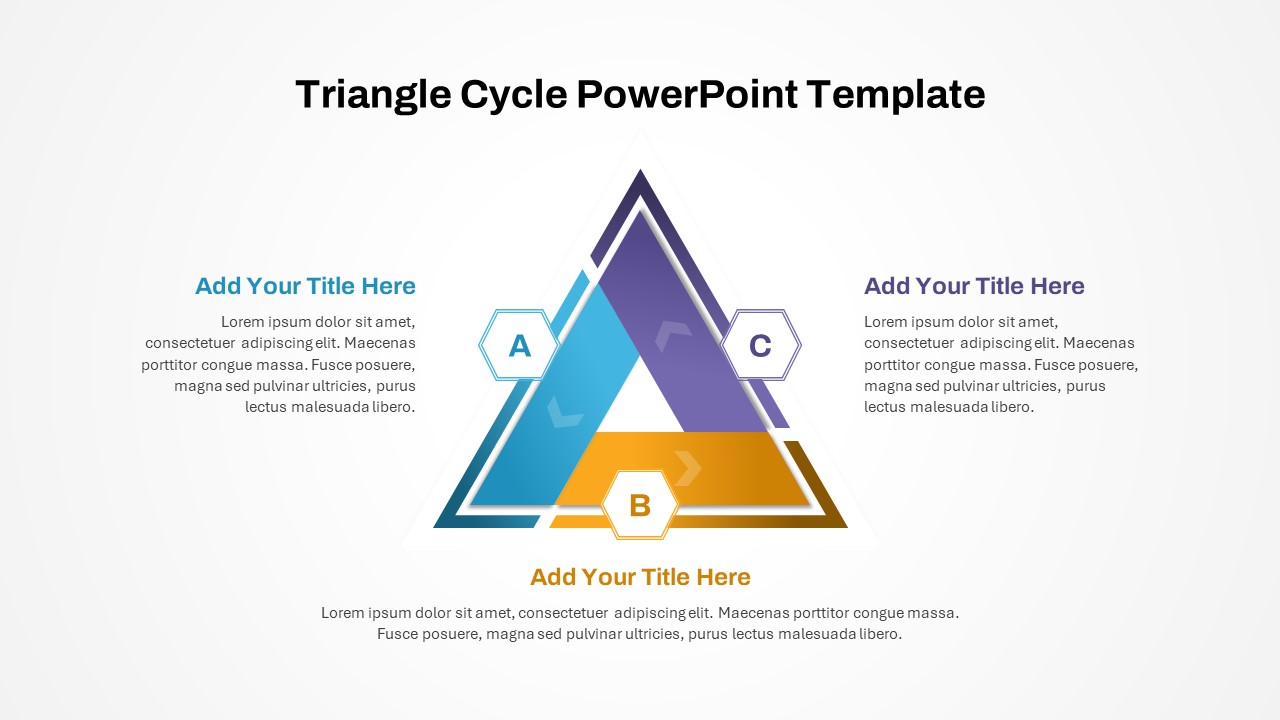
Three-Phase Triangle Cycle Diagram Template for PowerPoint & Google Slides
Infographics
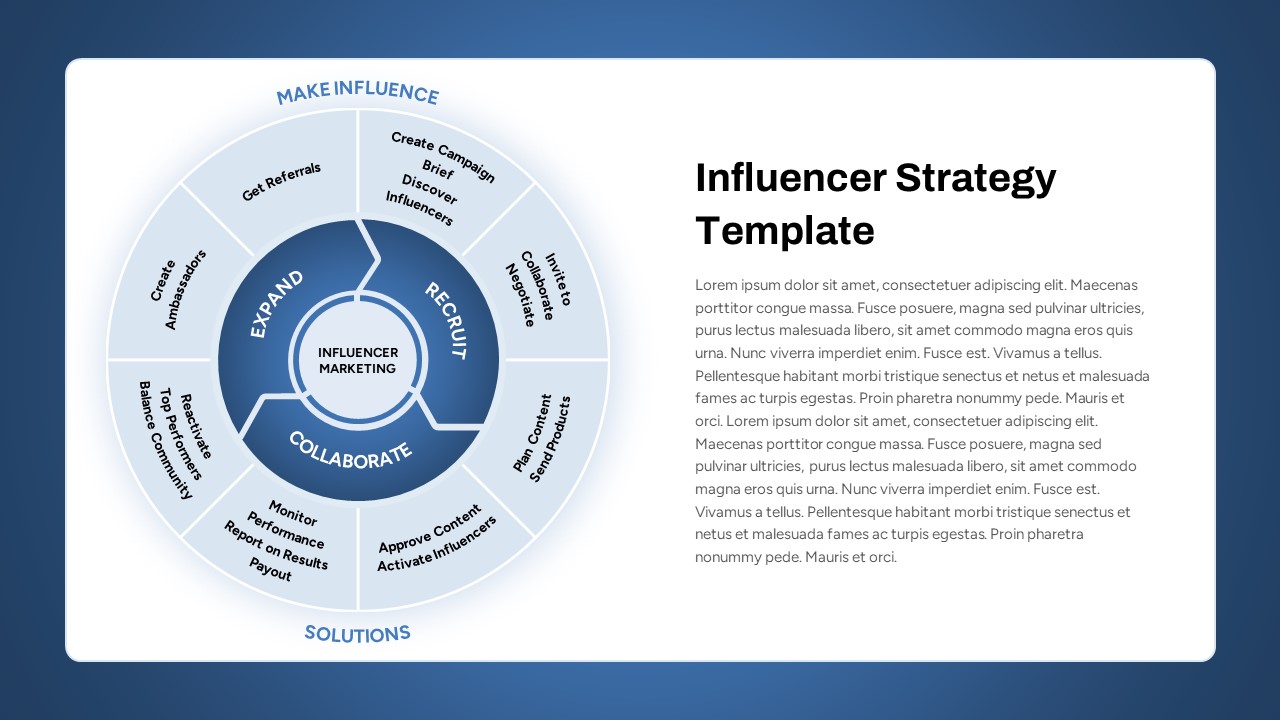
Influencer Marketing Cycle Strategy Template for PowerPoint & Google Slides
Circular
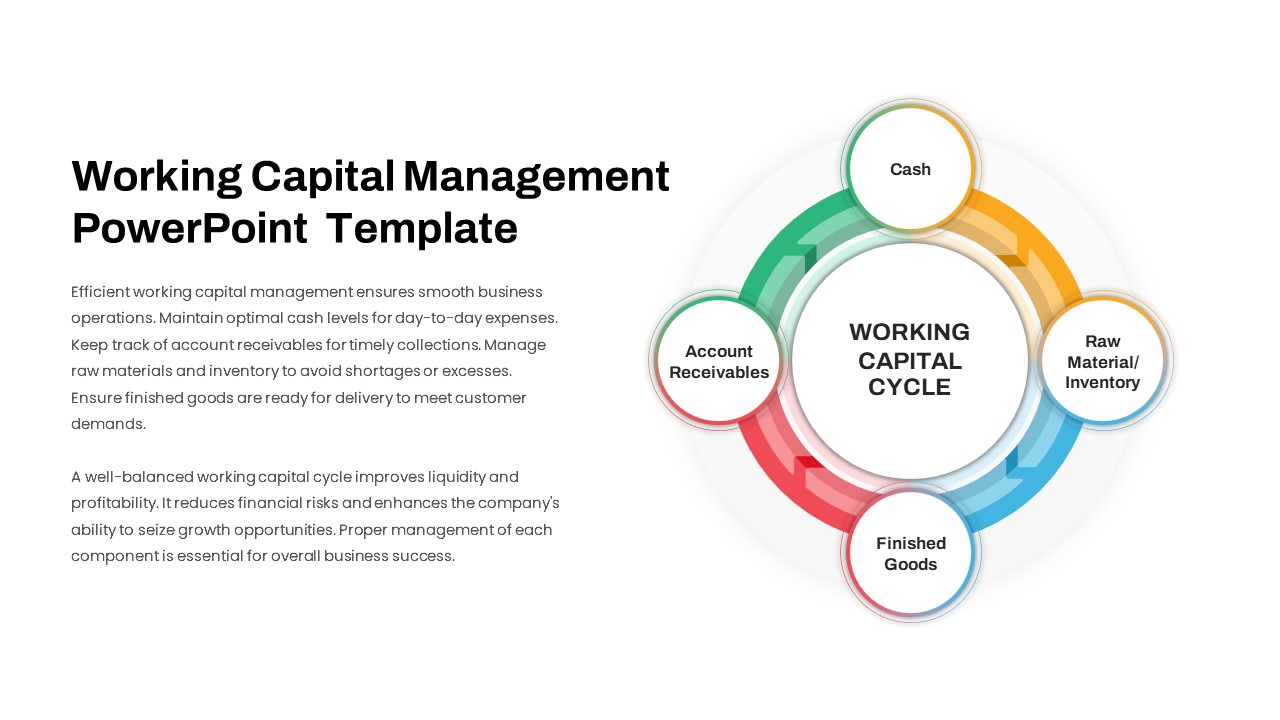
Working Capital Cycle Diagram Template for PowerPoint & Google Slides
Circular
Gartner Hype Cycle Adoption Curve Diagram Template for PowerPoint & Google Slides
Infographics
Colorful Startup Financing Cycle Diagram Template for PowerPoint & Google Slides
Finance
Seeds Growth Cycle Business Model Template for PowerPoint & Google Slides
Process
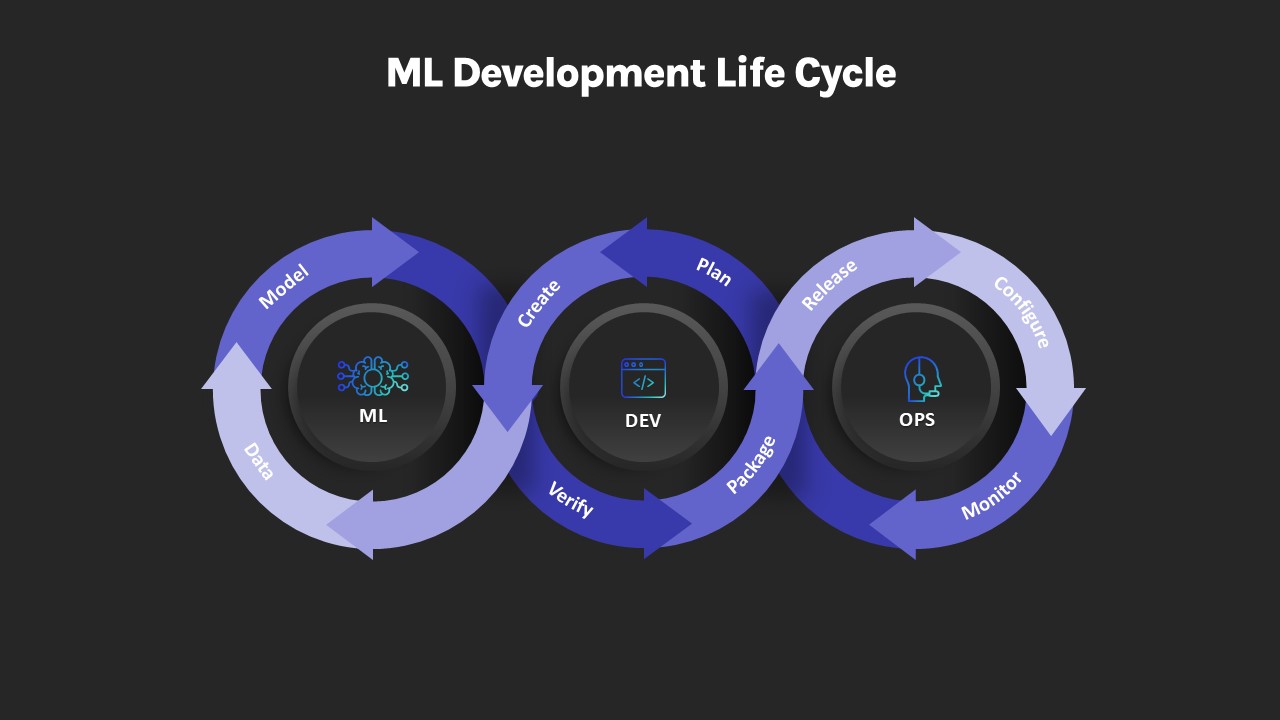
ML Development Life Cycle Diagram Template for PowerPoint & Google Slides
Machine Learning
Project Life Cycle Workflow Diagram Template for PowerPoint & Google Slides
Process
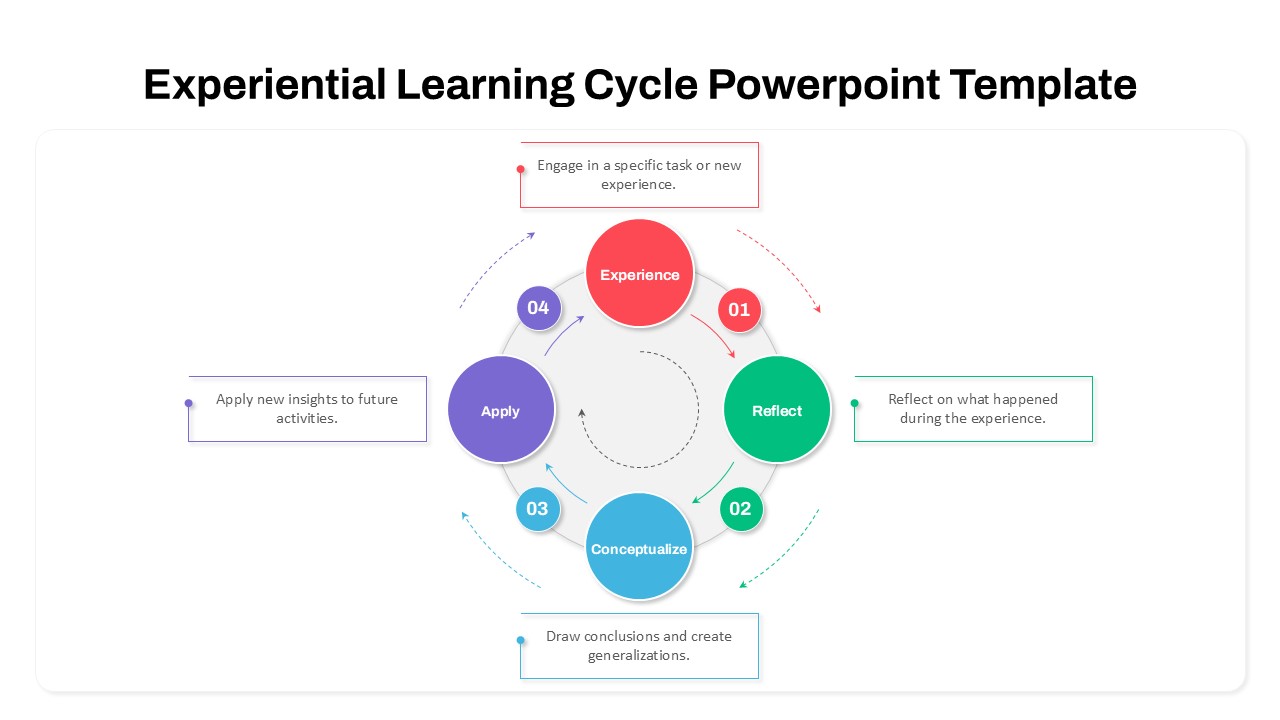
Experiential Learning Cycle Diagram Template for PowerPoint & Google Slides
Circular
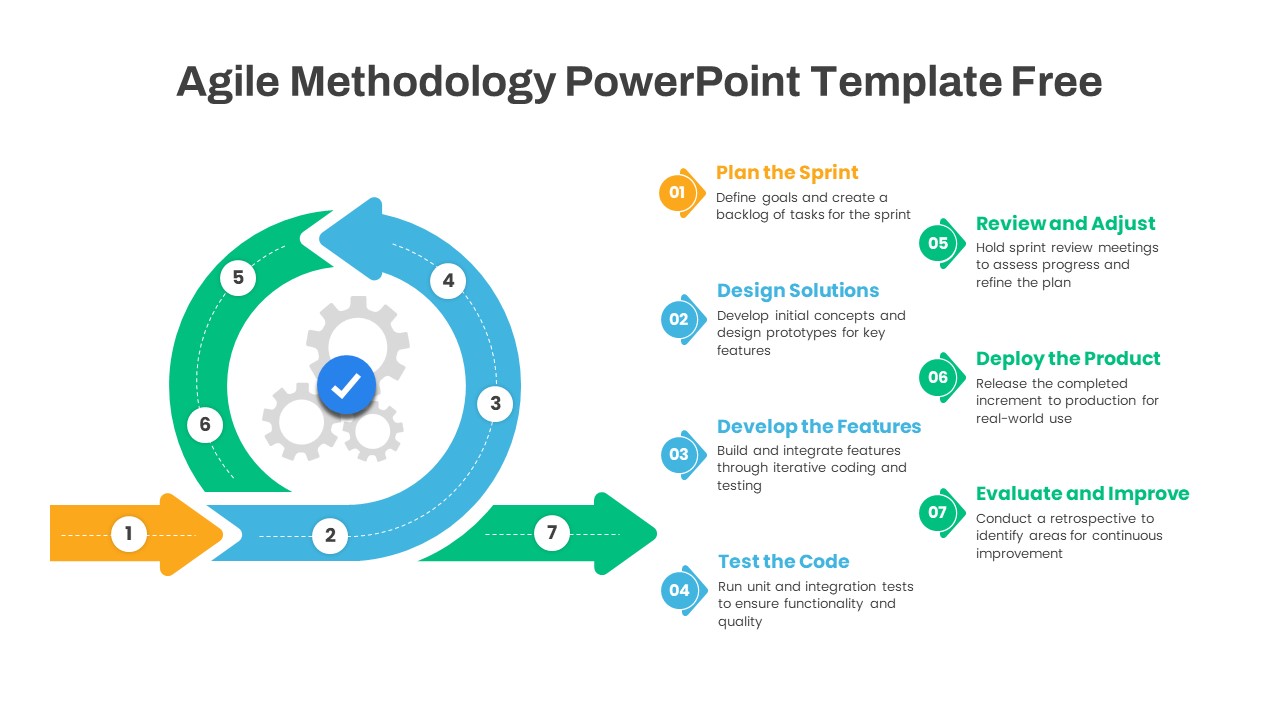
Agile Methodology Cycle Diagram Template for PowerPoint & Google Slides
Project
Free
Change Management Process Cycle Diagram Template for PowerPoint & Google Slides
Process
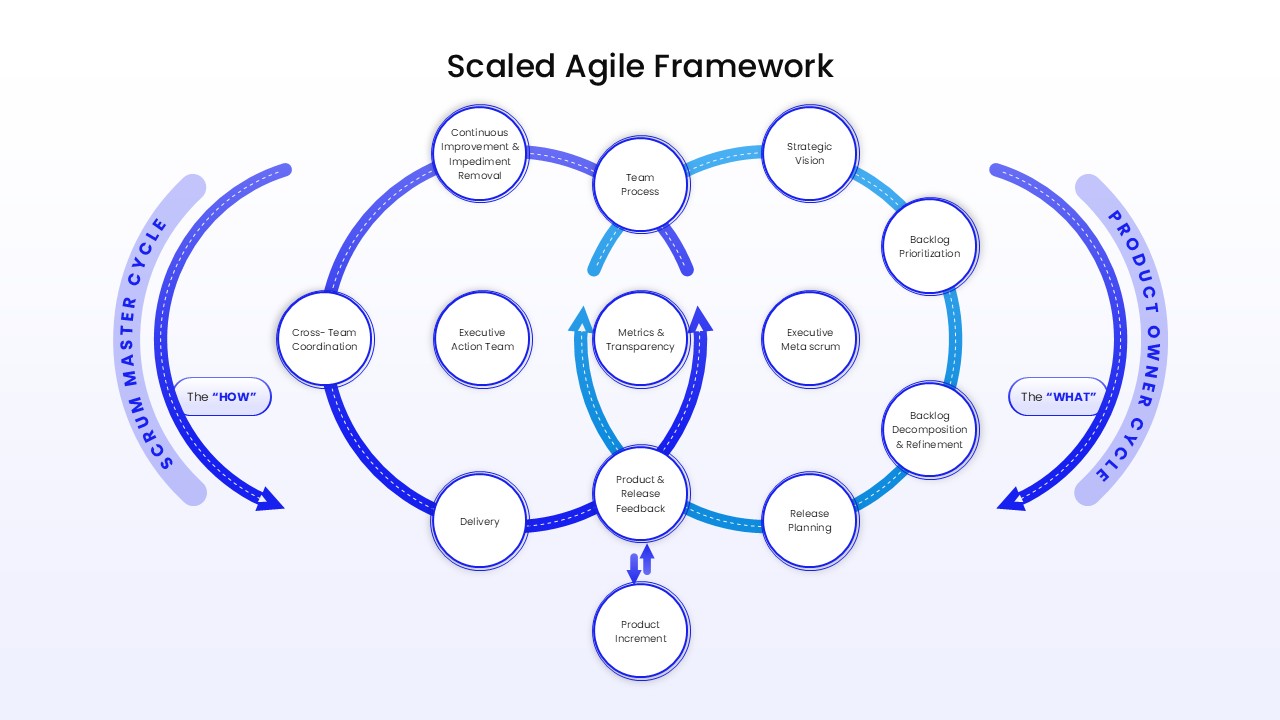
Two-Cycle Scaled Agile Framework Template for PowerPoint & Google Slides
Scrum
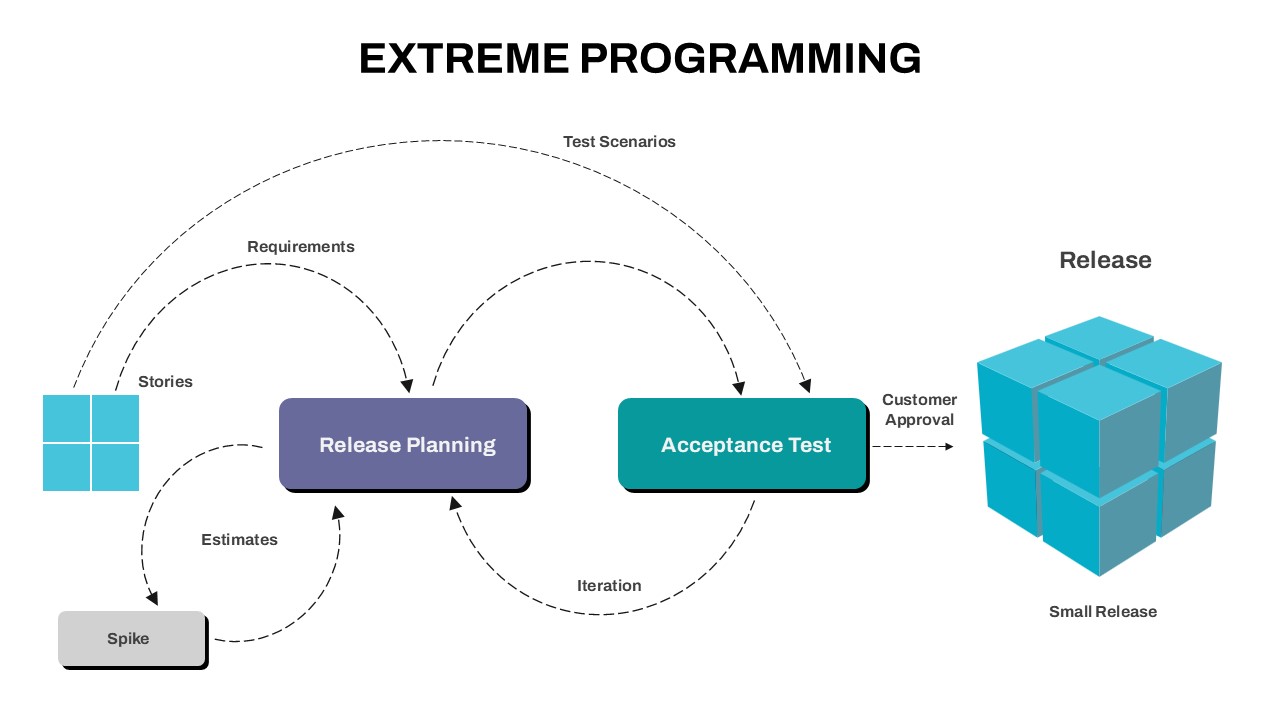
Extreme Programming Process Cycle Template for PowerPoint & Google Slides
Software Development
Flywheel Growth Cycle Diagram Template for PowerPoint & Google Slides
Circular
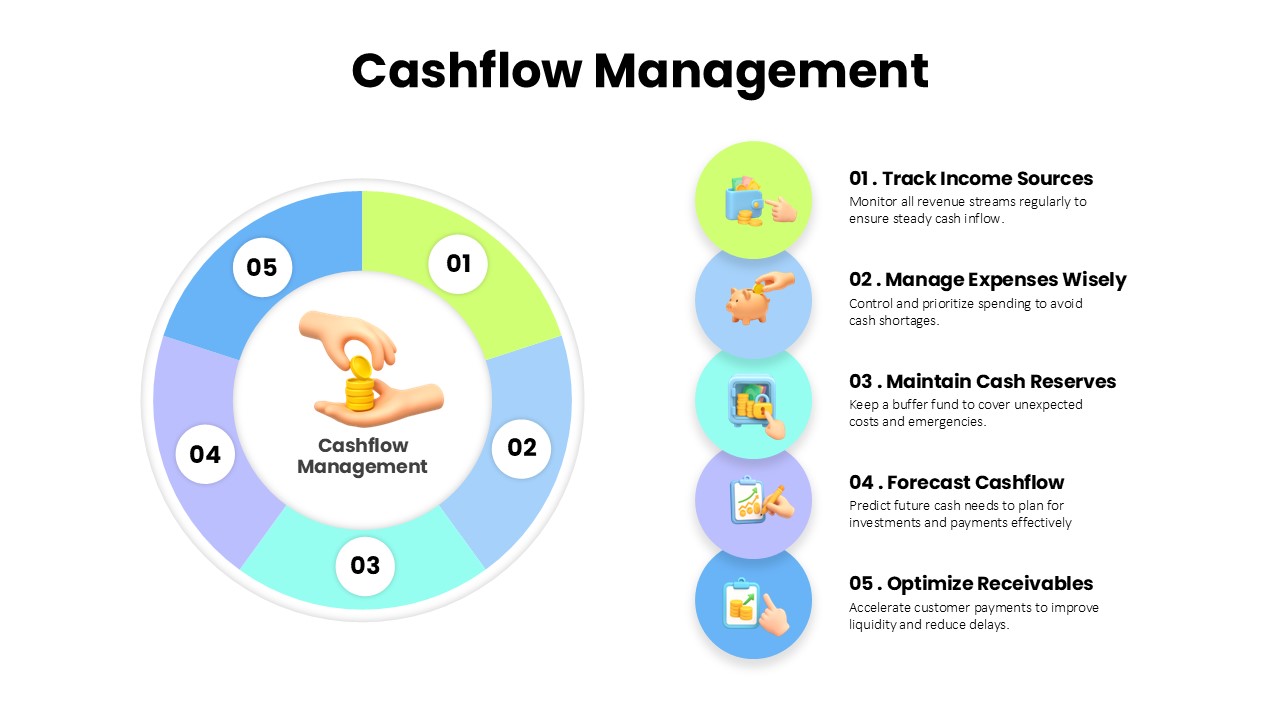
Cashflow Management Cycle Diagram Template for PowerPoint & Google Slides
Finance
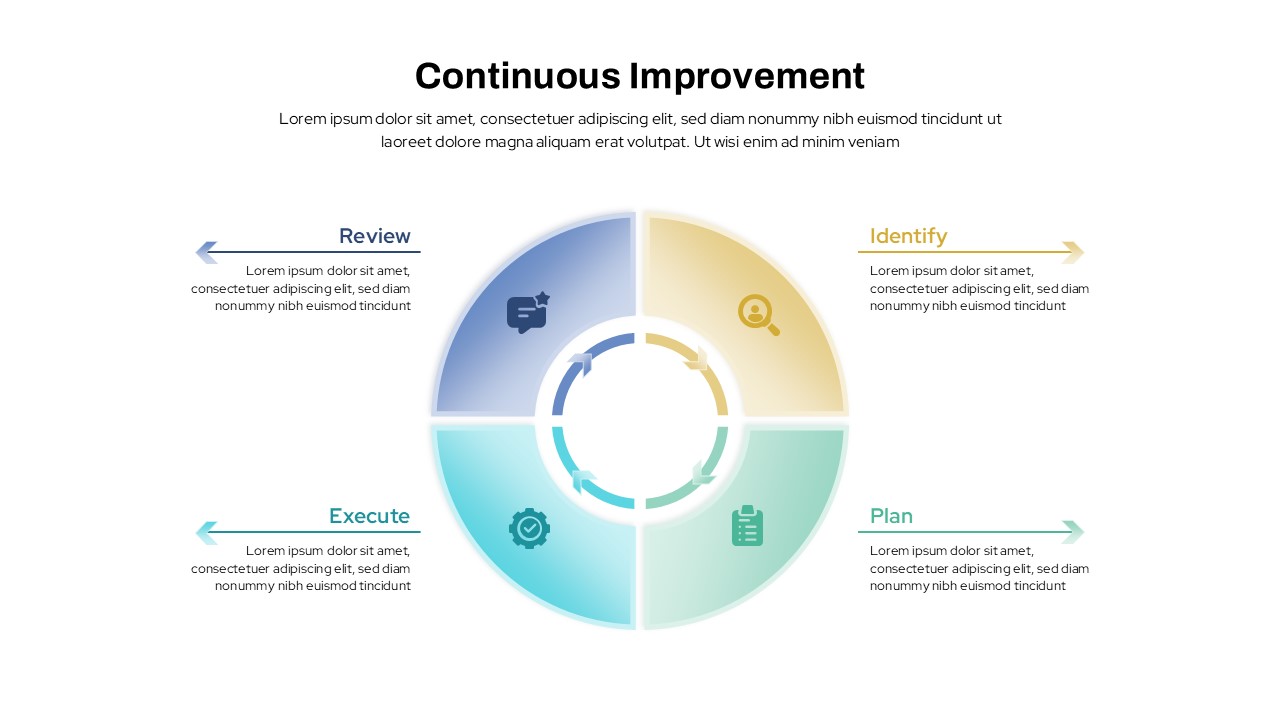
Continuous Improvement Cycle Diagram Template for PowerPoint & Google Slides
Process
Modern Cycle Process for PowerPoint & Google Slides
Infographics
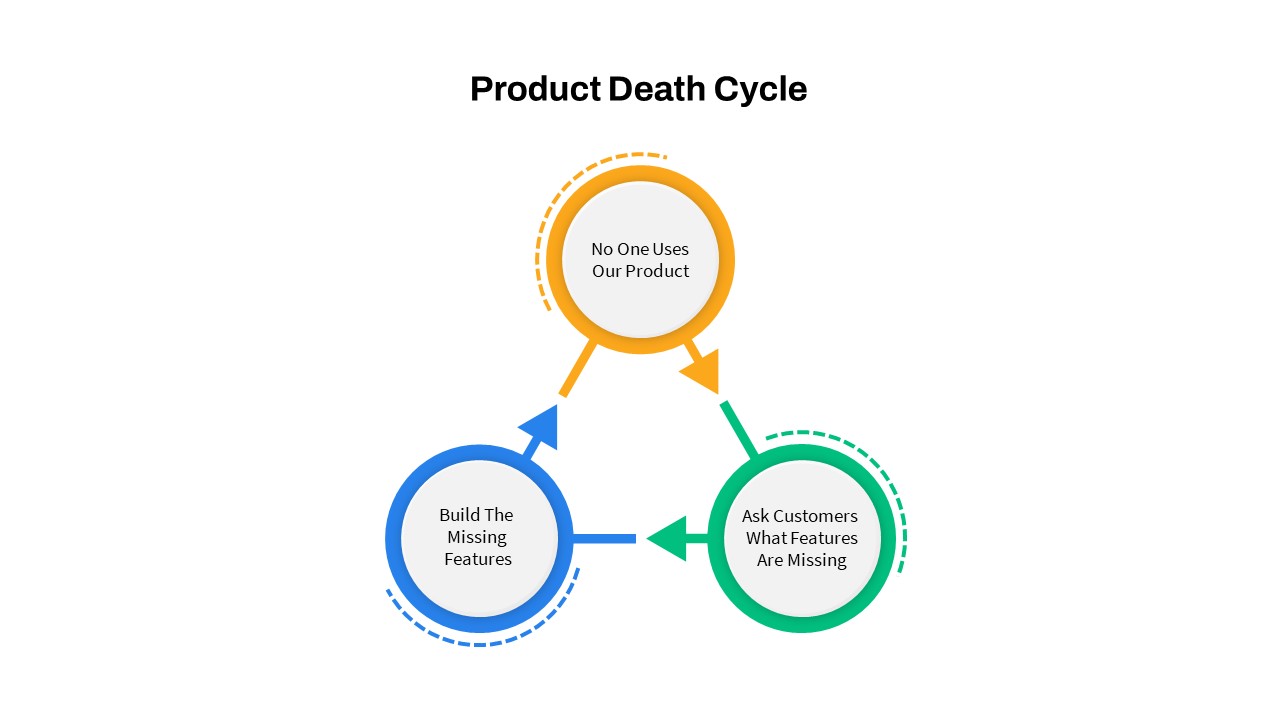
Product Death Cycle Diagram Slide for PowerPoint & Google Slides
Circular
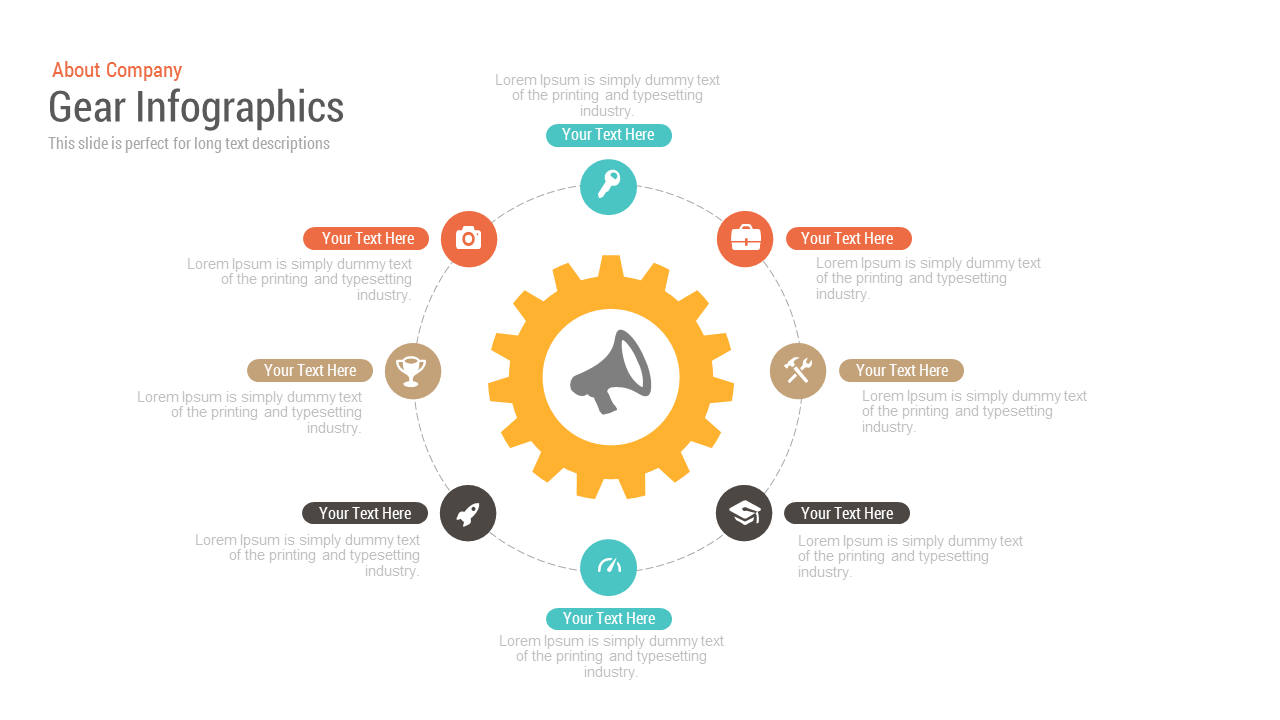
Free Gear Infographics template for PowerPoint & Google Slides
Process
Free
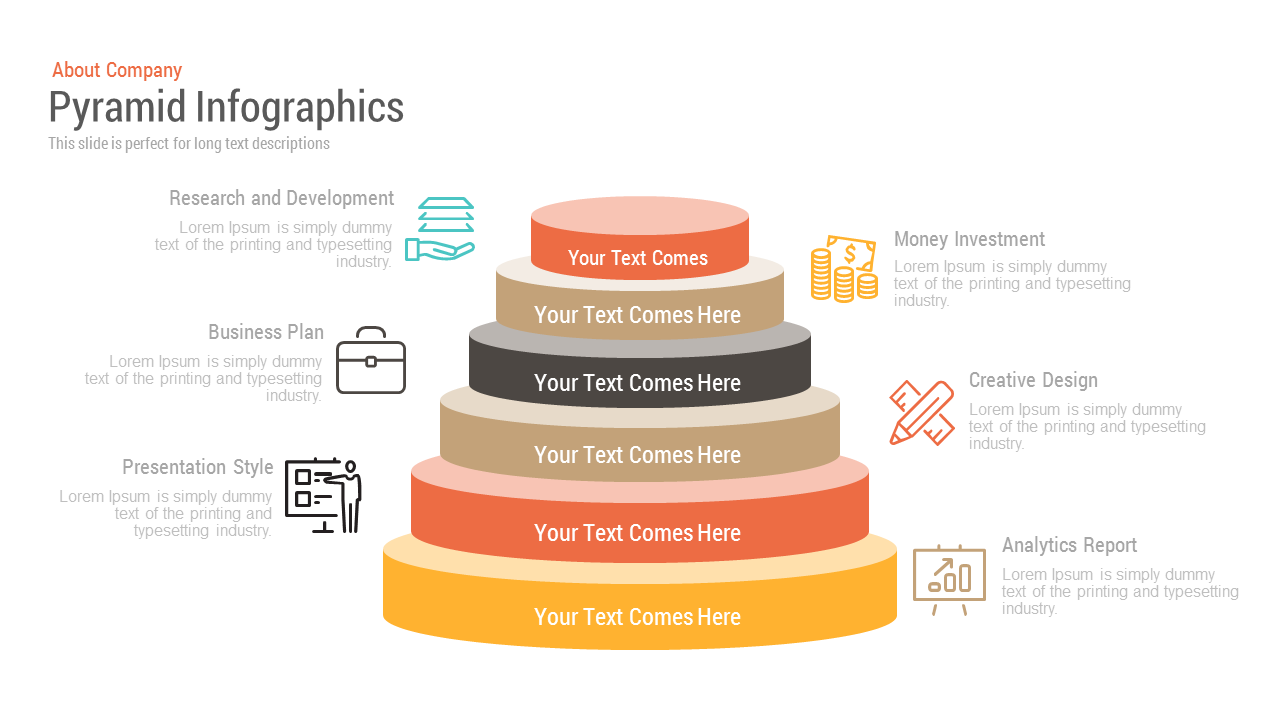
Free Pyramid Infographics template for PowerPoint & Google Slides
Pyramid
Free
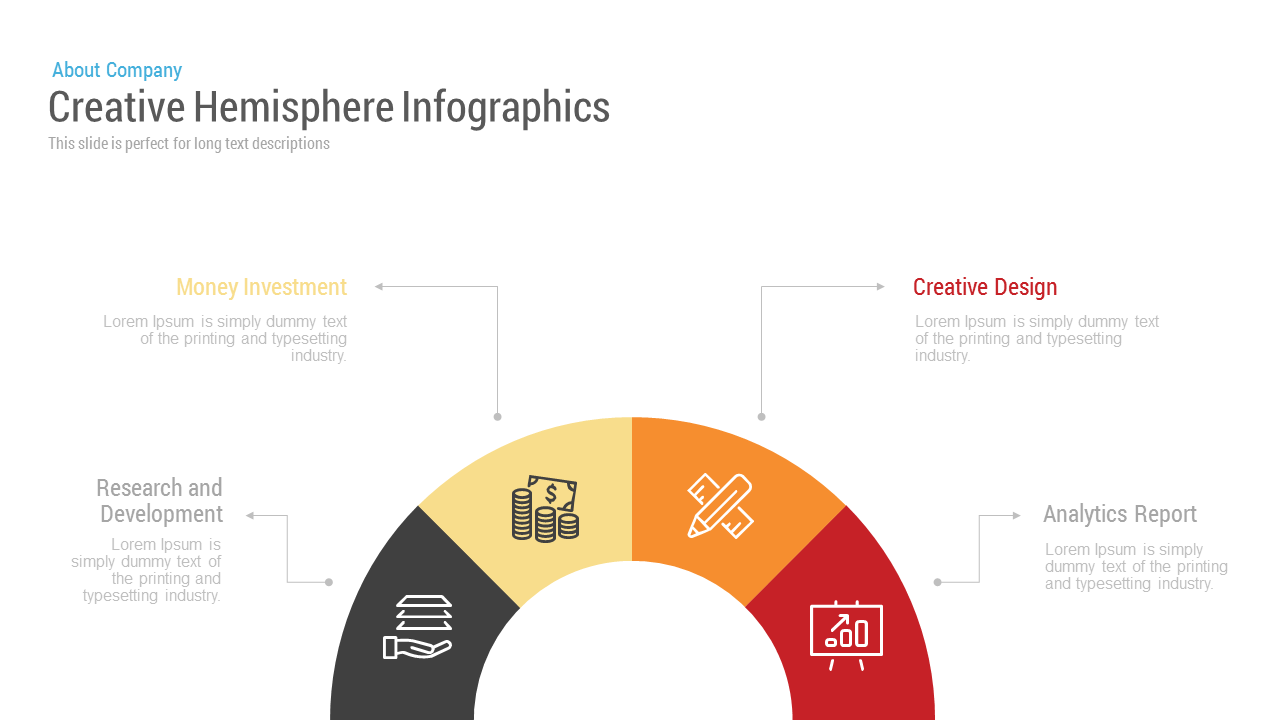
Free Creative Hemisphere Infographics template for PowerPoint & Google Slides
Infographics
Free
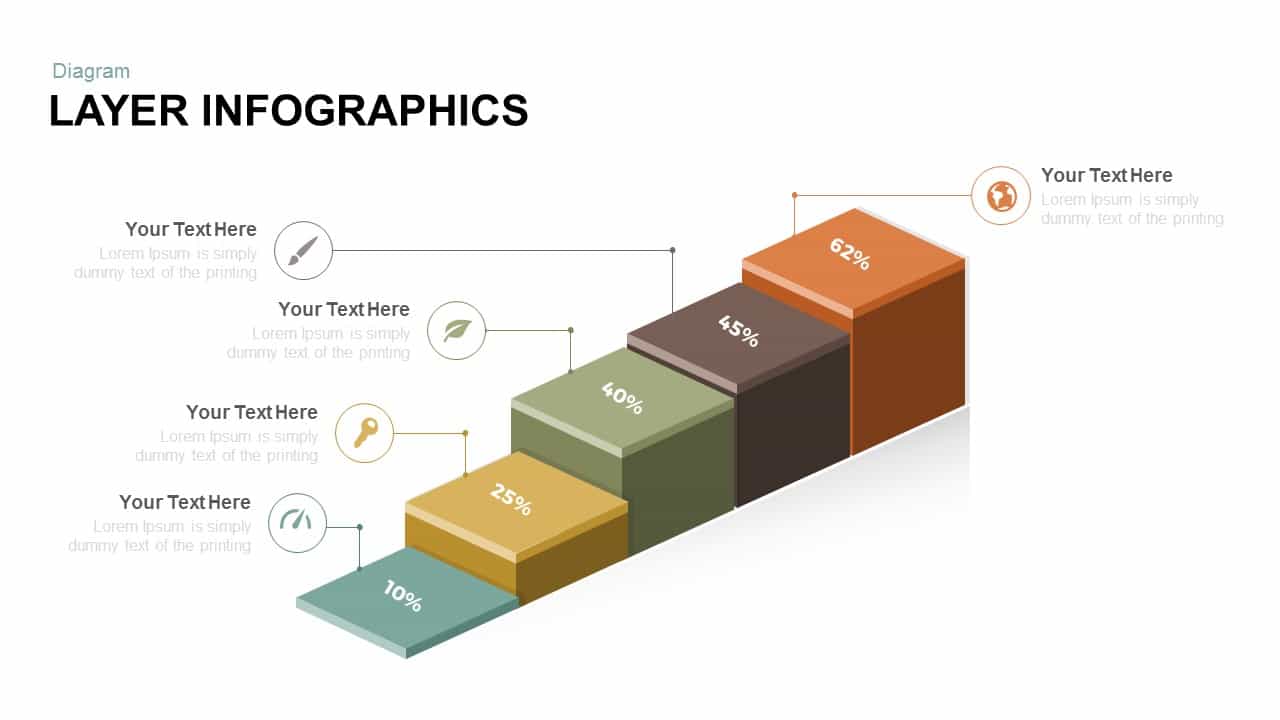
Free Layer Infographics template for PowerPoint & Google Slides
Process
Free
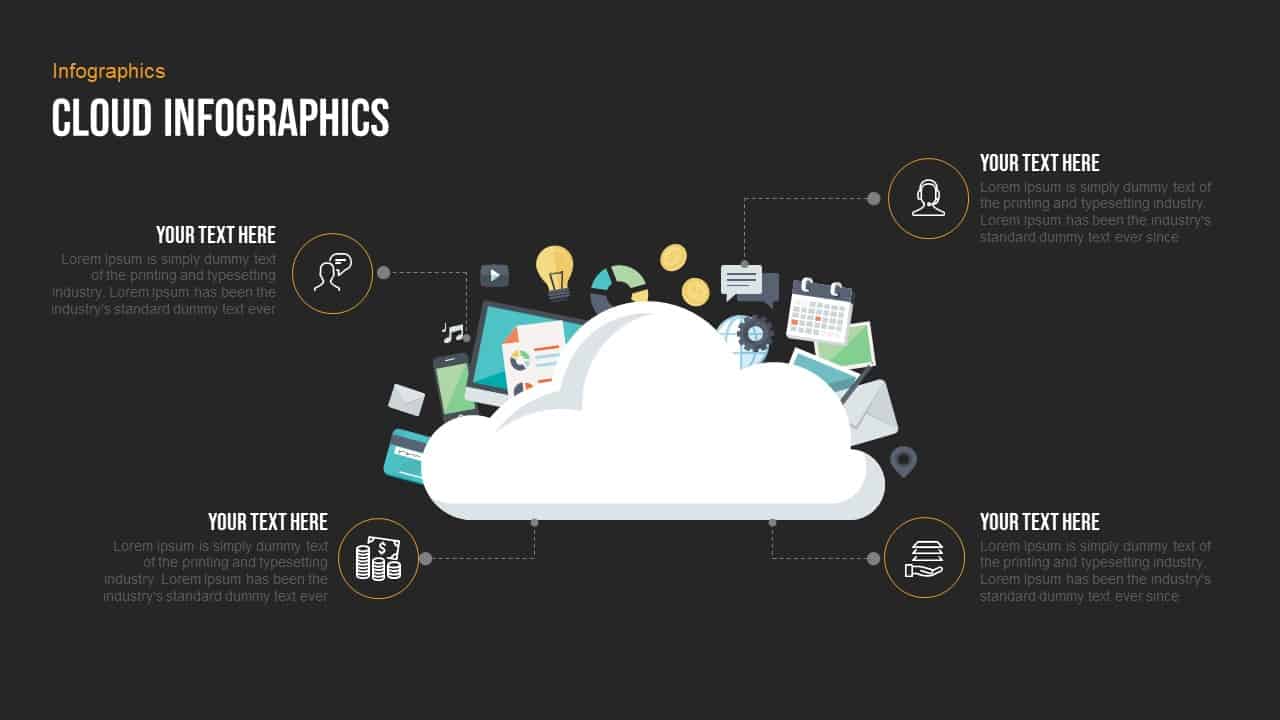
Free Professional Cloud Infographics Template for PowerPoint & Google Slides
Process
Free
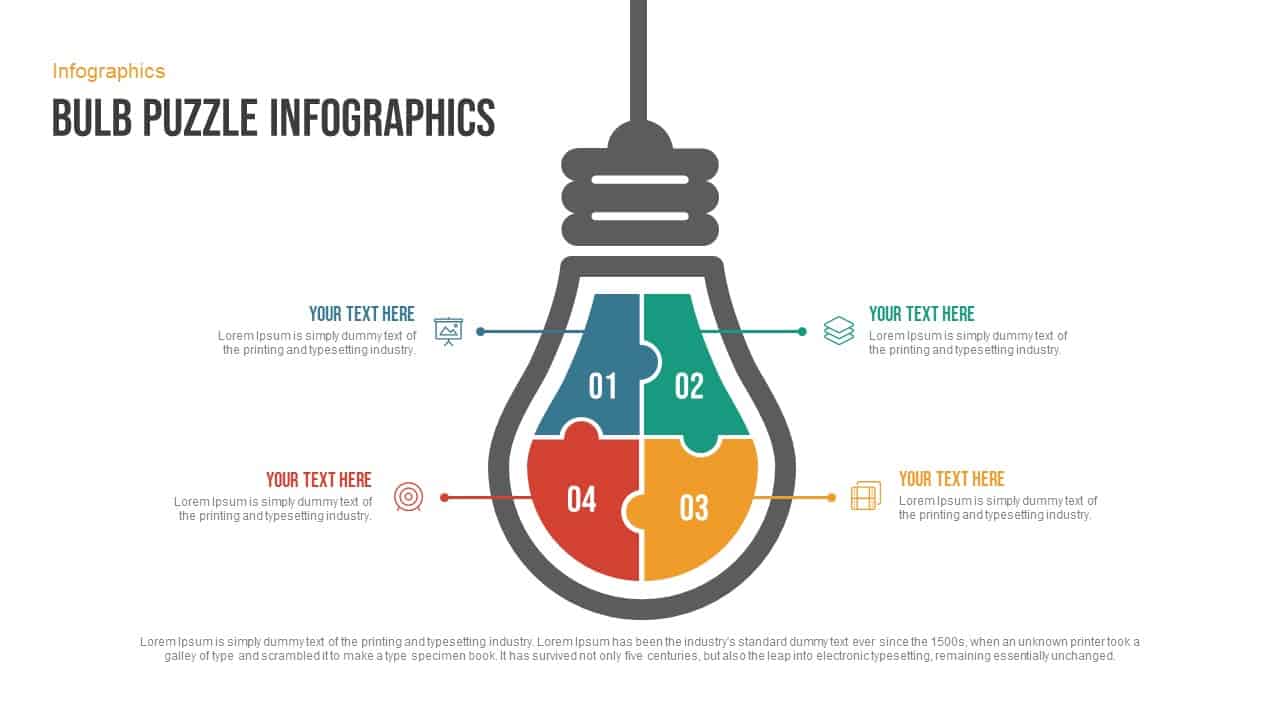
Free Bulb Puzzle Infographics Diagram Template for PowerPoint & Google Slides
Process
Free

Free Colorful Process Flow Infographics Template for PowerPoint & Google Slides
Process
Free
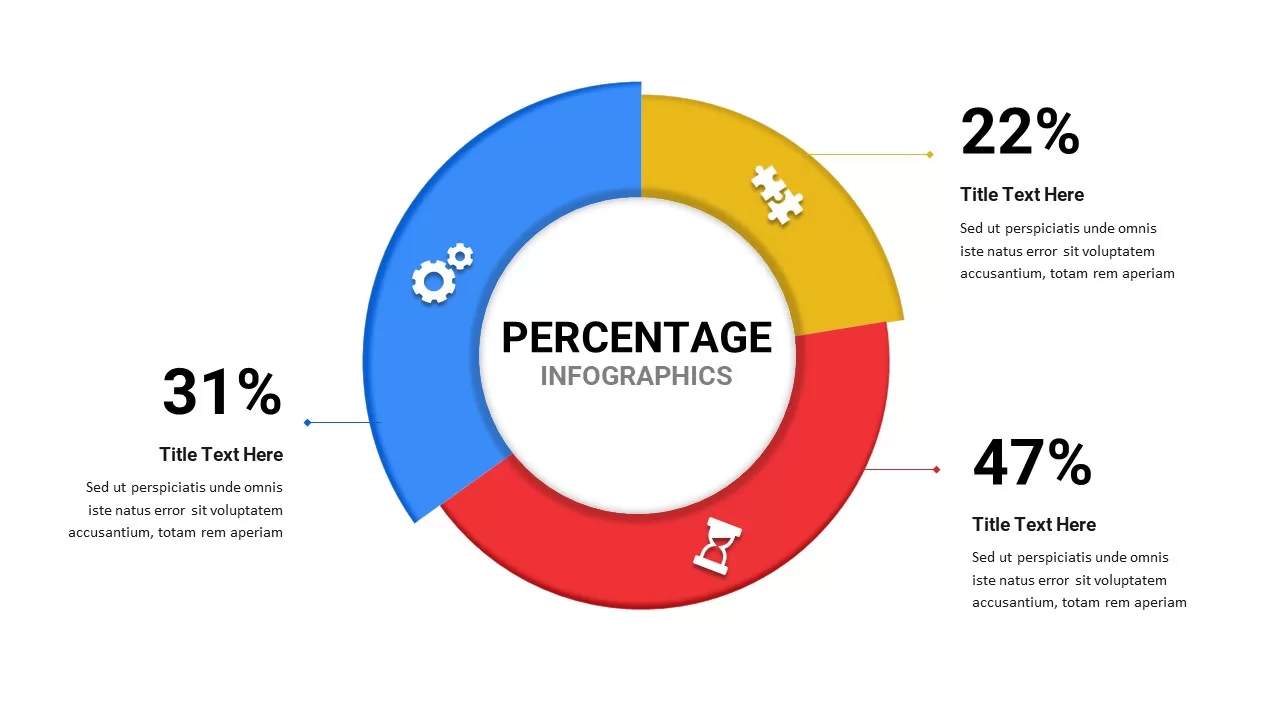
Free Percentage Infographics template for PowerPoint & Google Slides
Comparison
Free
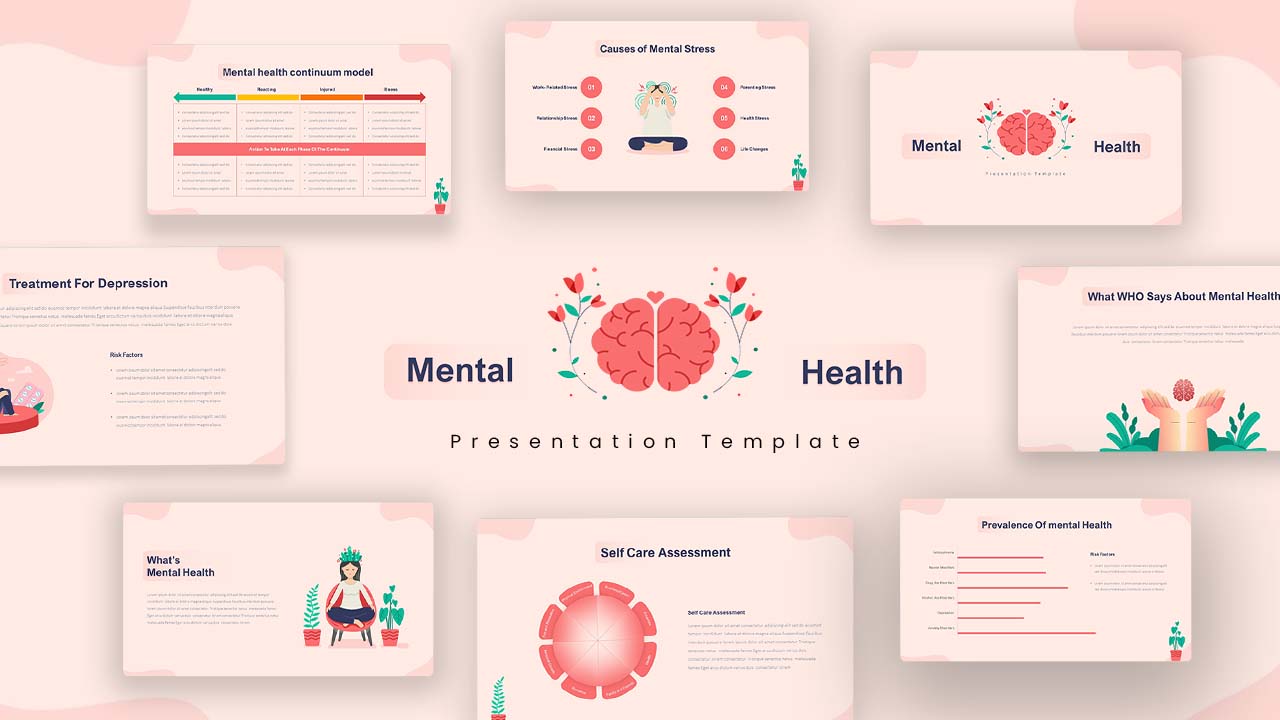
Free Mental Health Awareness & Infographics Presentation Template for PowerPoint & Google Slides
Health
Free
Free Roadmap Infographics Pack Template for PowerPoint & Google Slides
Pitch Deck
Free

Free Colorful Timeline Infographics Template for PowerPoint & Google Slides
Timeline
Free
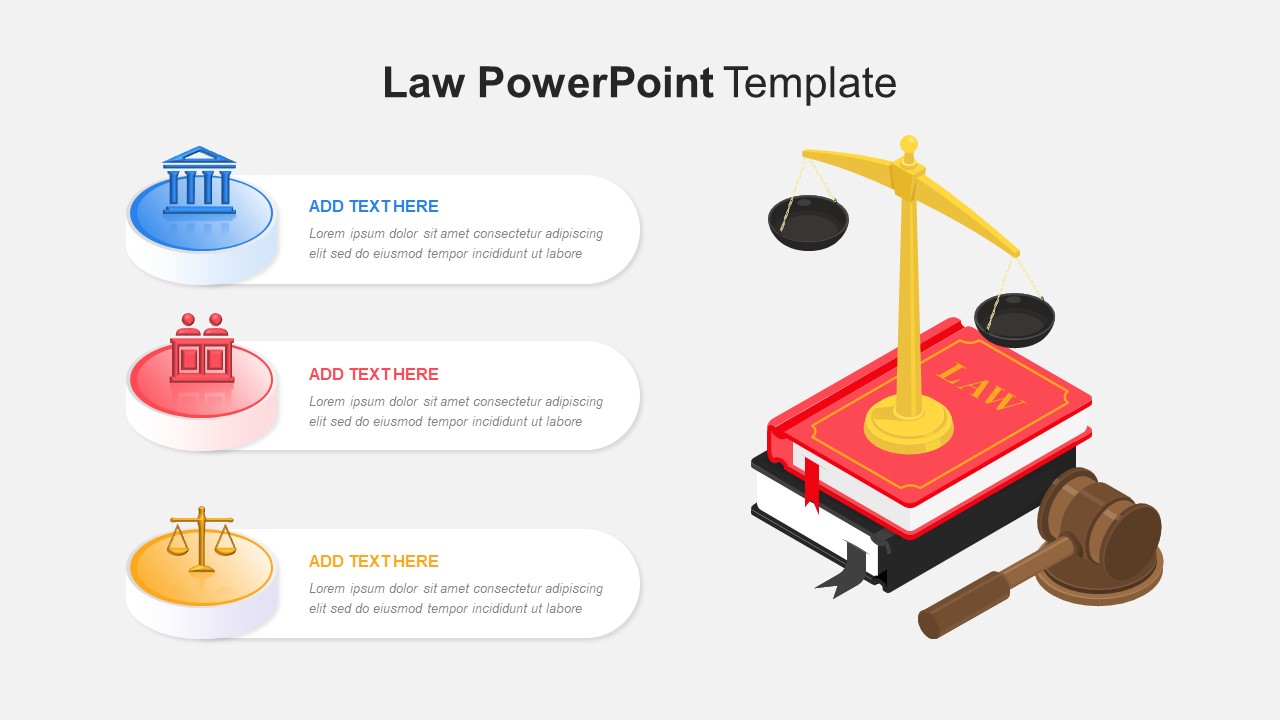
Free Law Infographics Slide Pack Collection Template for PowerPoint & Google Slides
Infographics
Free
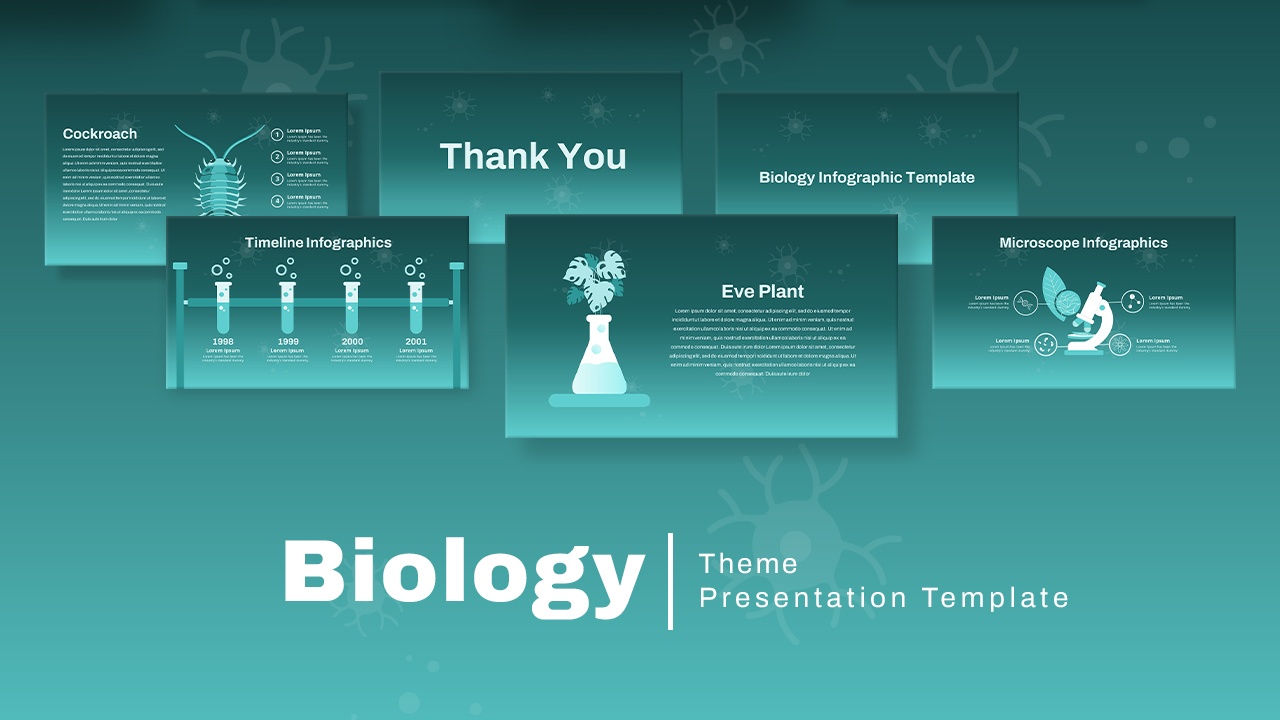
Free Biology Theme Infographics Deck Template for PowerPoint & Google Slides
Health
Free
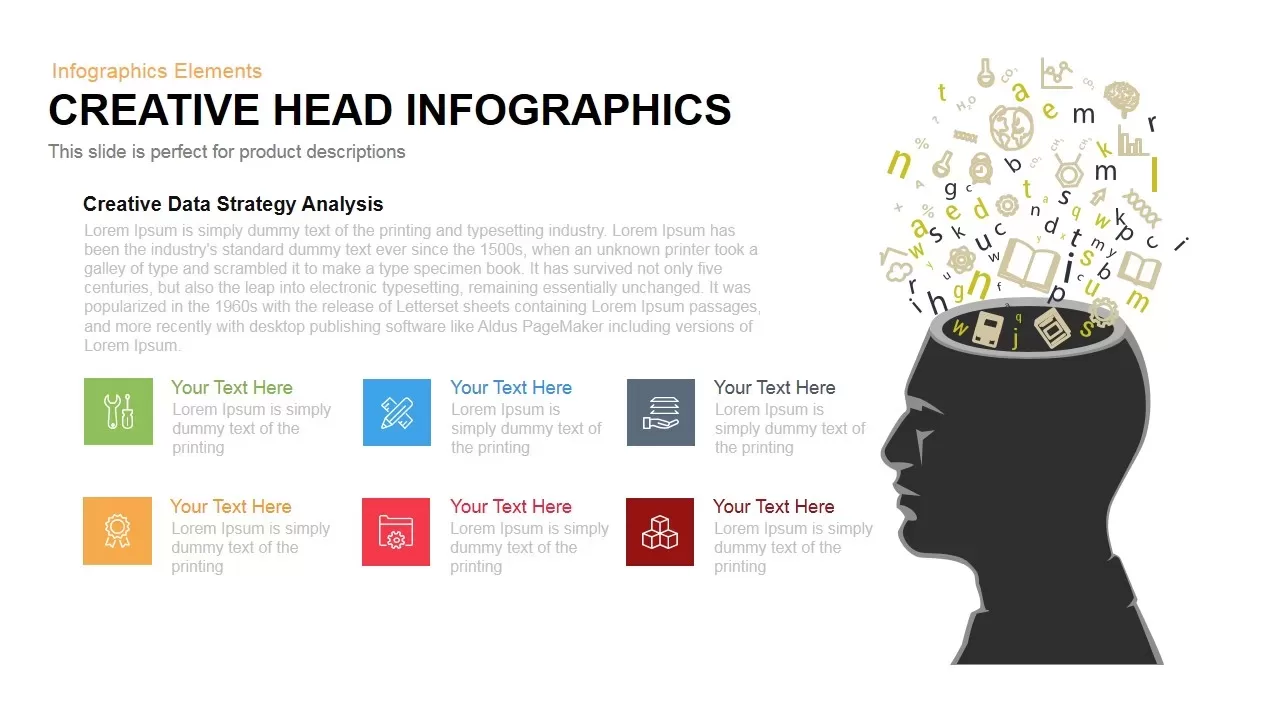
Dynamic Creative Head Infographics Template for PowerPoint & Google Slides
Circular
Cloud Computing Infographics template for PowerPoint & Google Slides
Cloud Computing
Overcoming Challenges Infographics template for PowerPoint & Google Slides
Opportunities Challenges
Six-Stage Timeline Infographics Slide Template for PowerPoint & Google Slides
Timeline
Challenge Solutions Infographics Template for PowerPoint & Google Slides
Opportunities Challenges
Comparative Tourism Infographics Template for PowerPoint & Google Slides
Comparison
Five-Step Circular Badge Infographics Template for PowerPoint & Google Slides
Circular
Rainbow Cloud Infographics Diagram Template for PowerPoint & Google Slides
Process
Isometric 3D Cube Shapes Infographics Template for PowerPoint & Google Slides
Infographics
8-Step Circular Diagram Infographics Template for PowerPoint & Google Slides
Circular
Floating Island Ecosystem Infographics Template for PowerPoint & Google Slides
Graphics
Dental Infographics Process template for PowerPoint & Google Slides
Health
Colorful Process Flow Infographics Template for PowerPoint & Google Slides
Process
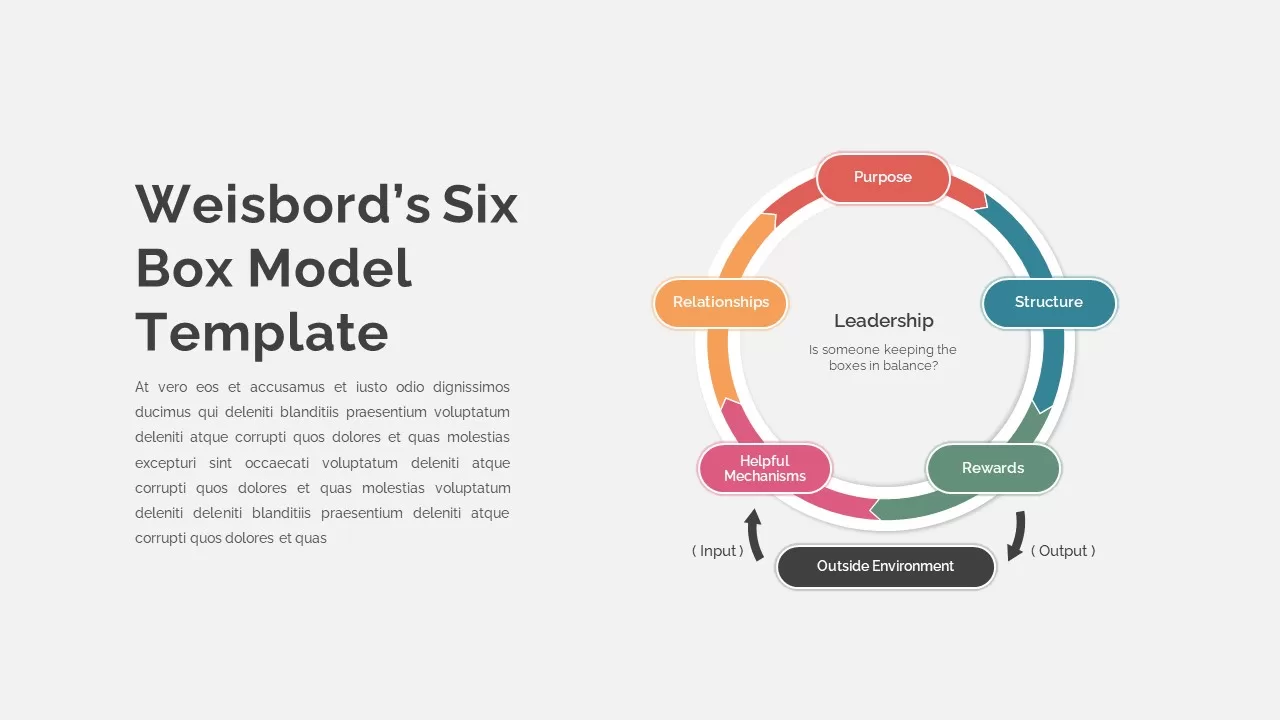
Weisbord’s Six Box Model Infographics Template for PowerPoint & Google Slides
Circular