Cost Reduction Strategy Donut Chart Template for PowerPoint & Google Slides


Description
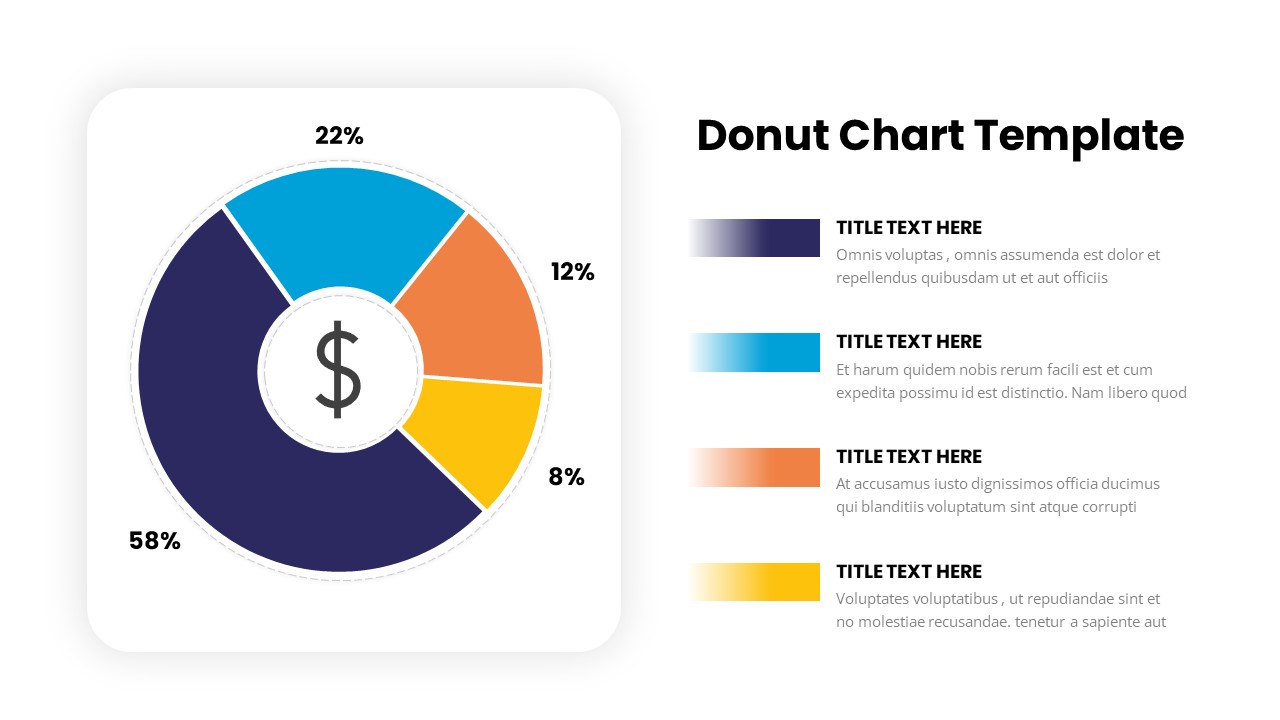
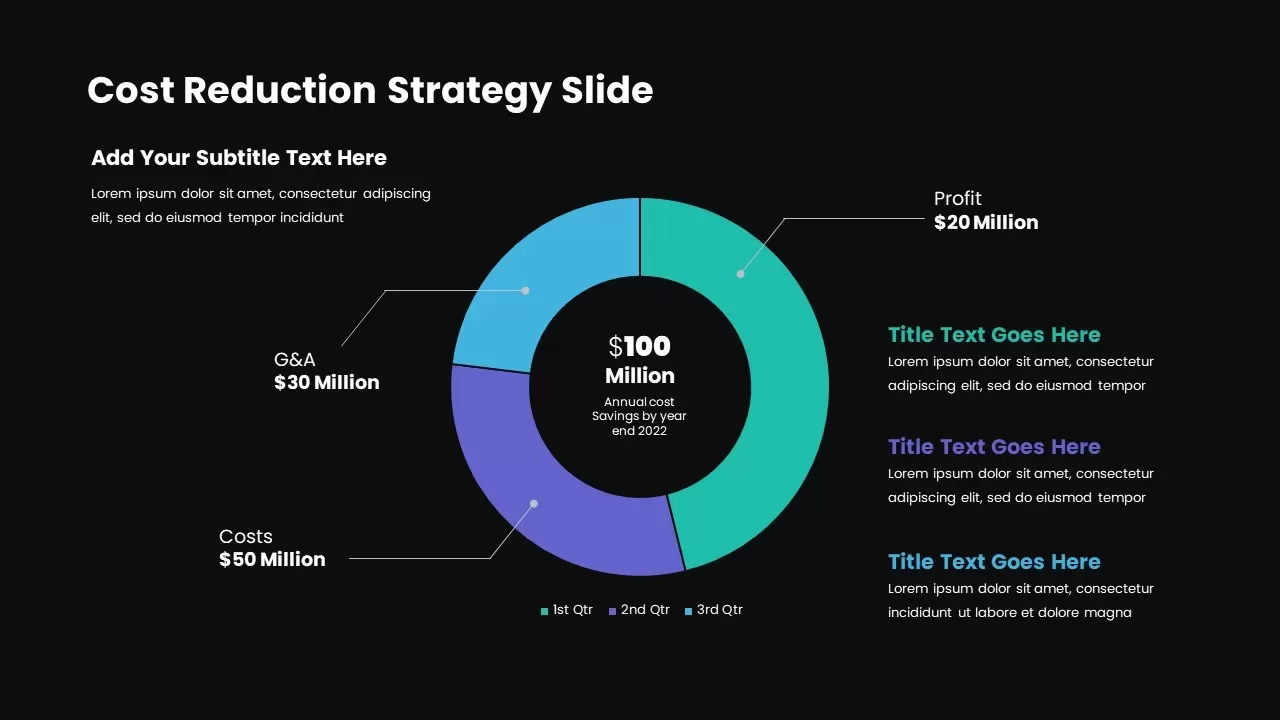
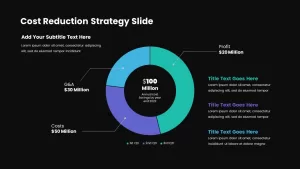
Visualize your quarterly cost‐saving initiatives with this dynamic donut chart slide, designed to showcase total annual savings and breakdowns at a glance. The central donut highlights a $100 million annual target, while three color‐coded segments represent G&A reductions ($30 million), direct cost savings ($50 million), and profit improvements ($20 million). Fine‐tuned callouts label each segment, and accompanying text placeholders allow you to contextualize drivers, milestones, or action items for each category. This clean, uncluttered layout uses flat vector graphics, consistent typography, and subtle drop shadows to ensure your financial data stands out without distraction.
Built for seamless integration with both PowerPoint and Google Slides, this template features fully editable vector shapes, intuitive drag‐and‐drop text fields, and master‐slide support for rapid customization. Change segment colors, adjust callout lines, or swap in your own figures in seconds to match corporate branding. The slide’s modular design allows you to add or remove segments for alternate scenarios, while built‐in theme settings maintain uniform styling across your entire deck—eliminating version‐control headaches and accelerating collaborative workflows.
Whether you are presenting at board meetings, investor briefings, or departmental reviews, this donut chart slide transforms complex financial metrics into an instantly digestible visual narrative. Use it to drive data‐driven discussions on cost‐optimization strategies, track performance against targets, or communicate the impact of strategic initiatives. With its balance of visual appeal and precision, this asset empowers presenters to highlight key insights, foster stakeholder alignment, and accelerate decision‐making.
Who is it for
CFOs, finance directors, and cost‐optimization teams will leverage this slide to report on savings programs, conduct budget reviews, and brief executive stakeholders. Consultants, project managers, and operational leaders can also use it to illustrate financial impacts of process improvements or technology migrations.
Other Uses
Repurpose this layout for revenue breakdowns, market‐share analyses, survey results, or any scenario requiring proportional data visualization. Duplicate segments for additional categories or adjust callouts to highlight KPIs, milestones, or risk factors.
Login to download this file

Item ID
SB03016
Related Templates

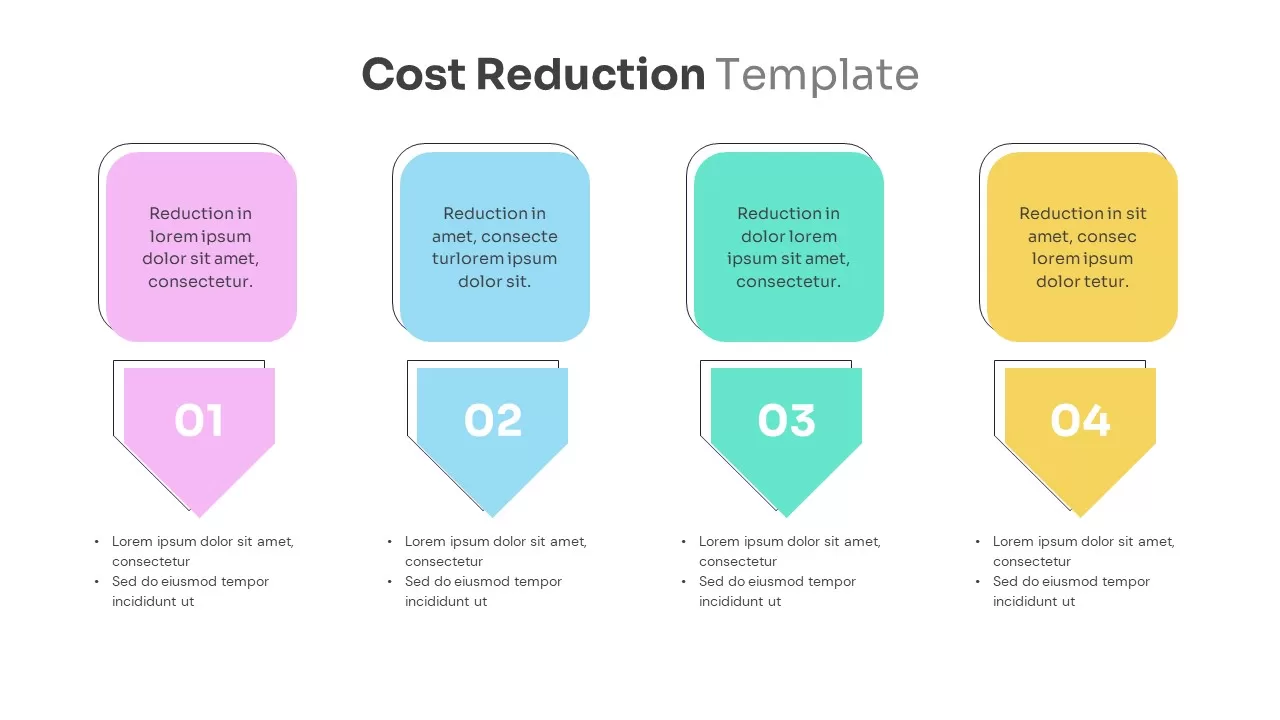
Cost Reduction Strategy template for PowerPoint & Google Slides
Business Strategy
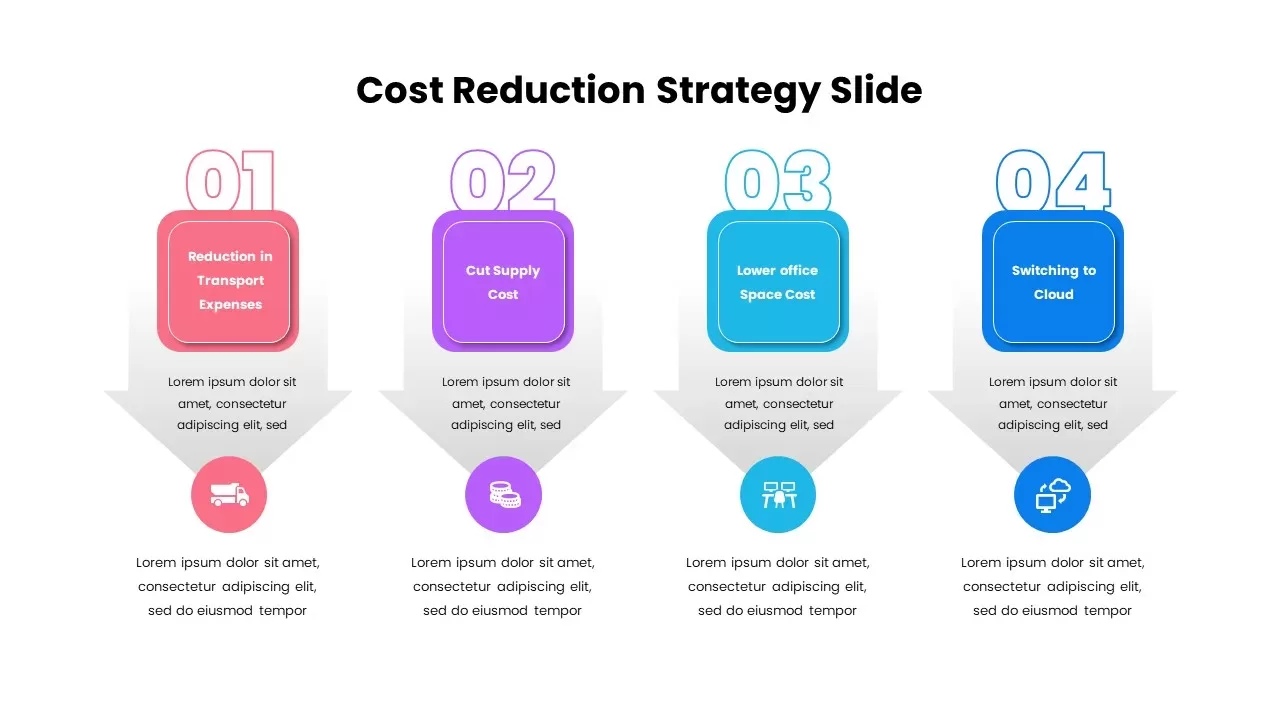
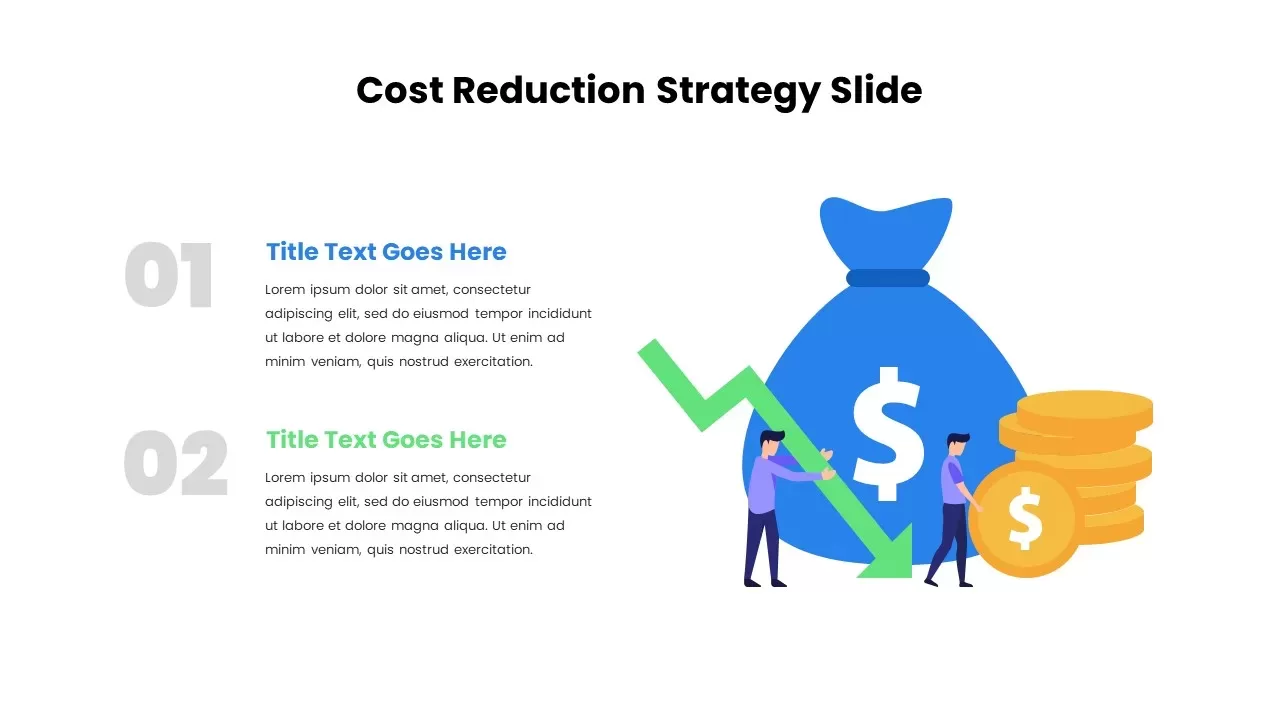
Four-Step Cost Reduction Strategy Template for PowerPoint & Google Slides
Process
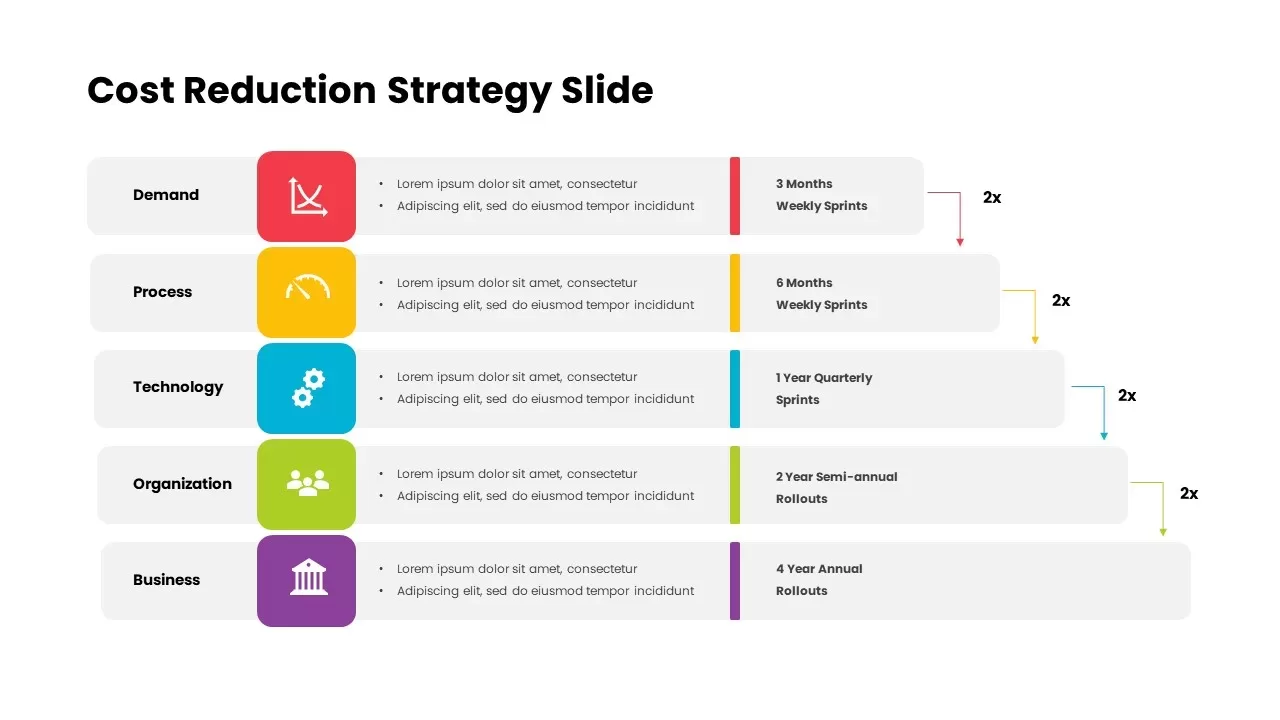
Cost Reduction Strategy Roadmap Template for PowerPoint & Google Slides
Business Strategy
Cost Reduction Infographic Template for PowerPoint & Google Slides
Process
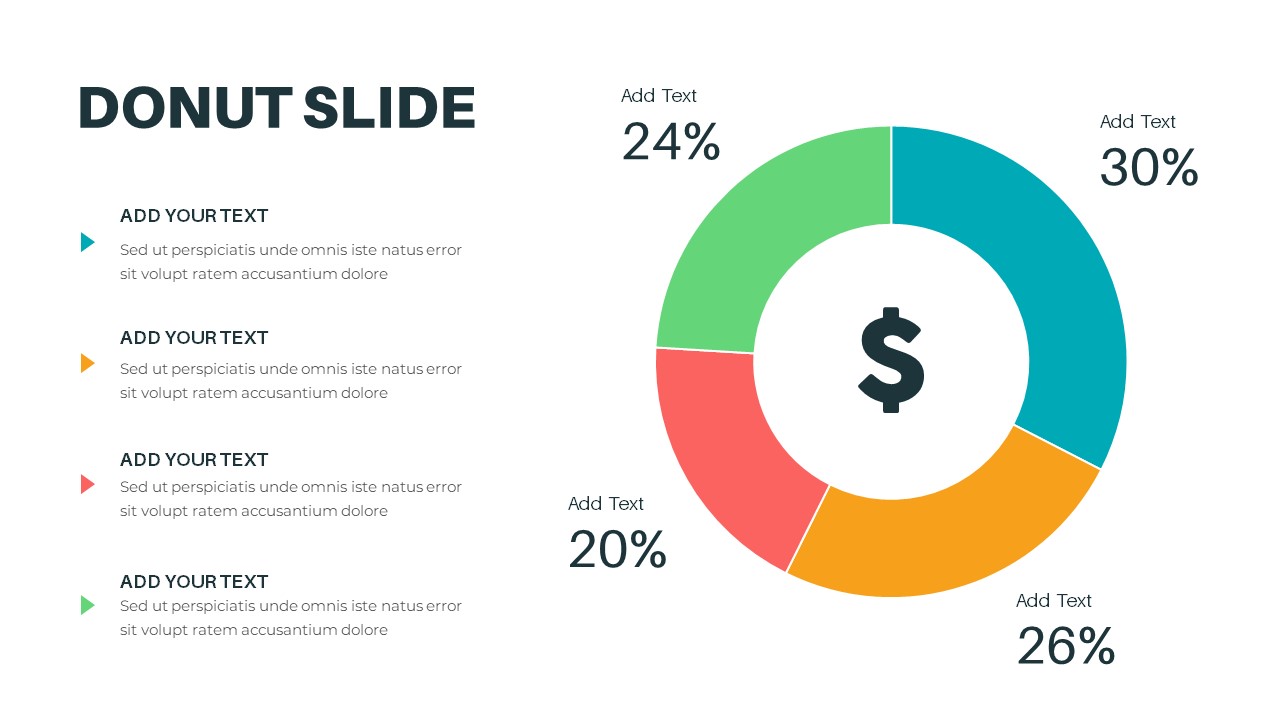
Donut Chart template for PowerPoint & Google Slides
Pie/Donut
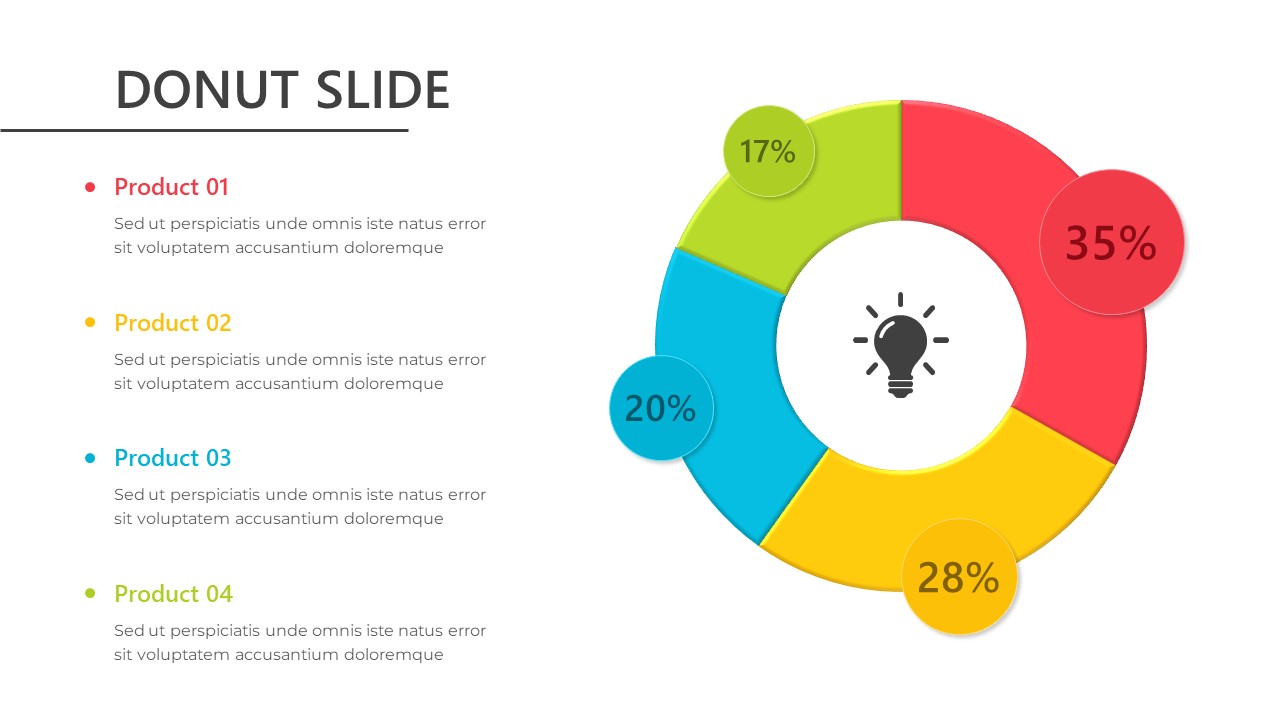
Donut Chart template for PowerPoint & Google Slides
Pie/Donut
Donut Chart Split Template for PowerPoint & Google Slides
Charts
Success Key Diagram with Donut Chart Template for PowerPoint & Google Slides
Pie/Donut

Eight Section Donut Chart Infographic Template for PowerPoint & Google Slides
Pie/Donut
30-60-90 Day Donut Chart Plan Infographic Template for PowerPoint & Google Slides
Timeline
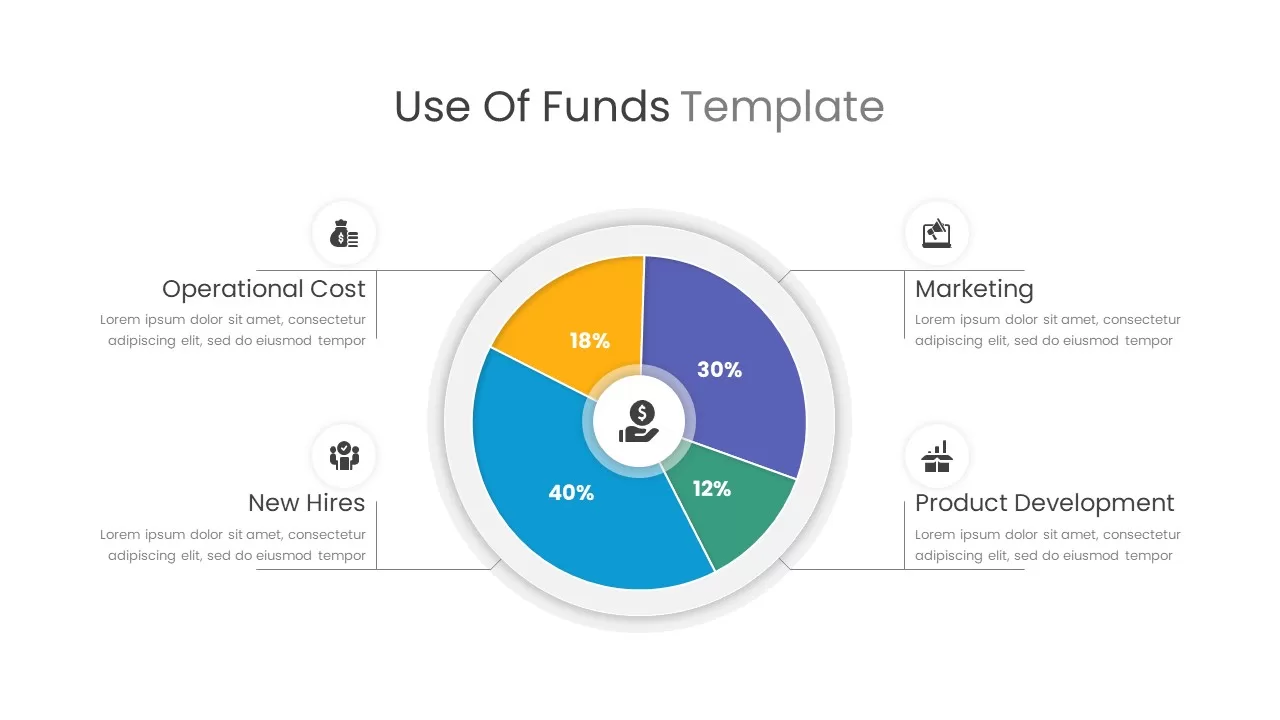
Use of Funds Donut Chart Infographic Template for PowerPoint & Google Slides
Circular
Donut Chart Data Breakdown template for PowerPoint & Google Slides
Pie/Donut
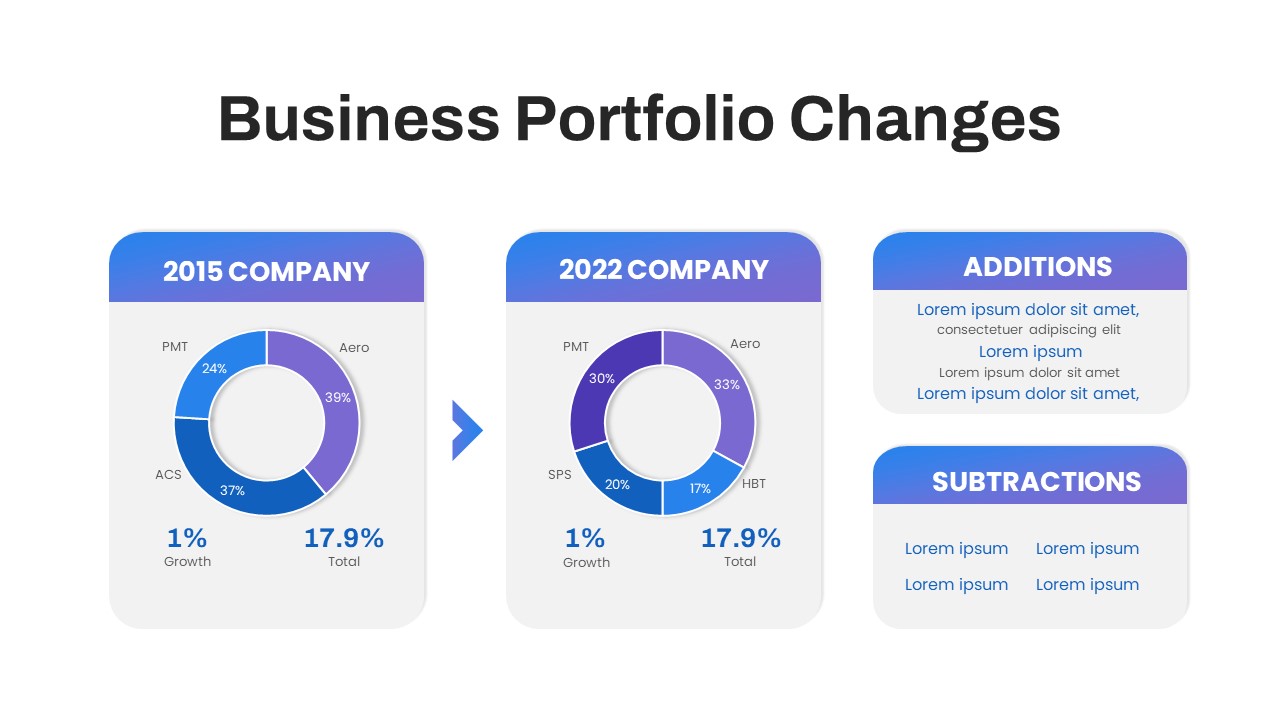
Business Portfolio Changes Donut Chart Template for PowerPoint & Google Slides
Pie/Donut
Technical Skills Donut Chart Overview Template for PowerPoint & Google Slides
HR
Marketing Budget Allocation Donut Chart Template for PowerPoint & Google Slides
Marketing
Three Segment Donut Chart KPI Infographic Template for PowerPoint & Google Slides
Pie/Donut
Donut Chart for PowerPoint & Google Slides
Pie/Donut
Donut Chart for PowerPoint & Google Slides
Pie/Donut
Donut Chart for PowerPoint & Google Slides
Pie/Donut
Donut Chart Presentation for PowerPoint & Google Slides
Pie/Donut

Comparison Donut Chart PowerPoint Template and Keynote
Pie/Donut
Donut Split Analysis template for PowerPoint & Google Slides
Pie/Donut
Budget Forecast Dashboard & Donut Charts Template for PowerPoint & Google Slides
Pie/Donut
Cost Management Process template for PowerPoint & Google Slides
Process
Dual-Color Cost vs Benefit Analysis Template for PowerPoint & Google Slides
Comparison
Cost Benefit Analysis Comparison Template for PowerPoint & Google Slides
Comparison
Interactive Multi-Use Cost Comparison Template for PowerPoint & Google Slides
Comparison
Cost Cutting Savings Dashboard Template for PowerPoint & Google Slides
Pie/Donut
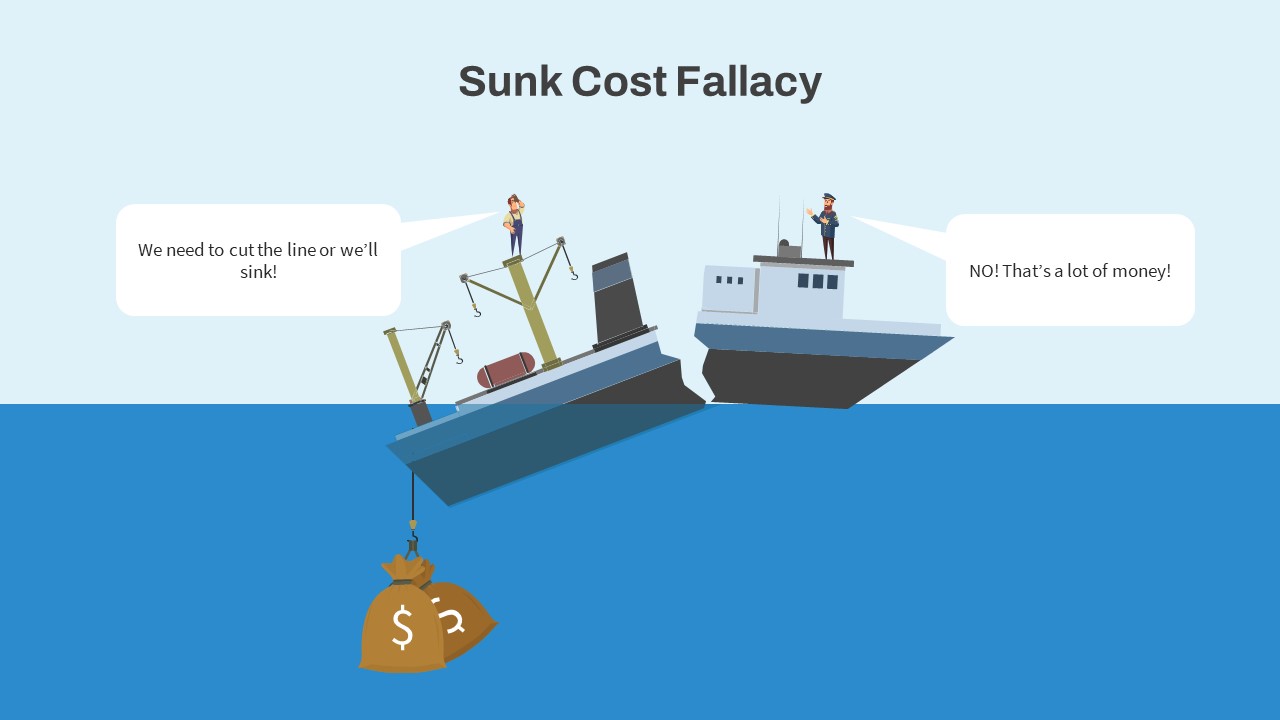
Sunk Cost Fallacy Dragging Anchor Slide Template for PowerPoint & Google Slides
Infographics
Cost-Volume-Profit Analysis Diagram Template for PowerPoint & Google Slides
Finance
Economies of Scale Cost Curve Comparison Template for PowerPoint & Google Slides
Comparison Chart
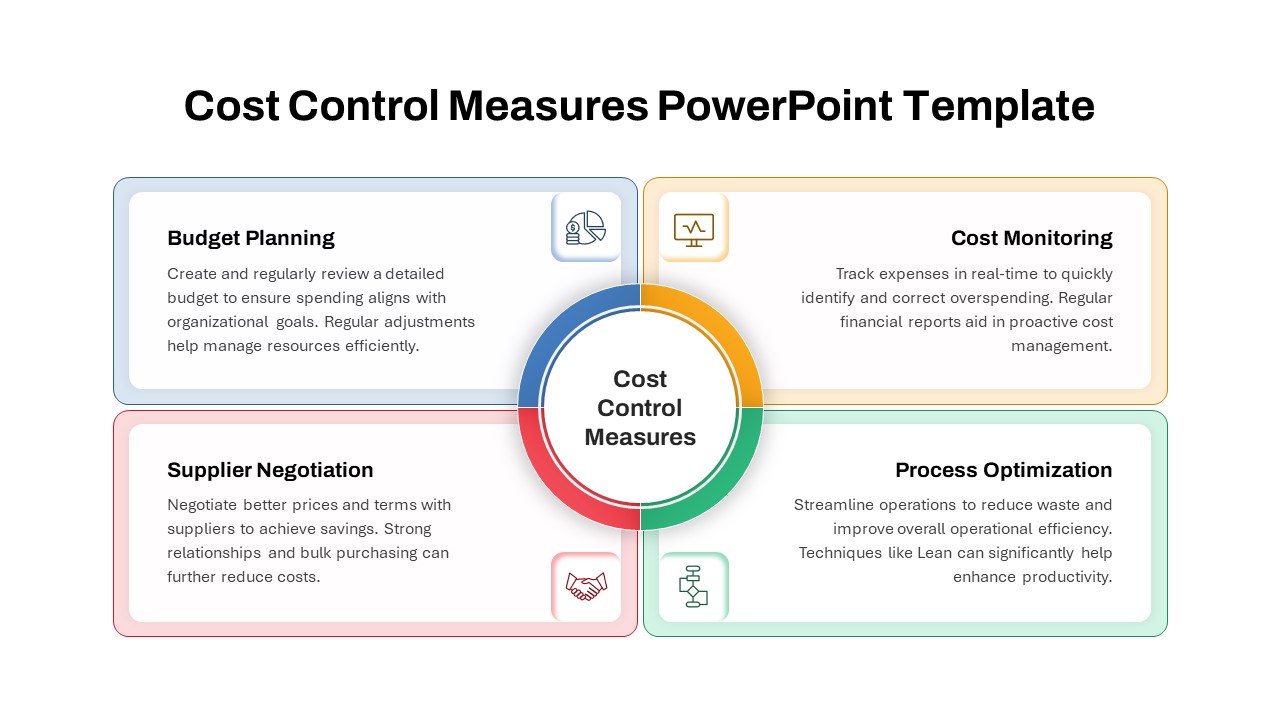
Cost Control Measures Infographic Template for PowerPoint & Google Slides
Circular
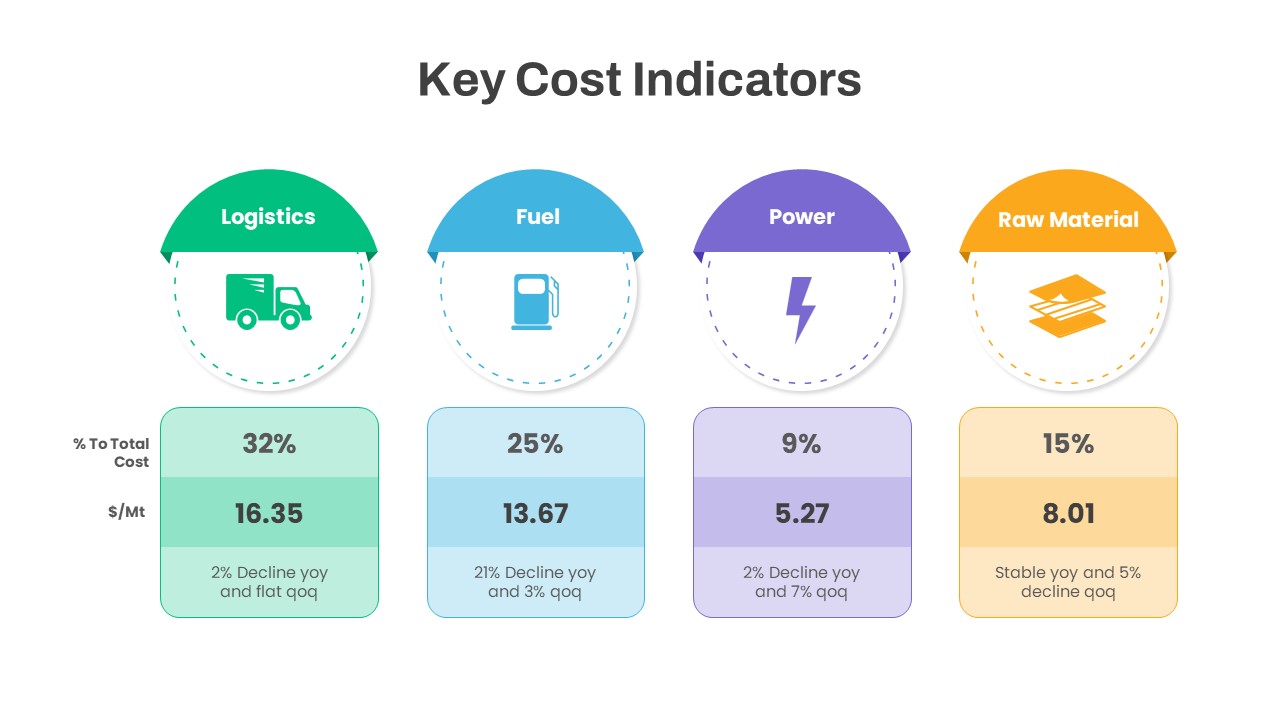
Key Cost Indicators Infographic Template for PowerPoint & Google Slides
Finance
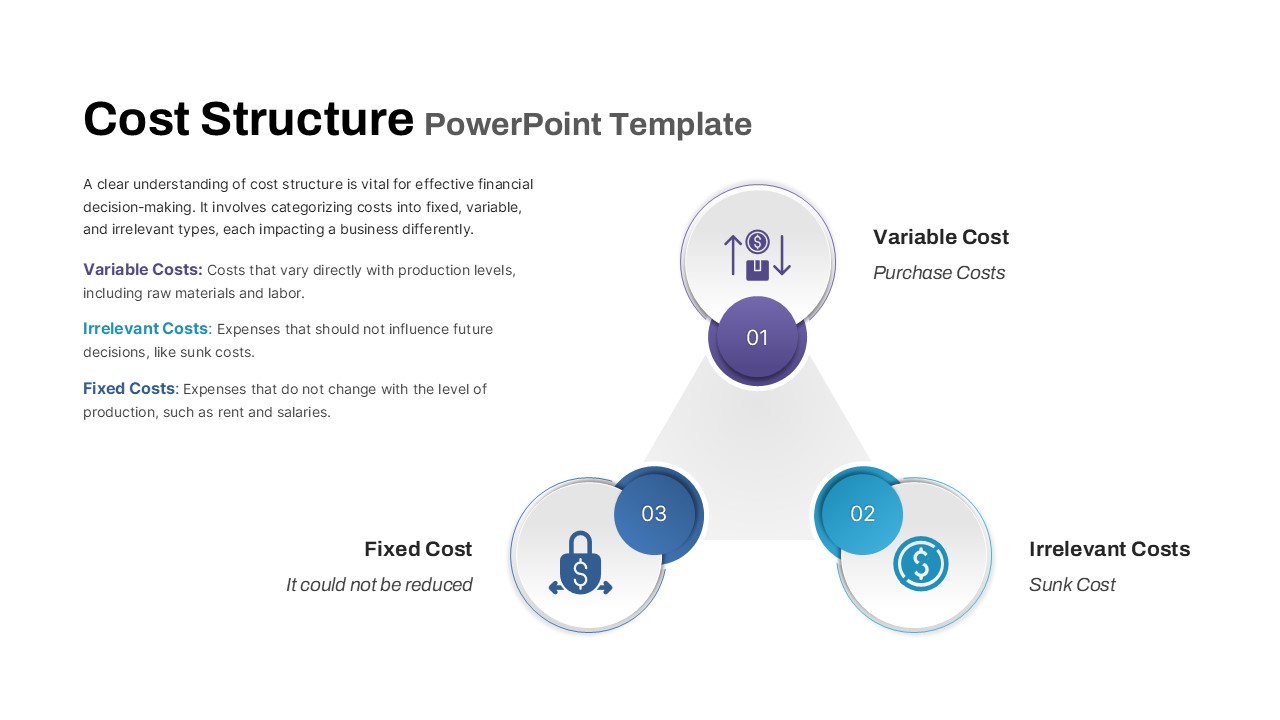
Cost Structure Triangle Diagram Template for PowerPoint & Google Slides
Finance
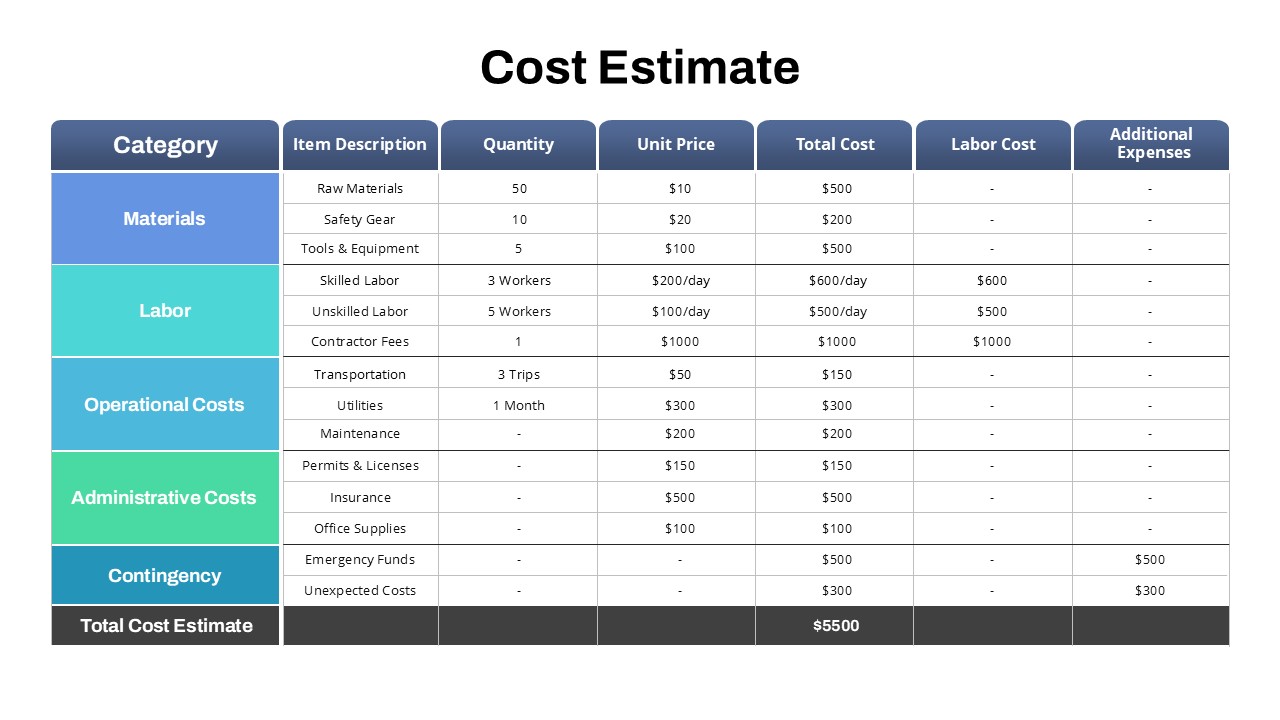
Project Detailed Cost Estimate Table Template for PowerPoint & Google Slides
Project
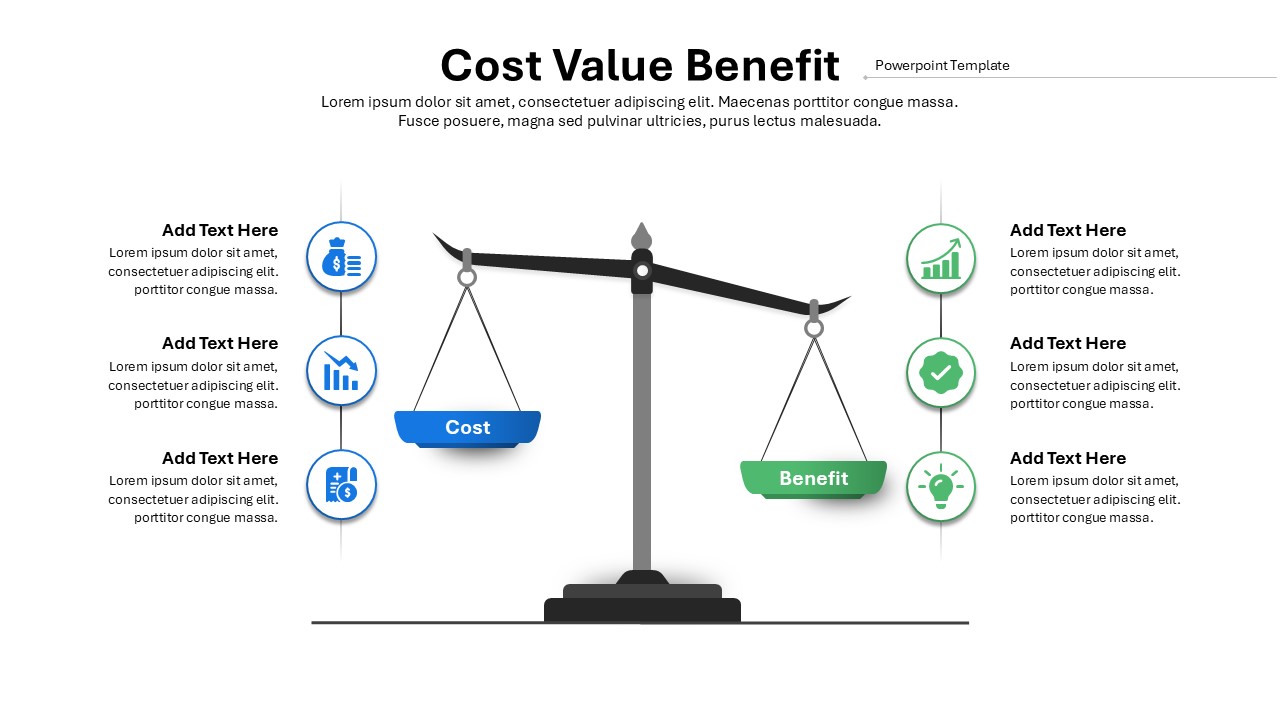
Cost vs Benefit template for PowerPoint & Google Slides
Charts
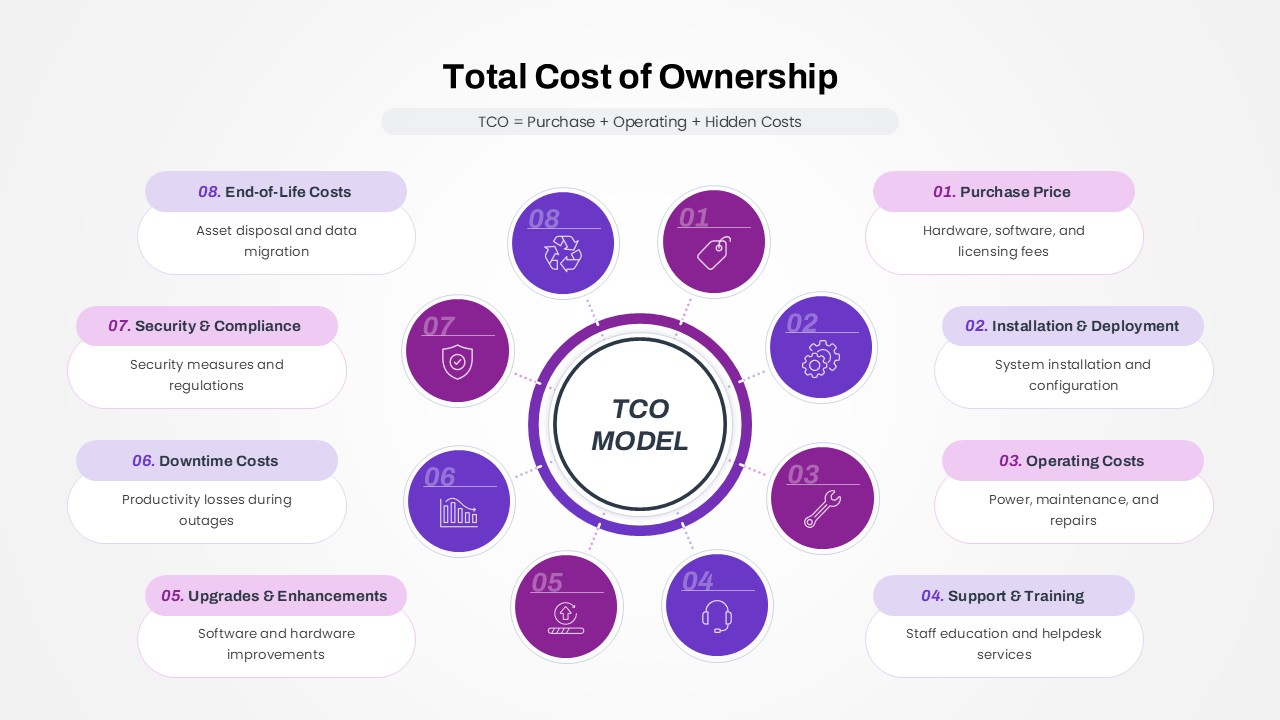
Total Cost of Ownership (TCO) Model template for PowerPoint & Google Slides
Business
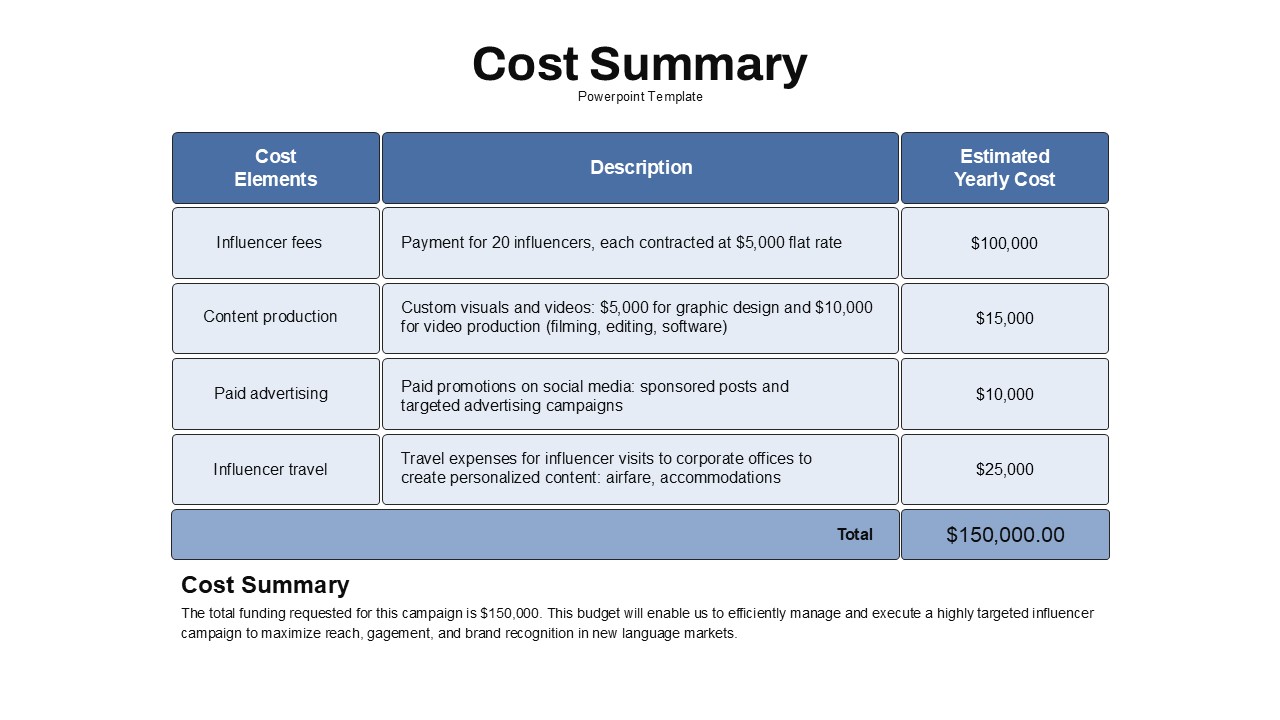
Cost Summary Table Template for PowerPoint & Google Slides
Business Report
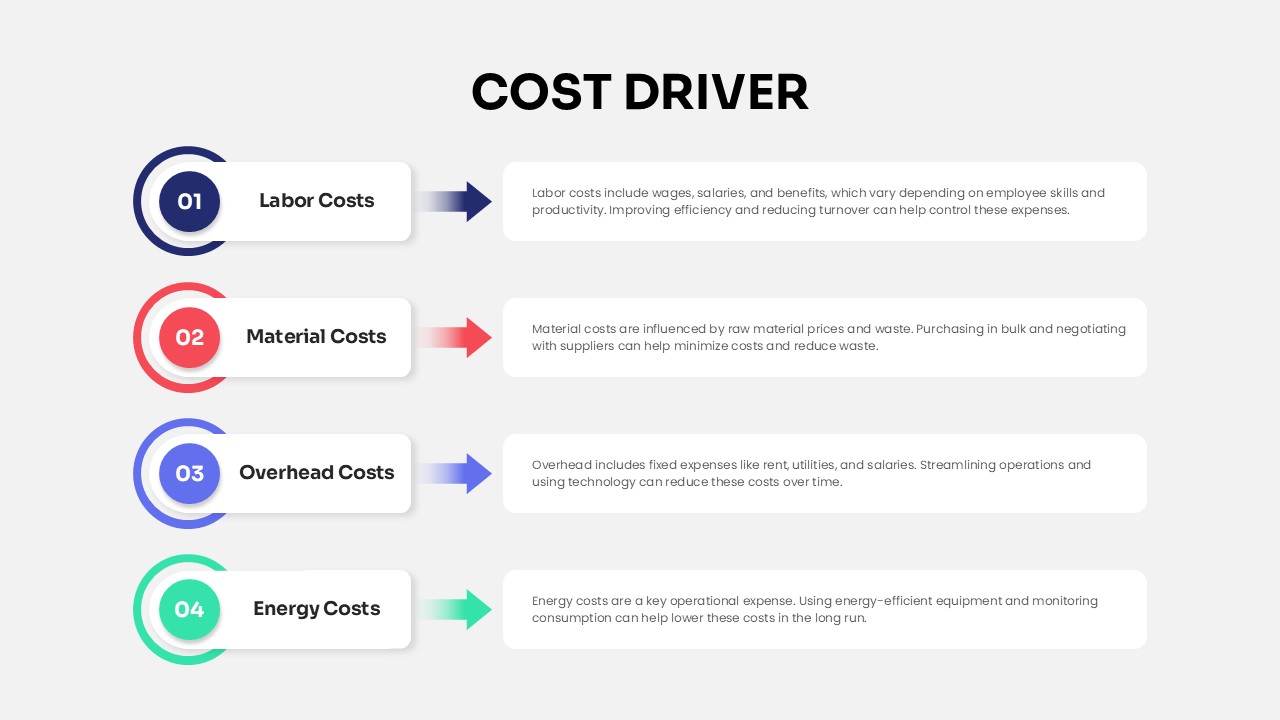
Cost Driver Infographic Slide Pack Template for PowerPoint & Google Slides
Process
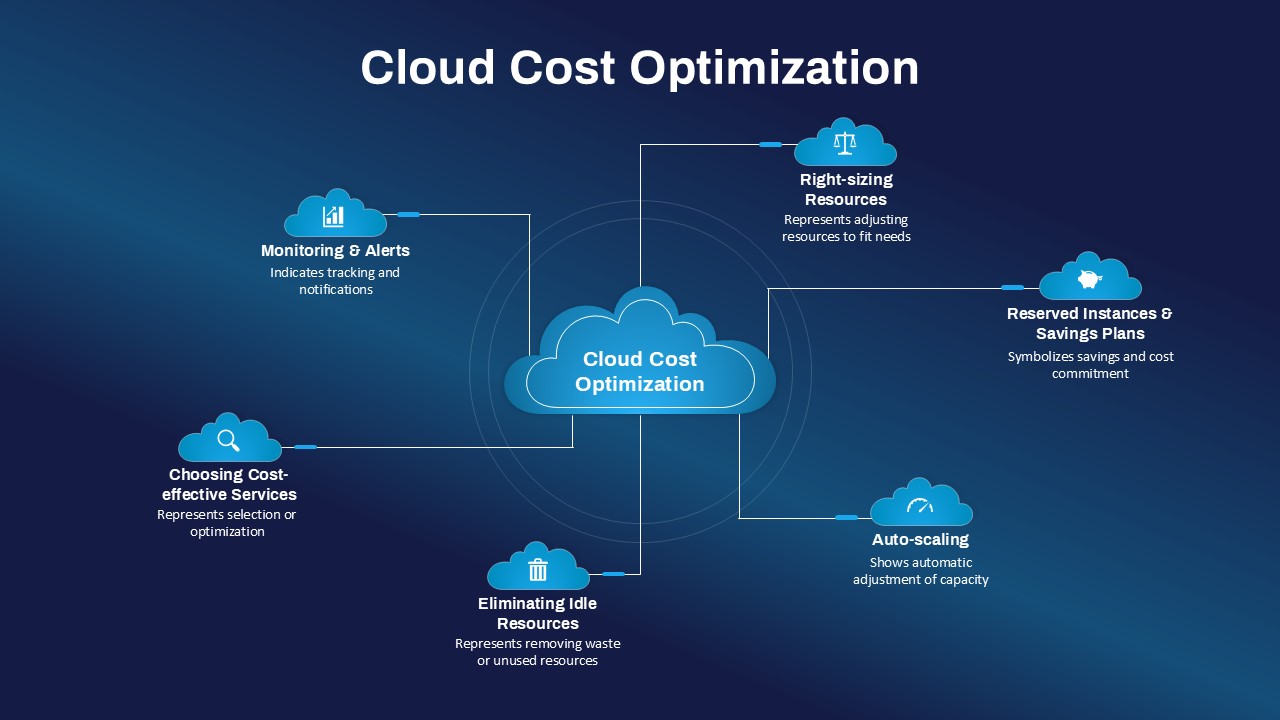
Cloud Cost Optimization Hub-and-Spoke Template for PowerPoint & Google Slides
Cloud Computing
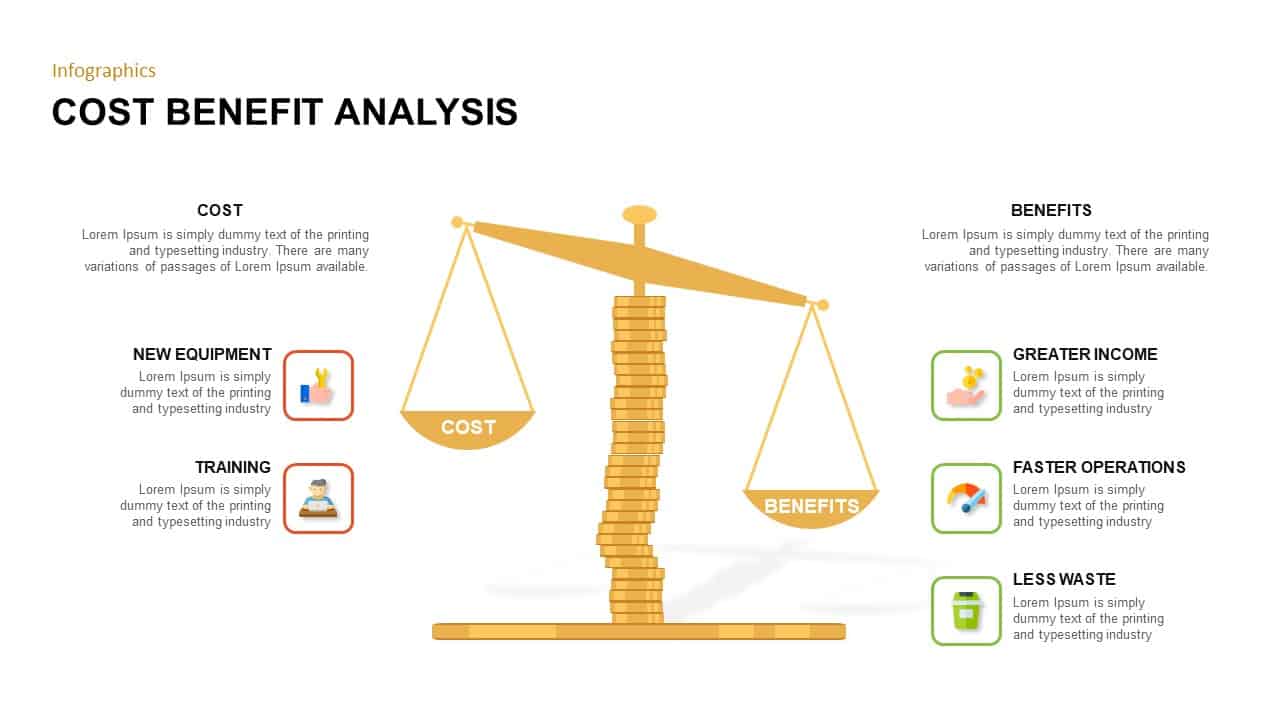
Cost Benefit Analysis infographic for PowerPoint & Google Slides
Comparison
Circle Strategy Creative Chart template for PowerPoint & Google Slides
Business Strategy
Skimming Pricing Strategy Line Chart Template for PowerPoint & Google Slides
Business Strategy
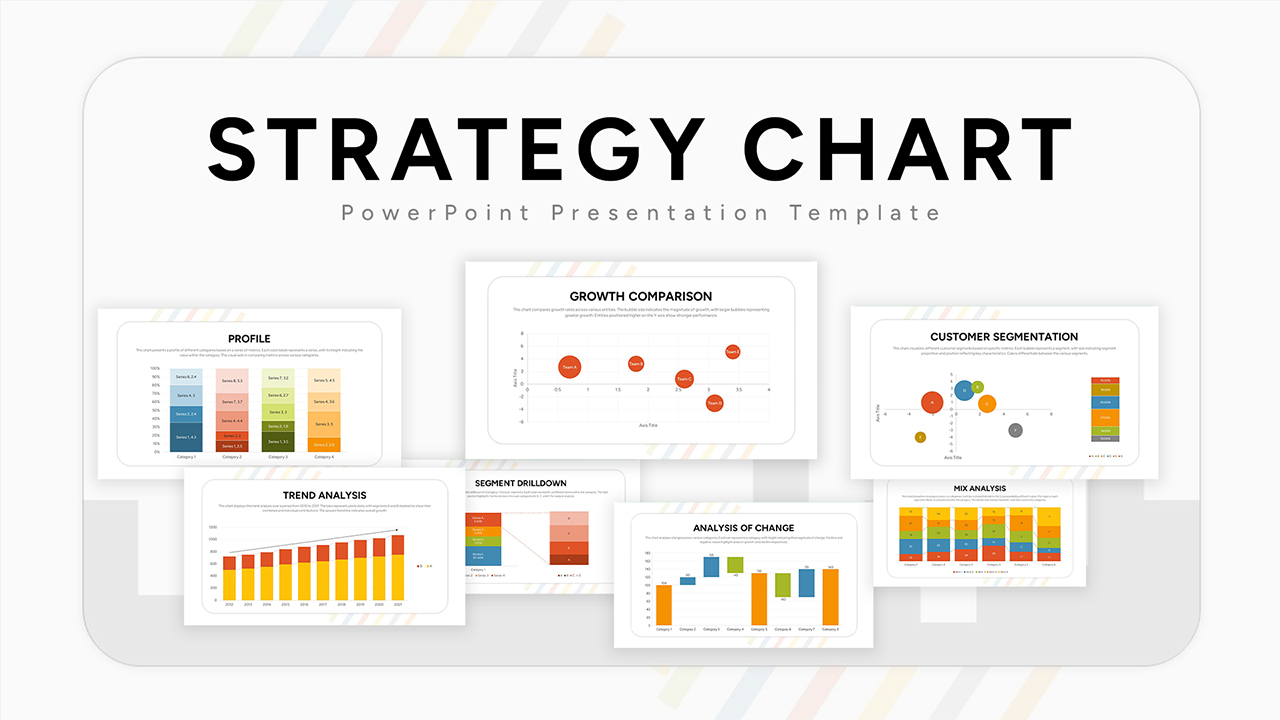
Ultimate Strategy Chart Presentation Template for PowerPoint & Google Slides
Charts
SQ3R Study Strategy Infographic Slides Template for PowerPoint & Google Slides
Business Strategy
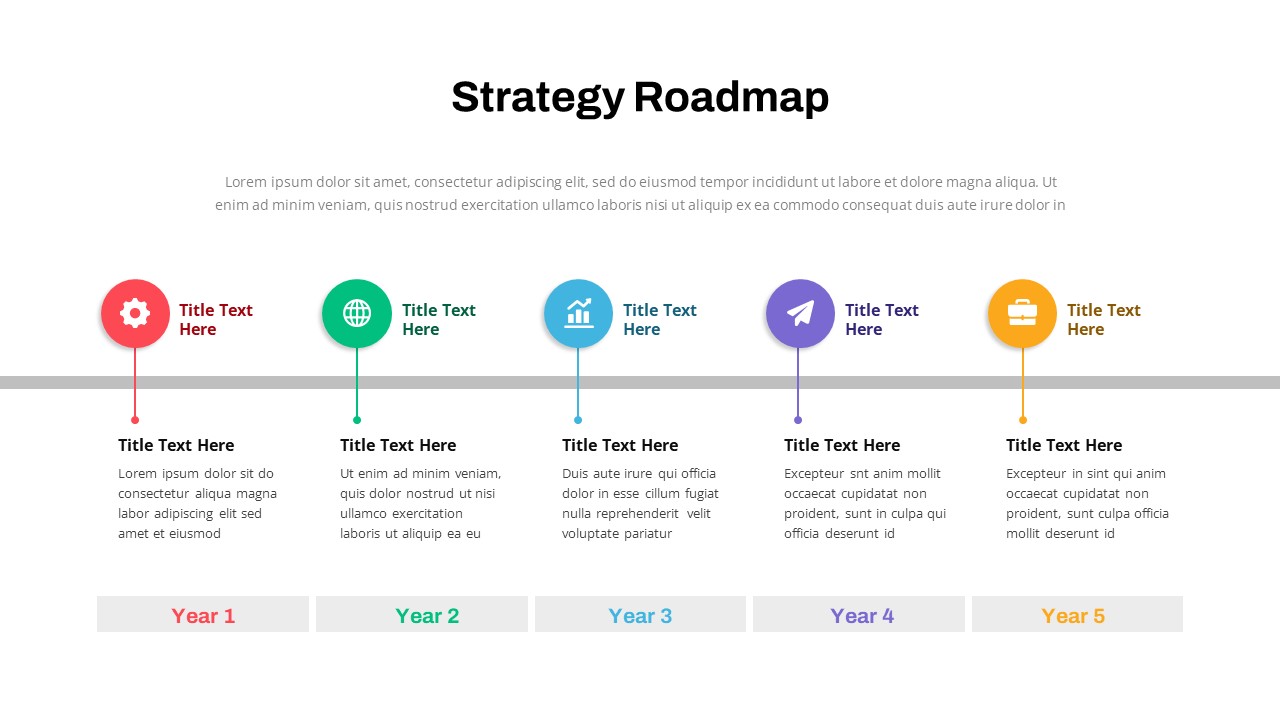
Strategy Roadmap Timeline Slides Template for PowerPoint & Google Slides
Roadmap

Innovation Ambition Matrix & Funnel Strategy Slides for PowerPoint & Google Slides
Process
Quad Chart Infographic Pack of 8 Slides Template for PowerPoint & Google Slides
Comparison Chart
Free Professional Gantt Chart Pack – 4 Slides Template for PowerPoint & Google Slides
Gantt Chart
Free
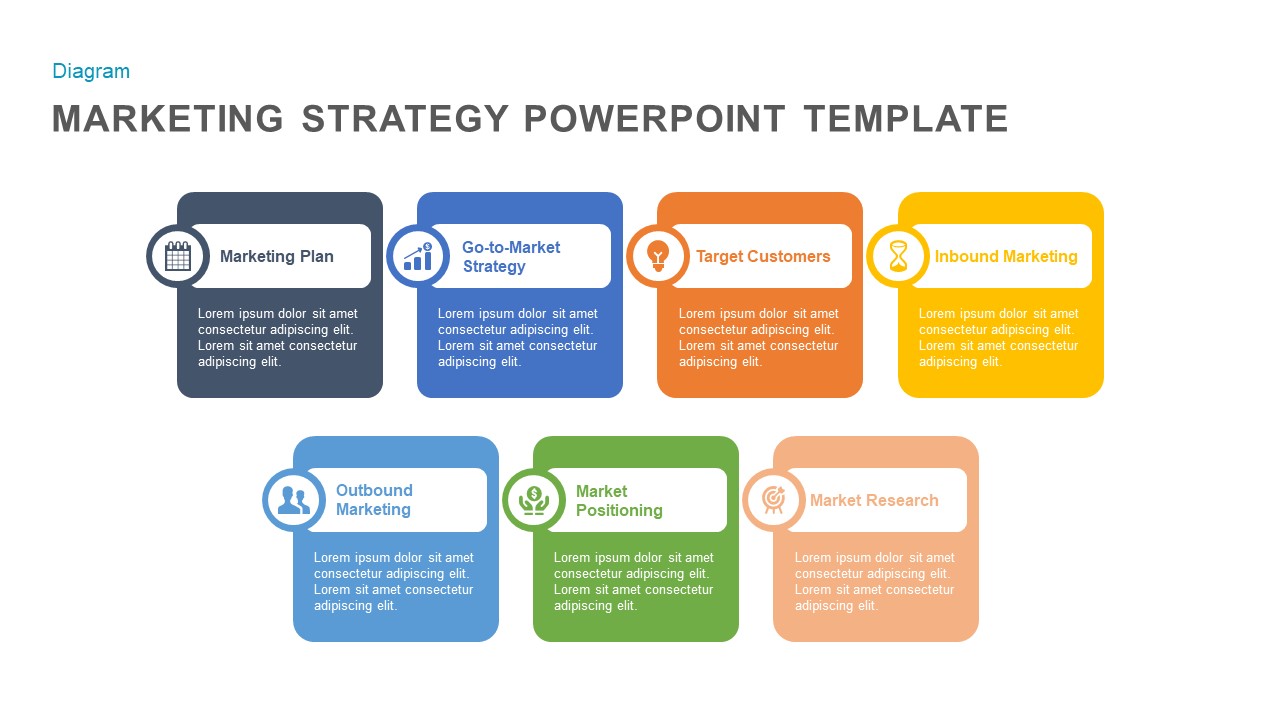
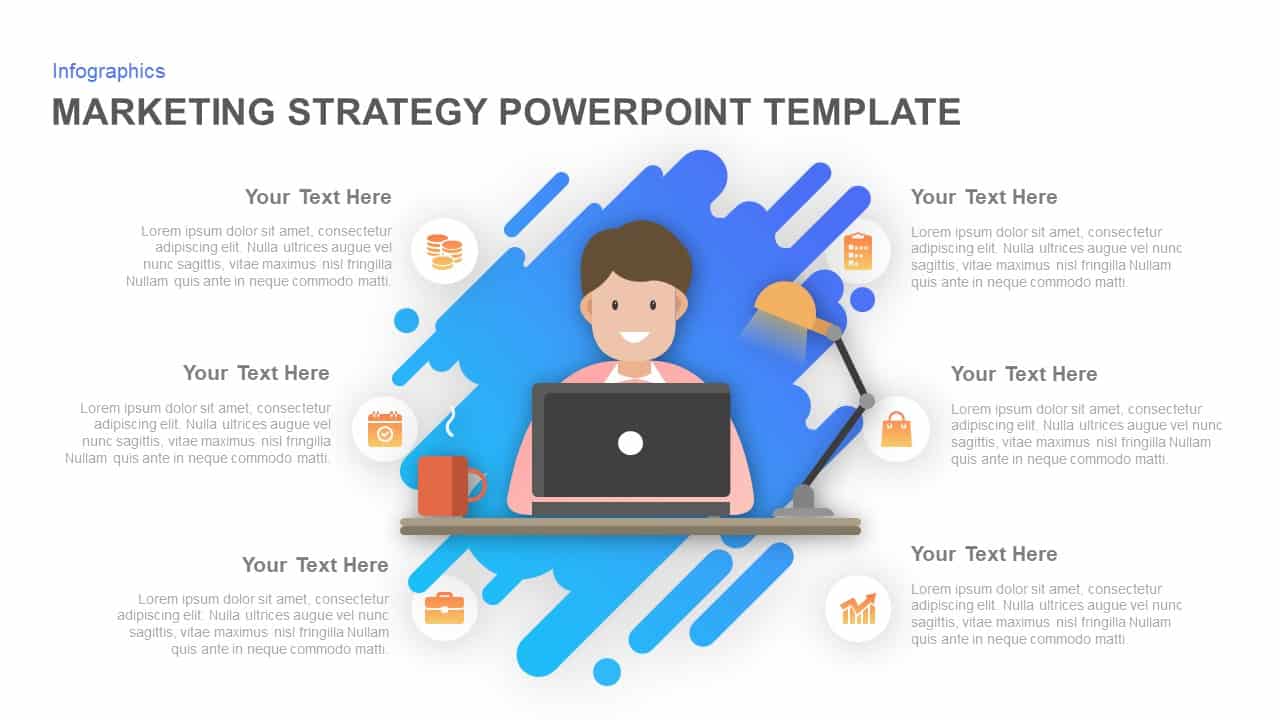
Marketing Strategy PowerPoint template for PowerPoint & Google Slides
Marketing

Go-to-Market Strategy PowerPoint Template for PowerPoint & Google Slides
Marketing
Marketing Strategy Arrow Infographic Template for PowerPoint & Google Slides
Comparison
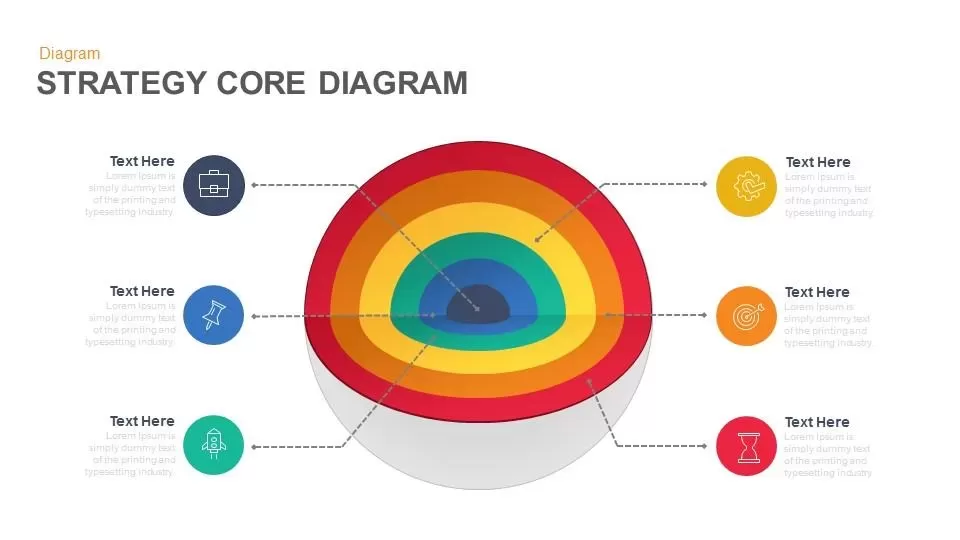
Strategy Core Diagram template for PowerPoint & Google Slides
Process
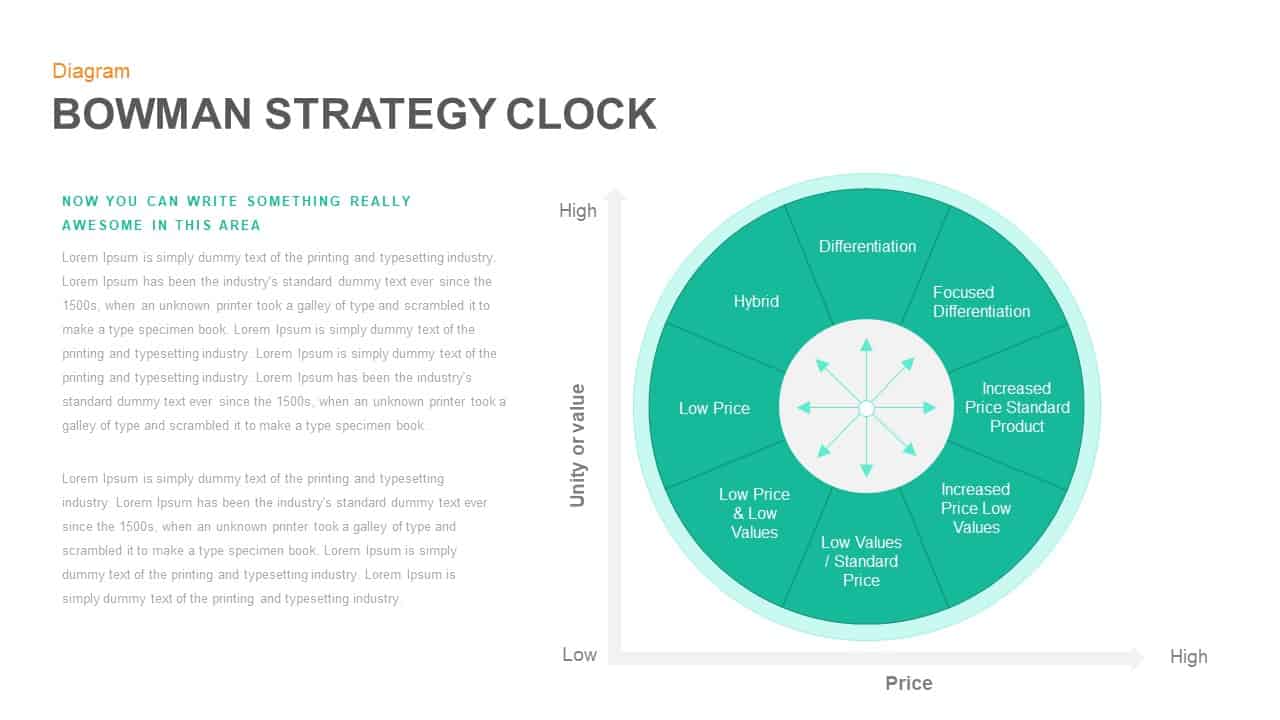
Modern Bowman Strategy Clock Diagram Slide Template for PowerPoint & Google Slides
Competitor Analysis
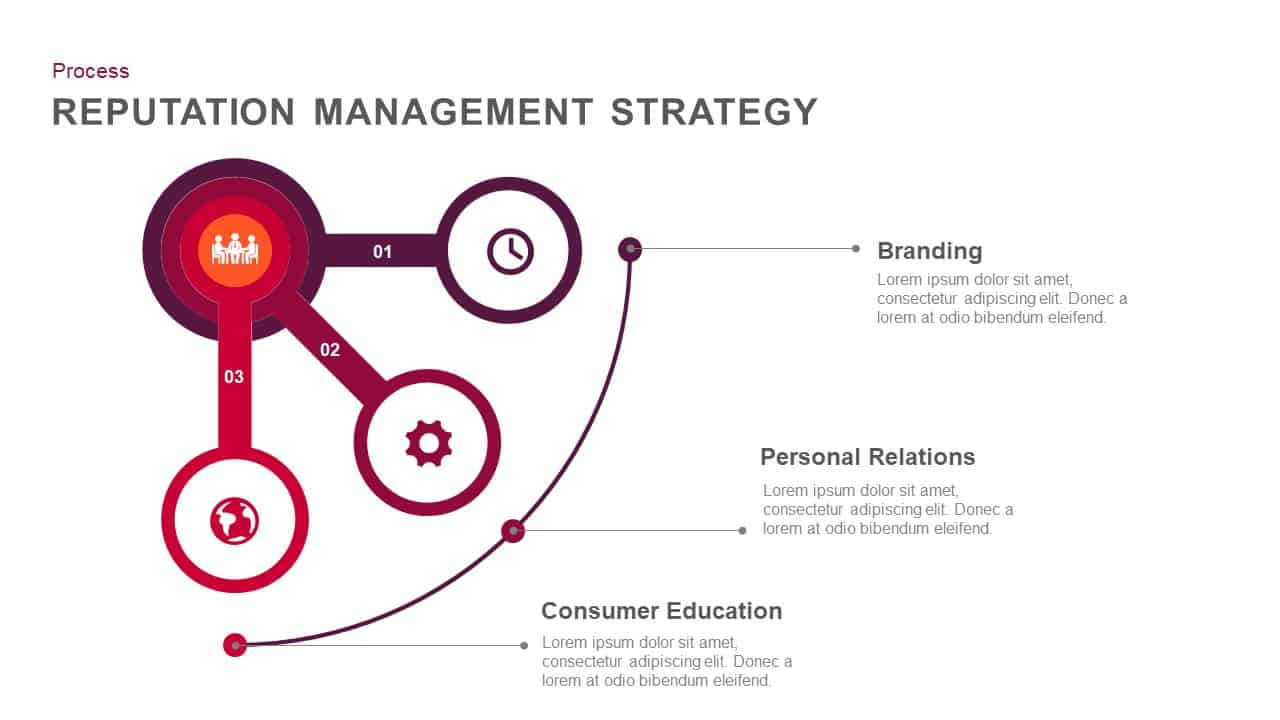
Reputation Management Strategy template for PowerPoint & Google Slides
Business Strategy
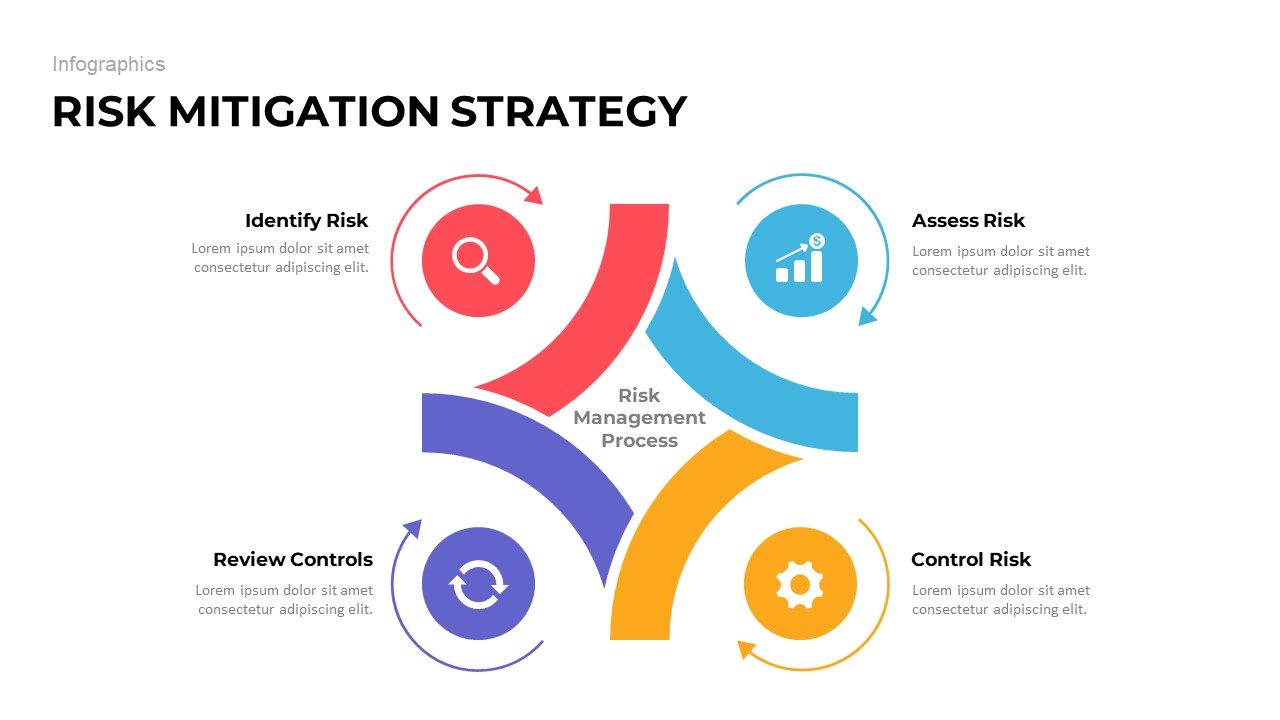
Risk Mitigation Strategy template for PowerPoint & Google Slides
Risk Management
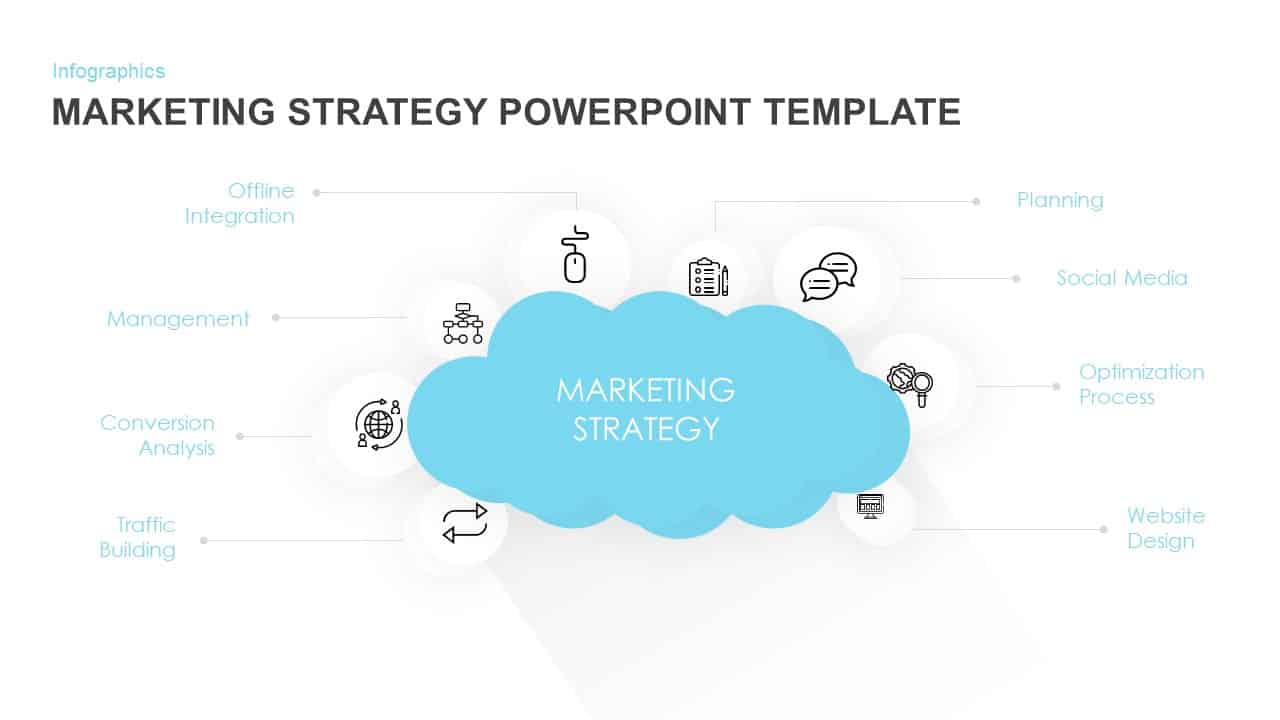
Marketing Strategy Cloud Diagram Template for PowerPoint & Google Slides
Digital Marketing
Marketing Strategy Hub Template for PowerPoint & Google Slides
Digital Marketing
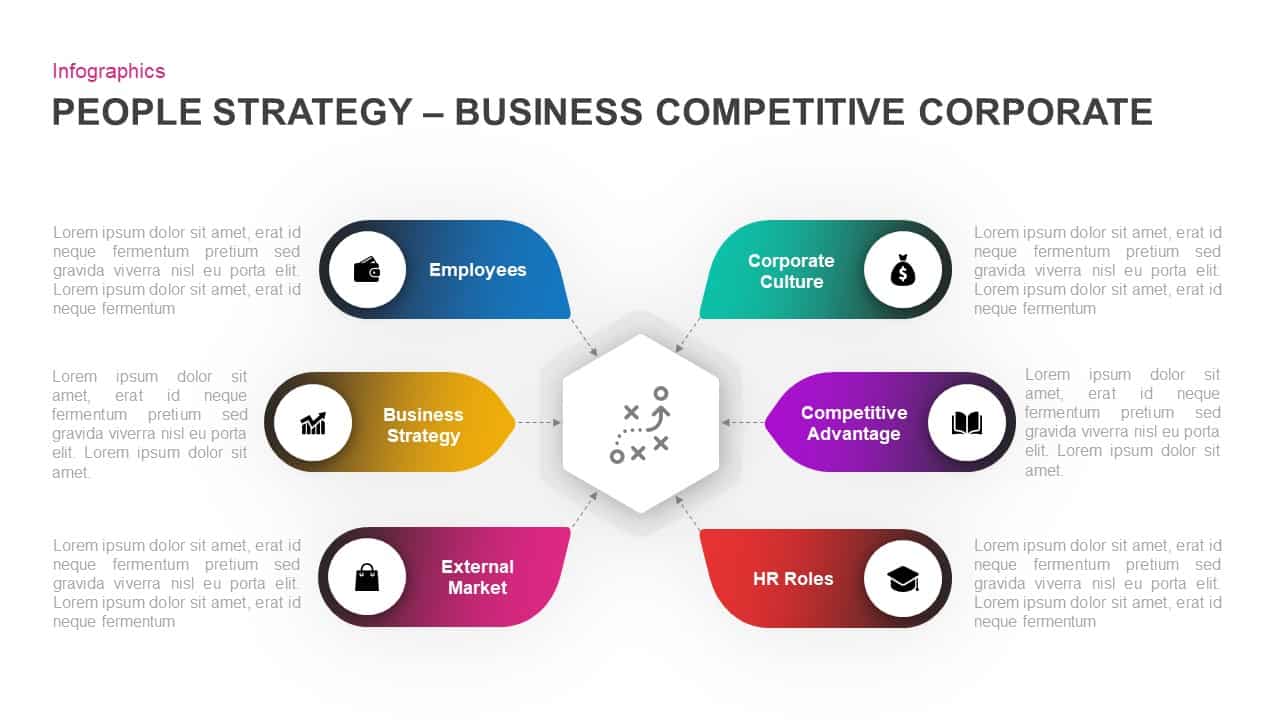
Corporate People Strategy Infographic Template for PowerPoint & Google Slides
Process
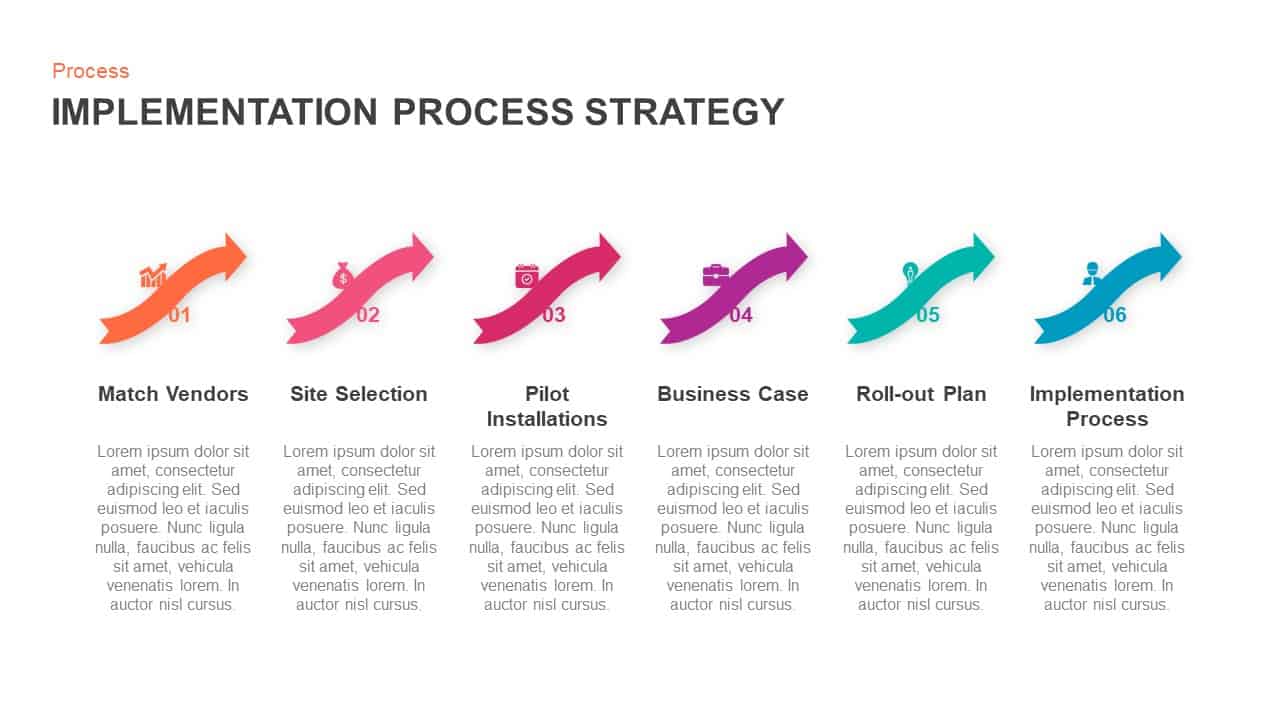
Implementation Process Strategy Arrow Template for PowerPoint & Google Slides
Arrow
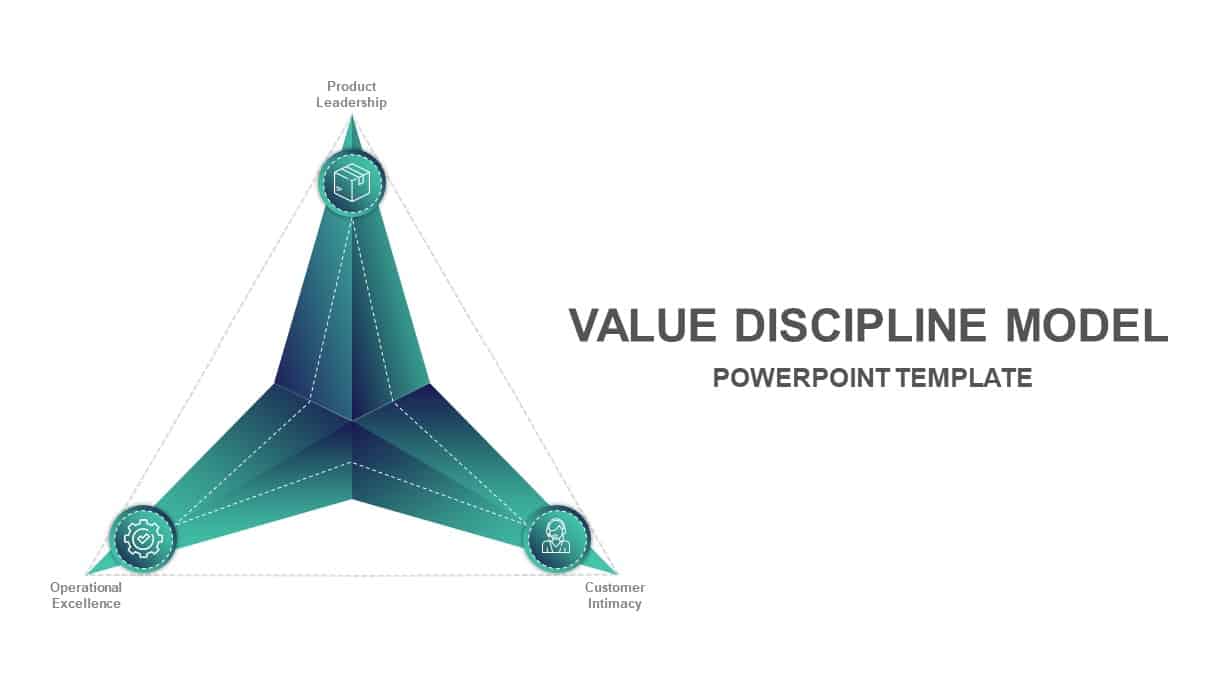
Value Discipline Strategy Diagram Template for PowerPoint & Google Slides
Comparison
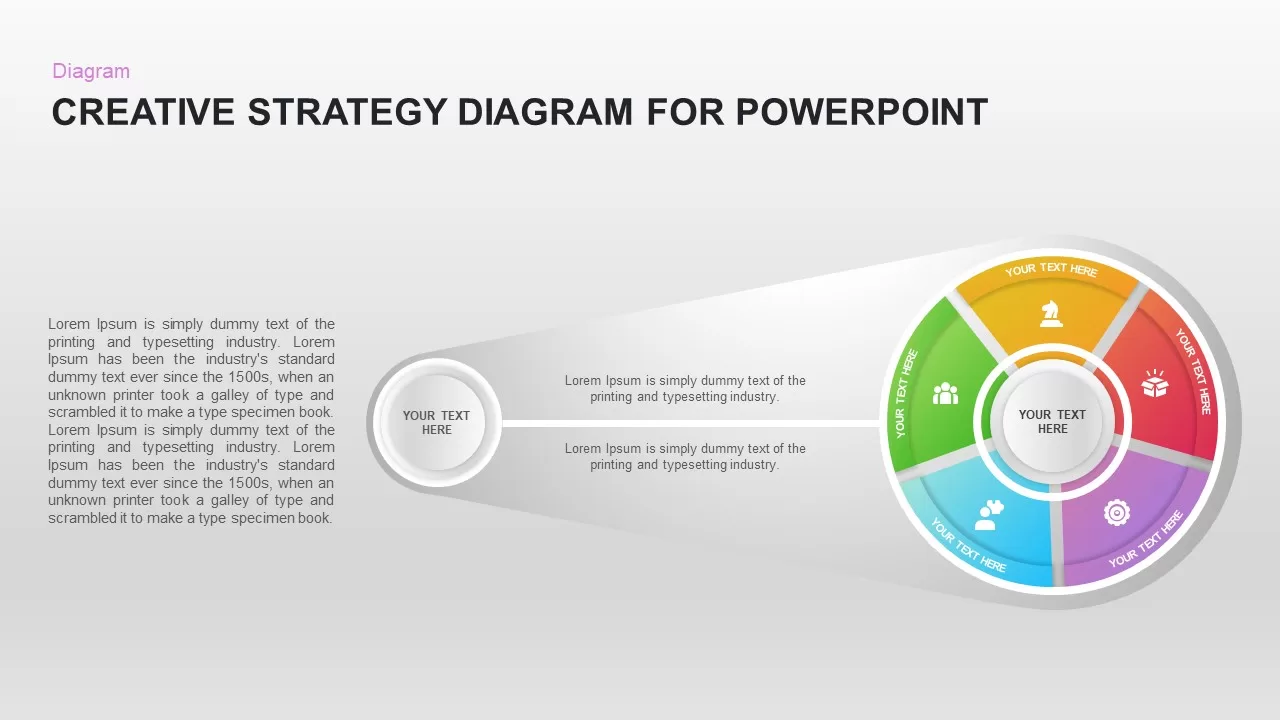
Creative Strategy Diagram Template for PowerPoint & Google Slides
Business Strategy
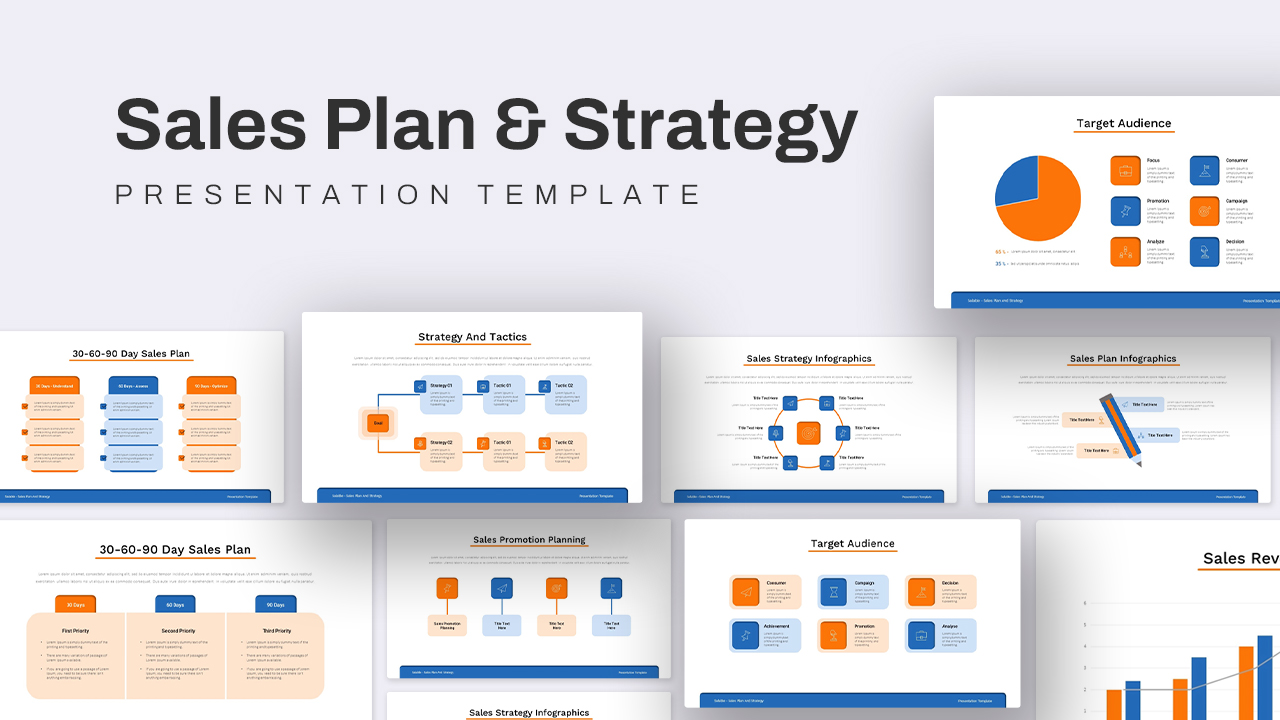
Sales Plan & Strategy Overview template for PowerPoint & Google Slides
Business Strategy
Gradient Business Strategy Pitch Deck Template for PowerPoint & Google Slides
Pitch Deck
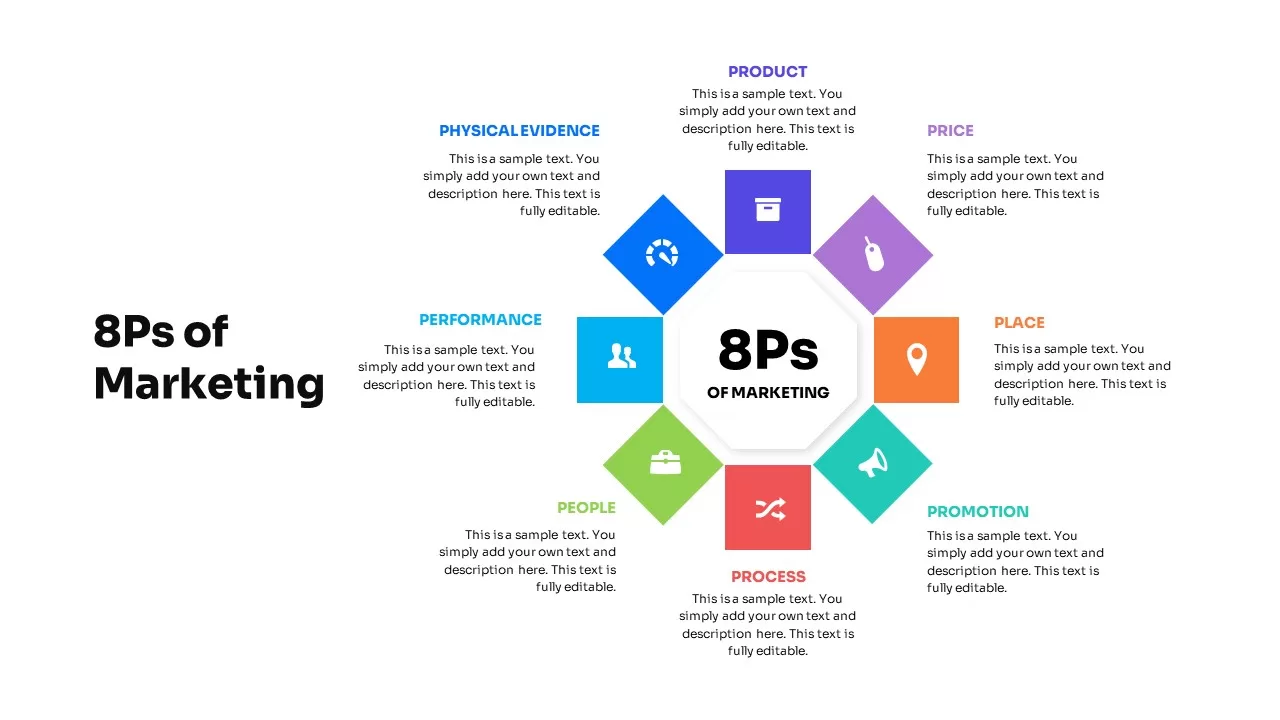
8Ps of Marketing Strategy Infographic Template for PowerPoint & Google Slides
Marketing
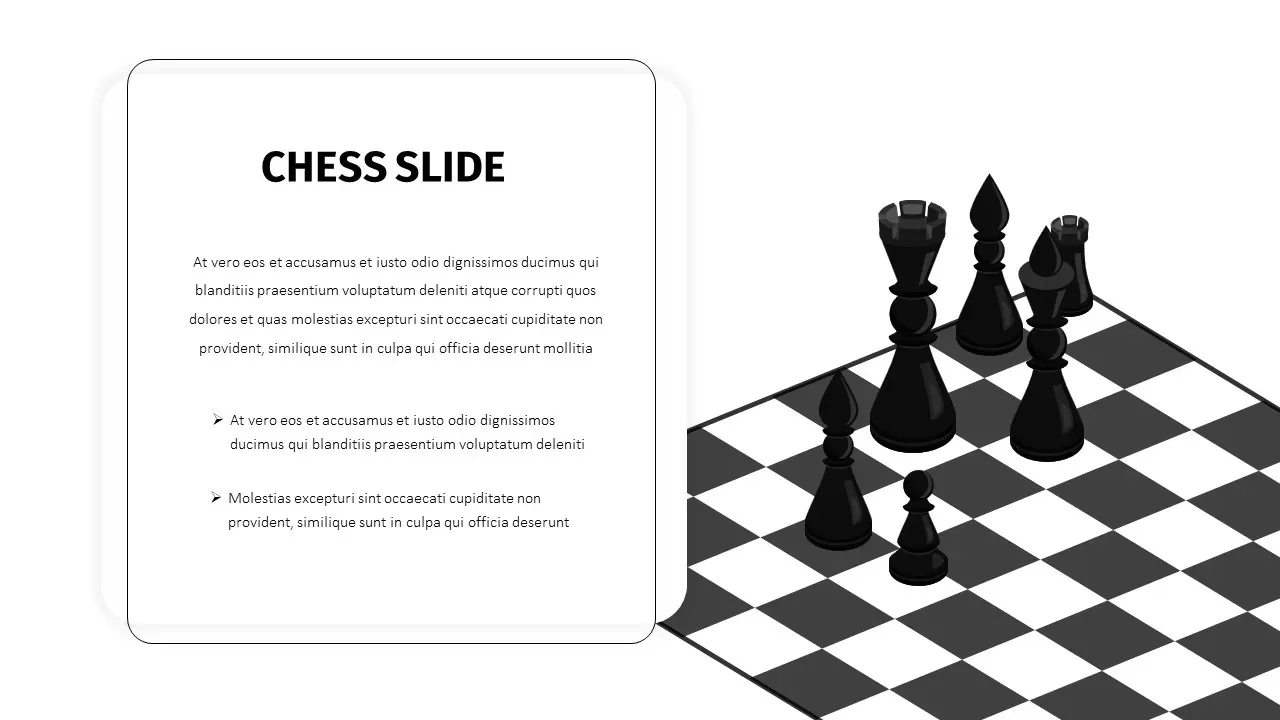
3D Chess Strategy Template for PowerPoint & Google Slides
Competitor Analysis
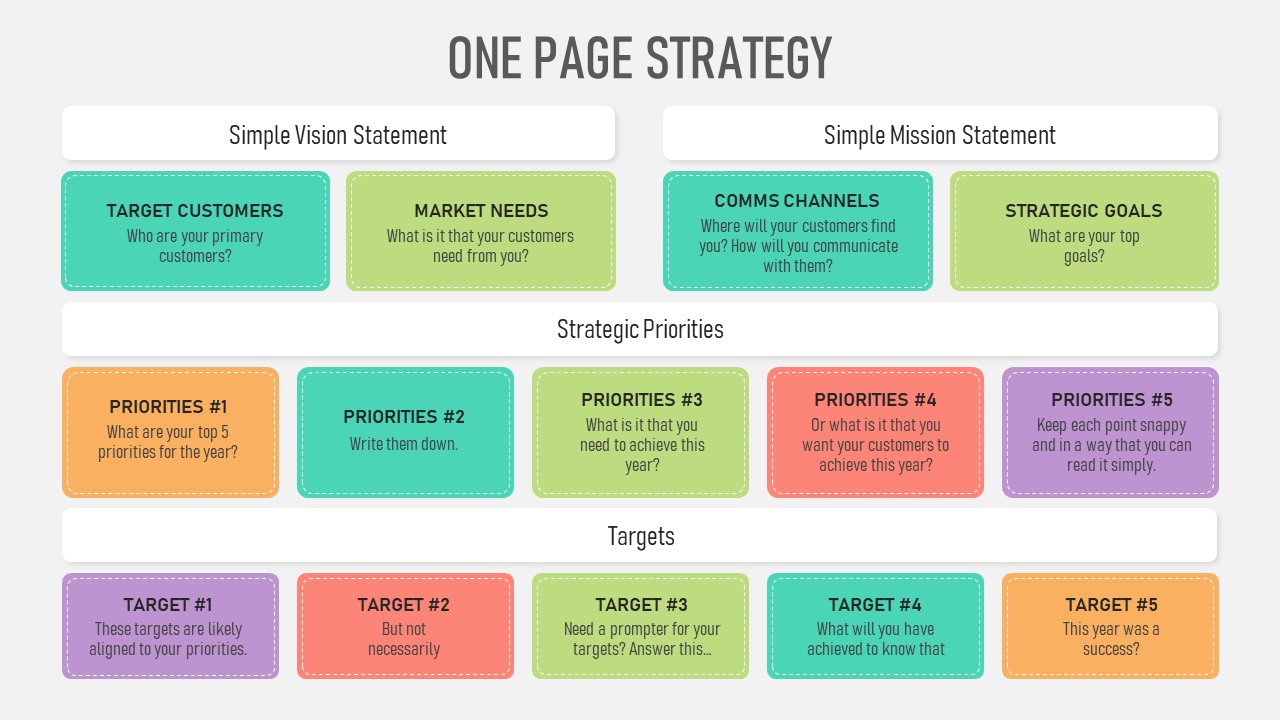
One-Page Business Strategy Plan Slide Template for PowerPoint & Google Slides
Business Strategy
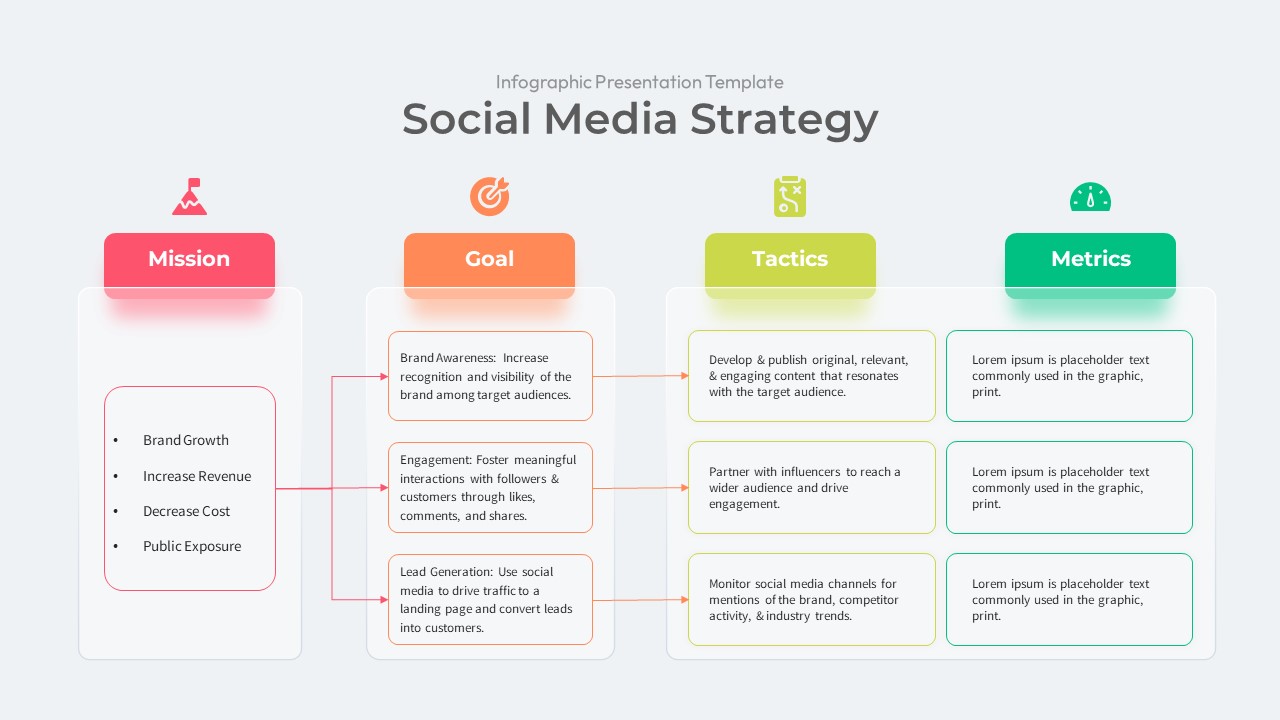
Social Media Marketing Strategy Template for PowerPoint & Google Slides
Digital Marketing
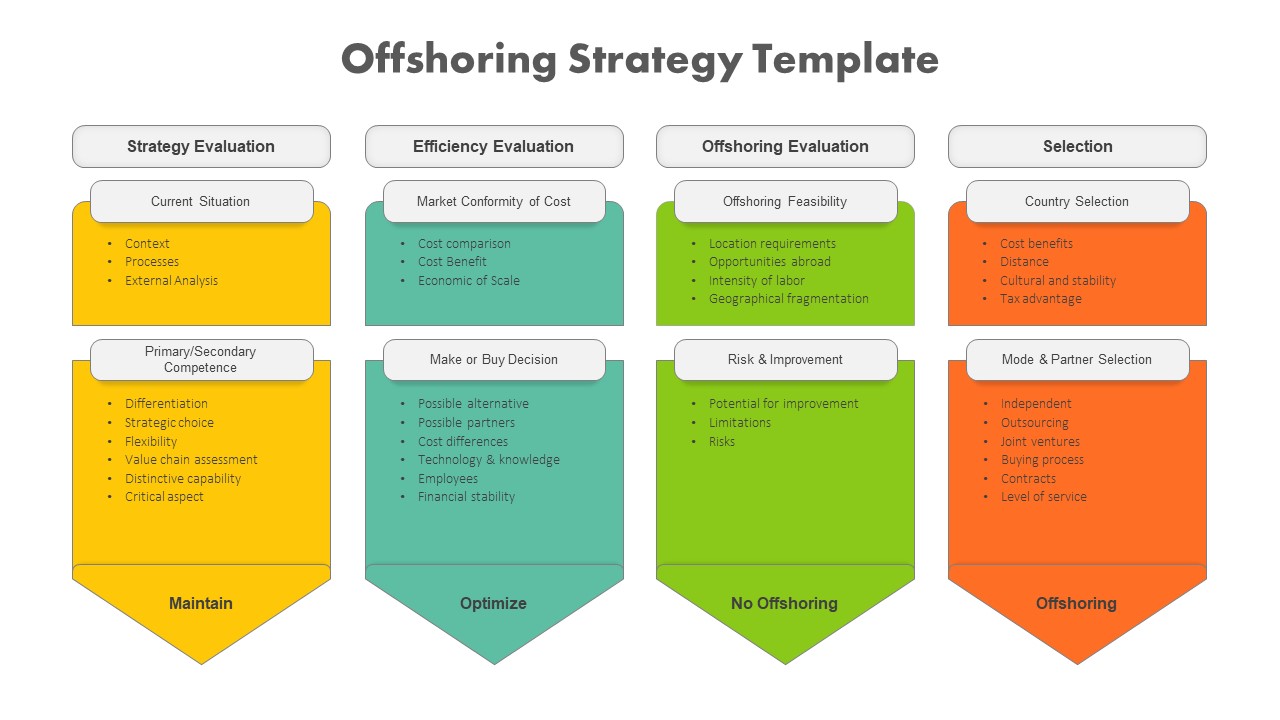
Offshoring Strategy Framework Design Template for PowerPoint & Google Slides
Business Strategy
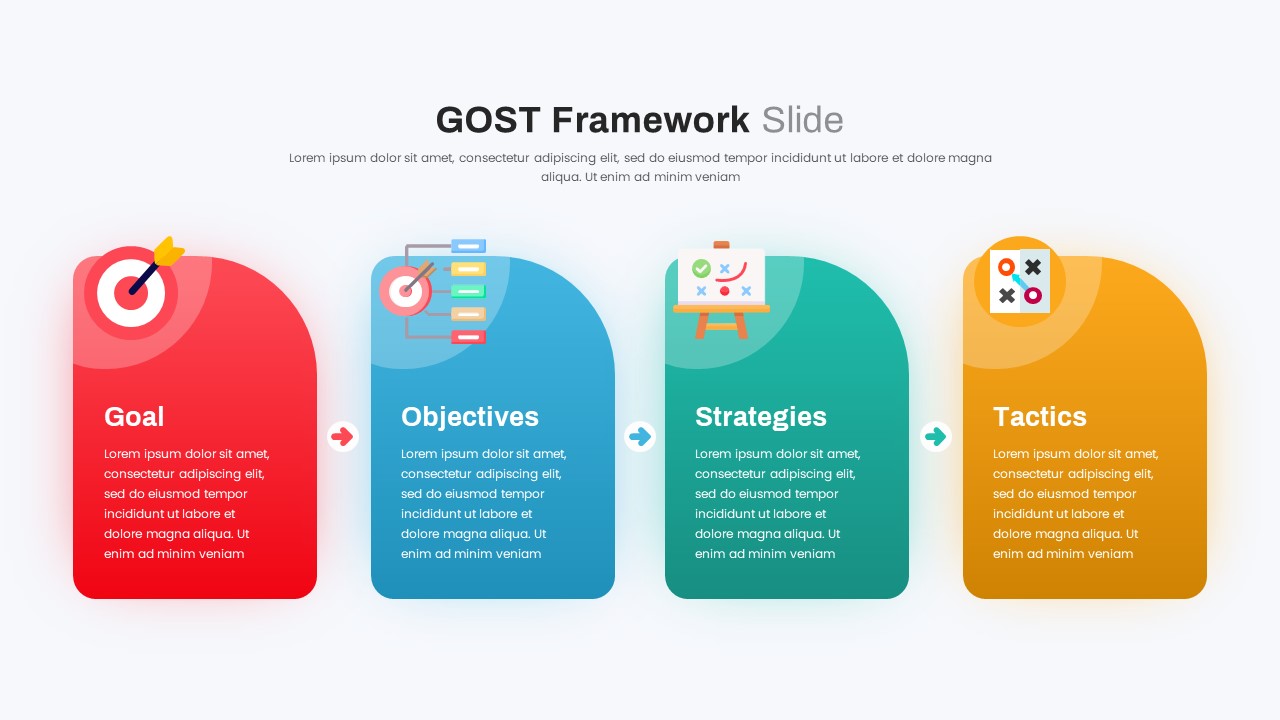
GOST Strategy Framework Template for PowerPoint & Google Slides
Business Strategy
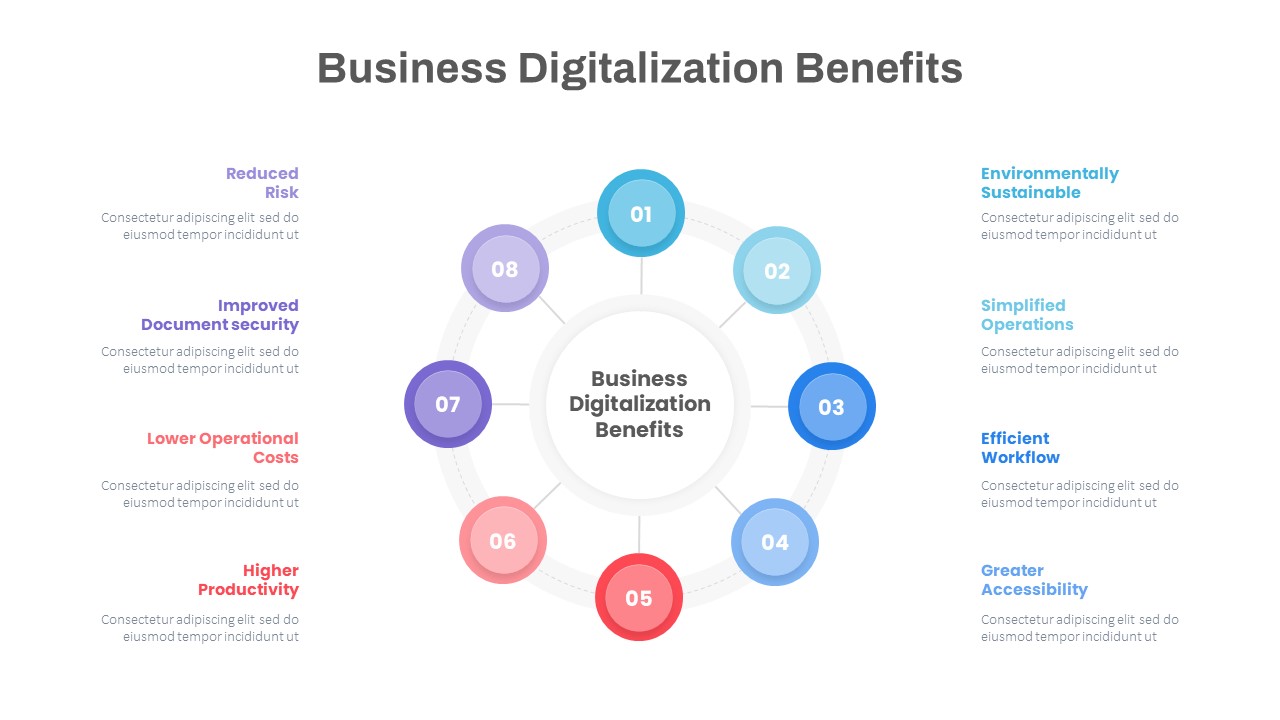
Business Digitalization Strategy Deck Template for PowerPoint & Google Slides
Business Strategy

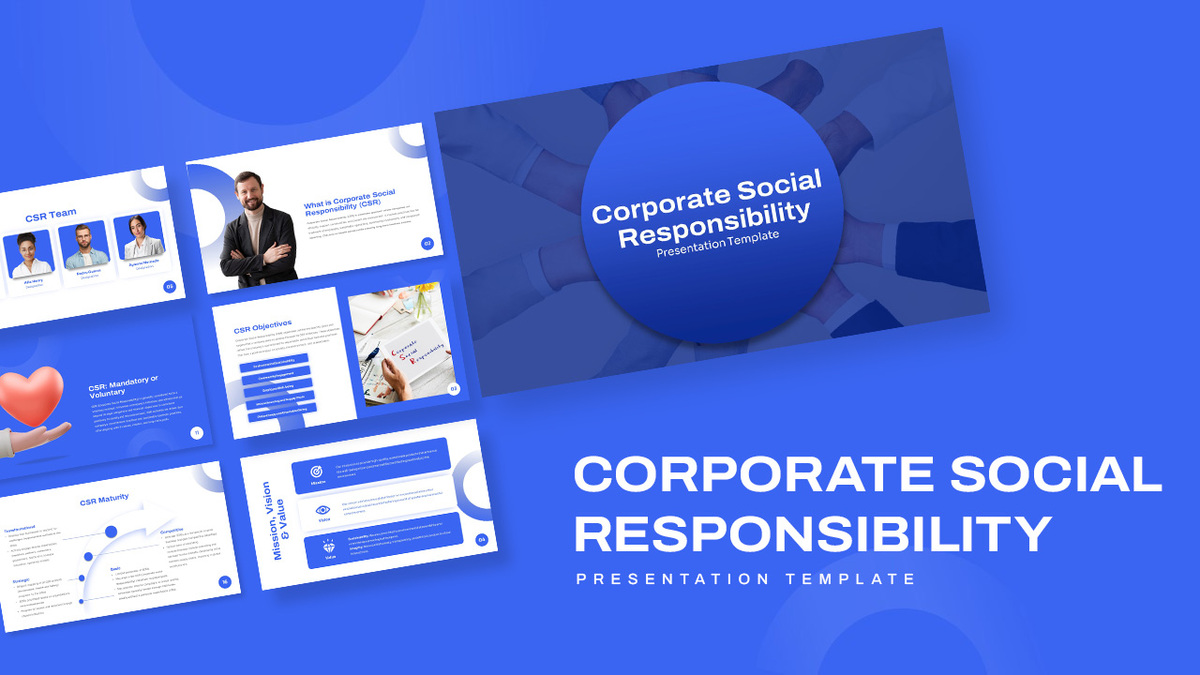
Corporate Social Responsibility Strategy Template for PowerPoint & Google Slides
Company Profile
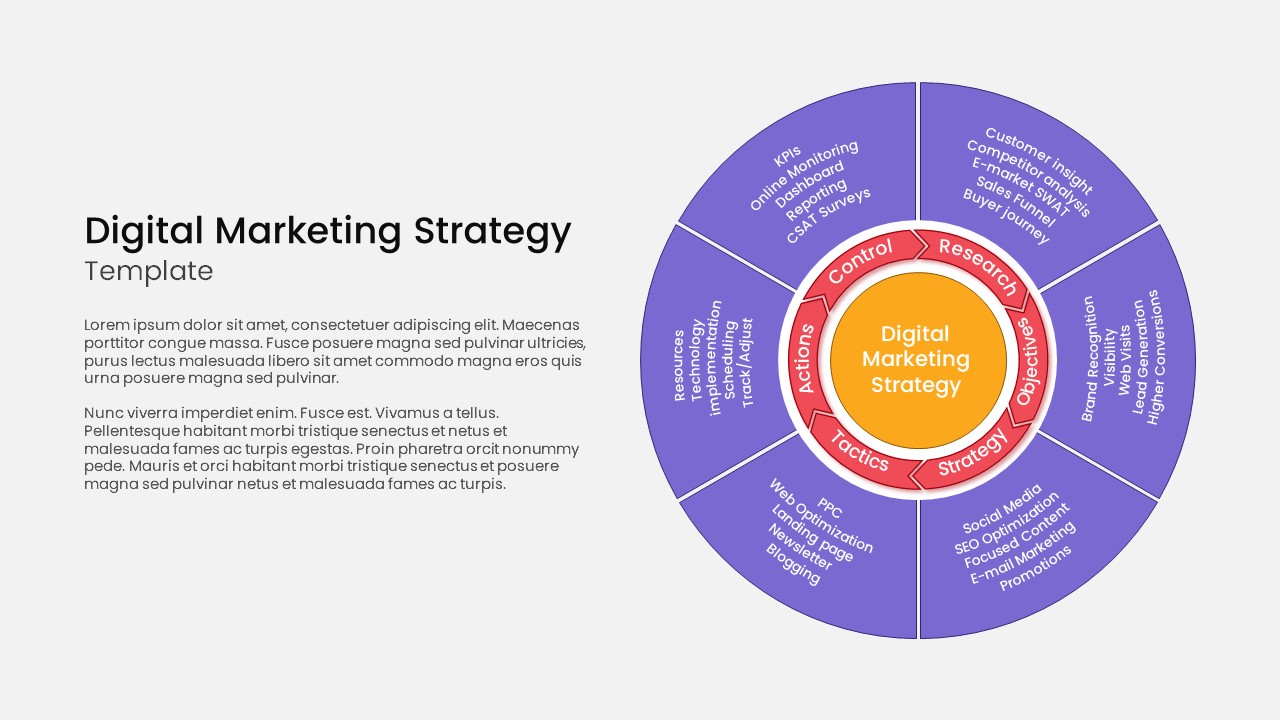
Circular Hub Digital Marketing Strategy Template for PowerPoint & Google Slides
Digital Marketing
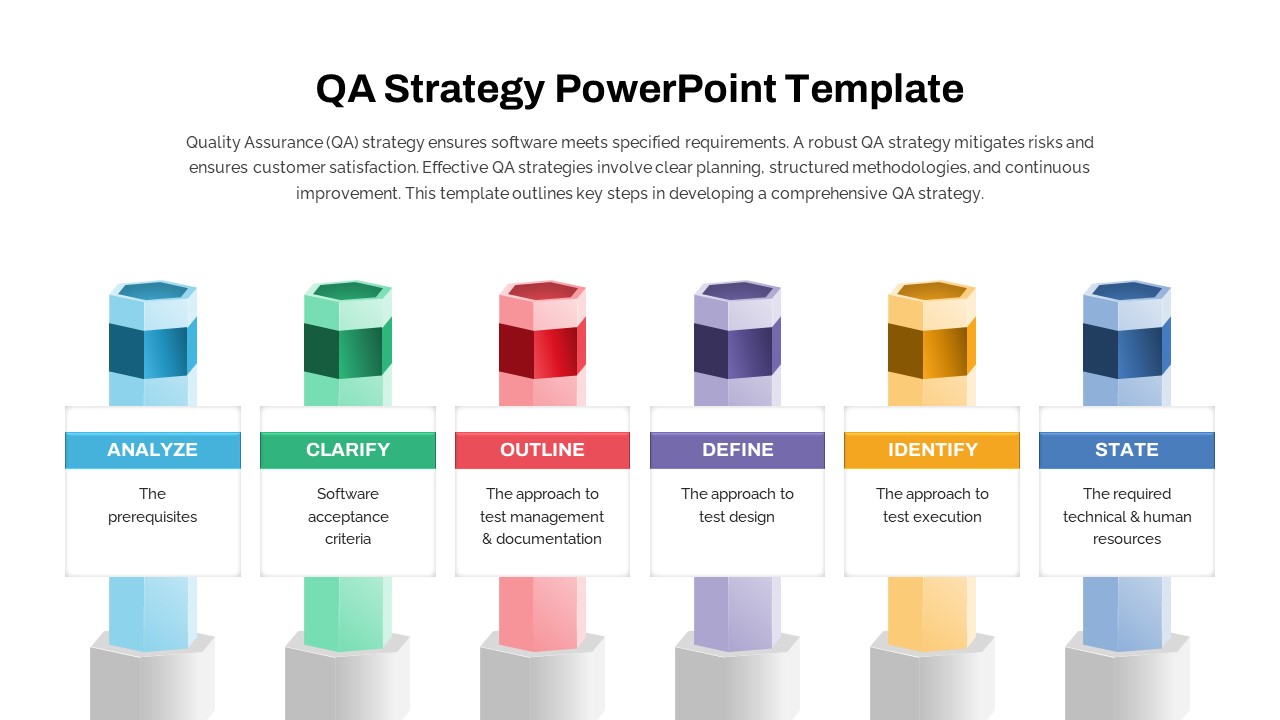
Six-Step QA Strategy Pillar Diagram Template for PowerPoint & Google Slides
Software Development
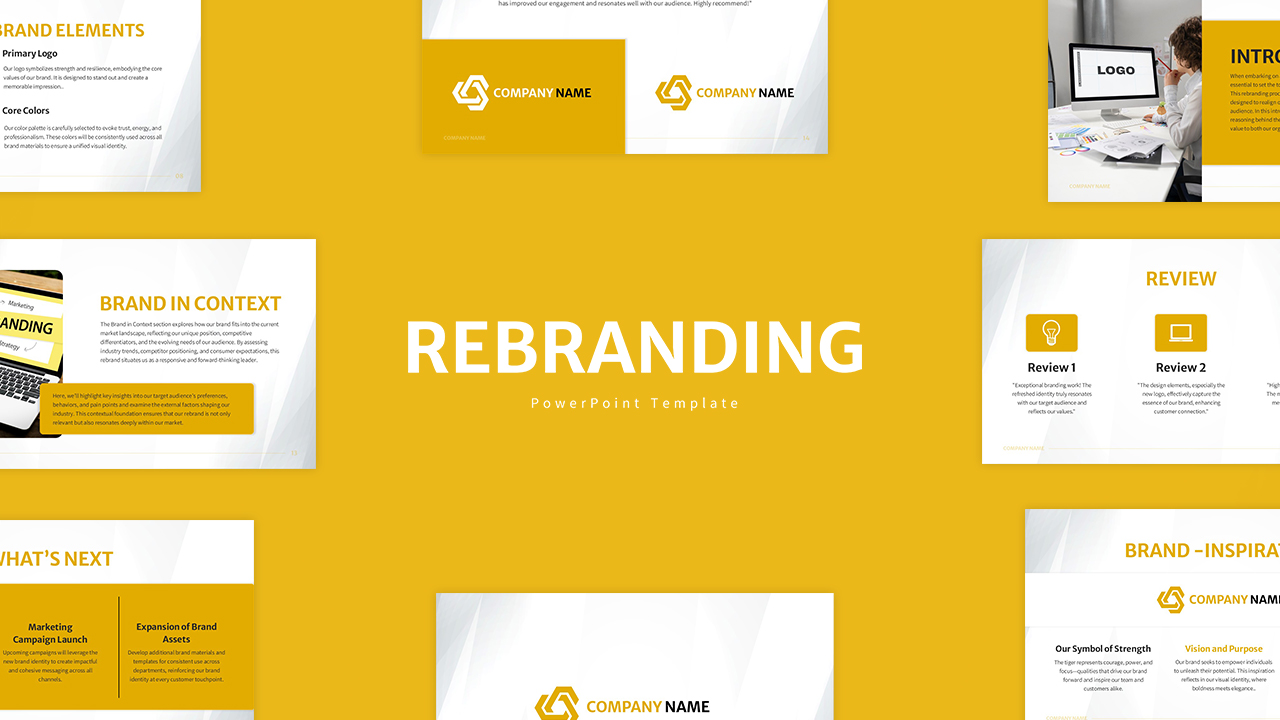
Corporate Rebranding Strategy Pitch Deck Template for PowerPoint & Google Slides
Pitch Deck
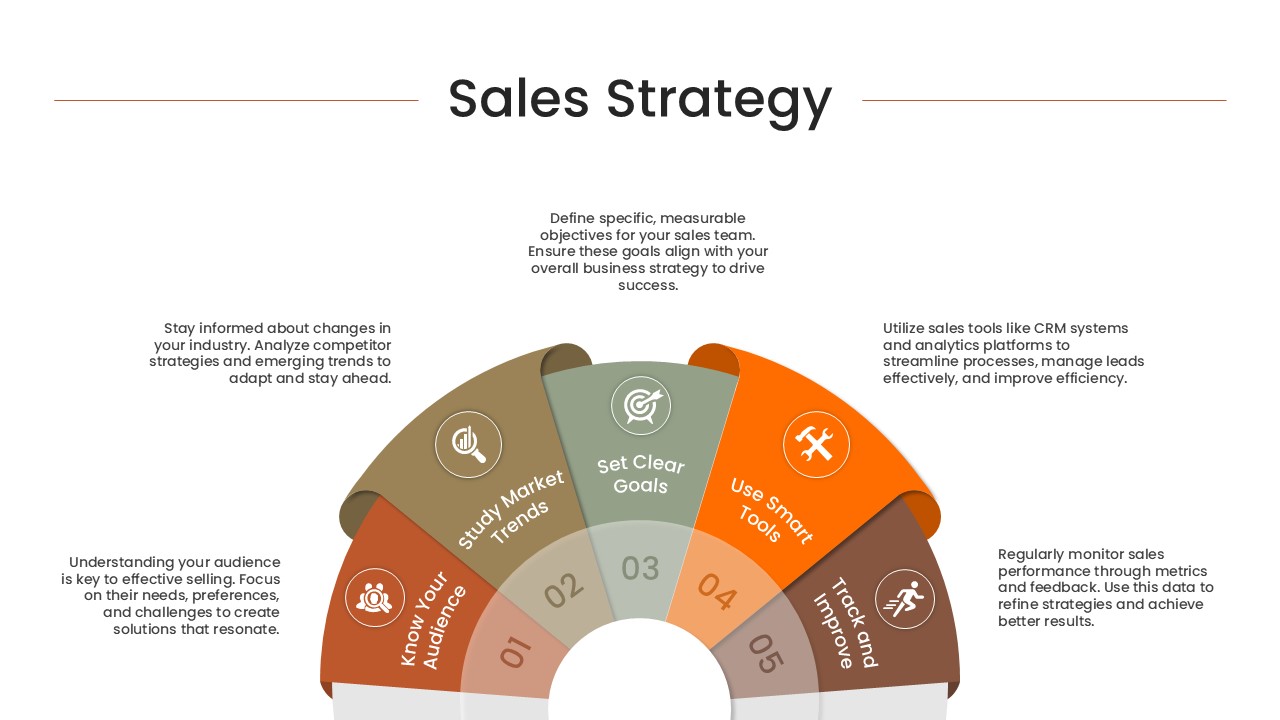
Semi-Circular Sales Strategy Roadmap Template for PowerPoint & Google Slides
Circular
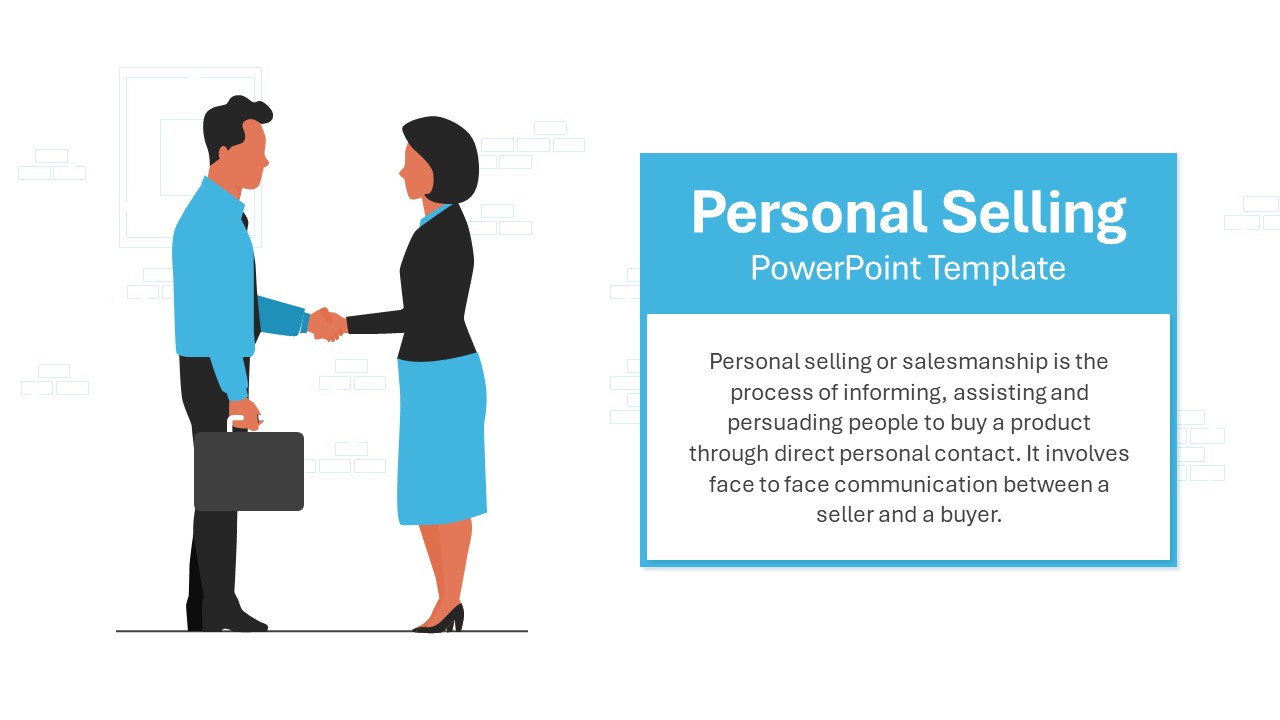
Personal Selling Strategy Illustration Template for PowerPoint & Google Slides
Marketing
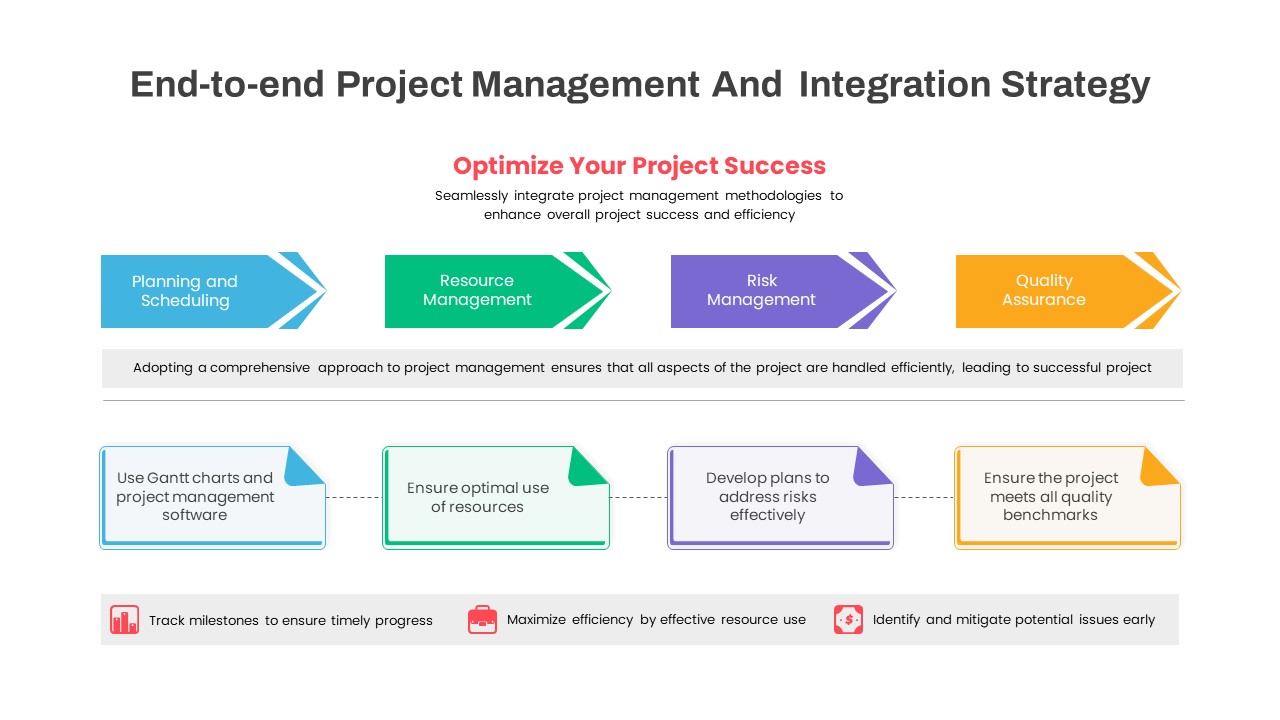
End-to-End Project Management Strategy Template for PowerPoint & Google Slides
Project
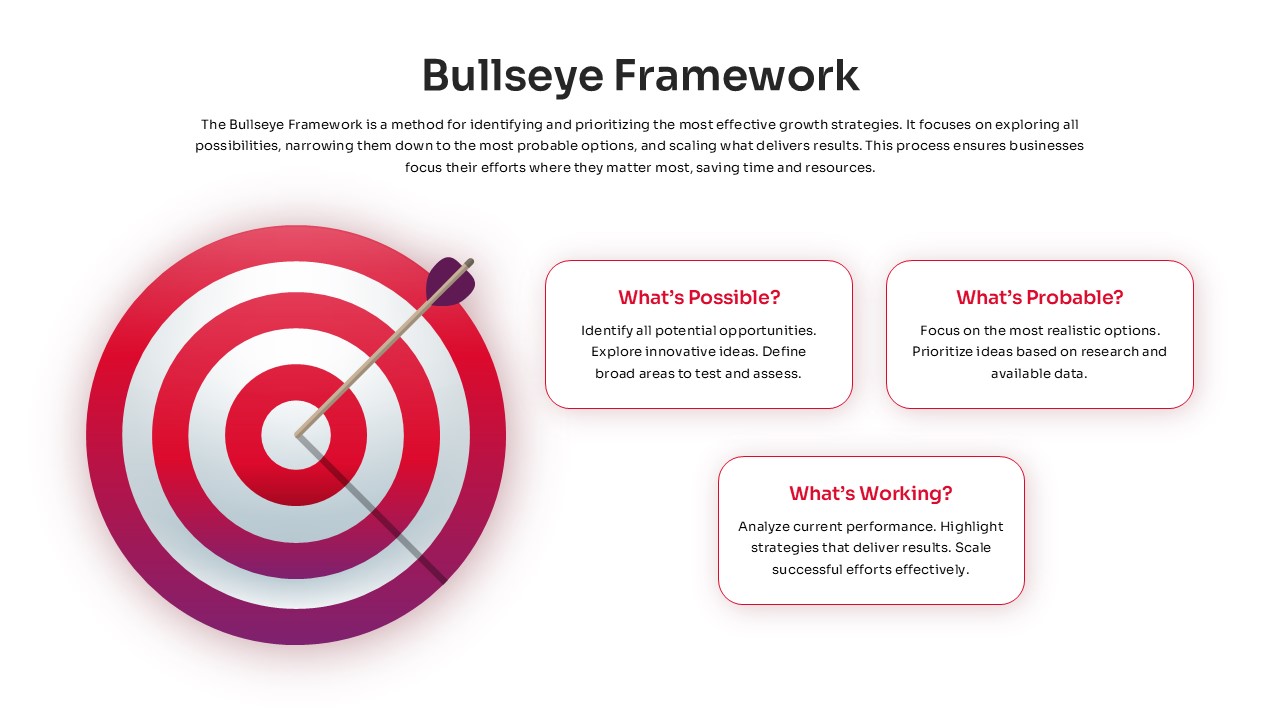
Bullseye Framework Growth Strategy Template for PowerPoint & Google Slides
Business Strategy
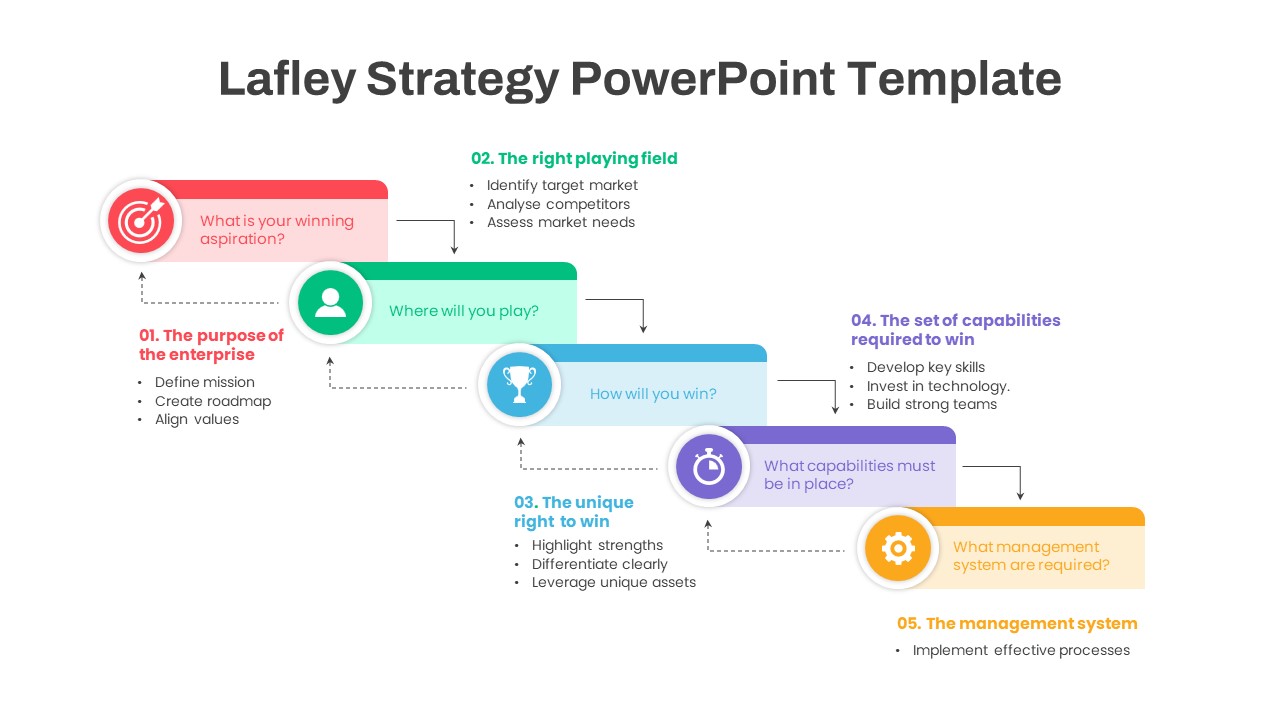
Lafley Strategy Five-Step Framework Template for PowerPoint & Google Slides
Business Strategy
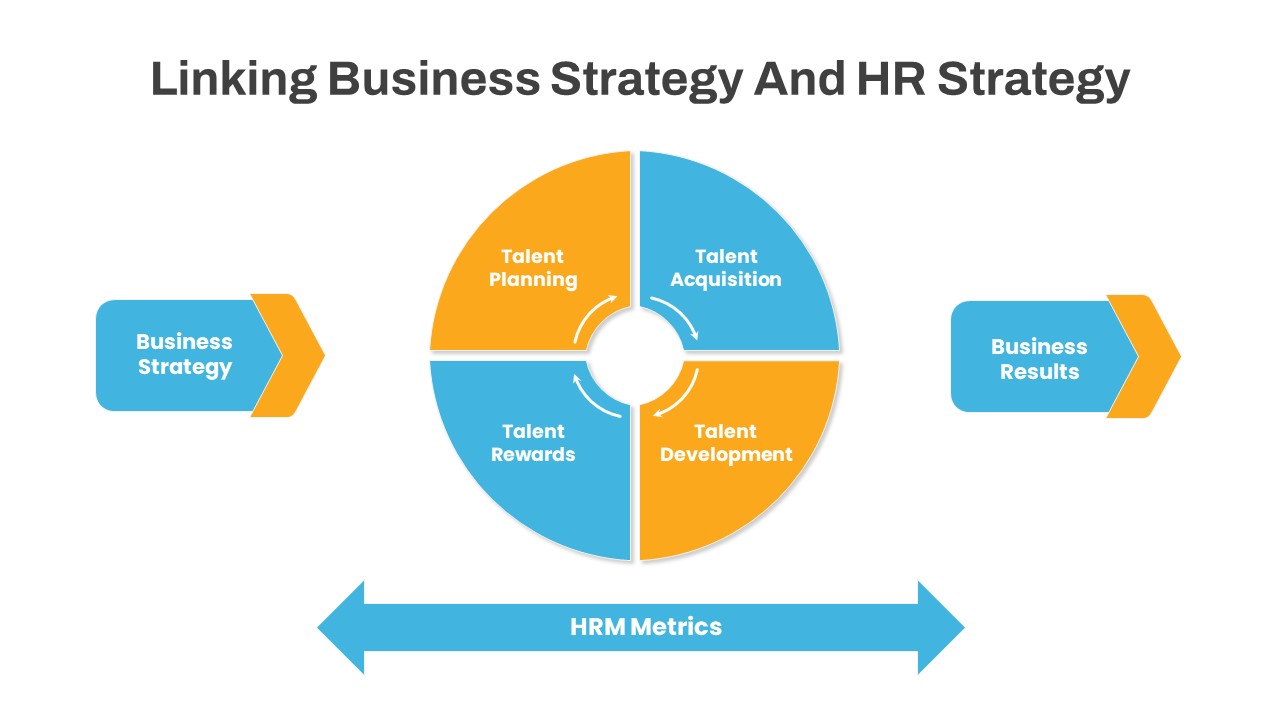
Linking Business HR Strategy Circular Diagram Template for PowerPoint & Google Slides
Business Strategy
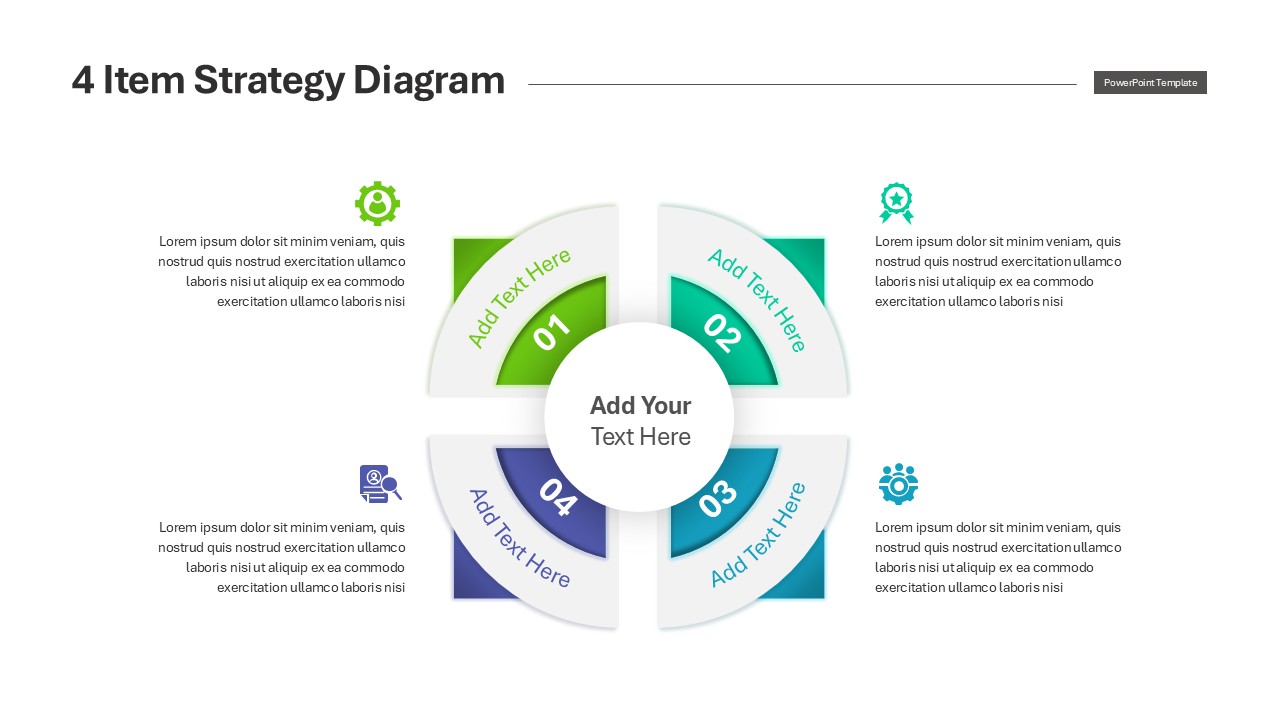
Engaging Four-Option Strategy Diagram Template for PowerPoint & Google Slides
Business Strategy
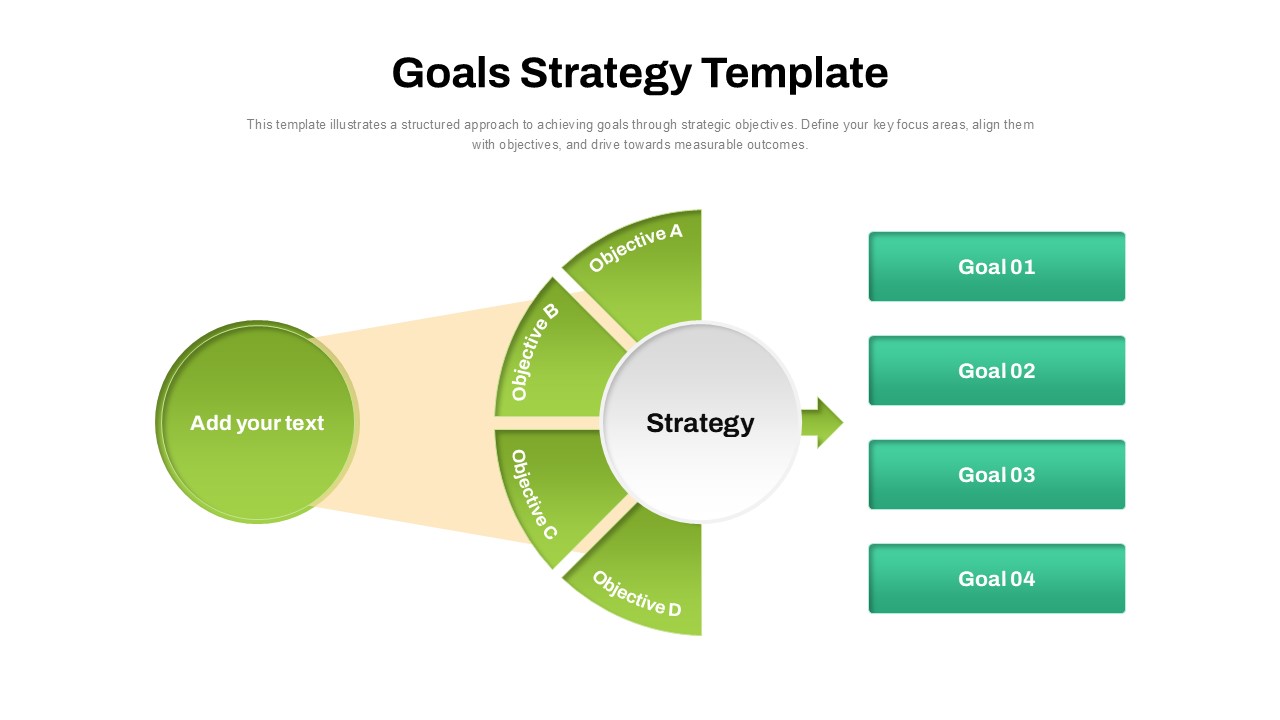
Goals Strategy Semicircle Diagram Template for PowerPoint & Google Slides
Process
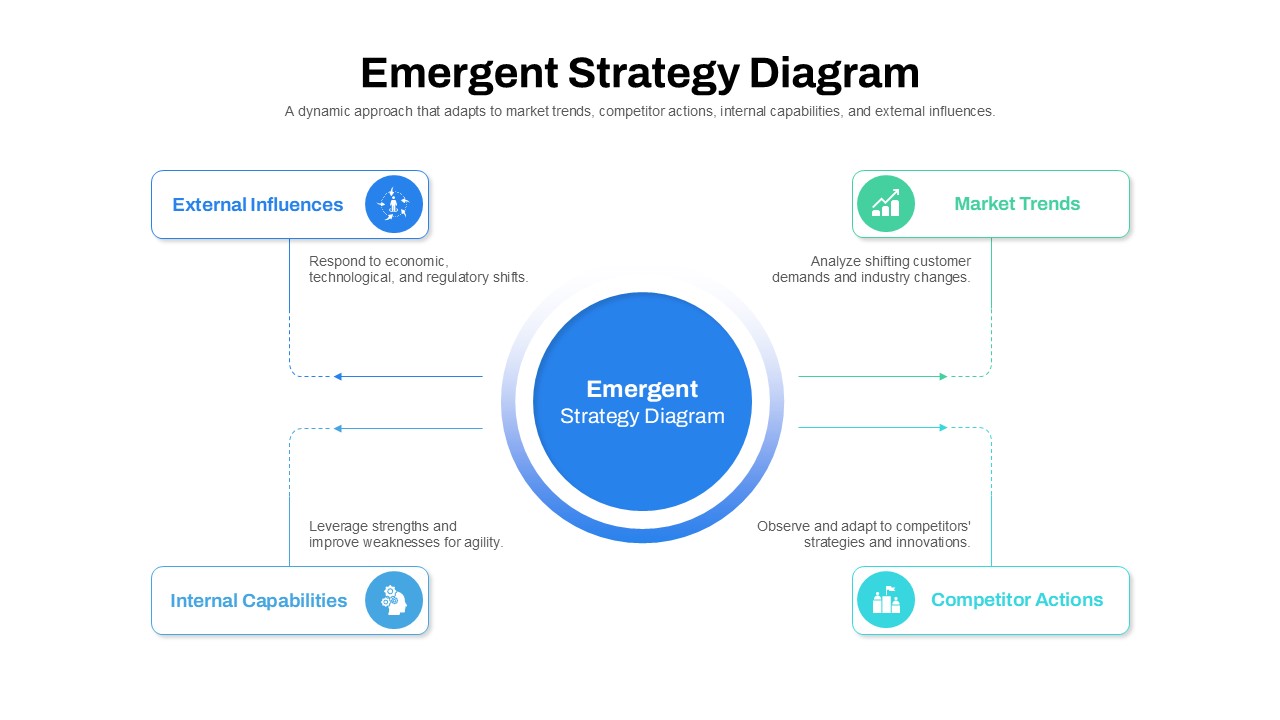
Emergent Strategy Diagram Framework Template for PowerPoint & Google Slides
Process
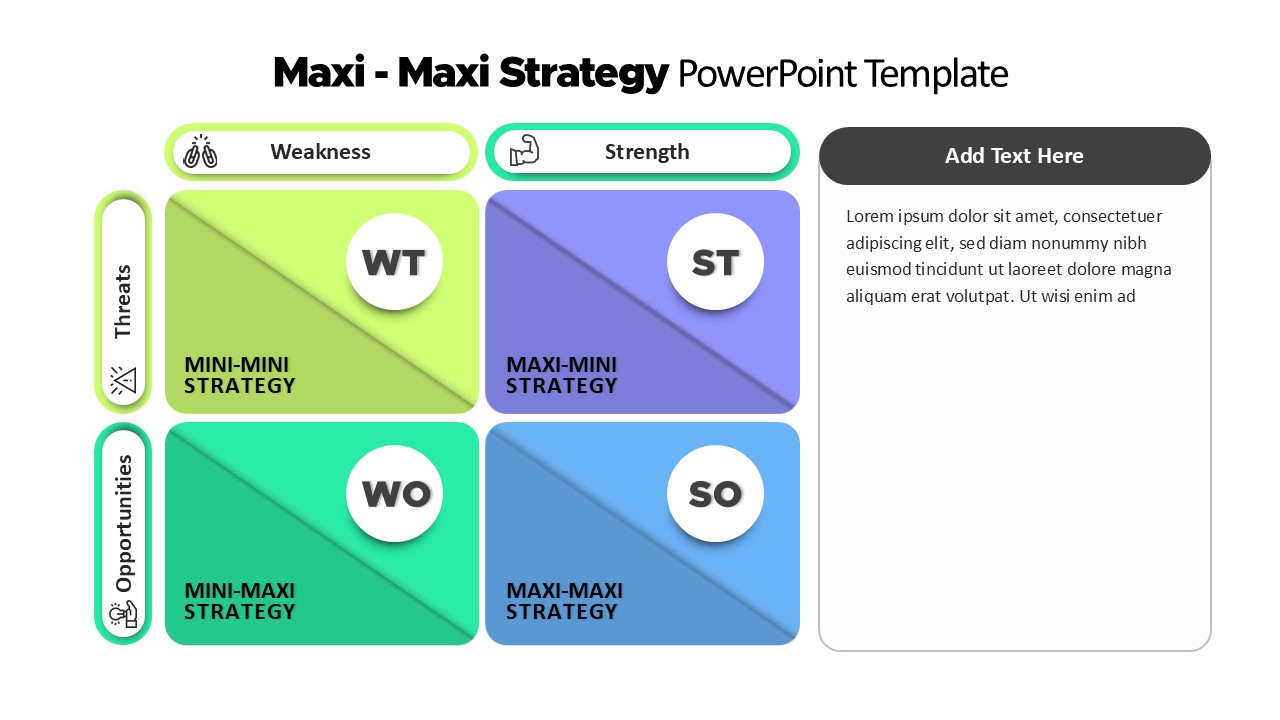
Maxi-Maxi Strategy Matrix SWOT Diagram Template for PowerPoint & Google Slides
SWOT
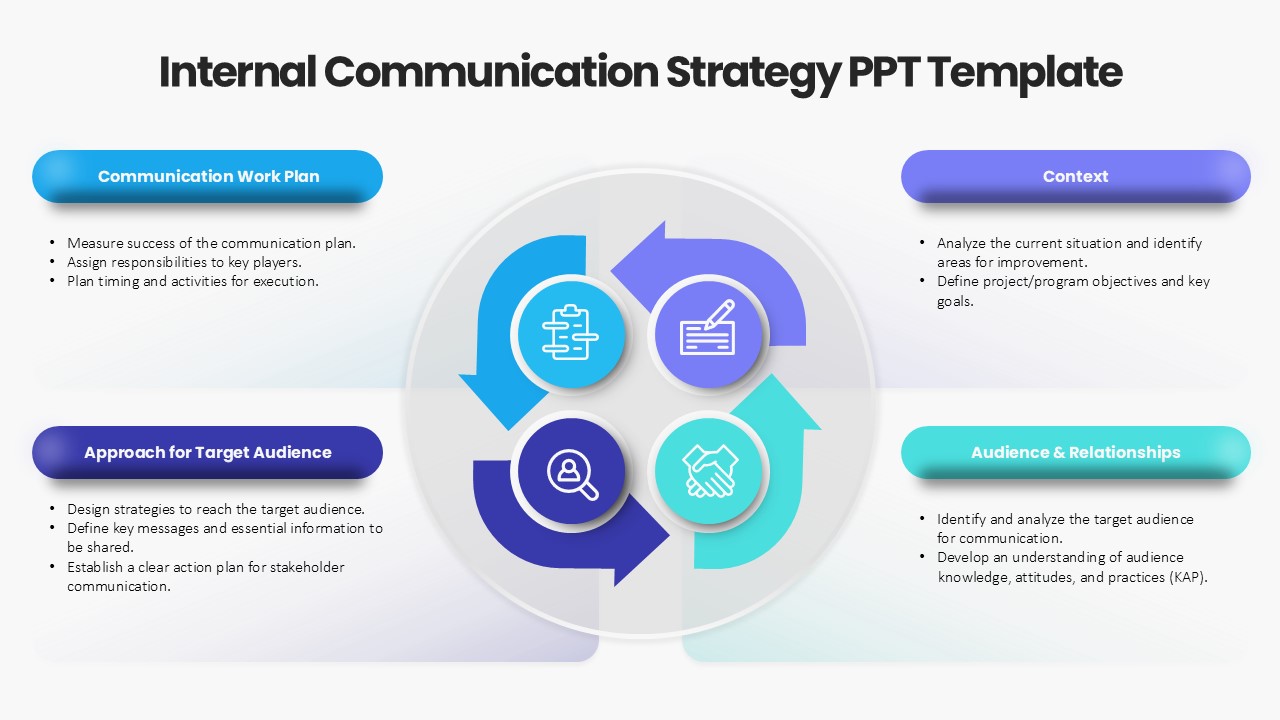
Internal Communication Strategy Diagram Template for PowerPoint & Google Slides
Process
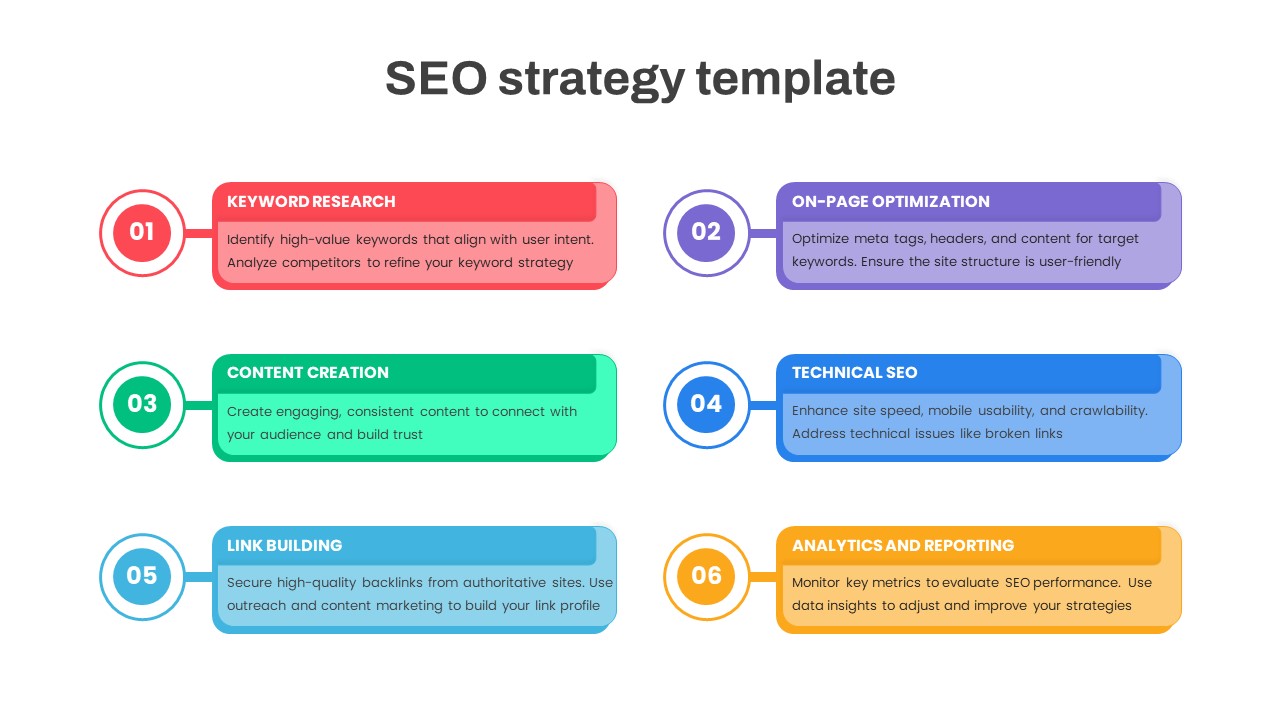
Comprehensive SEO Strategy Roadmap Template for PowerPoint & Google Slides
Digital Marketing
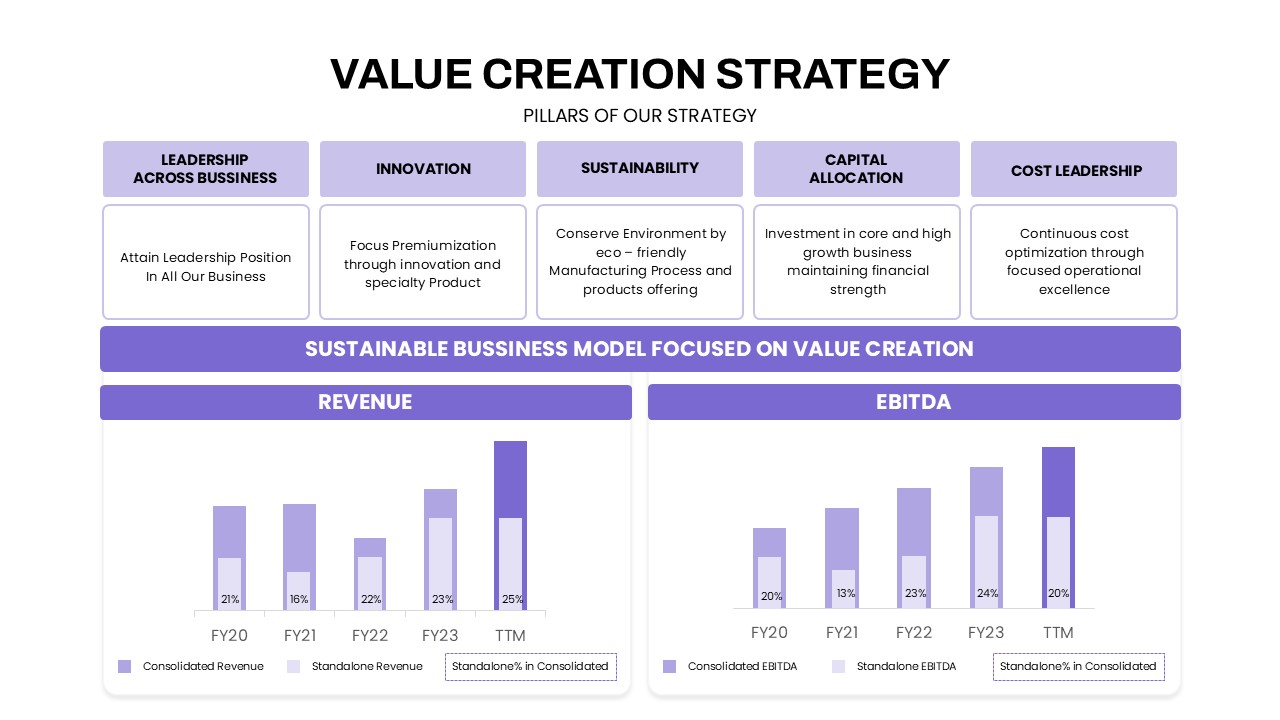
Value Creation Strategy Template for PowerPoint & Google Slides
Business Strategy
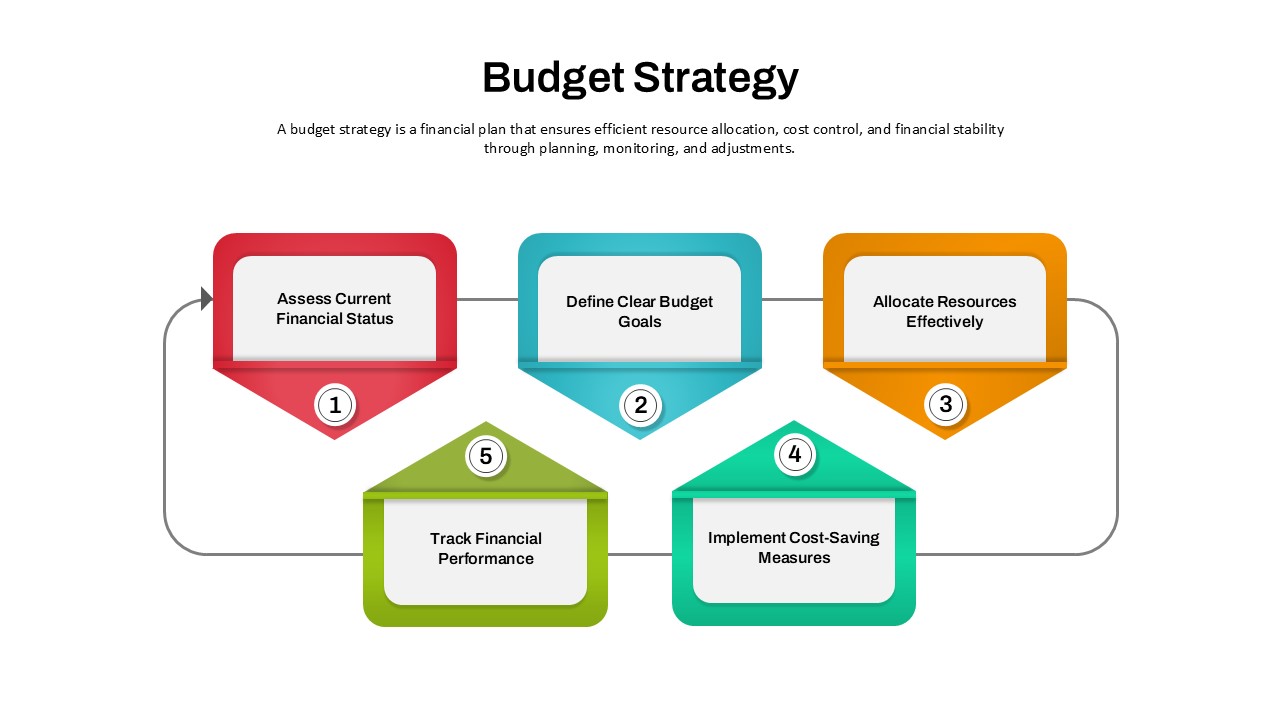
Budget Strategy Five-Step Process Template for PowerPoint & Google Slides
Finance
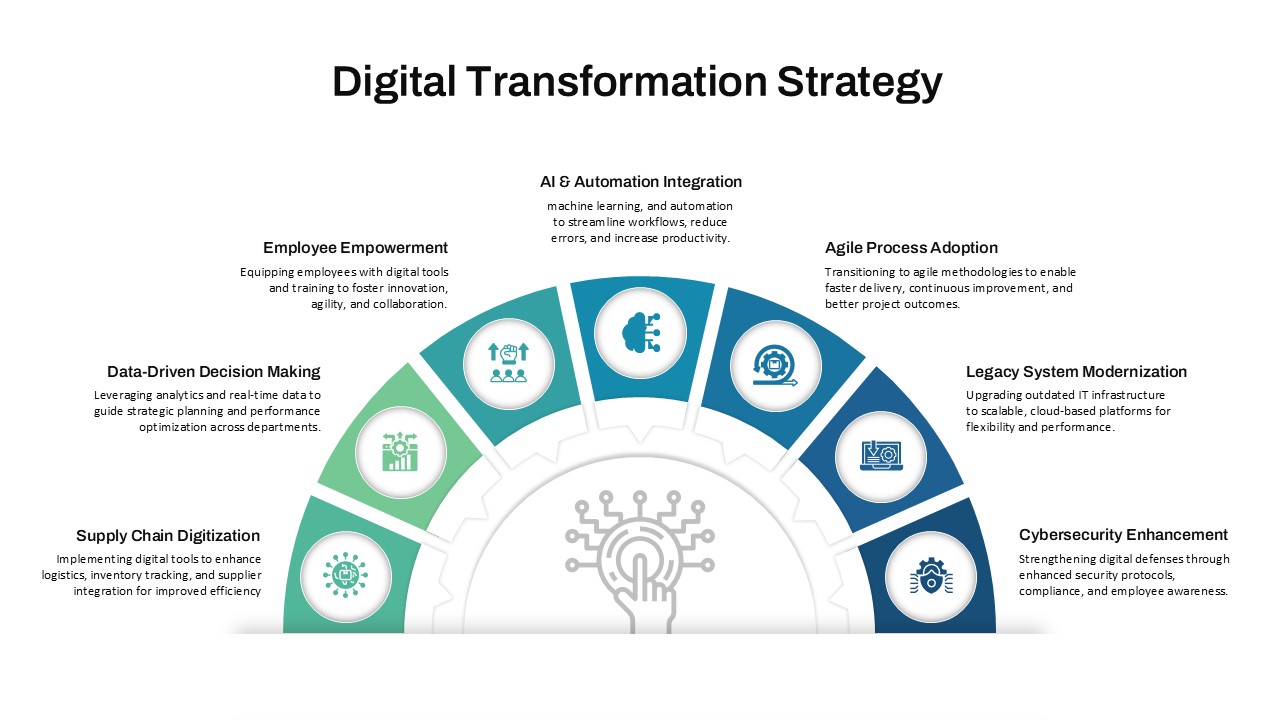
Digital Transformation Strategy Template for PowerPoint & Google Slides
Circular
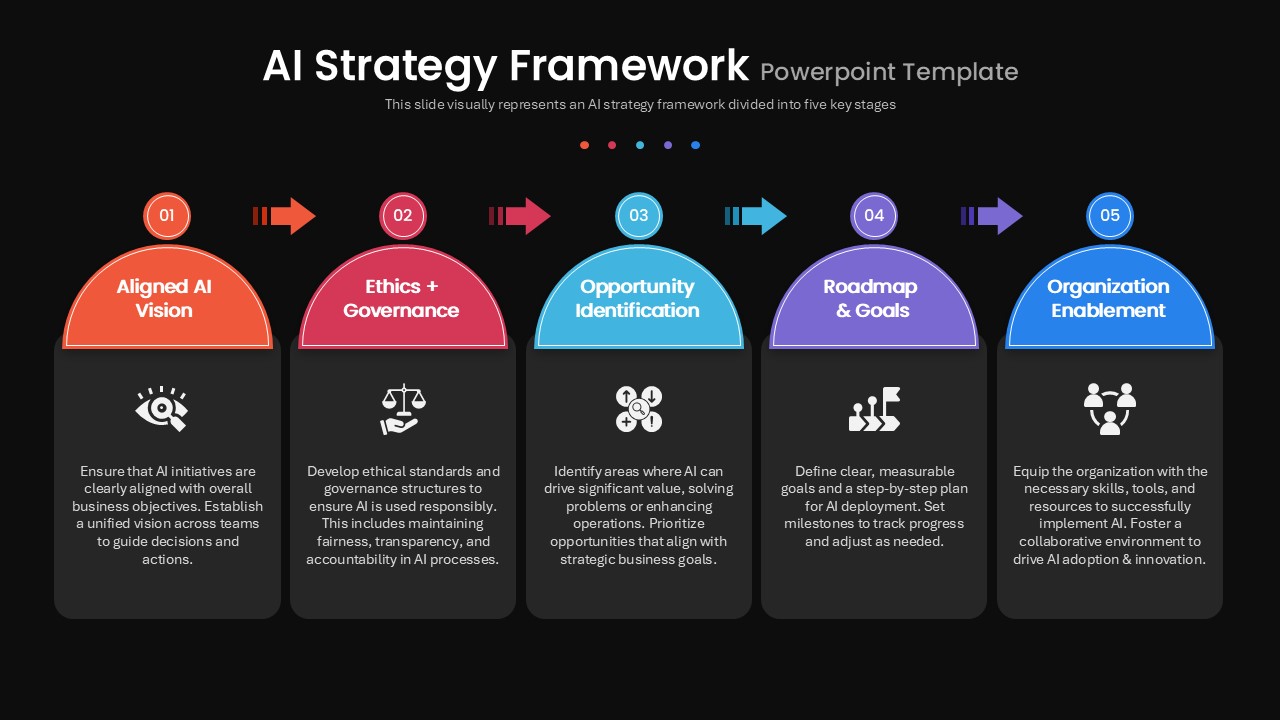
AI Strategy Framework Template for PowerPoint & Google Slides
Business Strategy
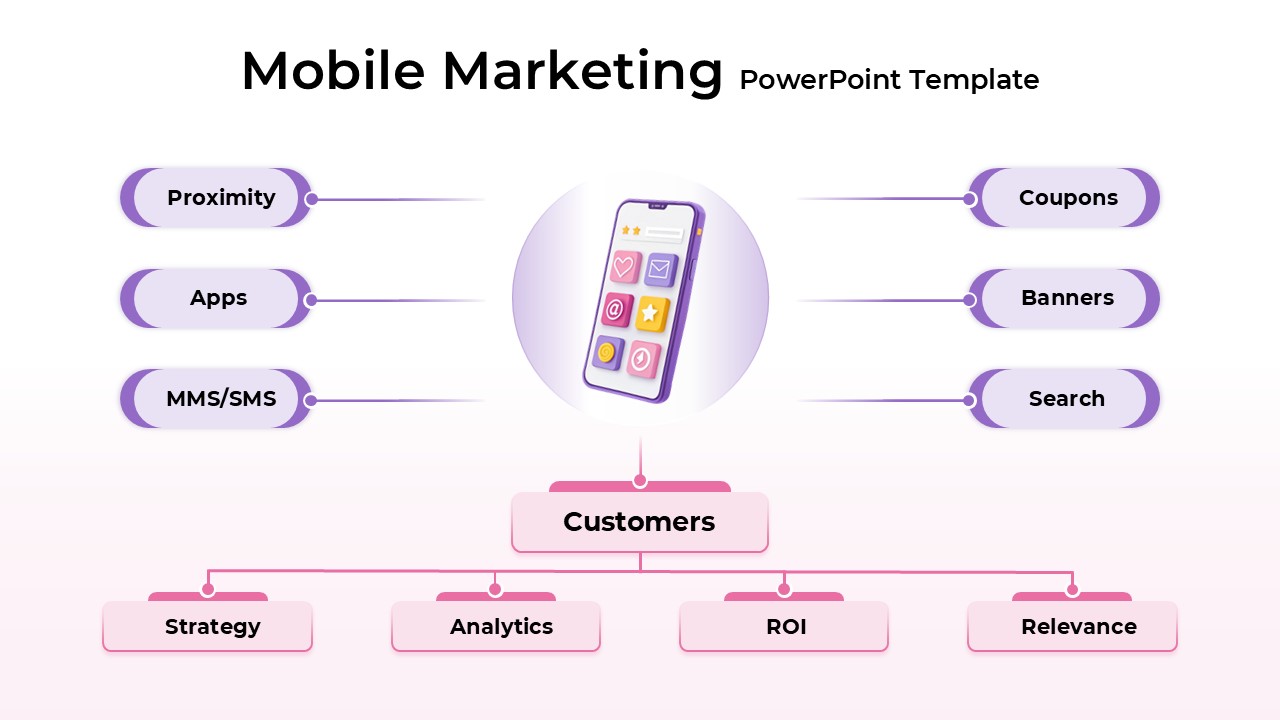
Mobile Marketing Strategy template for PowerPoint & Google Slides
Business
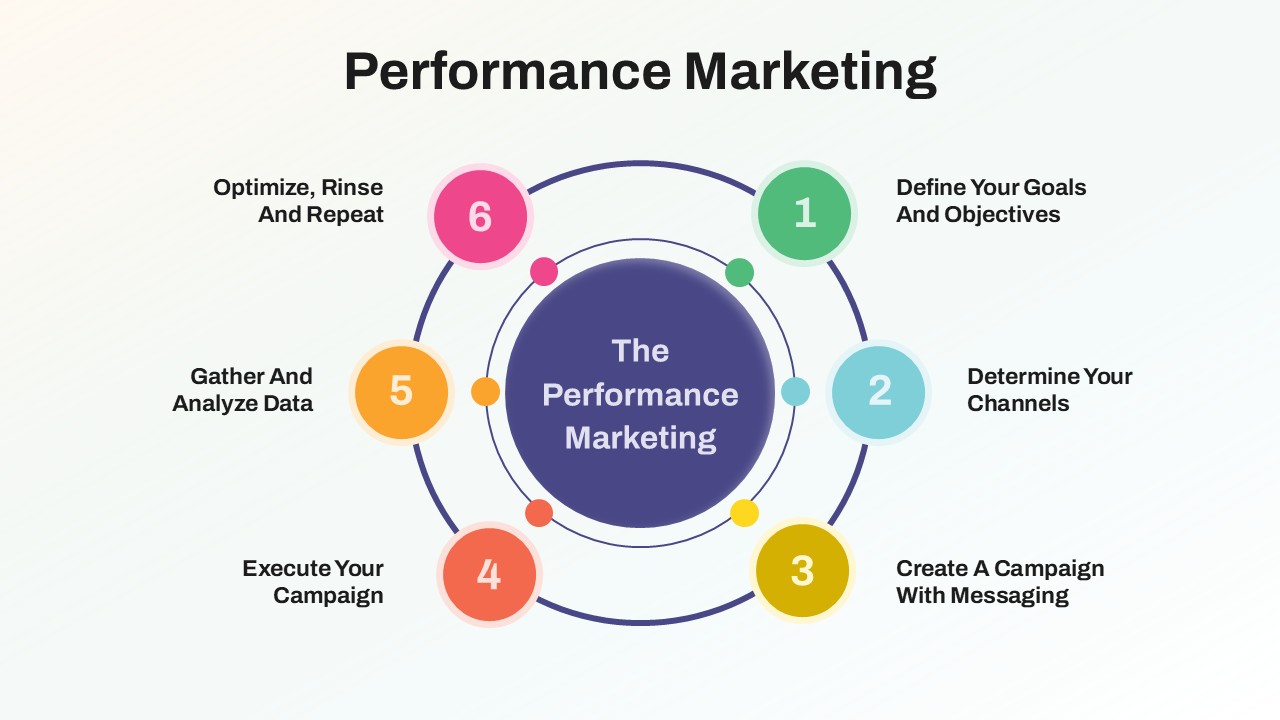
Performance Marketing Strategy template for PowerPoint & Google Slides
Digital Marketing
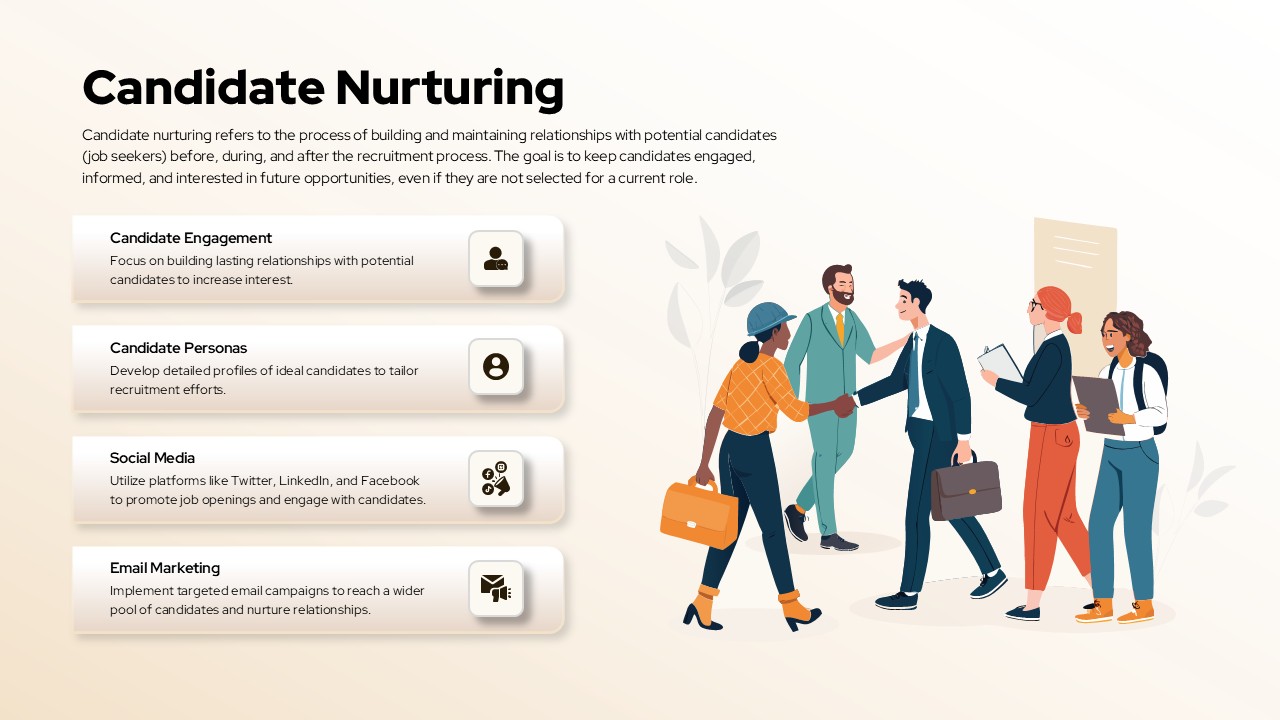
Candidate Nurturing Strategy Overview template for PowerPoint & Google Slides
Recruitment
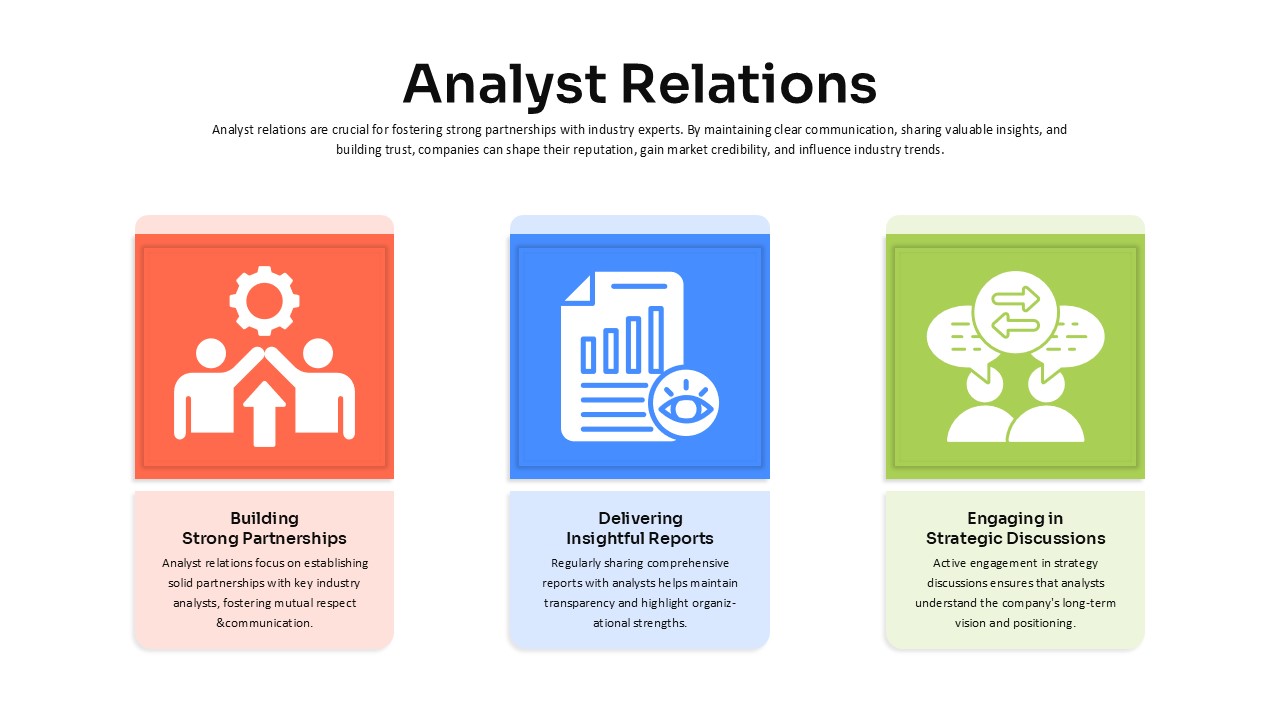
Analyst Relations Strategy template for PowerPoint & Google Slides
Business
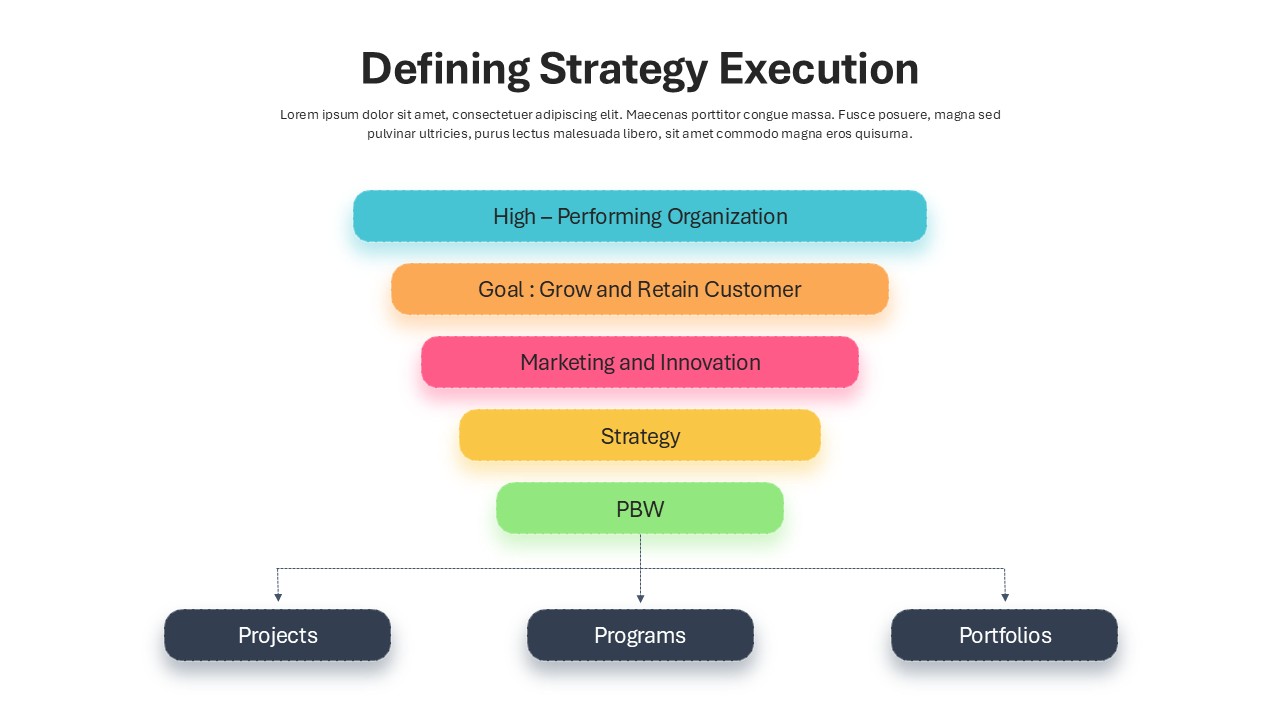
Defining Strategy Execution Diagram Template for PowerPoint & Google Slides
Funnel
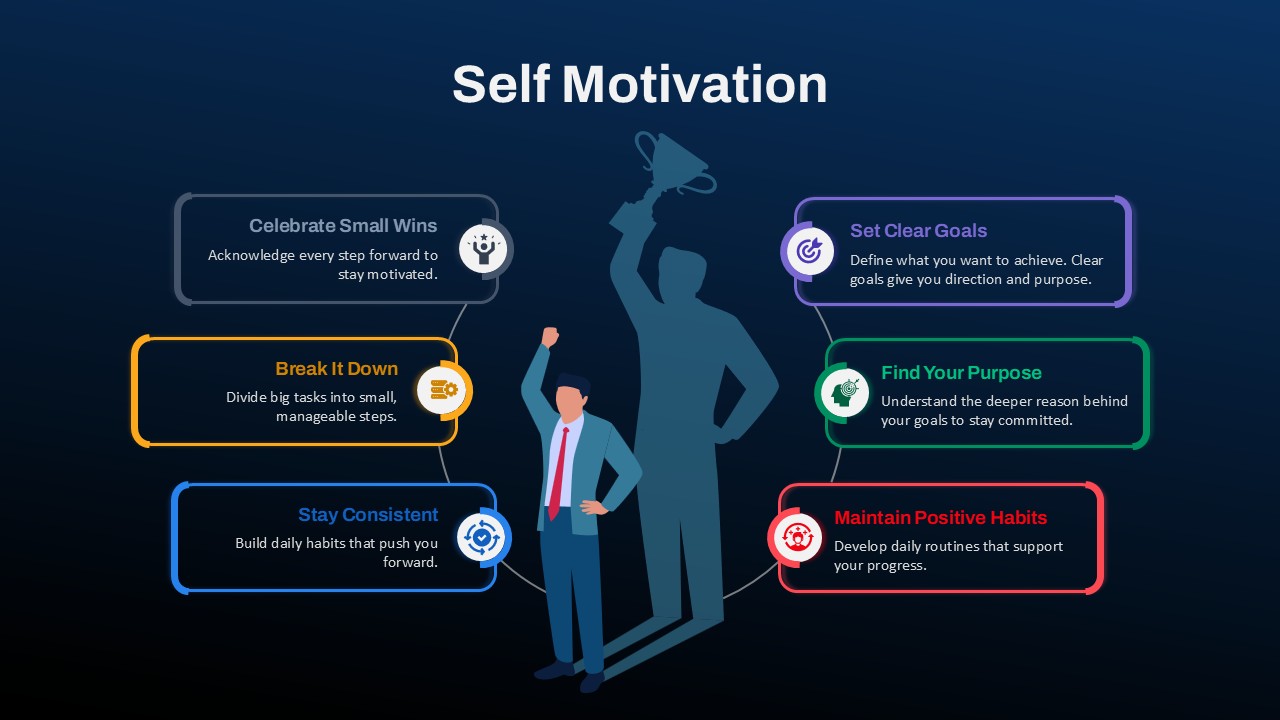
Self Motivation Strategy Infographic Template for PowerPoint & Google Slides
Leadership
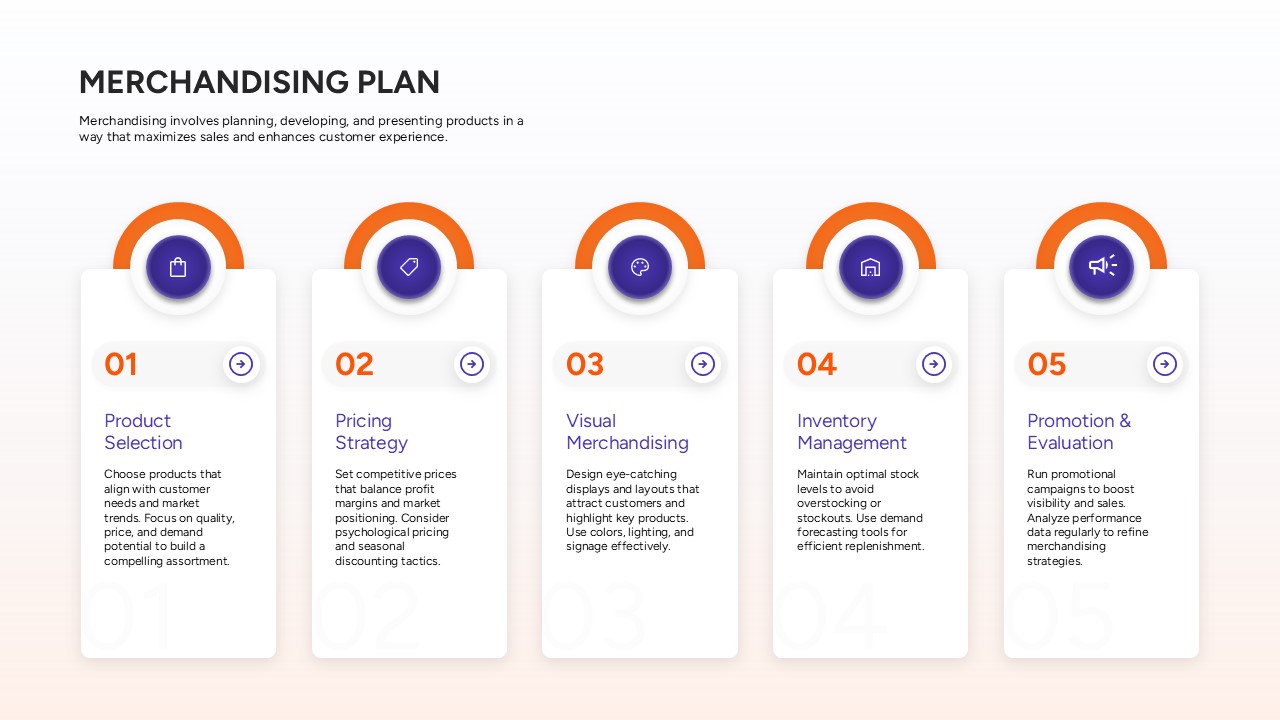
5 Step Merchandising Plan Strategy Template for PowerPoint & Google Slides
Marketing
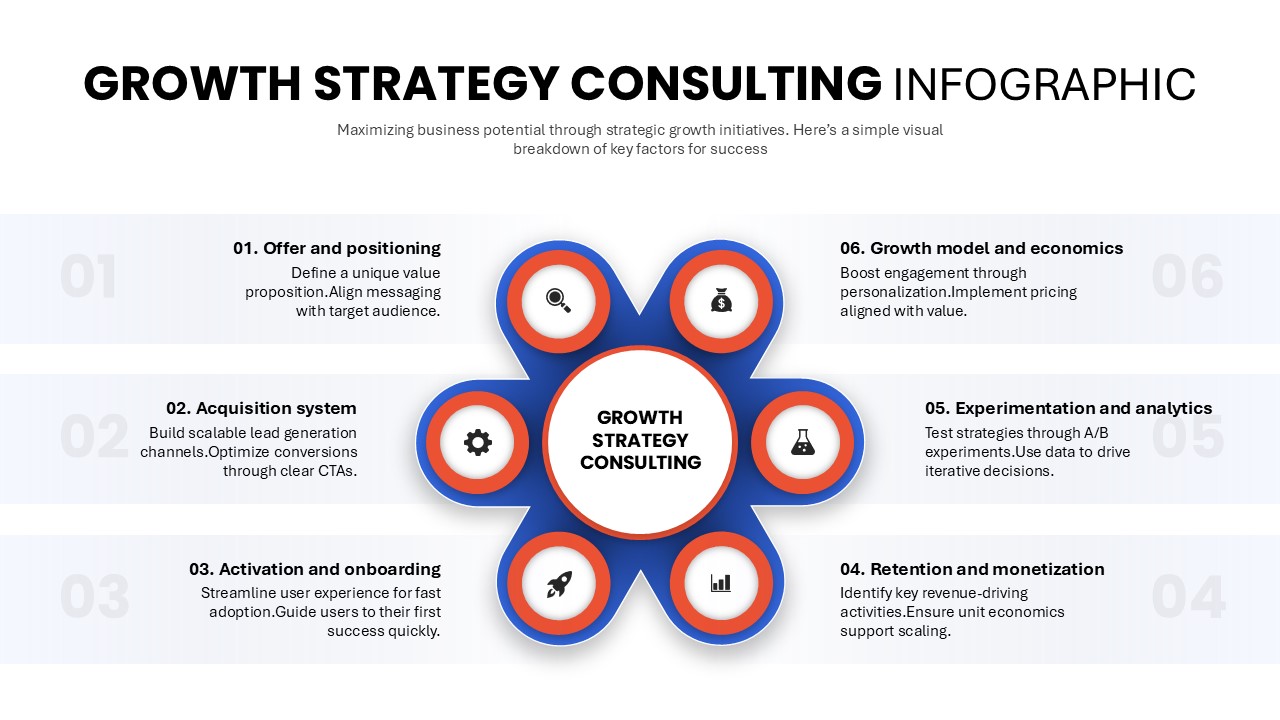
Growth Strategy Consulting Infographic Template for PowerPoint & Google Slides
Process
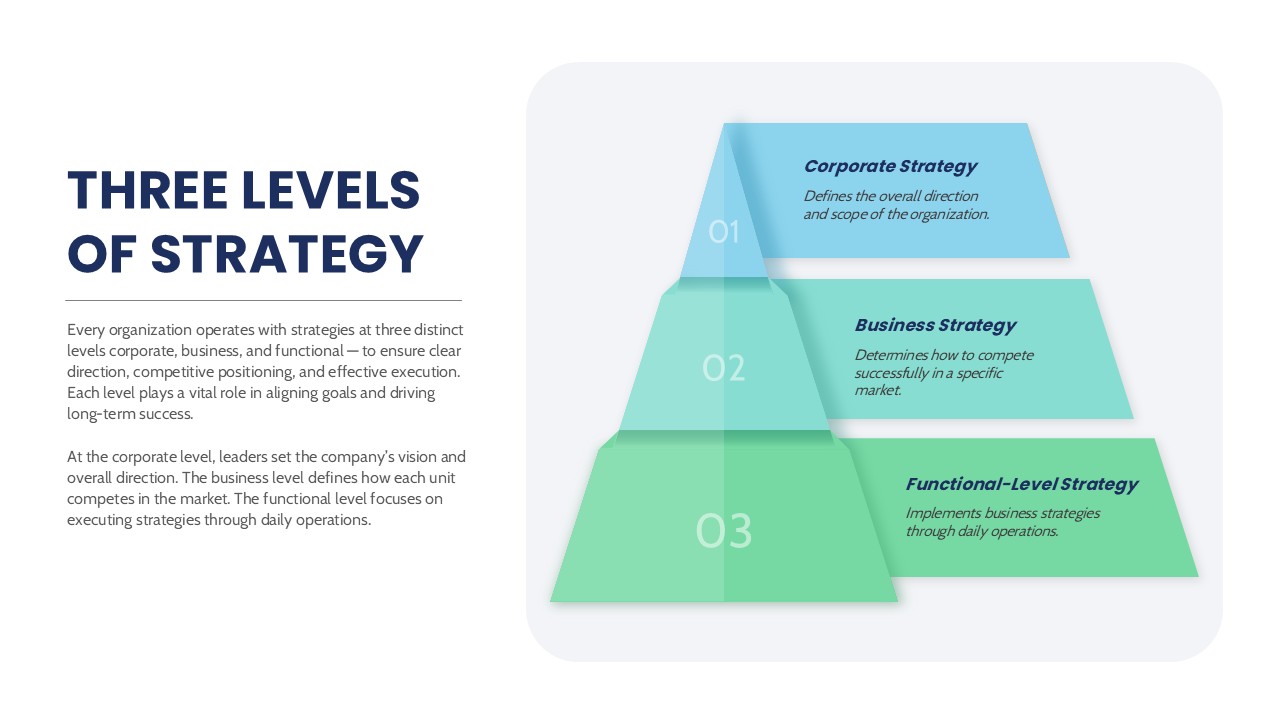
Three Levels of Strategy Template for PowerPoint & Google Slides
Business Strategy