Conveyor Belt Infographic Process Flow Template for PowerPoint & Google Slides

Description
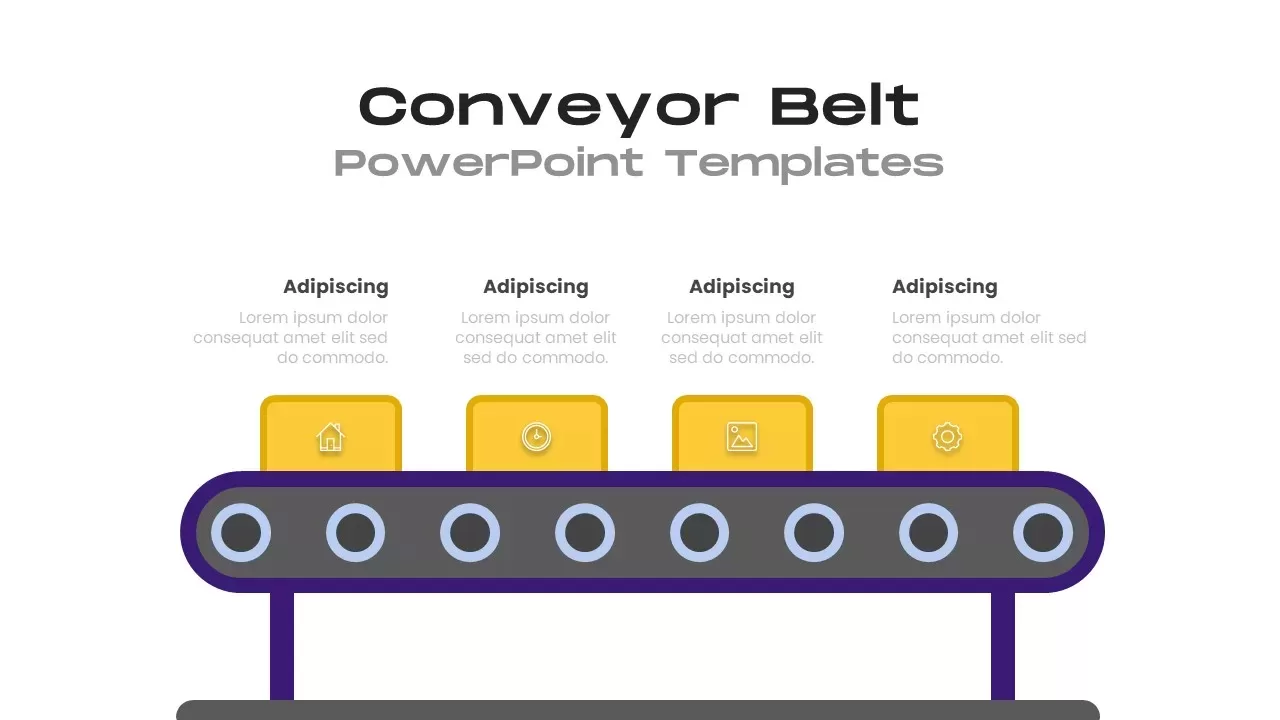
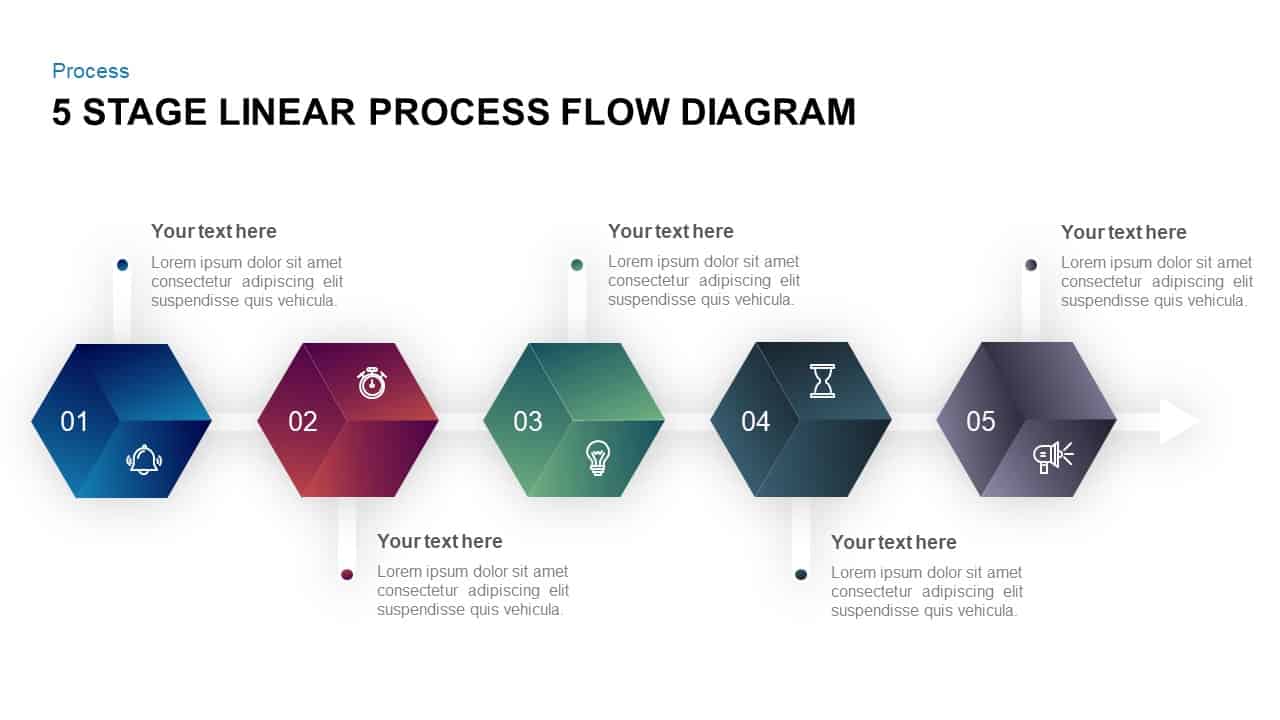
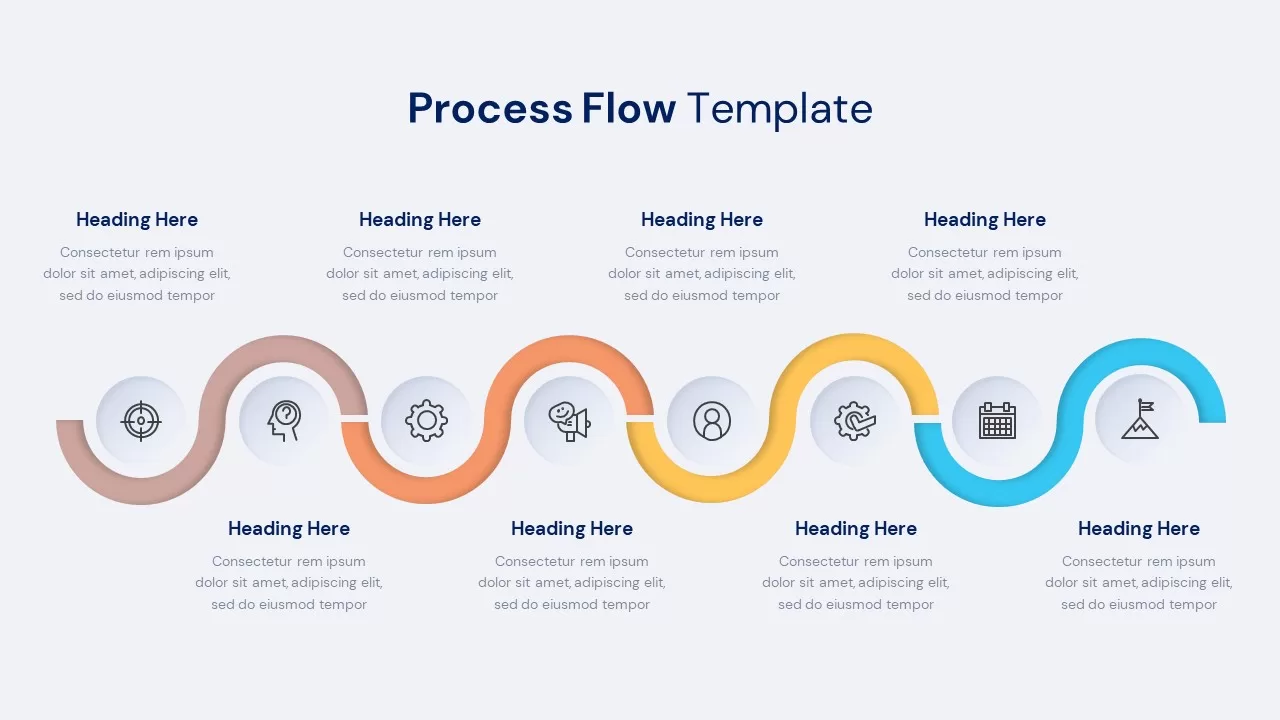
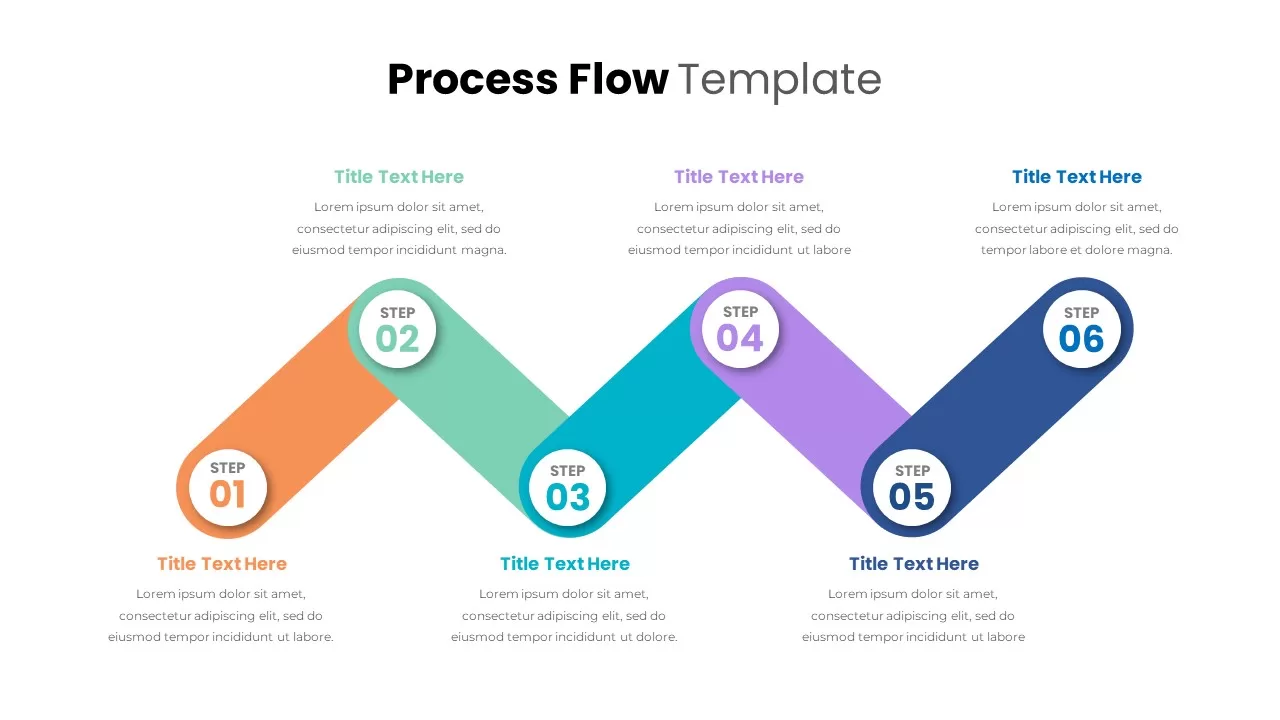
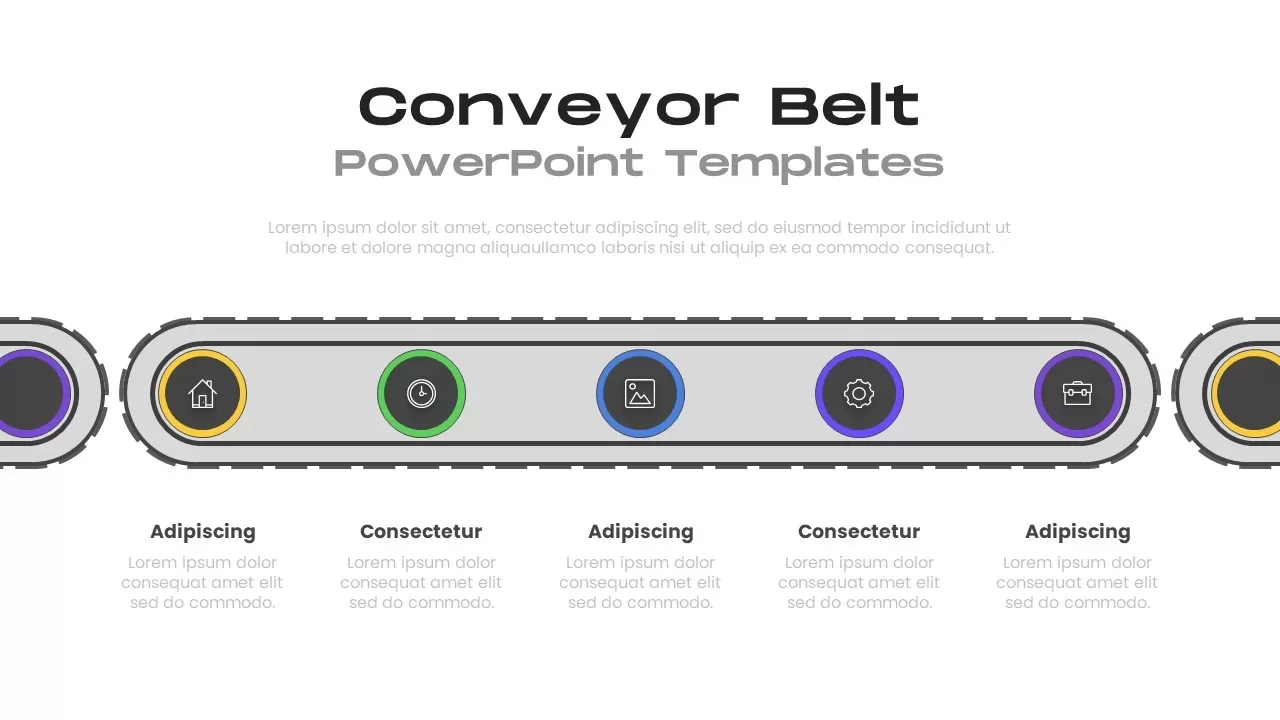
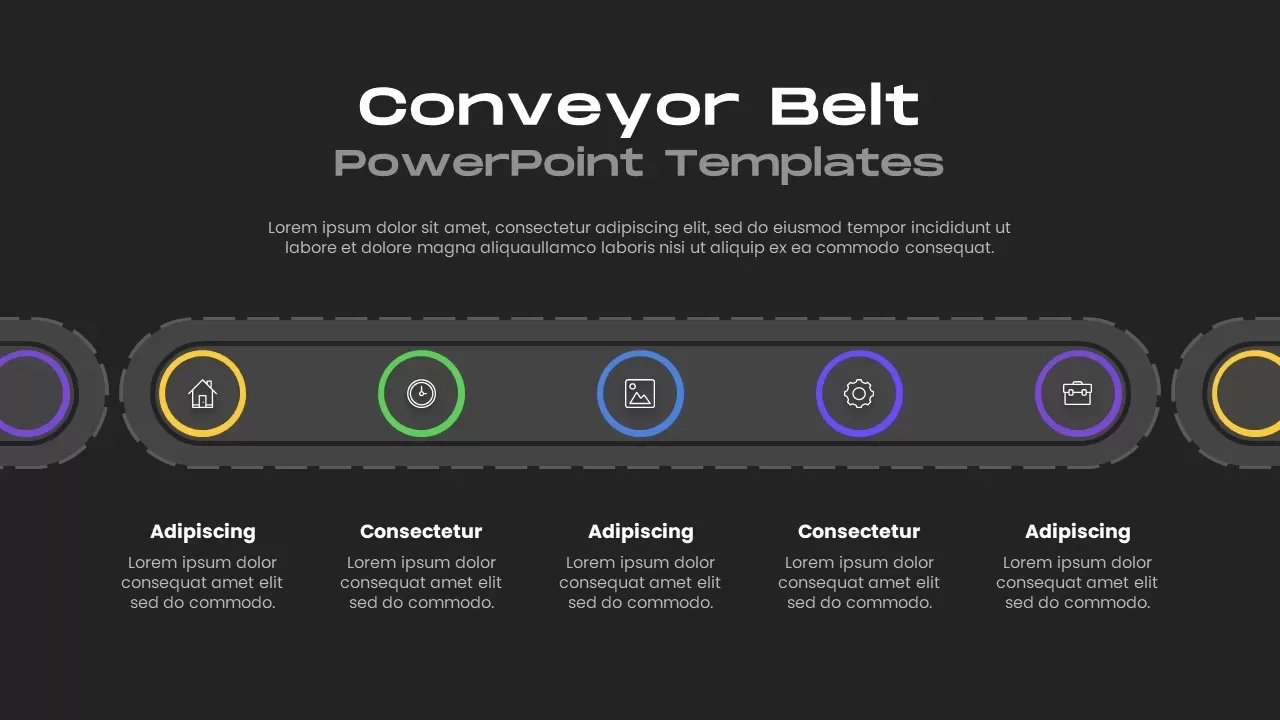
Drive understanding of linear processes with this Conveyor Belt Infographic Process Flow slide for PowerPoint & Google Slides. The fully editable design features a continuous conveyor belt graphic with five evenly spaced icon placeholders, each framed by a colored circle that can be swapped or recolored via master slides. Subtle drop shadows and a neutral grey belt maintain focus on the vibrant icons and emphasize left-to-right progression. Beneath the belt, headline and body text placeholders offer clear space to detail each stage, while alignment guides and vector shapes ensure perfectly balanced layouts in both standard and widescreen formats.
Customization is seamless: simply drag and drop new icons from the integrated library, adjust circle border hues to match your corporate palette, or extend the belt to include additional steps. Compatibility with PowerPoint’s native shape formatting and Google Slides’ theme settings preserves consistent styling when copying layouts between decks. The modular structure also includes hidden placeholders for data callouts and milestone markers—ideal for highlighting KPIs, deadlines, or decision points directly on the belt. Scalable vector graphics guarantee crisp rendering across high-resolution displays, virtual meetings, and printed handouts.
Whether you’re mapping assembly line operations, project pipelines, or step-by-step procedures, this professional-grade infographic slide blends visual appeal with practical clarity. Its streamlined architecture and intuitive flow guide audiences through complex sequences, making it perfect for boardroom presentations, training workshops, and strategic roadmaps.
Who is it for
Project managers, operations directors, business analysts, and training coordinators who need a visually engaging slide to illustrate sequential workflows, process stages, or production line steps.
Other Uses
Repurpose this infographic to showcase onboarding sequences, product launch timelines, supply-chain flows, or decision-making frameworks. Its flexible layout adapts to any scenario requiring clear, step-by-step visuals.
Login to download this file

Item ID
SB03029
Related Templates

Conveyor Belt Sequential Process Flow Template for PowerPoint & Google Slides
Process
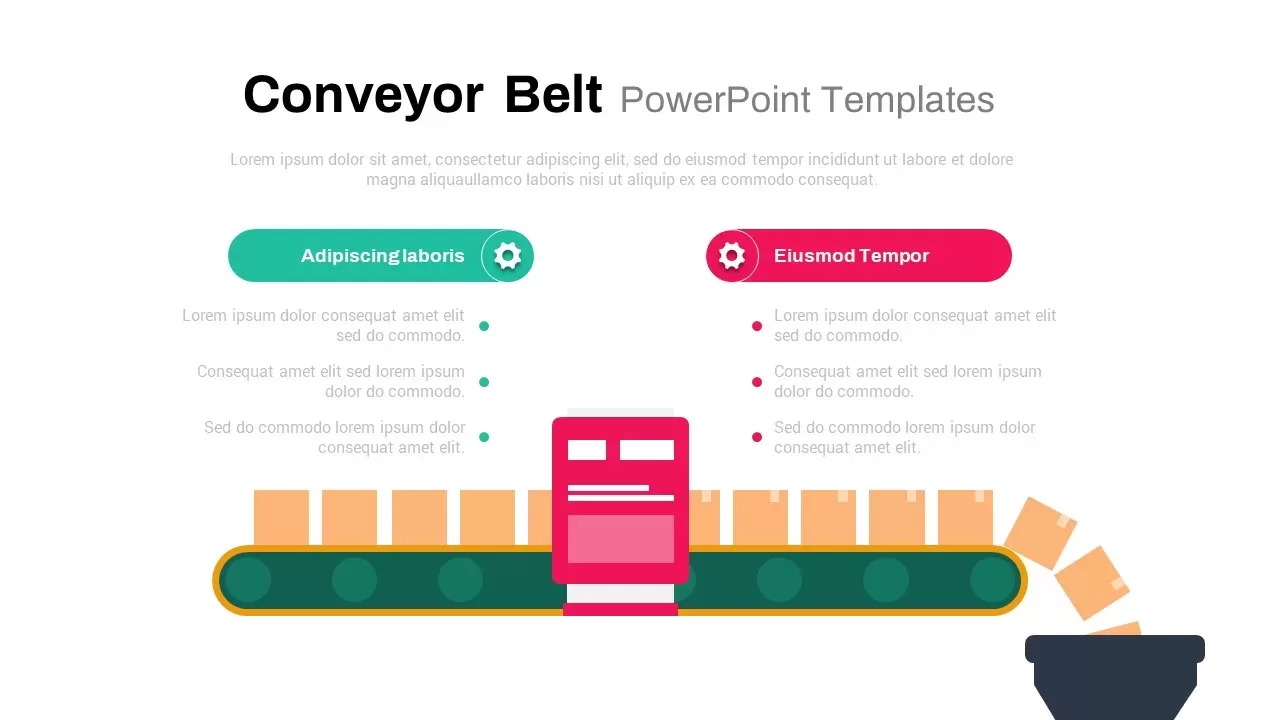
Dynamic Conveyor Belt Process Flow Template for PowerPoint & Google Slides
Process
3D Conveyor Belt Process Flow Diagram Template for PowerPoint & Google Slides
Process
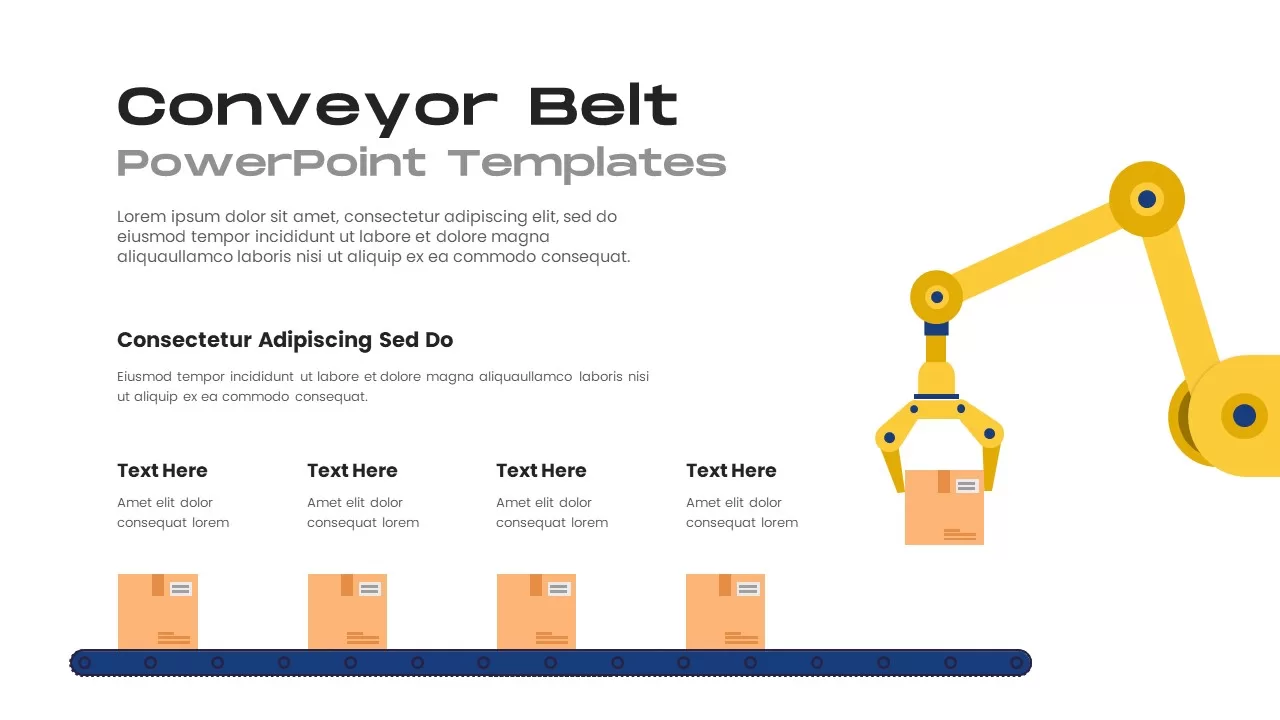
Robotic Conveyor Belt Process Diagram Template for PowerPoint & Google Slides
Process
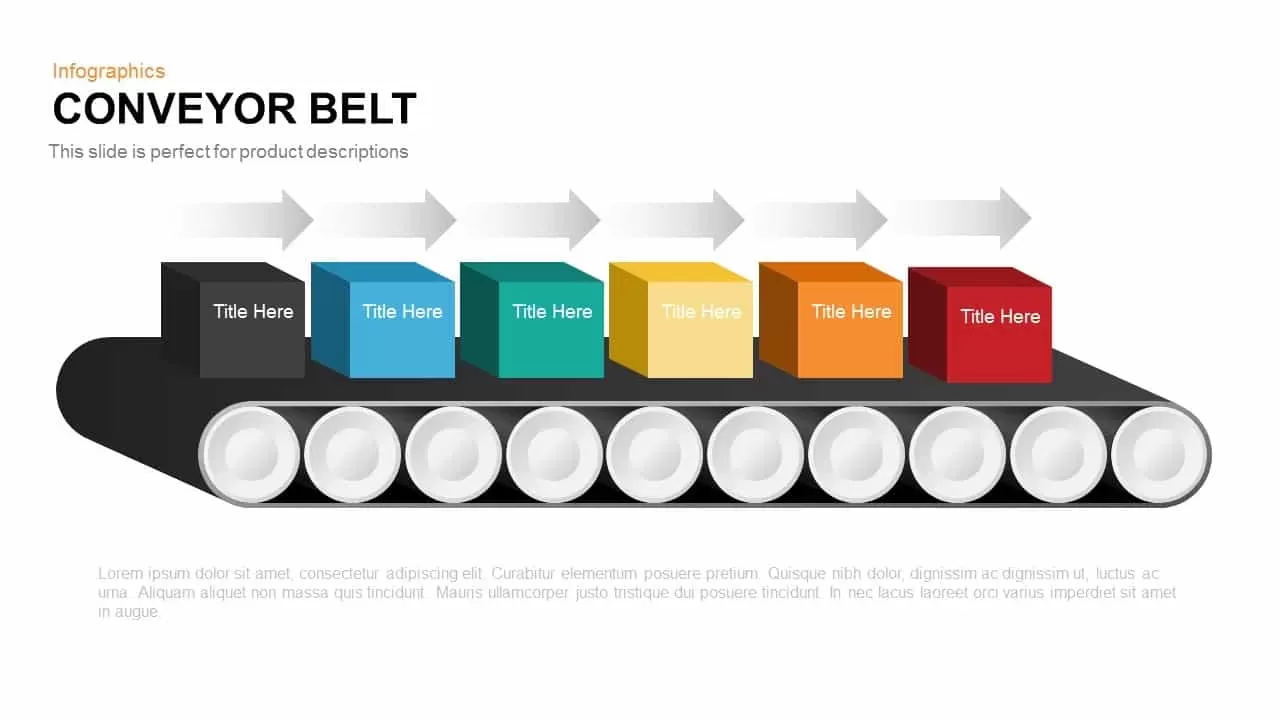
Conveyor Belt template for PowerPoint & Google Slides
Infographics

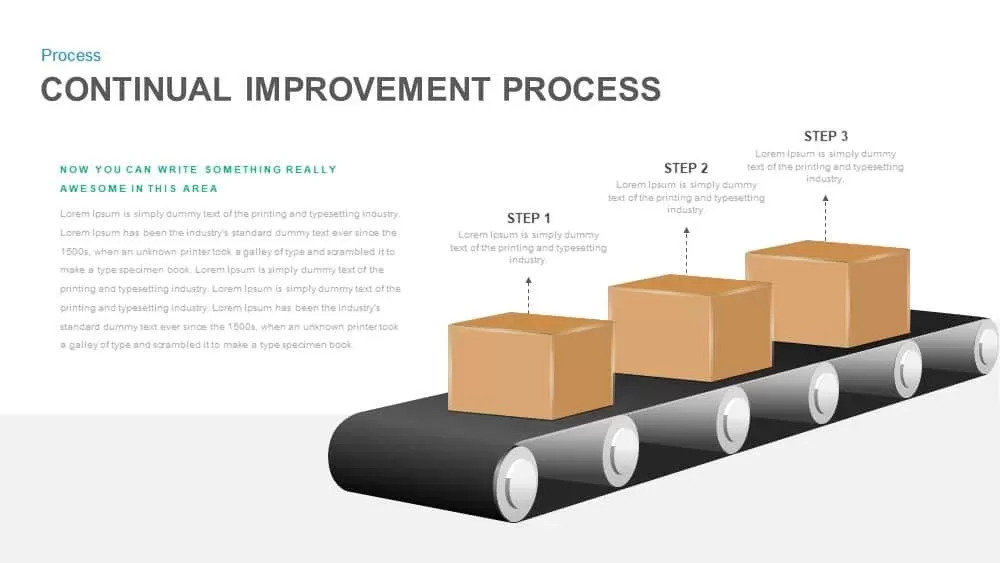
Continual Improvement Process Conveyor Template for PowerPoint & Google Slides
Process
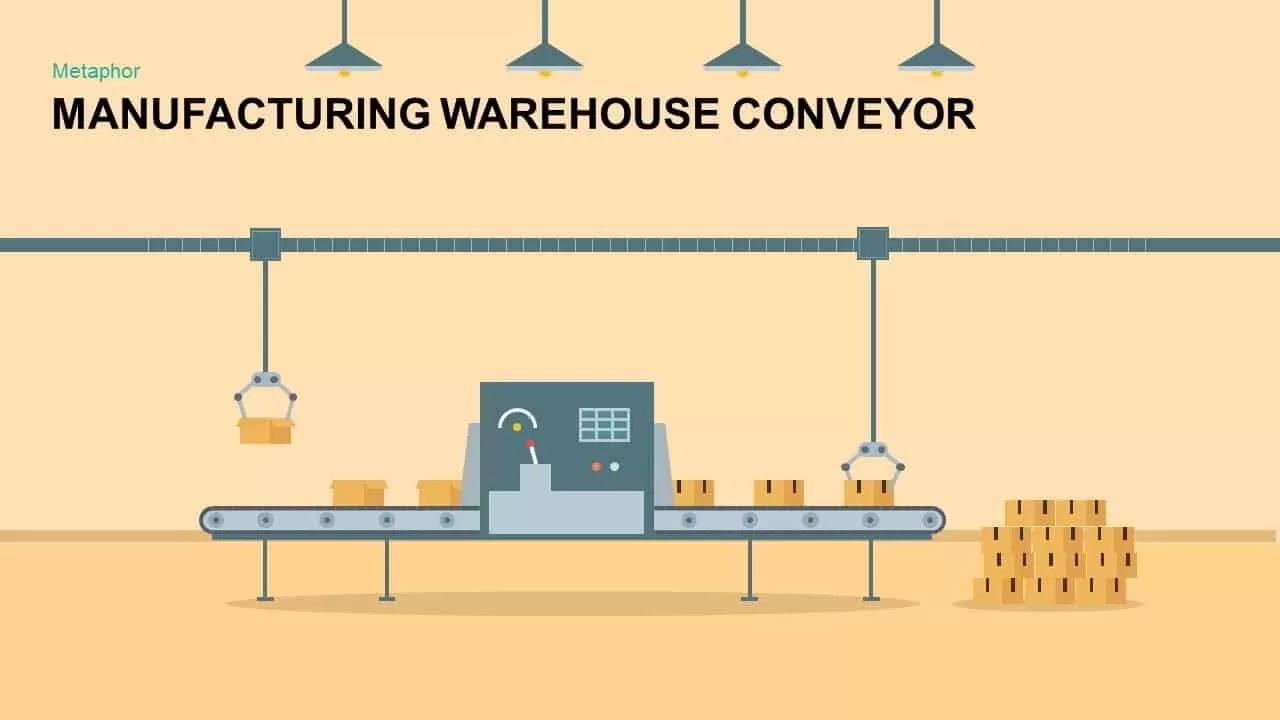
Warehouse Conveyor Process Metaphor Template for PowerPoint & Google Slides
Process

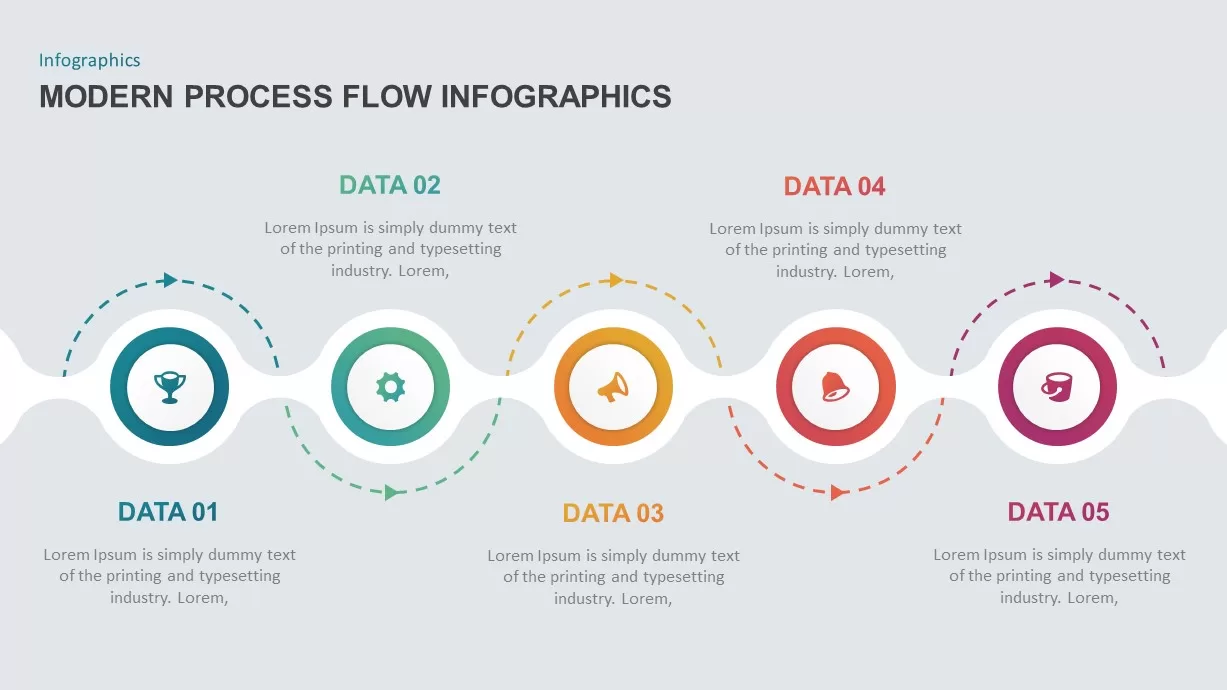
Modern 5-Step Process Flow Infographic Template for PowerPoint & Google Slides
Process
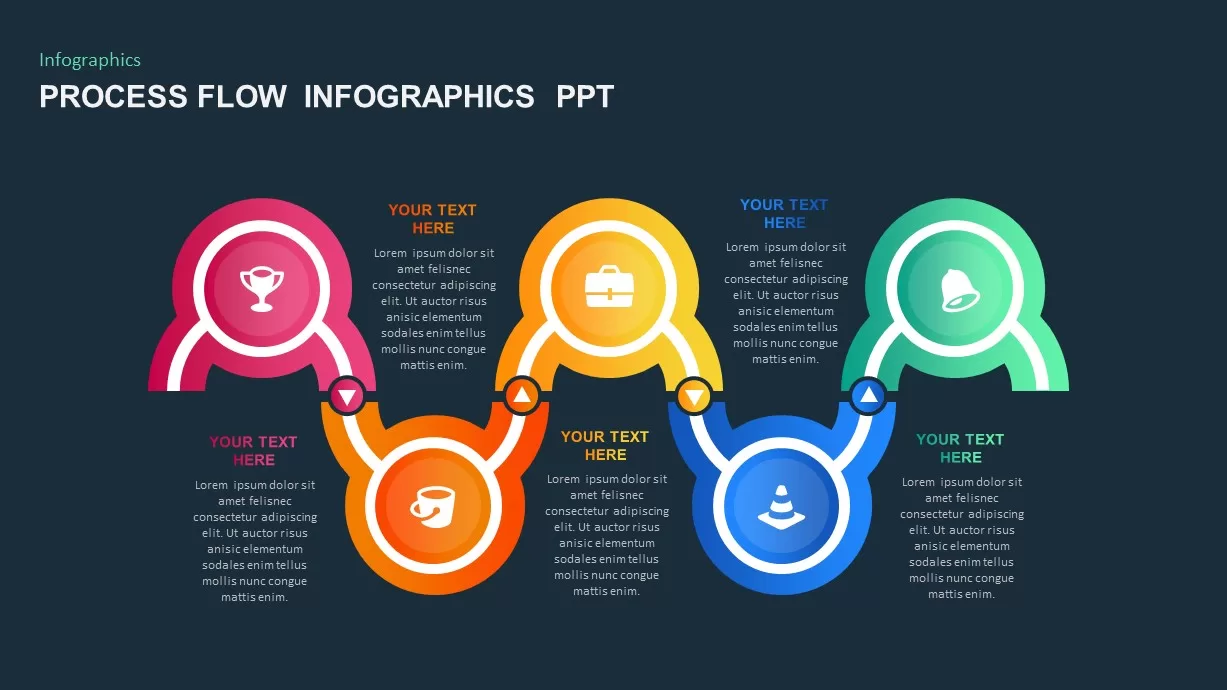
Five-Step Process Flow Infographic Template for PowerPoint & Google Slides
Process
Minimal Process Flow Diagram Infographic Template for PowerPoint & Google Slides
Process
Curved Arrow Process Flow Infographic Template for PowerPoint & Google Slides
Process
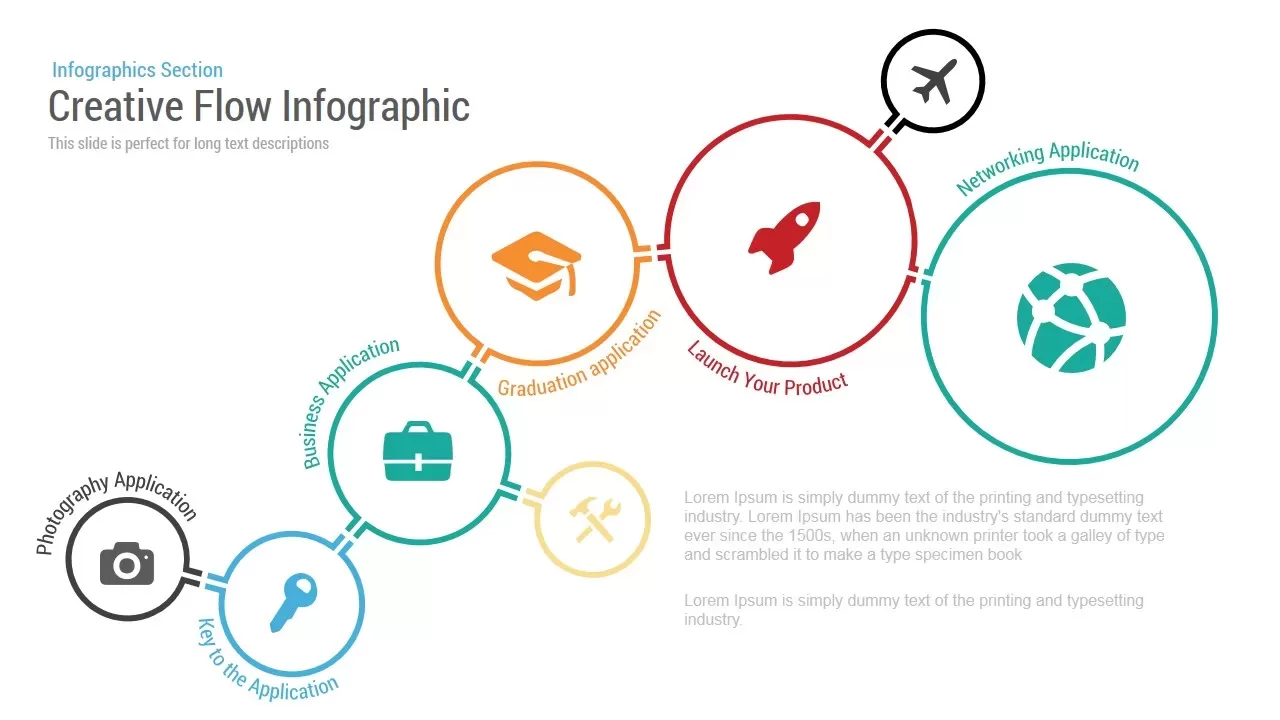
Creative Flow Infographic template for PowerPoint & Google Slides
Process
Multi-Style Flow Infographic Slide template for PowerPoint & Google Slides
Process
Business Intelligence Infographic & Flow Template for PowerPoint & Google Slides
Business Report
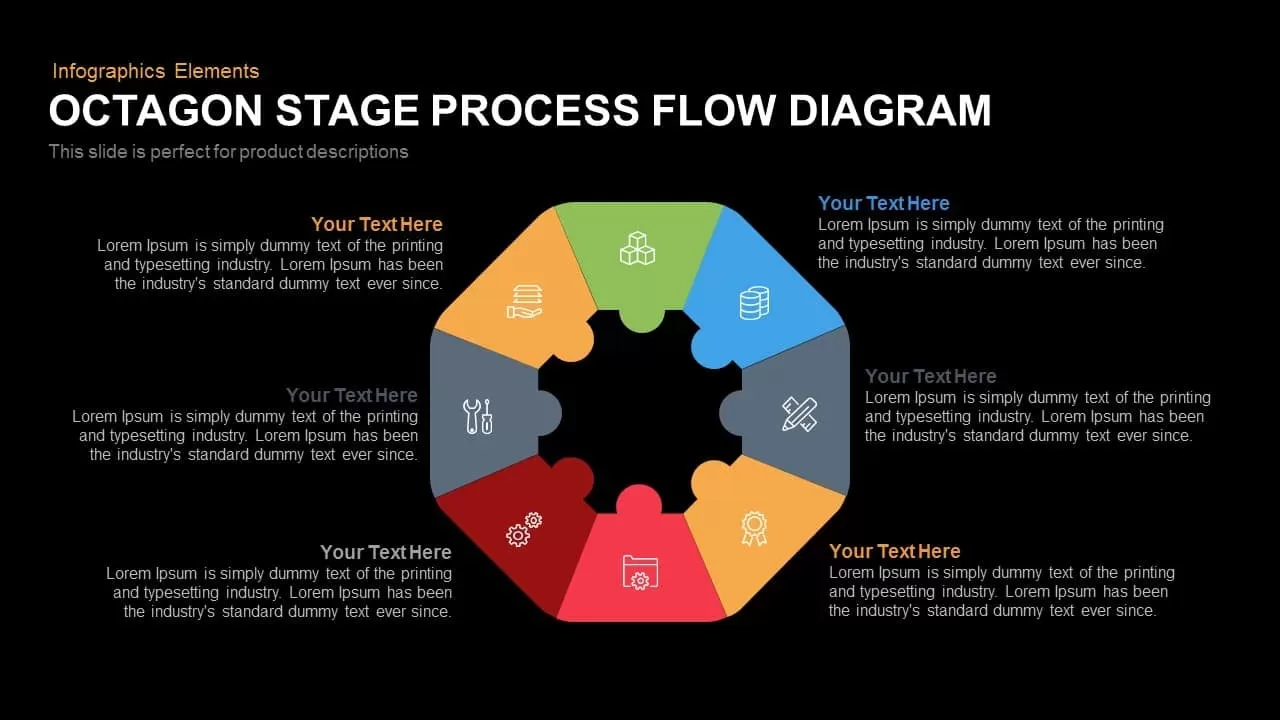
Octagon Process Flow template for PowerPoint & Google Slides
Process
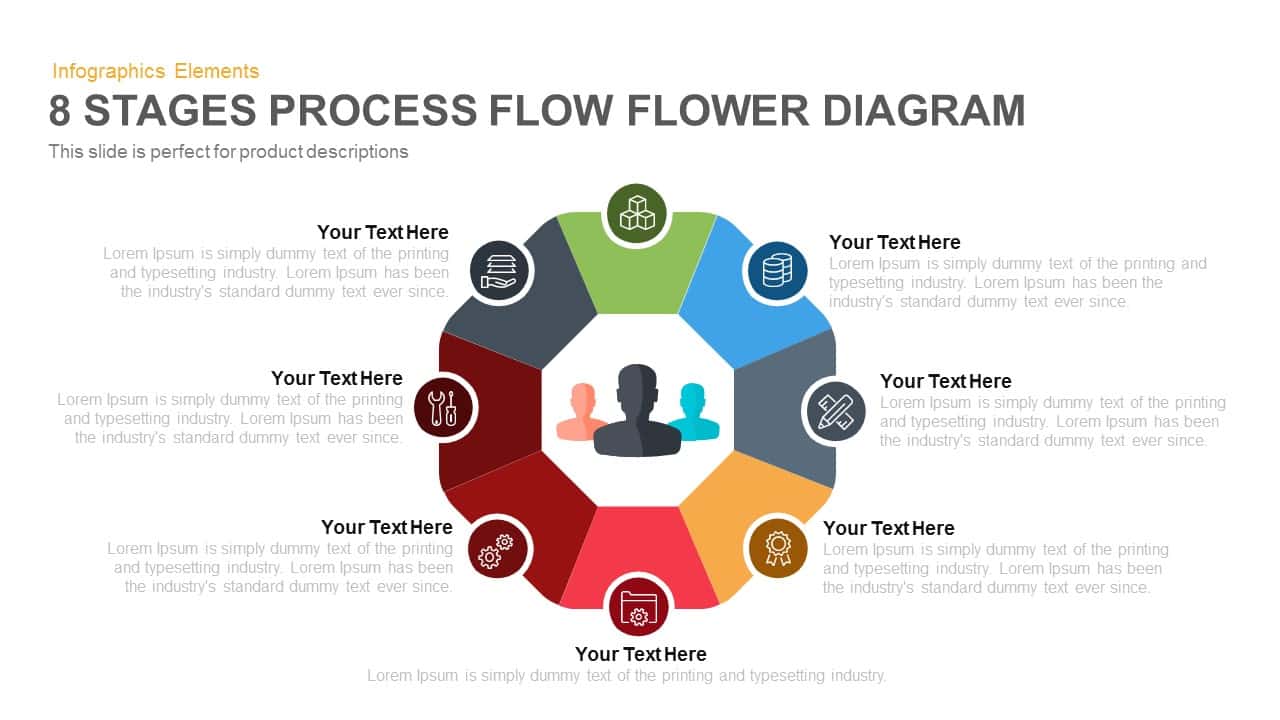
8-Stage Process Flow Flower Diagram Template for PowerPoint & Google Slides
Infographics
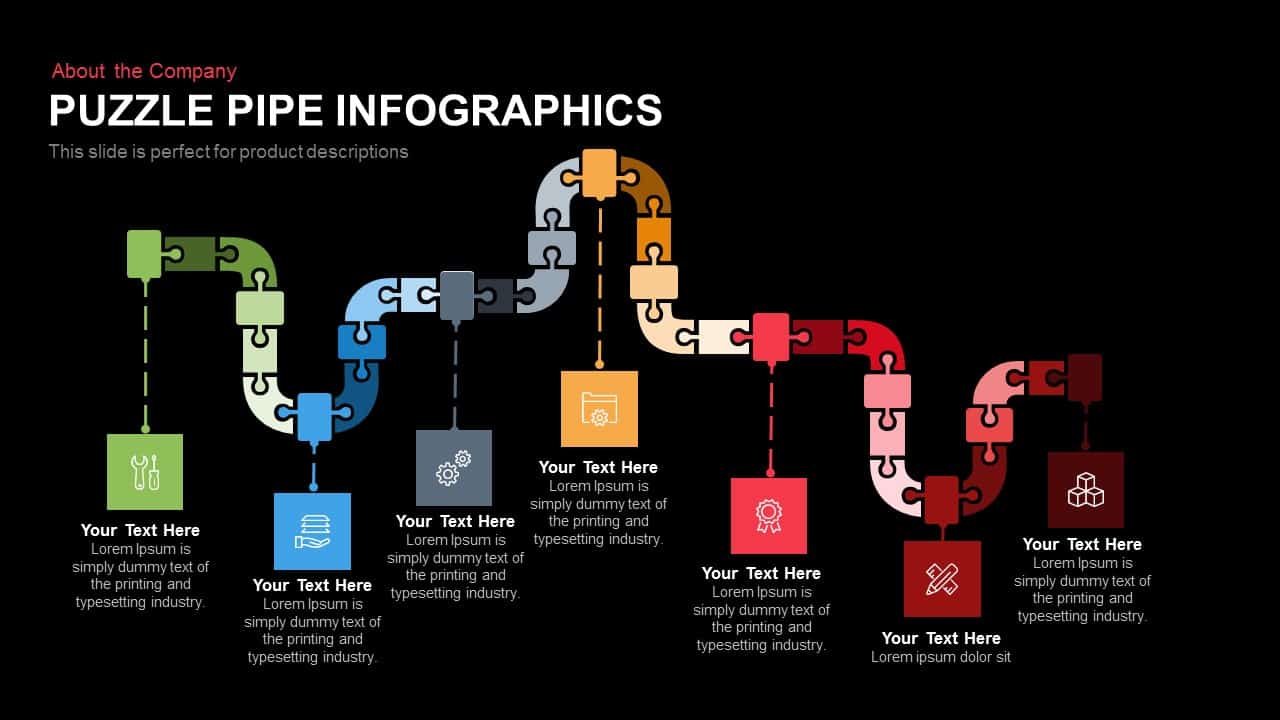
Puzzle Pipe Infographics Process Flow Template for PowerPoint & Google Slides
Process
Six Hexagon Stages Process Flow Diagram Template for PowerPoint & Google Slides
Process
Five Stage Linear Process Flow Template for PowerPoint & Google Slides
Process
5-Stage Arrow Infographics Process Flow Template for PowerPoint & Google Slides
Arrow
Process Flow Diagram template for PowerPoint & Google Slides
Infographics

15-Step Process Flow Diagram Template for PowerPoint & Google Slides
Process
3D Shape Linear Process Flow Diagram Template for PowerPoint & Google Slides
Process
Linear Process Flow Circles Diagram Template for PowerPoint & Google Slides
Process
Six-Stage Zig-Zag Process Flow Diagram Template for PowerPoint & Google Slides
Process
Vertical Business Process Flow Diagram Template for PowerPoint & Google Slides
Process
Five-Stage Direct Flow Arrow Process Template for PowerPoint & Google Slides
Arrow
Six-Sided Shutter Diagram Process Flow Template for PowerPoint & Google Slides
Process

10 Stages Business Flow Process Diagram template for PowerPoint & Google Slides
Business

Eight-Stage Radial Process Flow Diagram Template for PowerPoint & Google Slides
Process
Four-Plus Process Flow Diagram Template for PowerPoint & Google Slides
Process
Four-Stage Circular Process Flow Template for PowerPoint & Google Slides
Process
Five Stage Linear Process Flow Diagram Template for PowerPoint & Google Slides
Process
Isometric Five-Stage Process Flow Template for PowerPoint & Google Slides
Process
Five-Stage Linear Process Flow Diagram Template for PowerPoint & Google Slides
Process
Five-Step Hexagonal Process Flow Template for PowerPoint & Google Slides
Process
Gradient Chevron Five-Stage Process Flow Template for PowerPoint & Google Slides
Arrow
Six-Step Hexagon Process Flow Diagram Template for PowerPoint & Google Slides
Process
5-Stage Gear Process Flow Diagram Template for PowerPoint & Google Slides
Process
3D Seven-Stage Process Flow Diagram Template for PowerPoint & Google Slides
Process
Four-Stage Linear Process Flow Diagram Template for PowerPoint & Google Slides
Process
5-Stage Linear Process Flow Diagram Template for PowerPoint & Google Slides
Process
5 Stage Linear Process Flow Diagram Template for PowerPoint & Google Slides
Process
Five-Stage Process Flow Diagram Template for PowerPoint & Google Slides
Process
4 Stage Linear Process Flow Diagram Template for PowerPoint & Google Slides
Process
7 Stage Linear Process Flow Diagram Template for PowerPoint & Google Slides
Process
8 Step Circular Process Flow Diagram Template for PowerPoint & Google Slides
Process
4 Stage Linear Process Flow Diagram Template for PowerPoint & Google Slides
Process
6-Step Business Process Flow Diagram Template for PowerPoint & Google Slides
Process
6-Step Circular Process Flow Diagram Template for PowerPoint & Google Slides
Process
4-Stage Linear Process Flow Diagram Template for PowerPoint & Google Slides
Process
4-Step Linear Process Flow Diagram Template for PowerPoint & Google Slides
Process
Business Process Management Flow Diagram Template for PowerPoint & Google Slides
Process
Colorful 8-Stage Droplet Process Flow Diagram Template for PowerPoint & Google Slides
Process
5-Step Circular Gradient Process Flow Template for PowerPoint & Google Slides
Process
Recognition-Primed Decision Process Flow Template for PowerPoint & Google Slides
Flow Charts
Free Colorful Process Flow Infographics Template for PowerPoint & Google Slides
Process
Free
Process Flow Overview template for PowerPoint & Google Slides
Business
Process Flow Steps template for PowerPoint & Google Slides
Business Plan
Process Flow Diagram template for PowerPoint & Google Slides
Process
Process Flow Template for PowerPoint & Google Slides
Process
Colorful Process Flow Template for PowerPoint & Google Slides
Process
Colorful Process Flow Infographics Template for PowerPoint & Google Slides
Process
Process Flow Template for PowerPoint & Google Slides
Process
Free
Process Flow Template for PowerPoint & Google Slides
Process
Free
4 stage Process Flow template for PowerPoint & Google Slides
Process
5 Stage Process Flow Overview template for PowerPoint & Google Slides
Process
Curved Arrow Process Flow Diagram Template for PowerPoint & Google Slides
Process
Curved Arrow Process Flow Diagram Template for PowerPoint & Google Slides
Arrow
Circle Arrows Process Flow template for PowerPoint & Google Slides
Process
Curved Arrow Process Flow template for PowerPoint & Google Slides
Process
Circular Arrows Process Flow template for PowerPoint & Google Slides
Process
Curved Arrow Process Flow template for PowerPoint & Google Slides
Process
Circular Arrows Process Flow template for PowerPoint & Google Slides
Process
Circular Arrows Process Flow template for PowerPoint & Google Slides
Process
Circle Arrow Process Flow template for PowerPoint & Google Slides
Process
Circle Arrow Process Flow template for PowerPoint & Google Slides
Process
Animated Accordion Process Flow Template for PowerPoint & Google Slides
Process
Hexagonal Process Flow Template for PowerPoint & Google Slides
Process
E-Waste Management Process Flow Diagram Template for PowerPoint & Google Slides
Process
Current vs Future Process Flow Template for PowerPoint & Google Slides
Comparison
Comprehensive Hiring Process Flow Chart Template for PowerPoint & Google Slides
Flow Charts
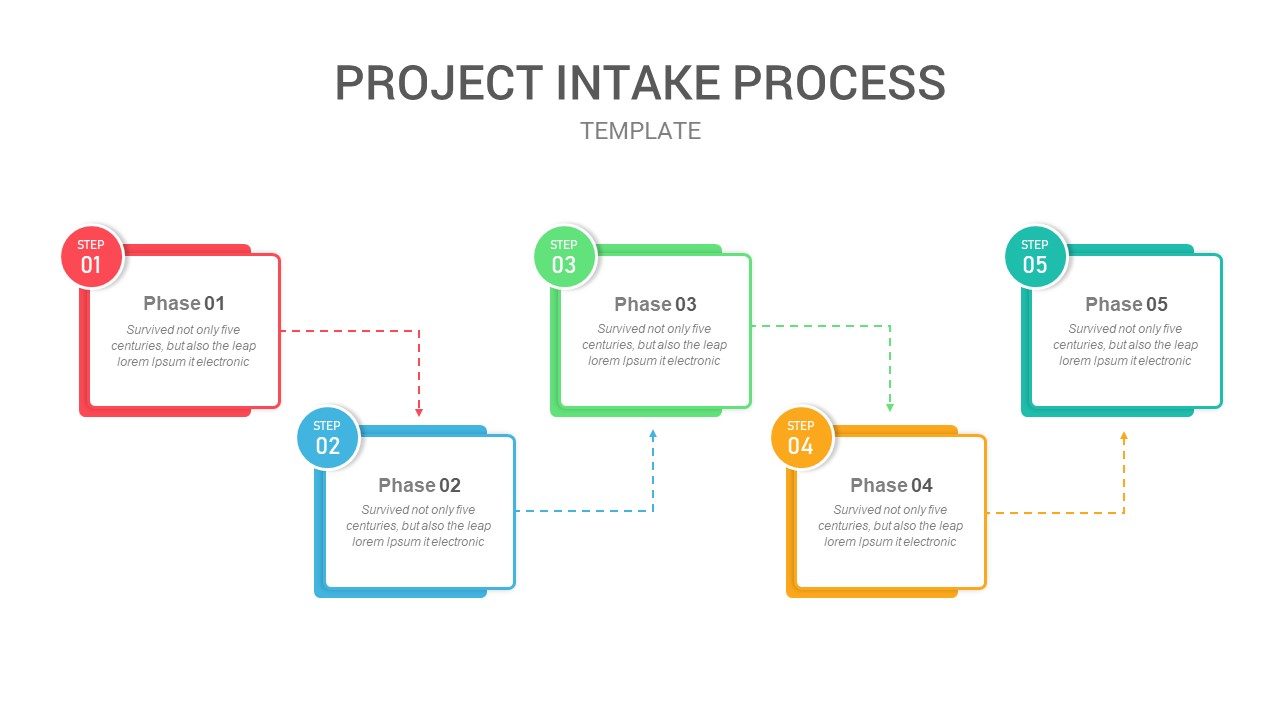
Five-Phase Project Intake Process Flow Template for PowerPoint & Google Slides
Process
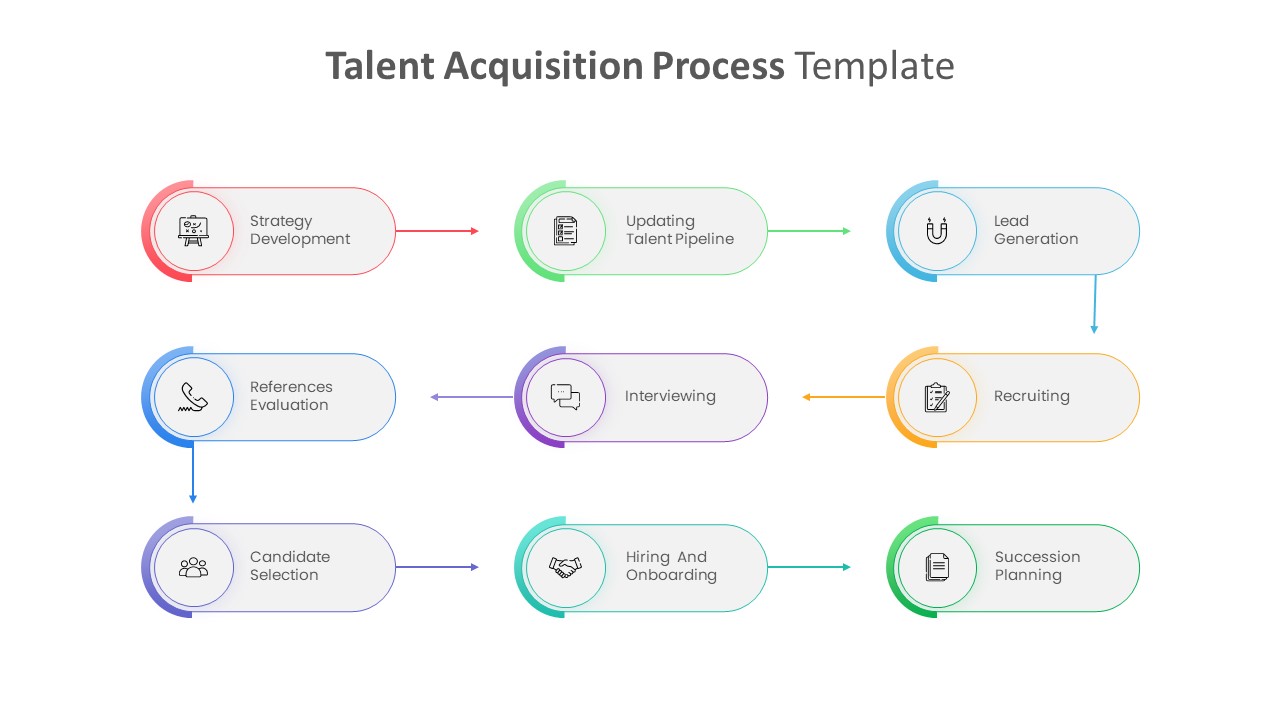
Talent Acquisition Process Flow Template for PowerPoint & Google Slides
Recruitment

DevOps Infographics & Process Flow Template for PowerPoint & Google Slides
Information Technology
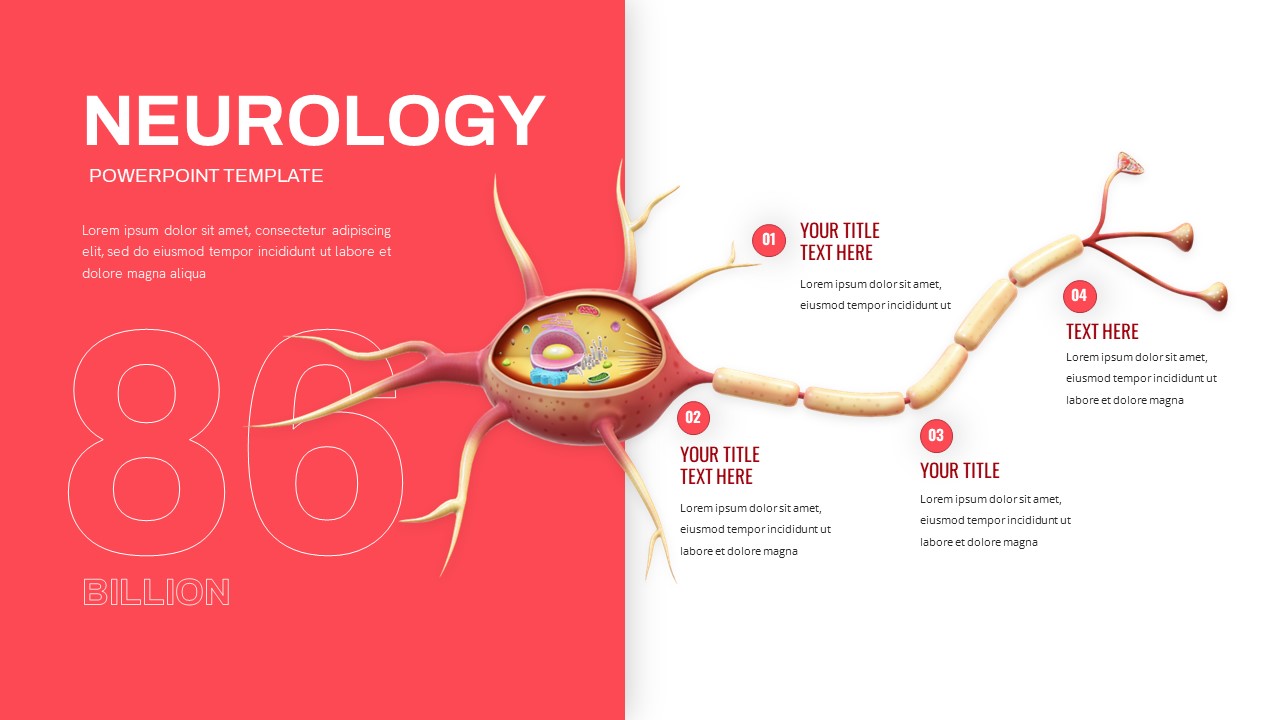
Neurology Neuron Structure Process Flow Template for PowerPoint & Google Slides
Health
Comprehensive Process Flow Diagram Template for PowerPoint & Google Slides
Process
Animated Gears Process Flow Diagram Template for PowerPoint & Google Slides
Process
Wastewater Treatment Process Flow Chart Template for PowerPoint & Google Slides
Flow Charts
Capital Investments Process Flow Diagram Template for PowerPoint & Google Slides
Process
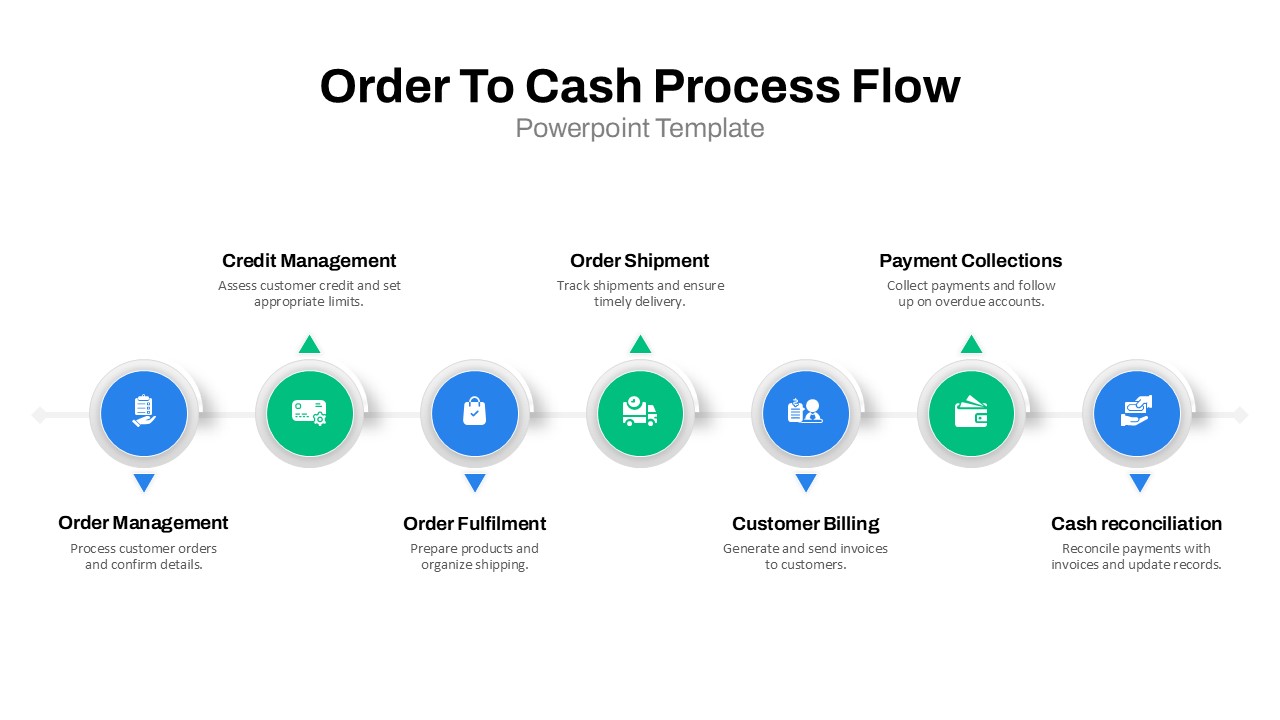
Order to Cash Process Flow Diagram Template for PowerPoint & Google Slides
Process
Chevron Process Flow Sequence Slide Template for PowerPoint & Google Slides
Arrow
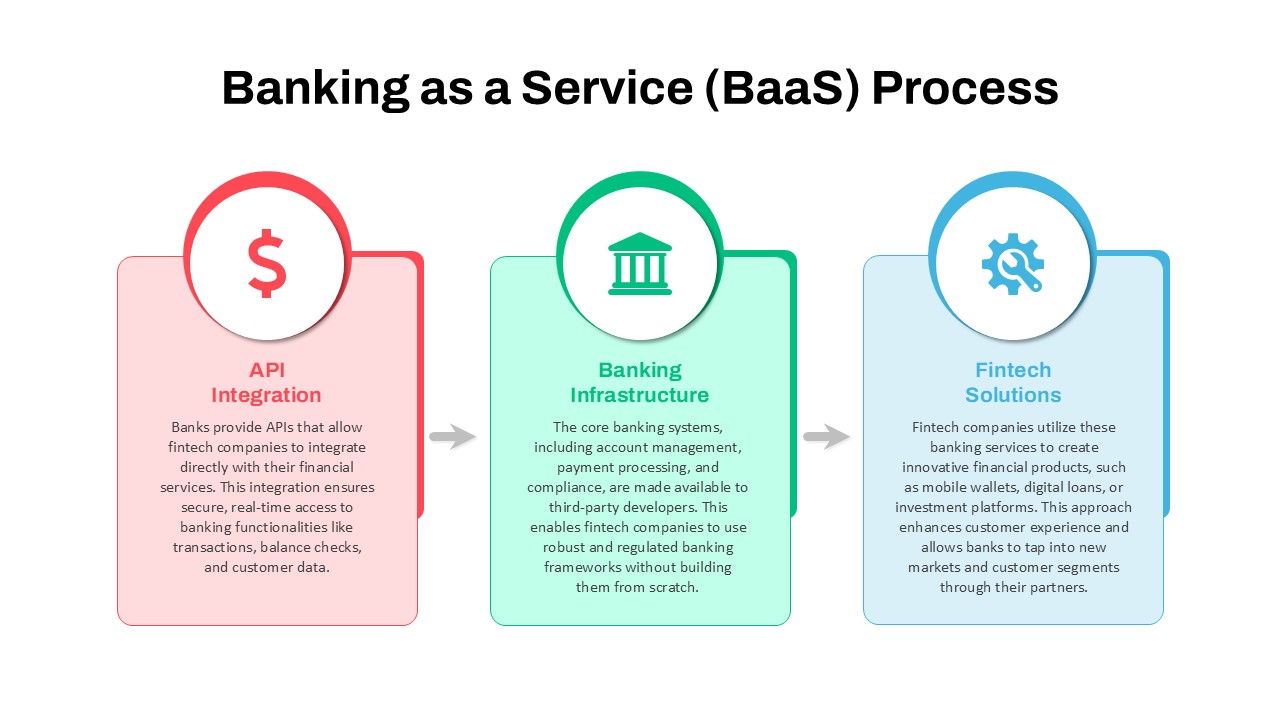
Banking as a Service (BaaS) Process Flow Template for PowerPoint & Google Slides
Process
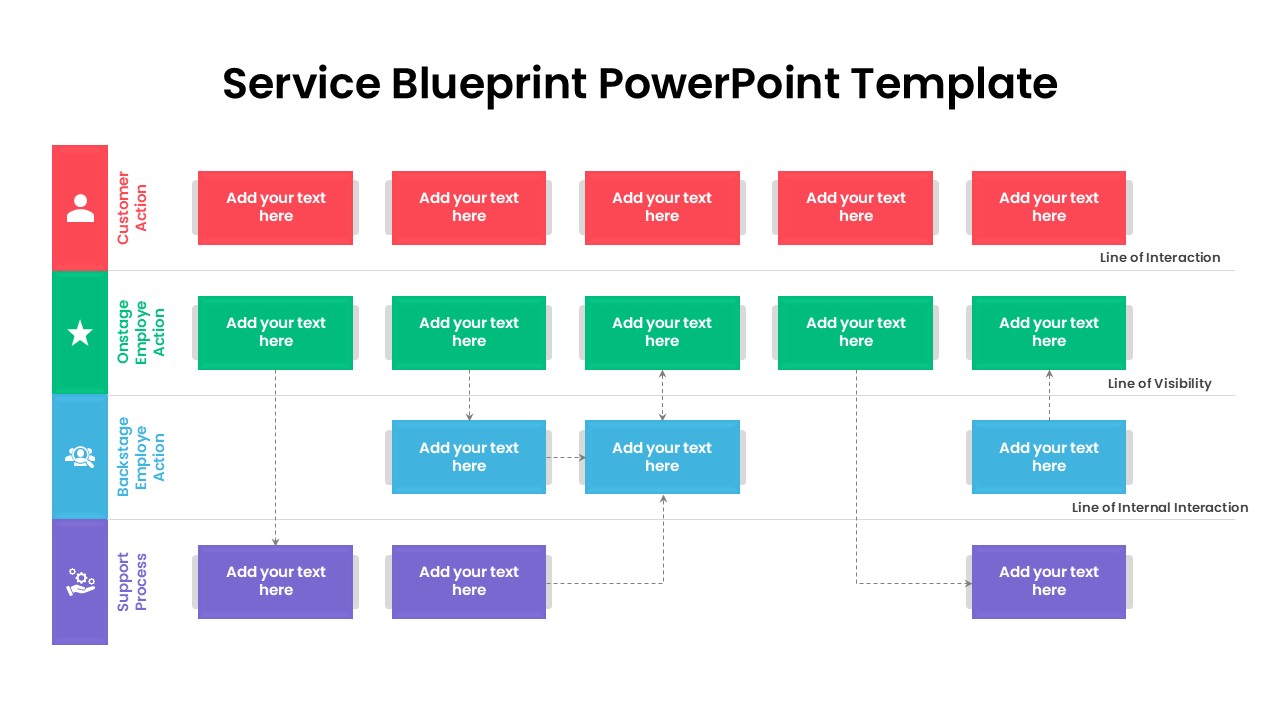
Service Blueprint Process Flow Template for PowerPoint & Google Slides
Process
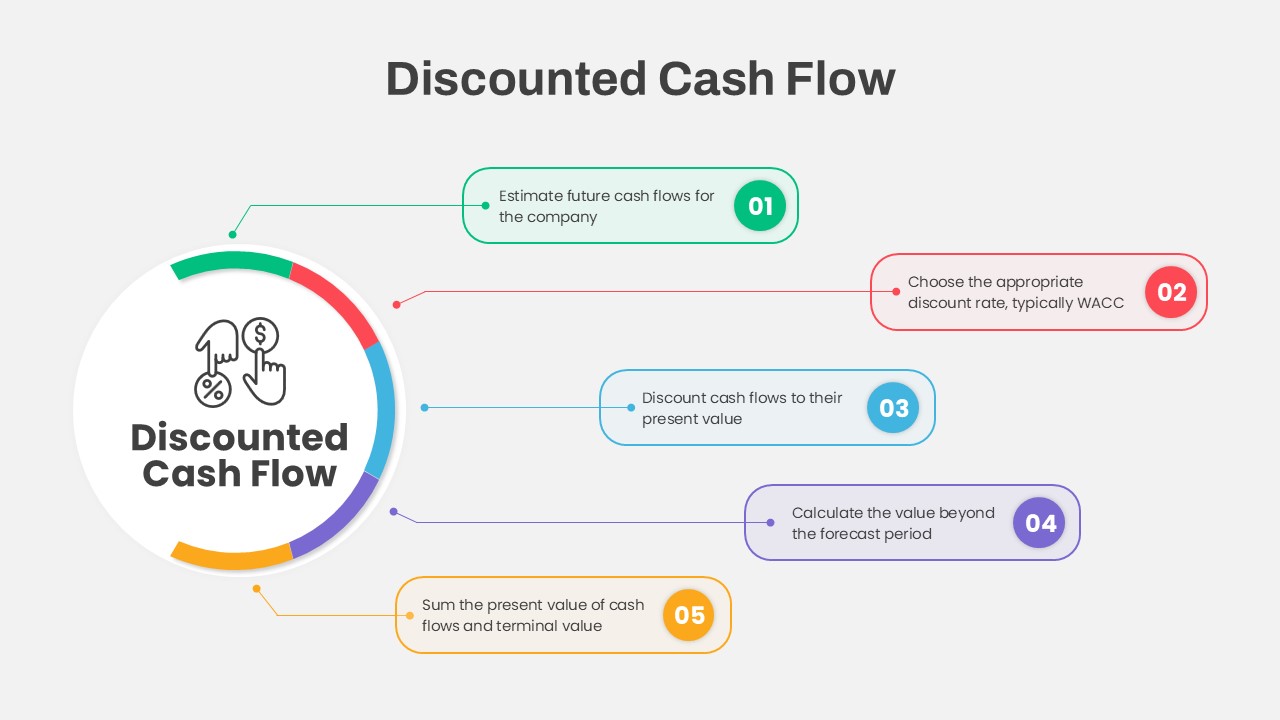
Discounted Cash Flow Five-Step Process Template for PowerPoint & Google Slides
Process
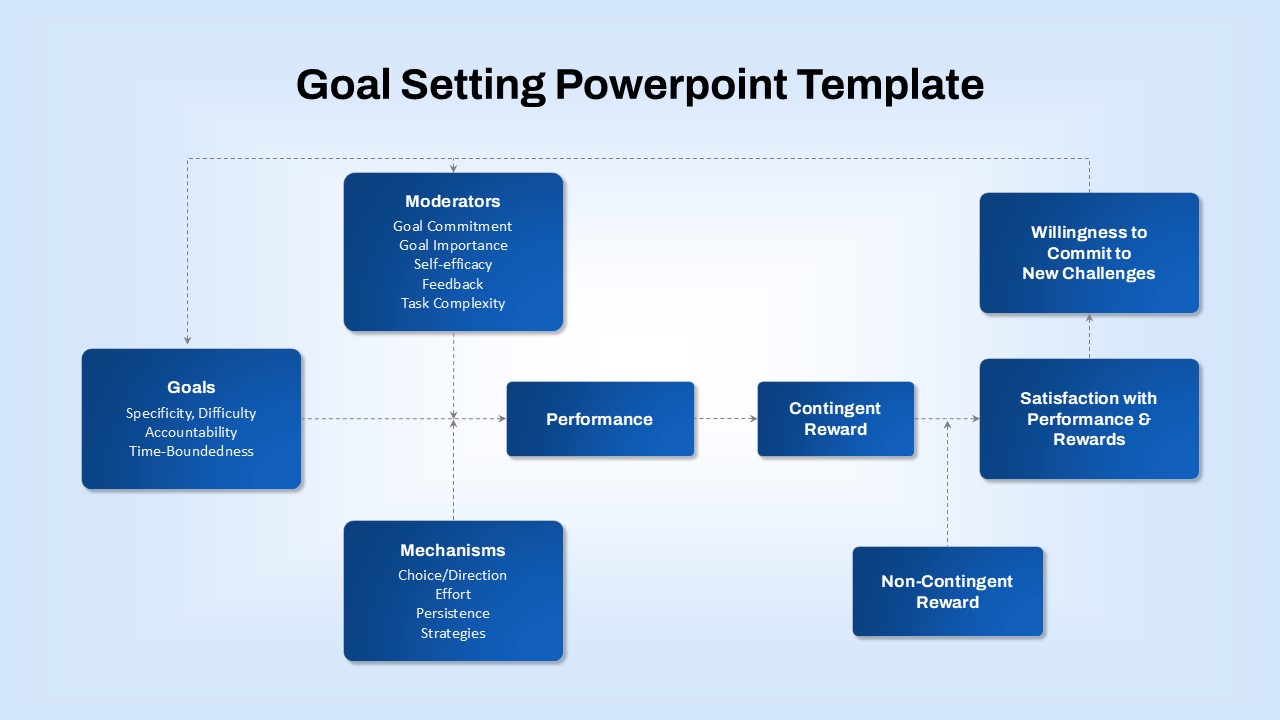
Goal-Setting Process Flow Diagram Template for PowerPoint & Google Slides
Goals
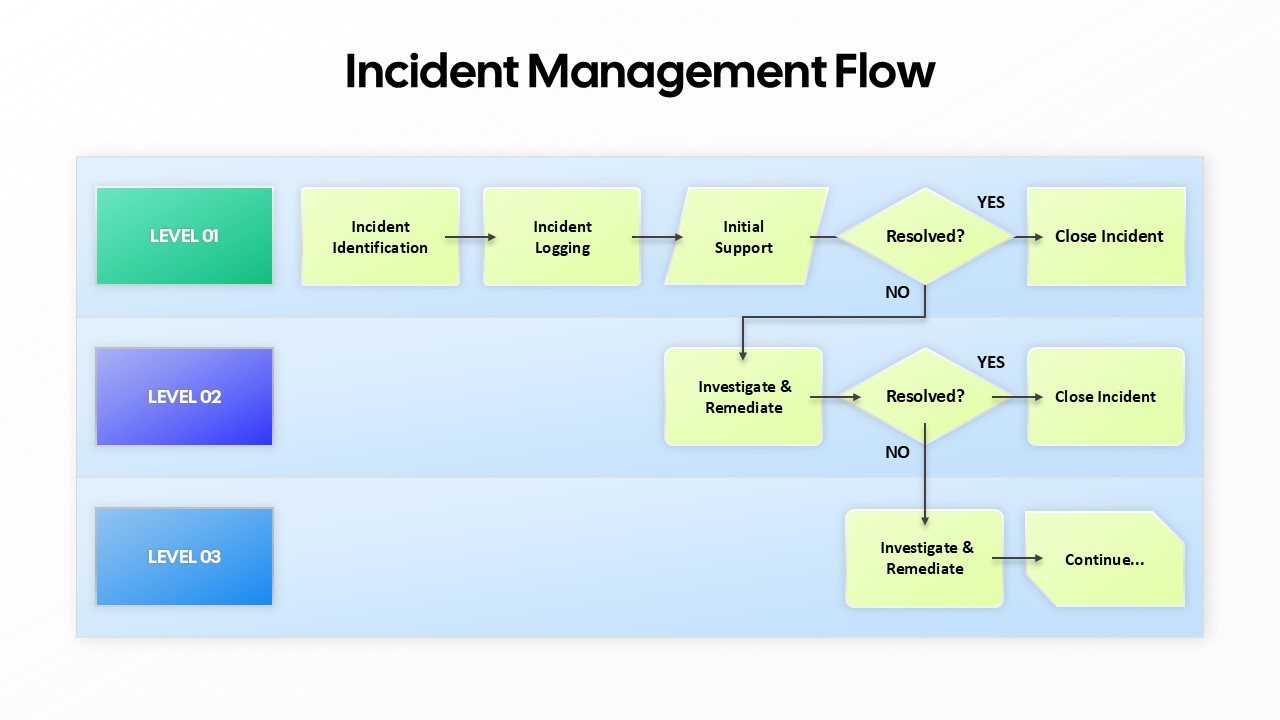
Incident Management Flow Process template for PowerPoint & Google Slides
Flow Charts
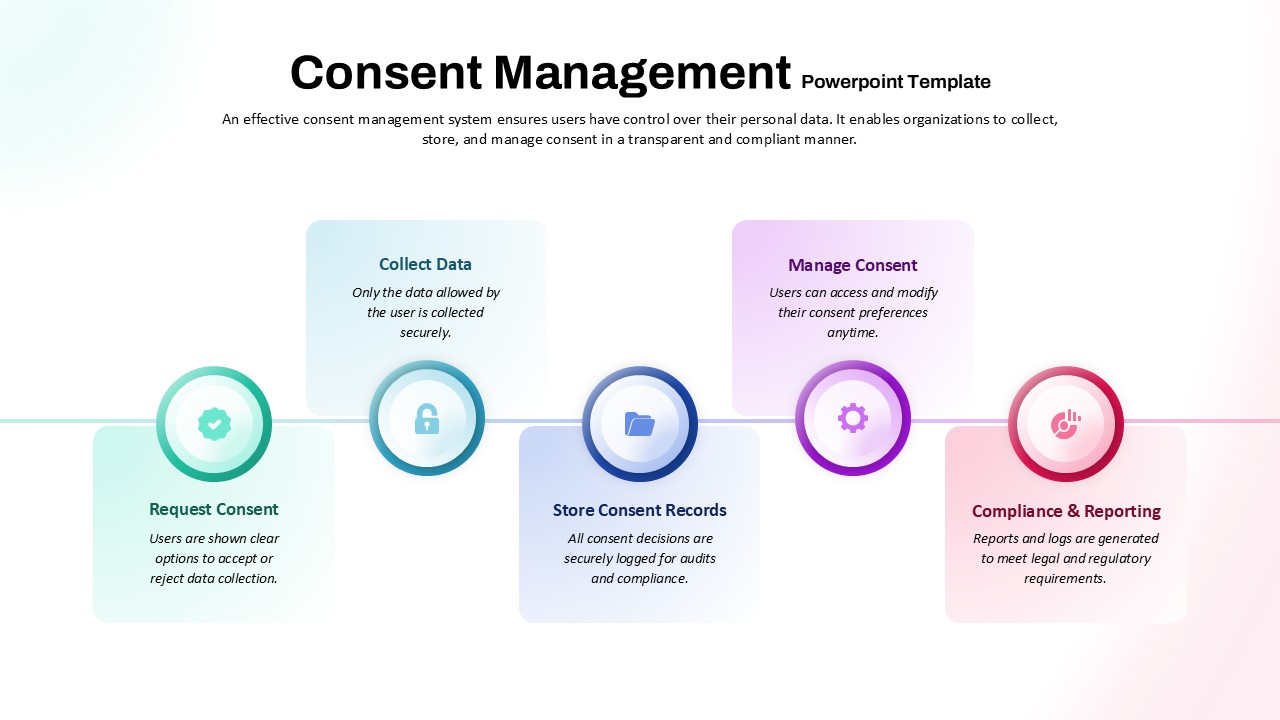
Consent Management System Process Flow Template for PowerPoint & Google Slides
Process
Q-Learning Process Flow Diagram Template for PowerPoint & Google Slides
Process
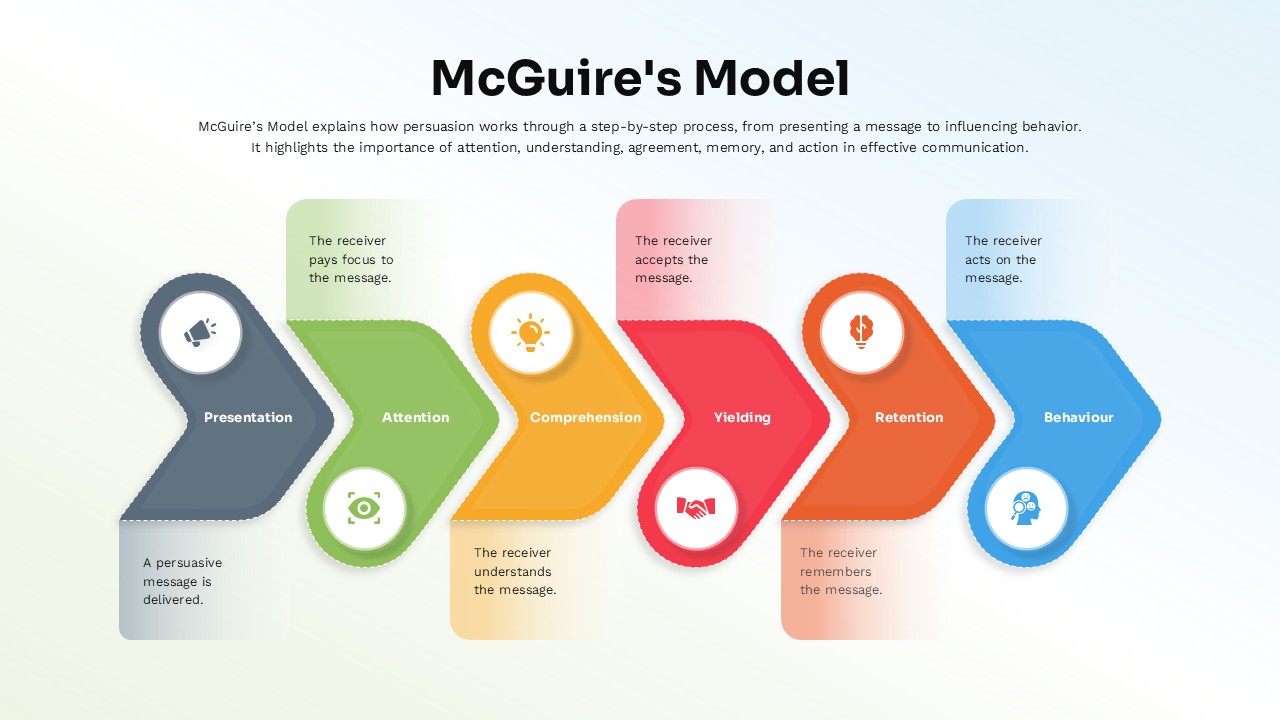
McGuire’s Persuasion Process Flow Diagram Template for PowerPoint & Google Slides
Marketing