Colorful Startup Financing Cycle Diagram Template for PowerPoint & Google Slides


Description
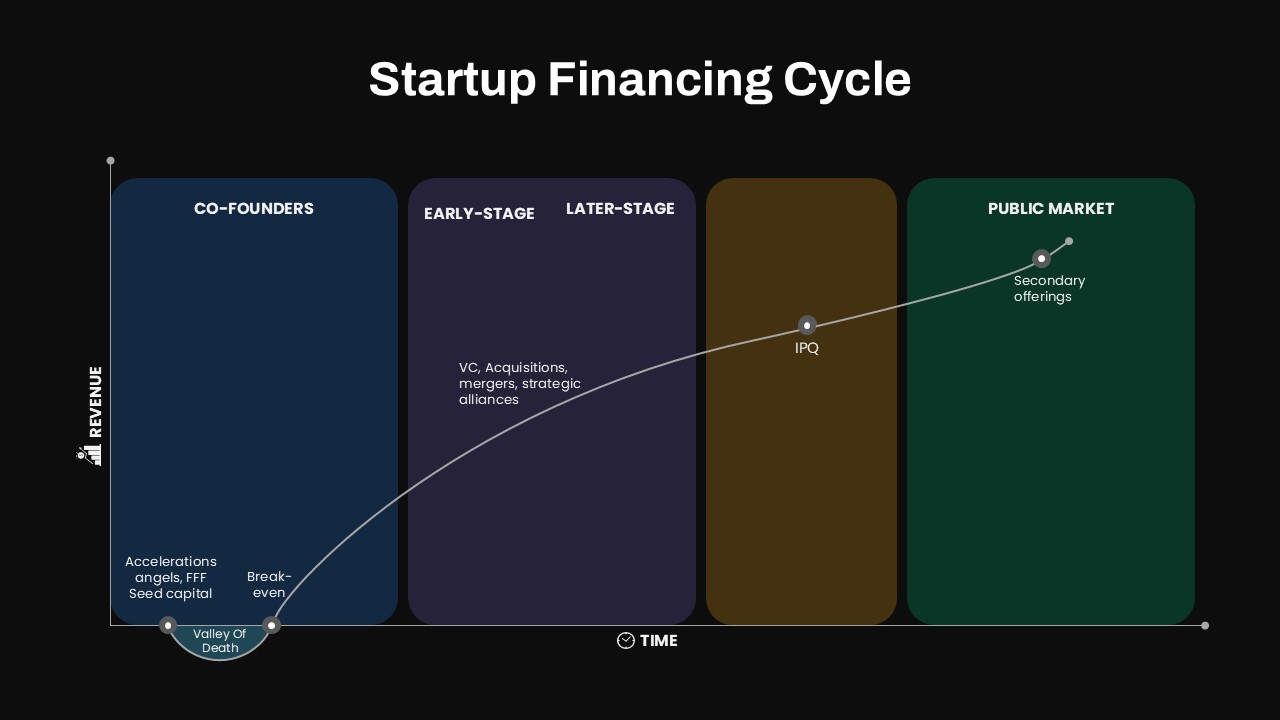
Leverage this comprehensive Startup Financing Cycle template to clearly visualize the progression of funding stages from co-founder investments through public market listings. The slide features a clean time-axis layout with pastel-colored panels representing four growth phases: Co-Founders, Early-Stage, Later-Stage, and Public Market. A smooth revenue-growth curve sweeps across the timeline, highlighting critical milestones such as the Valley of Death dip, break-even point, seed capital injections, venture capital rounds, strategic alliances, IPO, and secondary offerings. Descriptive labels and minimalist icons reinforce key concepts, while master-slide configurations and editable font styles ensure rapid customization. You can easily swap icons, adjust panel colors to match your brand, and insert data placeholders for financial metrics, making it ideal for detailed investor reports or high-level executive summaries. The balanced composition maintains clarity across devices and resolutions, empowering presenters to deliver a polished, data-driven narrative in both PowerPoint and Google Slides environments.
Who is it for
Entrepreneurs, startup founders, and business leaders can use this slide to communicate funding strategies and growth roadmaps to investors, board members, and executive teams. Venture capitalists, financial analysts, and corporate development professionals will appreciate the structured visual narrative when evaluating deal flow or benchmarking portfolio companies. Innovation consultants and accelerator programs can also leverage this asset during mentorship sessions and demo days.
Other Uses
Beyond investor presentations, repurpose this financing cycle diagram for educational workshops, entrepreneurial training modules, and classroom lectures on startup finance. Adapt the timeline to illustrate product development phases, project funding timelines, or M&A roadmaps. The flexible panel design also suits progress reporting in incubator programs, internal strategy reviews, and stakeholder updates across industries.
Login to download this file

Item ID
SB04476
Related Templates

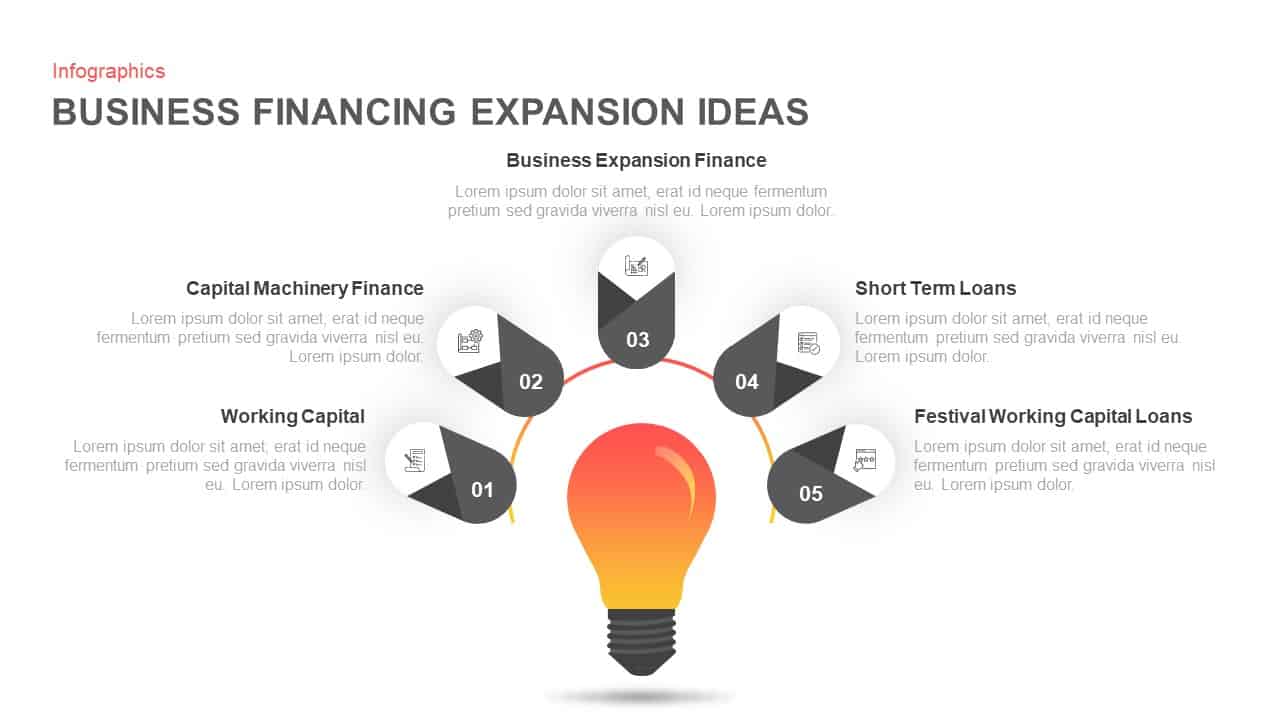
Business Financing Expansion Strategy Template for PowerPoint & Google Slides
Infographics
Colorful Arrow Process Diagram Template for PowerPoint & Google Slides
Arrow
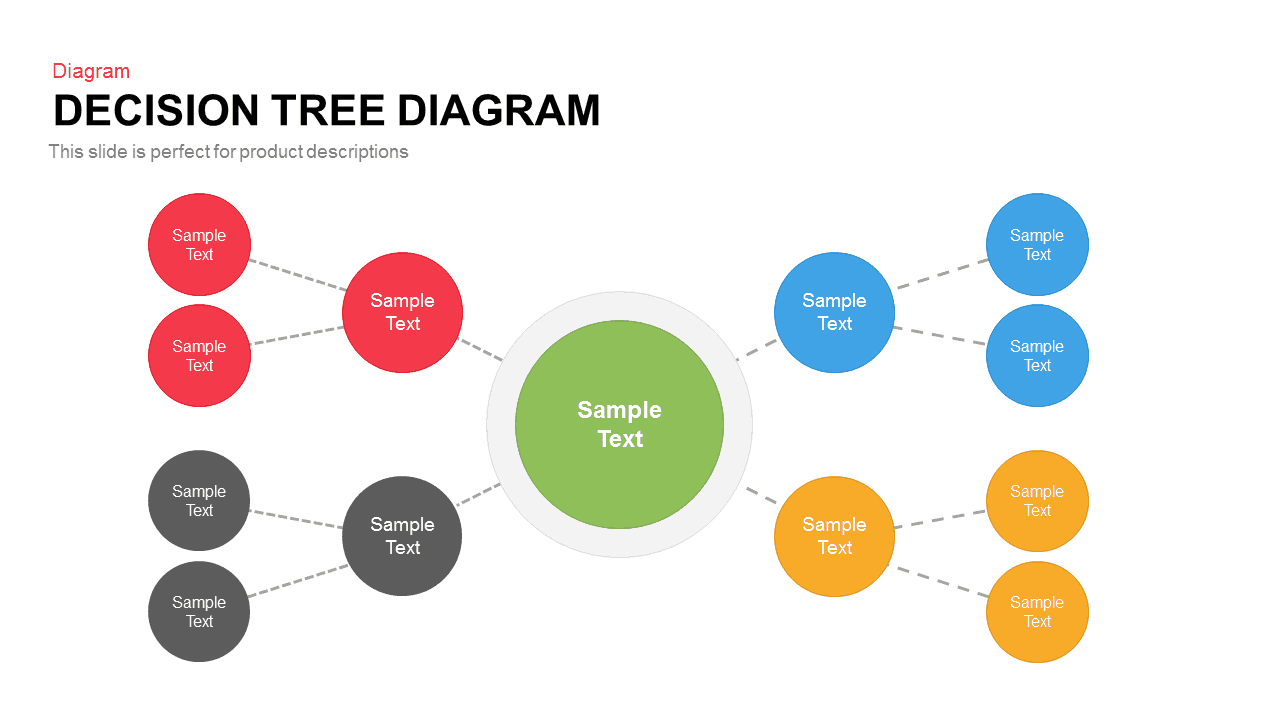
Colorful Decision Tree Diagram template for PowerPoint & Google Slides
Decision Tree
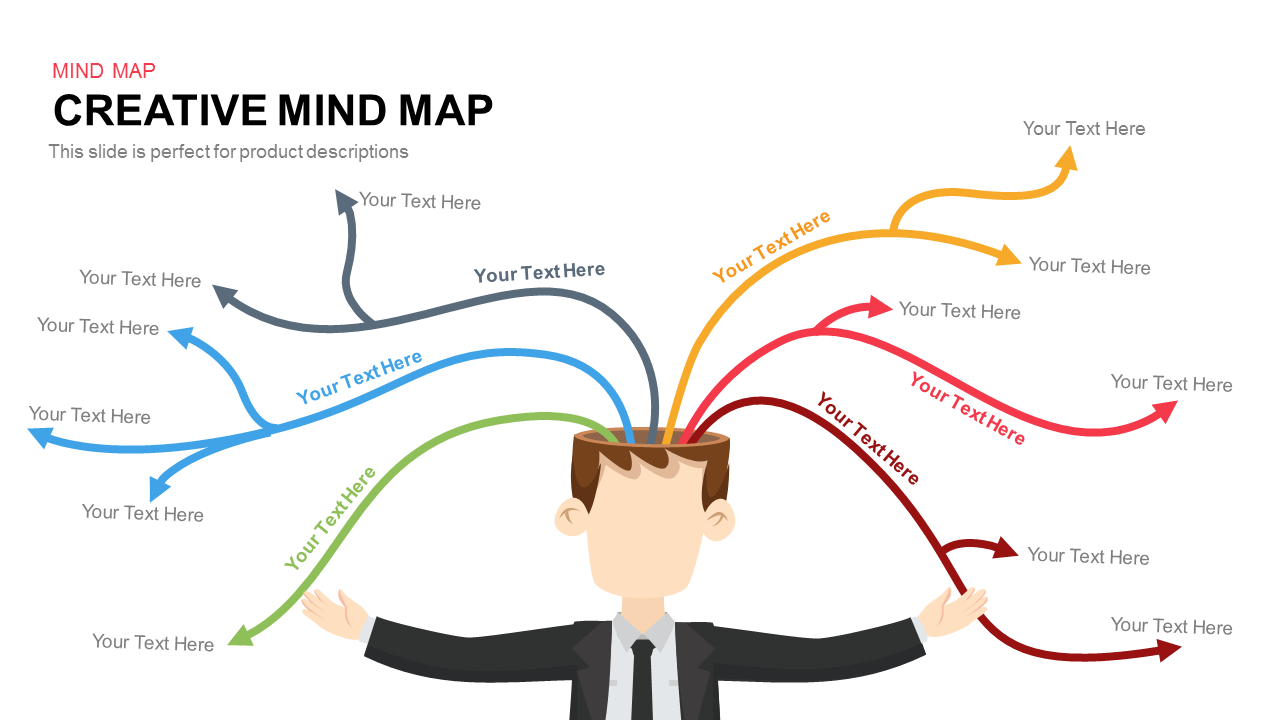
Colorful Creative Mind Map Diagram template for PowerPoint & Google Slides
Mind Maps

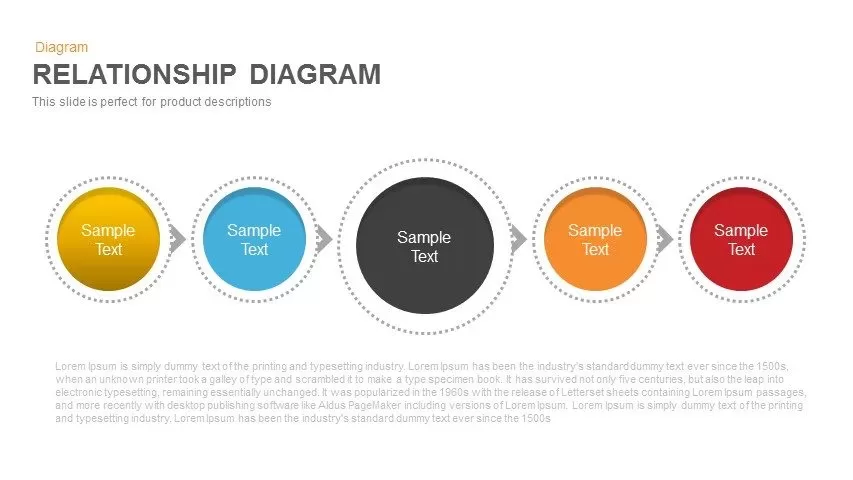
Colorful Five-Stage Relationship Diagram Template for PowerPoint & Google Slides
Process
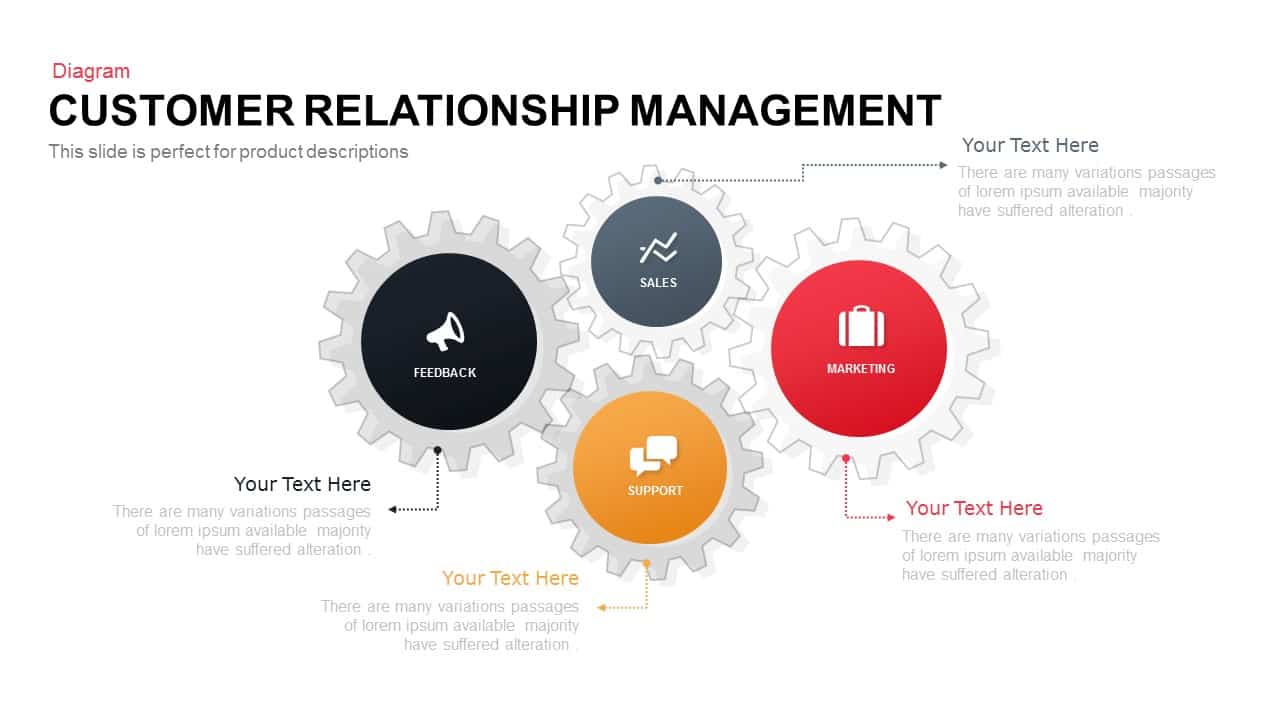
Colorful Modern CRM Gear Diagram Template for PowerPoint & Google Slides
Customer Experience
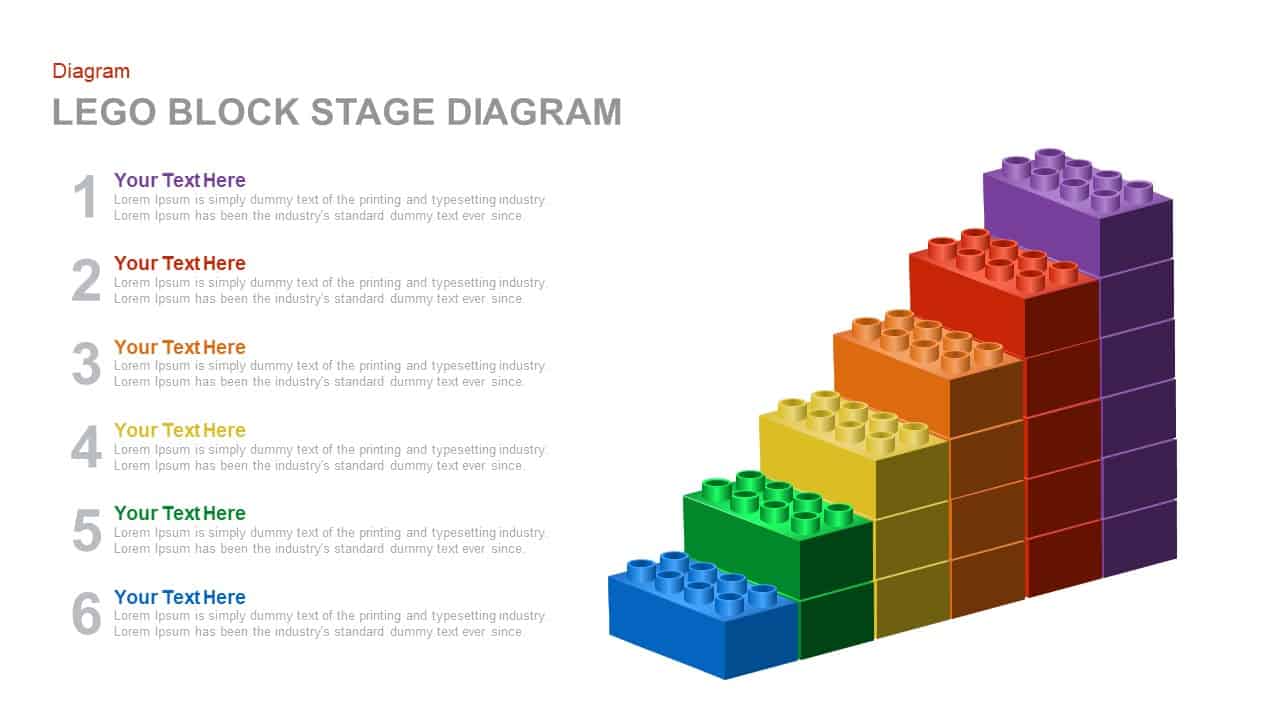
Colorful LEGO Block Stage Diagram Template for PowerPoint & Google Slides
Process
Colorful Venn Diagram Infographics Template for PowerPoint & Google Slides
Circular
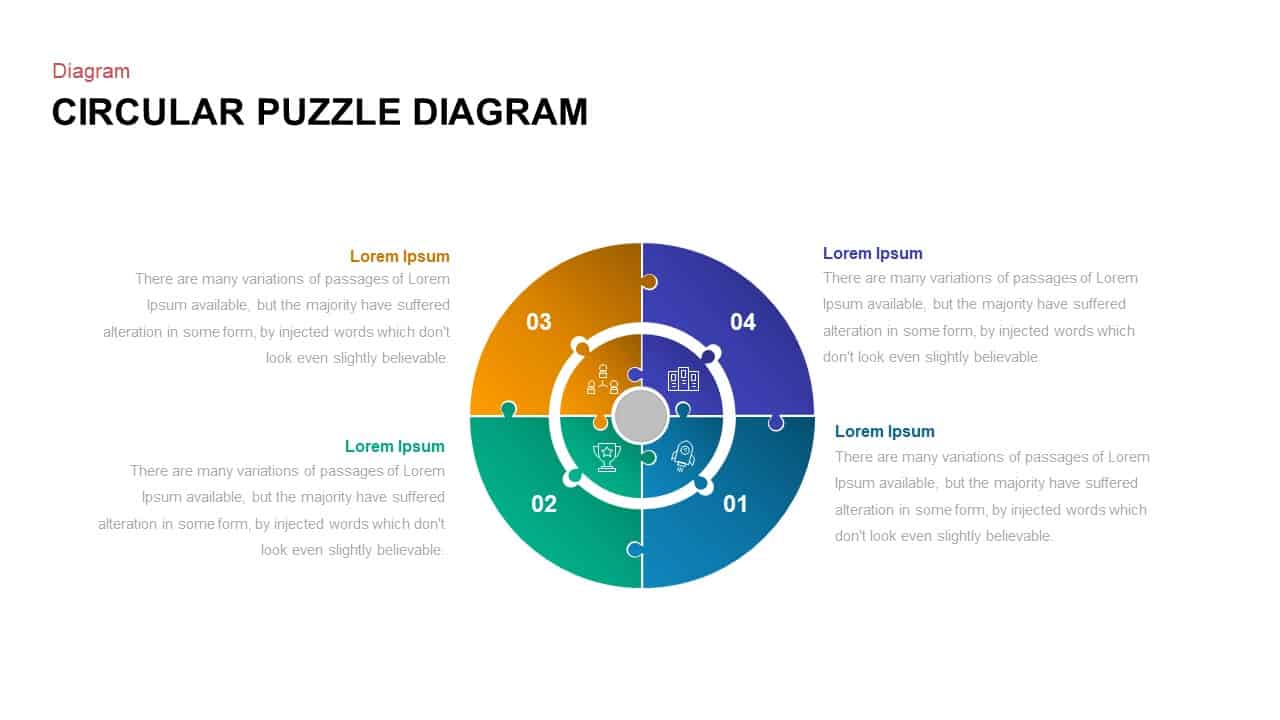
Colorful Circular Puzzle Diagram Template for PowerPoint & Google Slides
Circular
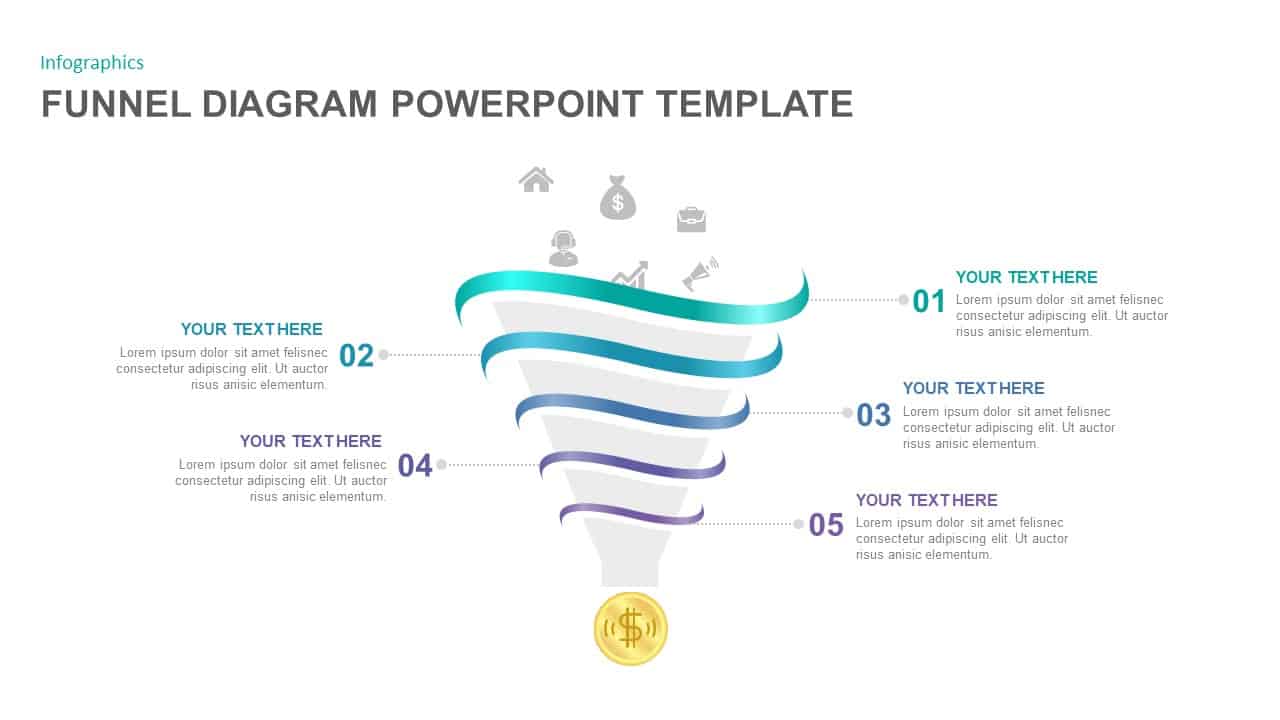
5-Step Colorful Funnel Diagram Template for PowerPoint & Google Slides
Funnel
Colorful 8-Stage Droplet Process Flow Diagram Template for PowerPoint & Google Slides
Process
Colorful Six-Piece Puzzle Diagram Template for PowerPoint & Google Slides
Infographics
Colorful Eight-Piece Puzzle Diagram Template for PowerPoint & Google Slides
Process
Colorful Five-Step Roadmap Diagram Template for PowerPoint & Google Slides
Roadmap
Colorful Seven-Piece Puzzle Diagram Template for PowerPoint & Google Slides
Process
Colorful Nine-Piece Puzzle Diagram Template for PowerPoint & Google Slides
Process
10-Step Colorful Circular Diagram Template for PowerPoint & Google Slides
Circular
Colorful Five-Stage Methodology Diagram Template for PowerPoint & Google Slides
Process
Six-Step Colorful Flywheel Diagram Template for PowerPoint & Google Slides
Circular
Four-Level Colorful Pyramid Diagram Template for PowerPoint & Google Slides
Pyramid
Colorful Snake Process Diagram Template for PowerPoint & Google Slides
Process

Colorful SWOT Analysis Diagram Template for PowerPoint & Google Slides
SWOT
Four-Level Colorful Pyramid Diagram Template for PowerPoint & Google Slides
Pyramid
Colorful Layered Onion Diagram Slide for PowerPoint & Google Slides
Process
Free Colorful Tree Diagram for Growth & Strategy in PowerPoint & Google Slides
Infographics
Free
Colorful Venn Diagram with 4 Circle for PowerPoint & Google Slides
Circular
Colorful Rainbow Slides Template for PowerPoint & Google Slides
Graphics
Editable Colorful Daily Agenda Slides Template for PowerPoint & Google Slides
Agenda
Free Colorful Morning Meeting Agenda Slides Template for PowerPoint & Google Slides
Agenda
Free
Colorful Birthday Celebration Slides for PowerPoint & Google Slides
Graphics
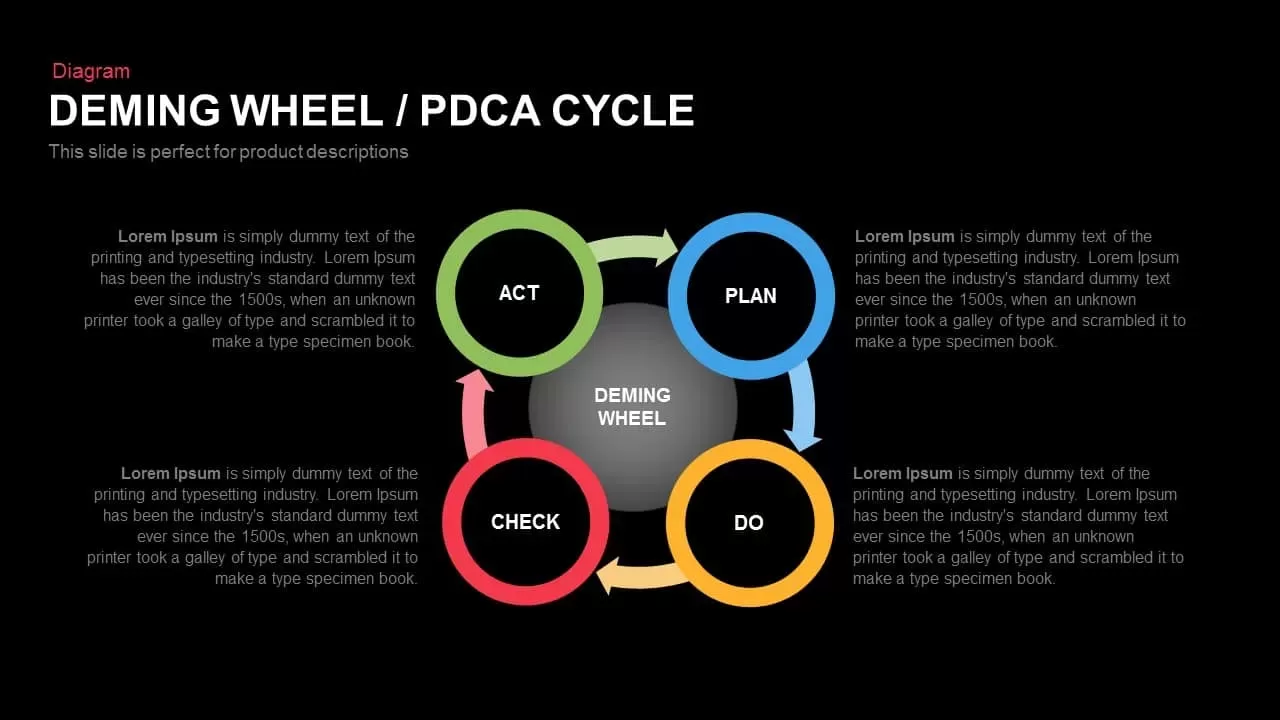
Deming Wheel PDCA Cycle Diagram Template for PowerPoint & Google Slides
Business Plan
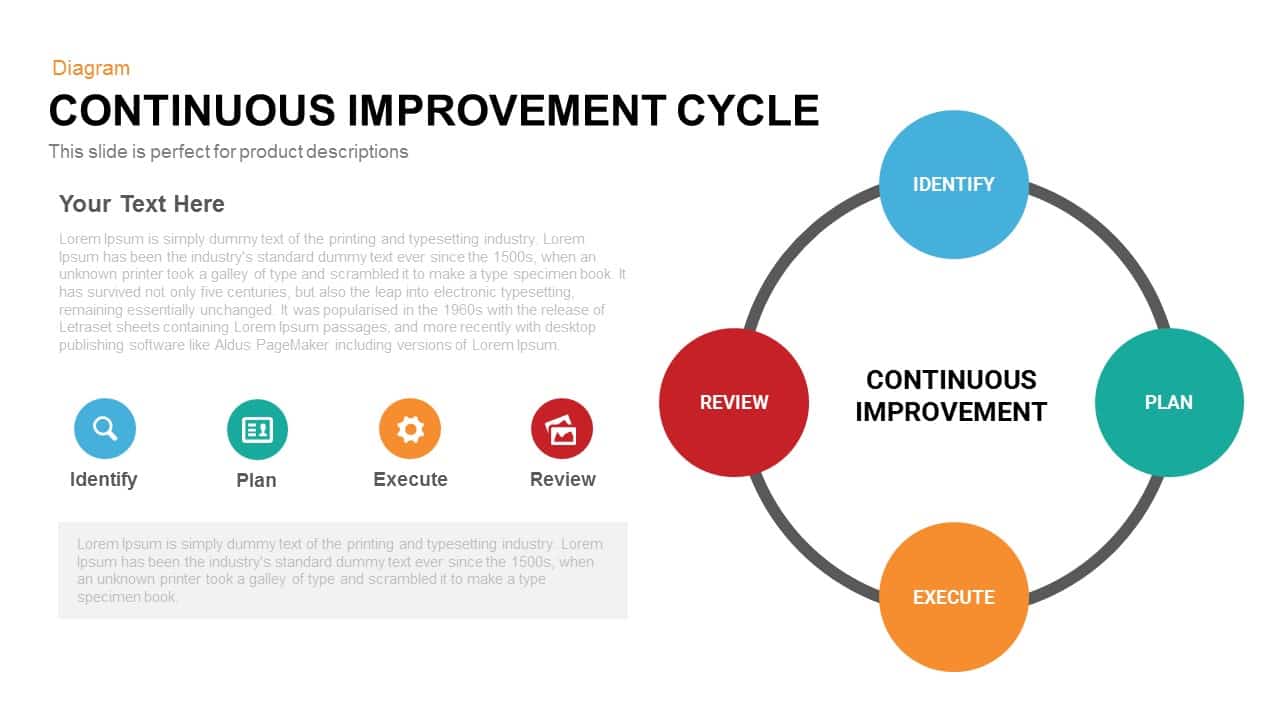
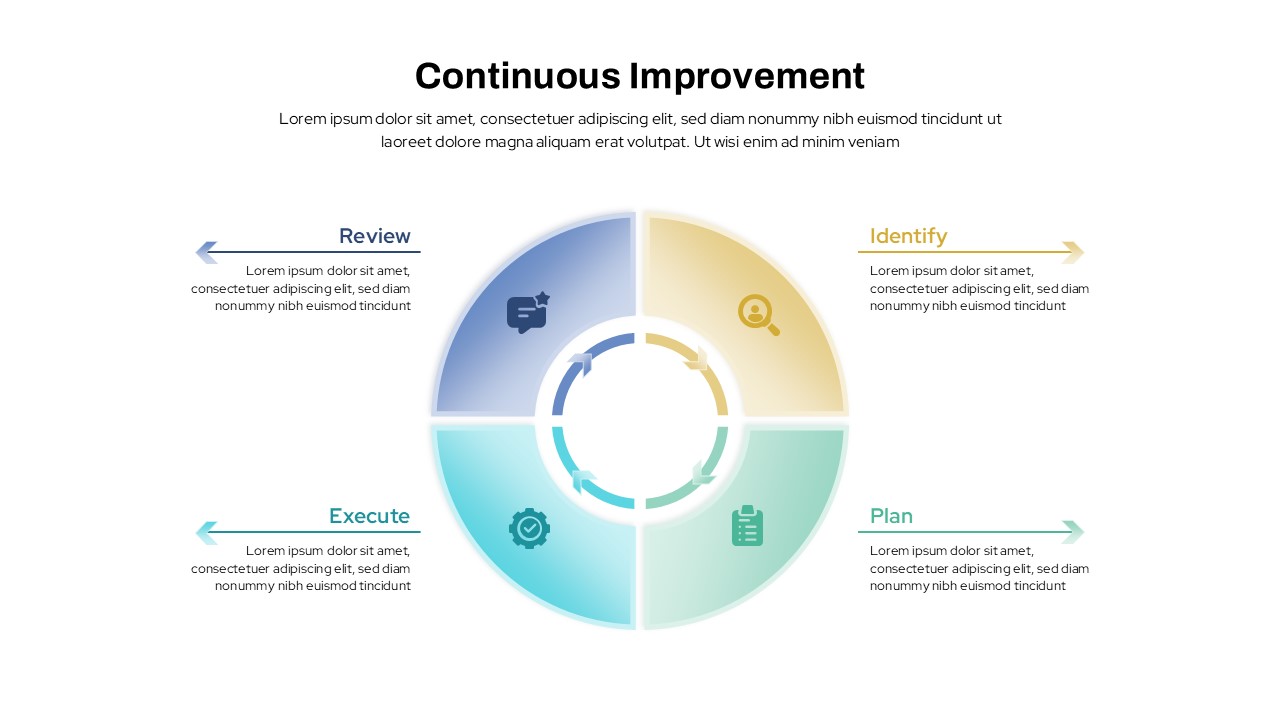
Continuous Improvement Cycle Diagram Template for PowerPoint & Google Slides
Circular
Modern Five-Stage Cycle Process Diagram Template for PowerPoint & Google Slides
Process
Six-Stage Circular Cycle Diagram Template for PowerPoint & Google Slides
Process
Four-Point Arrow Cycle Diagram Template for PowerPoint & Google Slides
Arrow

Data-Driven Marketing Cycle Diagram Template for PowerPoint & Google Slides
Customer Journey
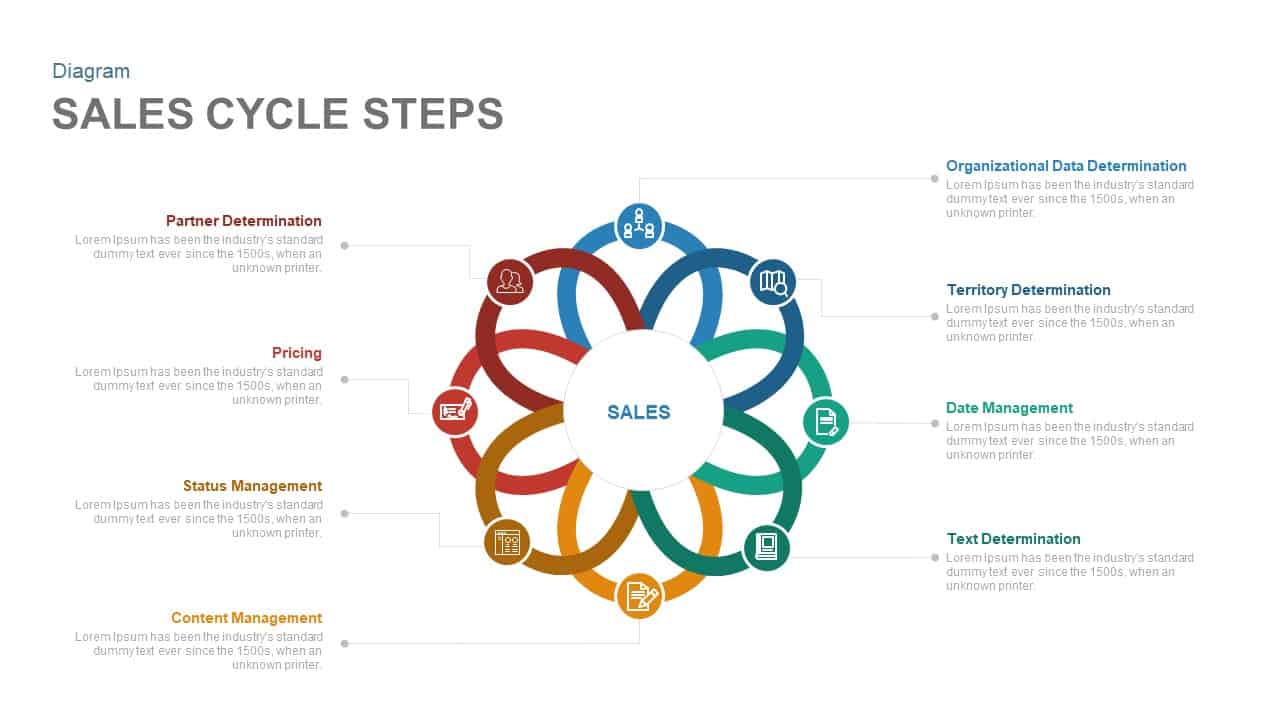
Eight-Step Sales Cycle Diagram Template for PowerPoint & Google Slides
Process
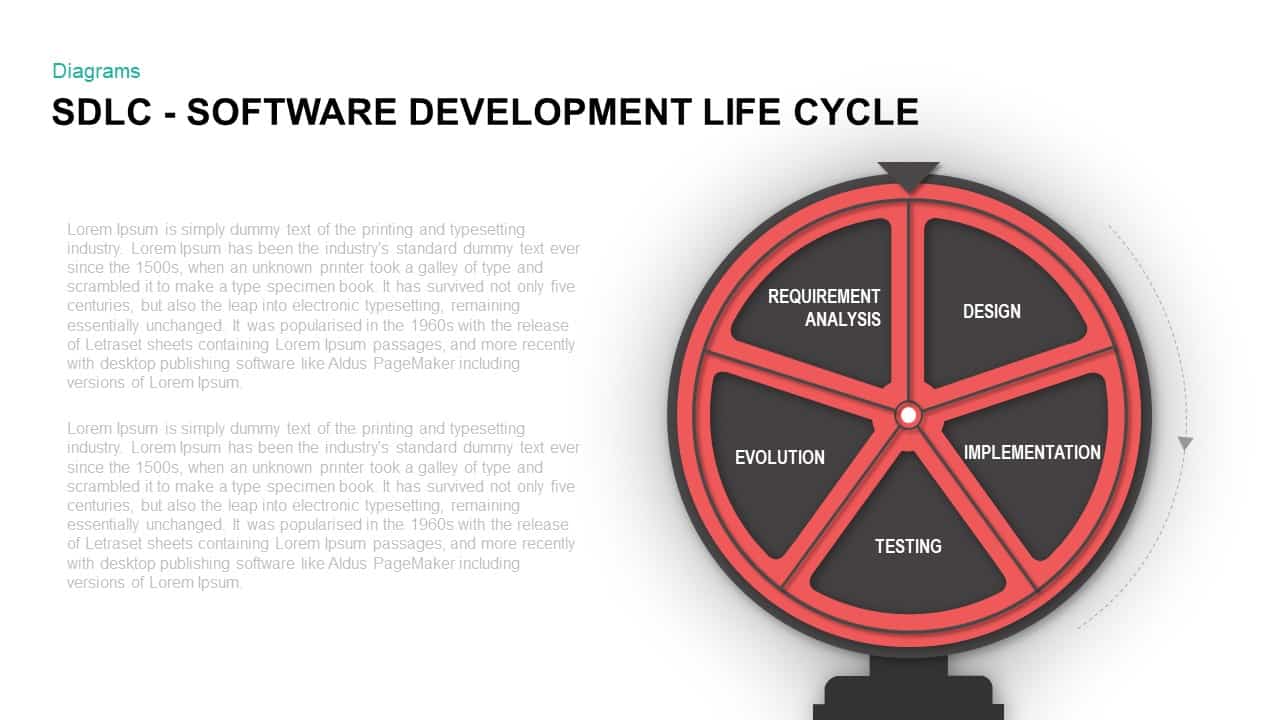
Software Development Life Cycle Diagram Template for PowerPoint & Google Slides
Circular
3, 4 & 5 Circular Stages Cycle Diagram Deck Template for PowerPoint & Google Slides
Circular
Four-Stage Cycle Process Diagram Template for PowerPoint & Google Slides
Process
Data Migration Life Cycle Curved Diagram Template for PowerPoint & Google Slides
Process
8-Step Circular Accounting Cycle Diagram Template for PowerPoint & Google Slides
Accounting
Multi-Style Project Life Cycle Diagram Template for PowerPoint & Google Slides
Process
Supply and Demand Creation Cycle Diagram Template for PowerPoint & Google Slides
Process

Modern 6-Step Cycle Diagram Slide Deck Template for PowerPoint & Google Slides
Process
Corporate Product Life Cycle Diagram Template for PowerPoint & Google Slides
Process
Enterprise Risk Management Cycle Diagram Template for PowerPoint & Google Slides
Process
4MAT Learning Cycle Circular Diagram Template for PowerPoint & Google Slides
Circular
4-Step Circular PDCA Cycle Diagram Template for PowerPoint & Google Slides
Process
Continuous Improvement Cycle Diagram Template for PowerPoint & Google Slides
Process
7-Step Virtuous Economy Cycle Diagram Template for PowerPoint & Google Slides
Process
Communication Cycle Process Diagram template for PowerPoint & Google Slides
Business
Concentric Circular Arrow Cycle Diagram Template for PowerPoint & Google Slides
Process
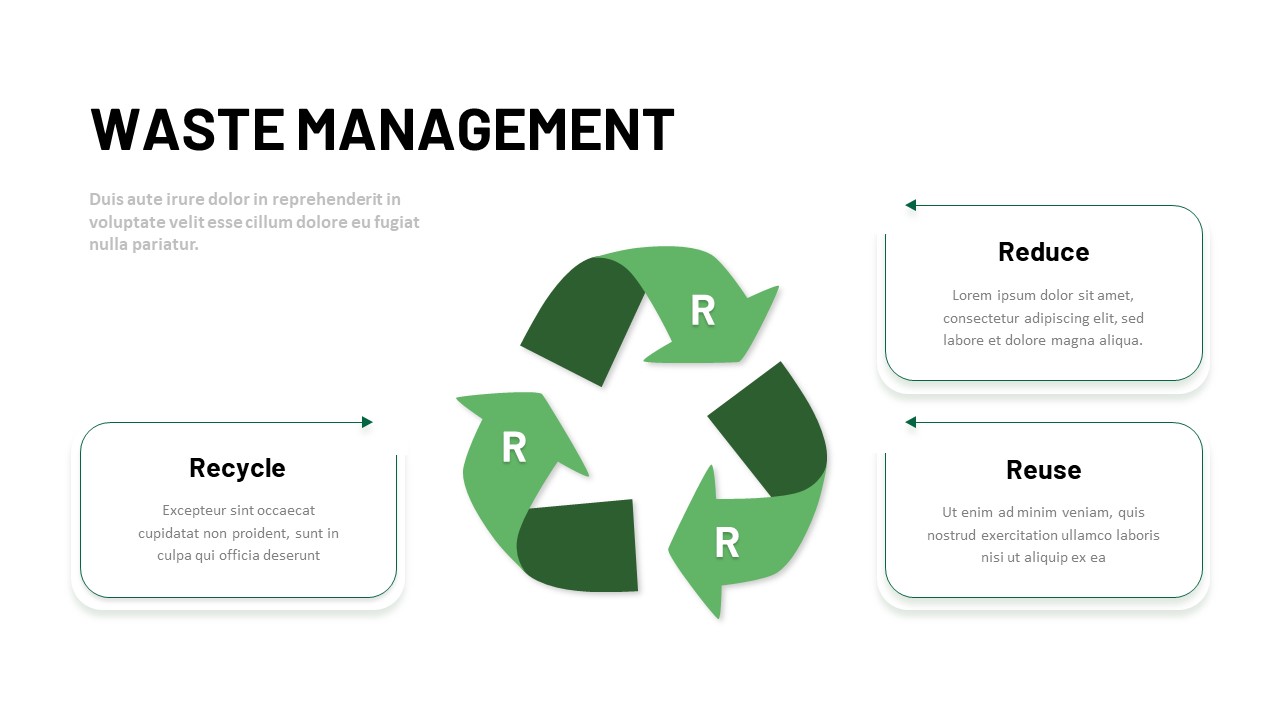
3R Waste Management Cycle Diagram Template for PowerPoint & Google Slides
Circular
Release Management Cycle Circular Diagram Template for PowerPoint & Google Slides
Software Development
Business Process Analysis Cycle Diagram Template for PowerPoint & Google Slides
Business Strategy
Free Time Management Clock Cycle Diagram Template for PowerPoint & Google Slides
Process
Free
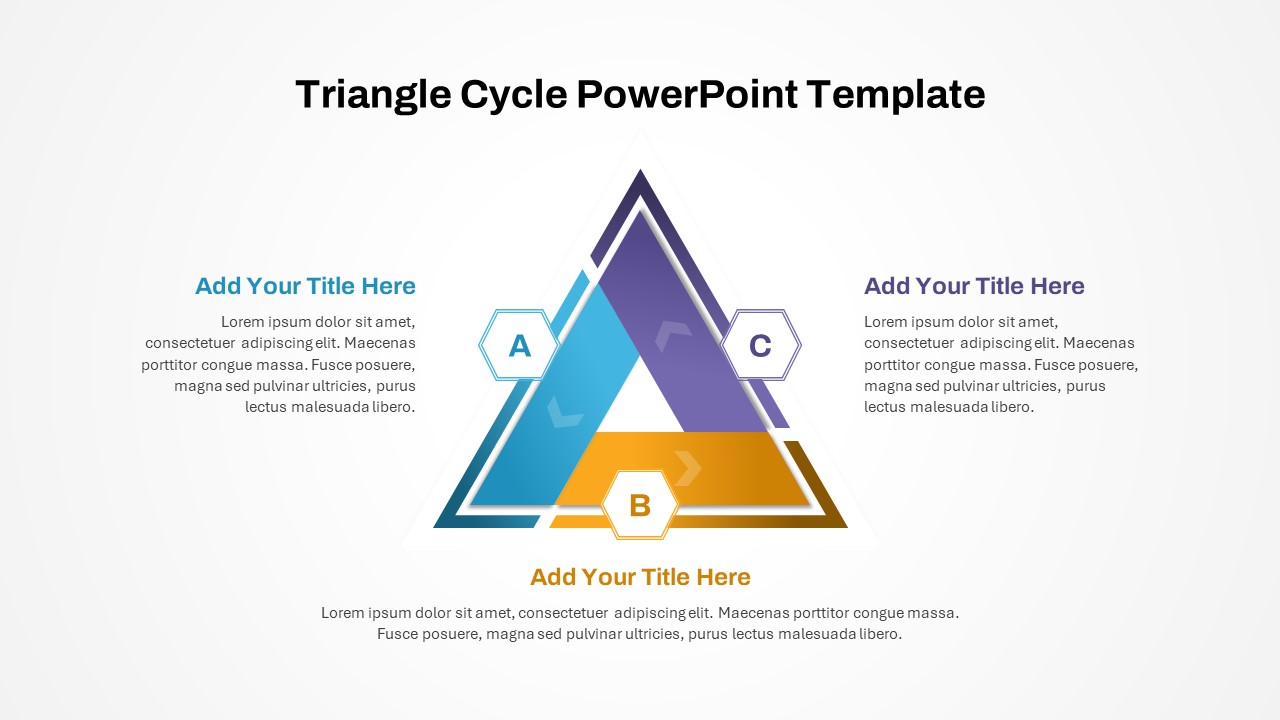
Three-Phase Triangle Cycle Diagram Template for PowerPoint & Google Slides
Infographics
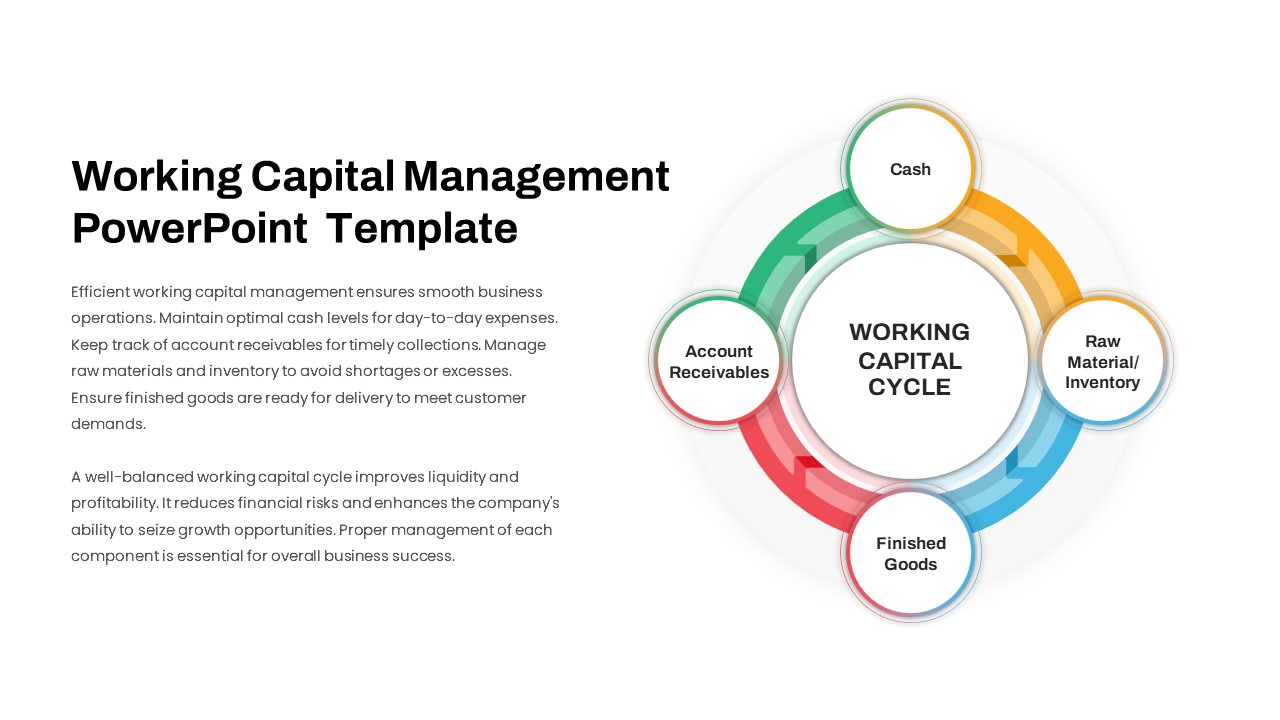
Working Capital Cycle Diagram Template for PowerPoint & Google Slides
Circular
Gartner Hype Cycle Adoption Curve Diagram Template for PowerPoint & Google Slides
Infographics
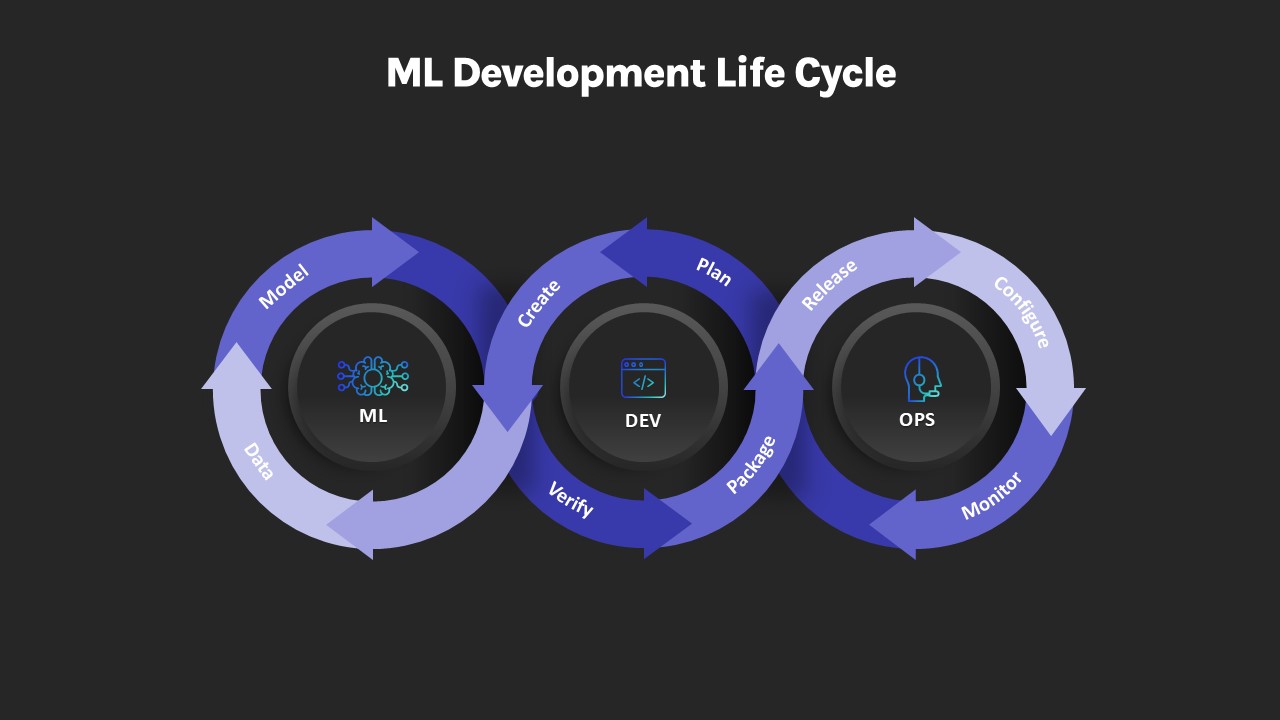
ML Development Life Cycle Diagram Template for PowerPoint & Google Slides
Machine Learning
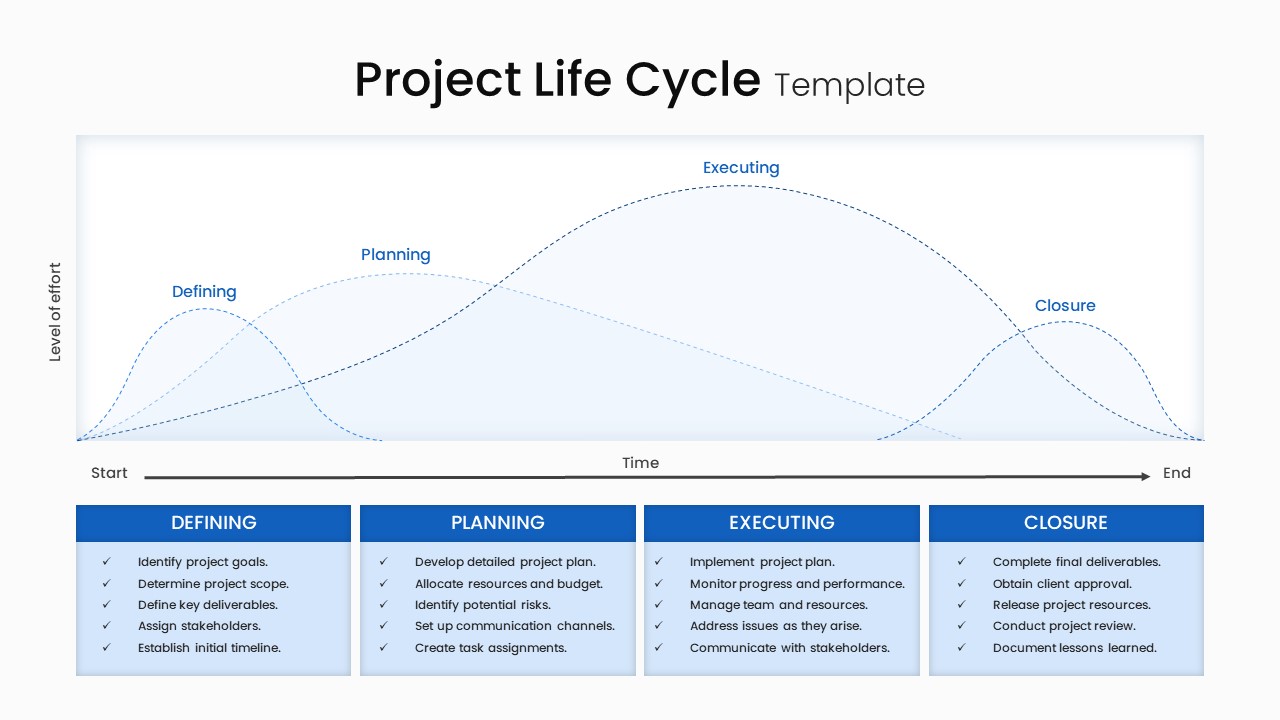
Project Life Cycle Workflow Diagram Template for PowerPoint & Google Slides
Process
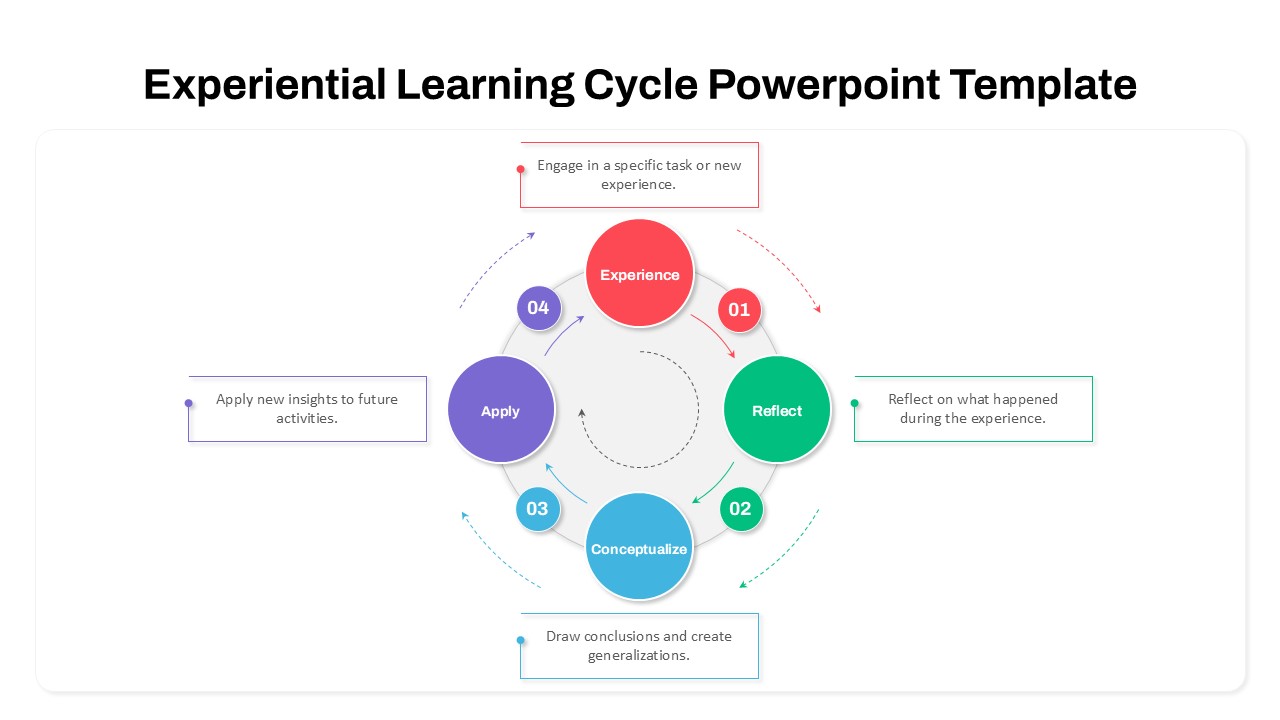
Experiential Learning Cycle Diagram Template for PowerPoint & Google Slides
Circular
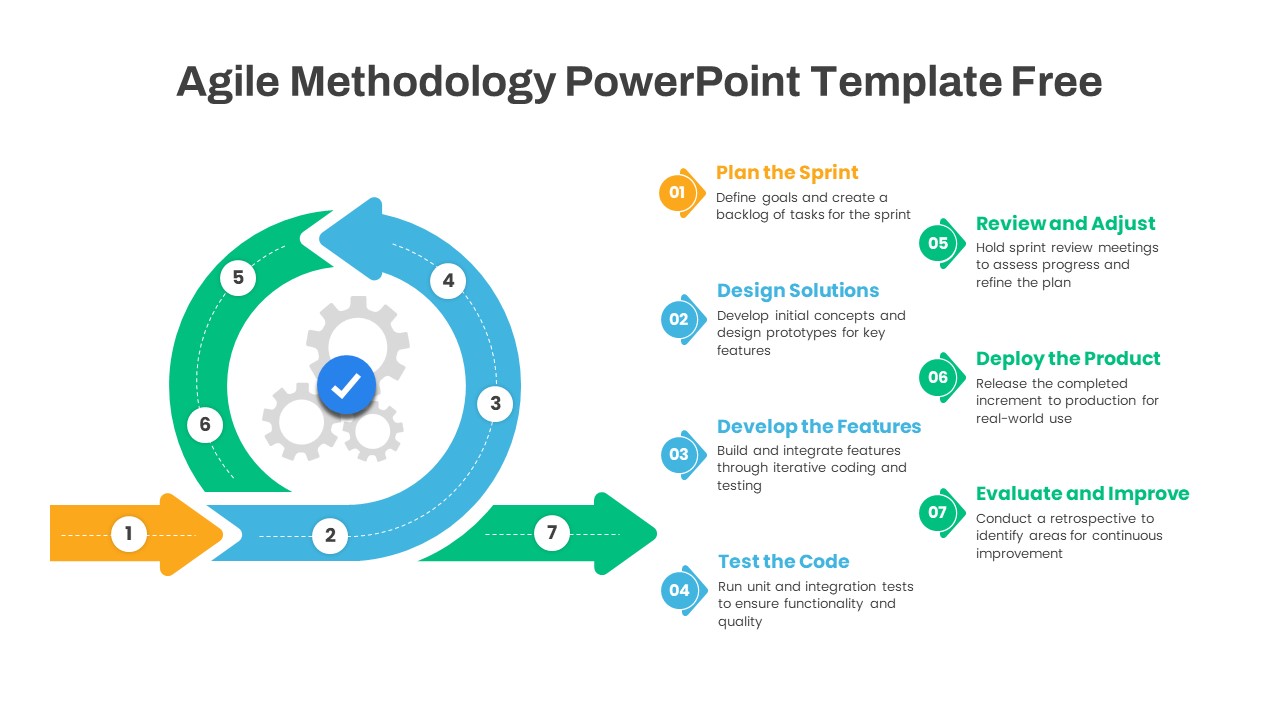
Agile Methodology Cycle Diagram Template for PowerPoint & Google Slides
Project
Free
Change Management Process Cycle Diagram Template for PowerPoint & Google Slides
Process
Flywheel Growth Cycle Diagram Template for PowerPoint & Google Slides
Circular
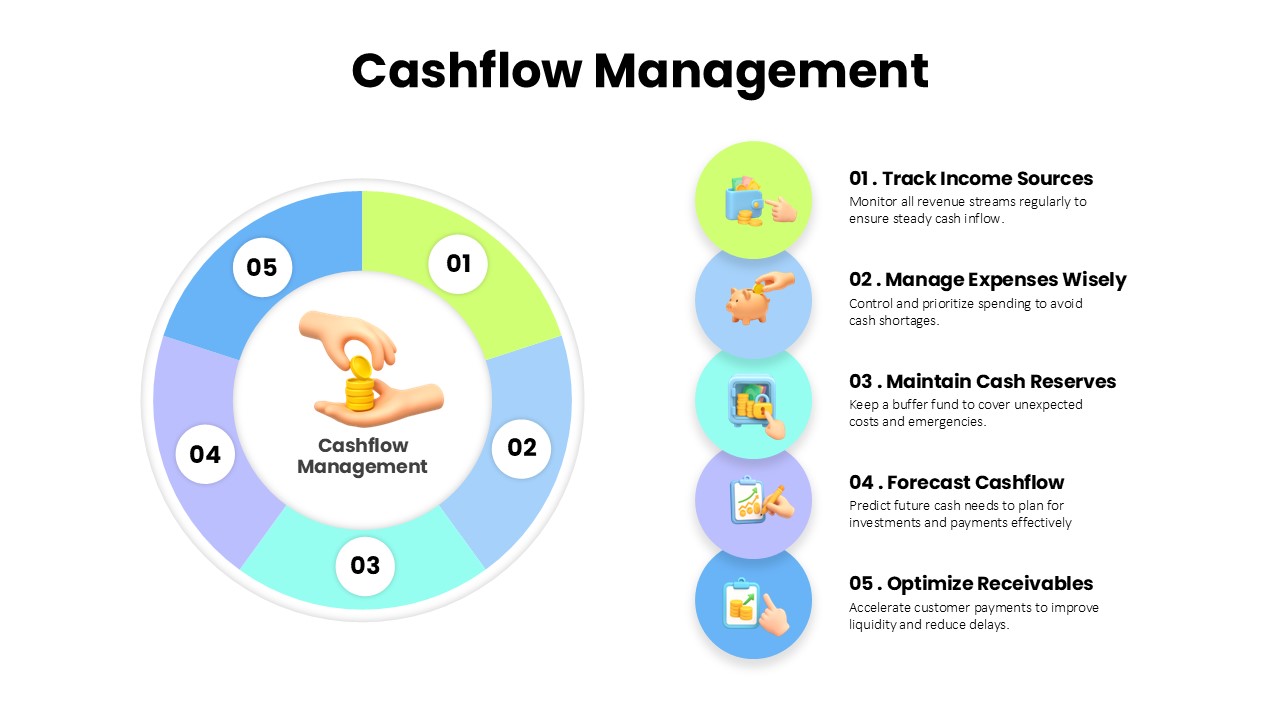
Cashflow Management Cycle Diagram Template for PowerPoint & Google Slides
Finance
Continuous Improvement Cycle Diagram Template for PowerPoint & Google Slides
Process
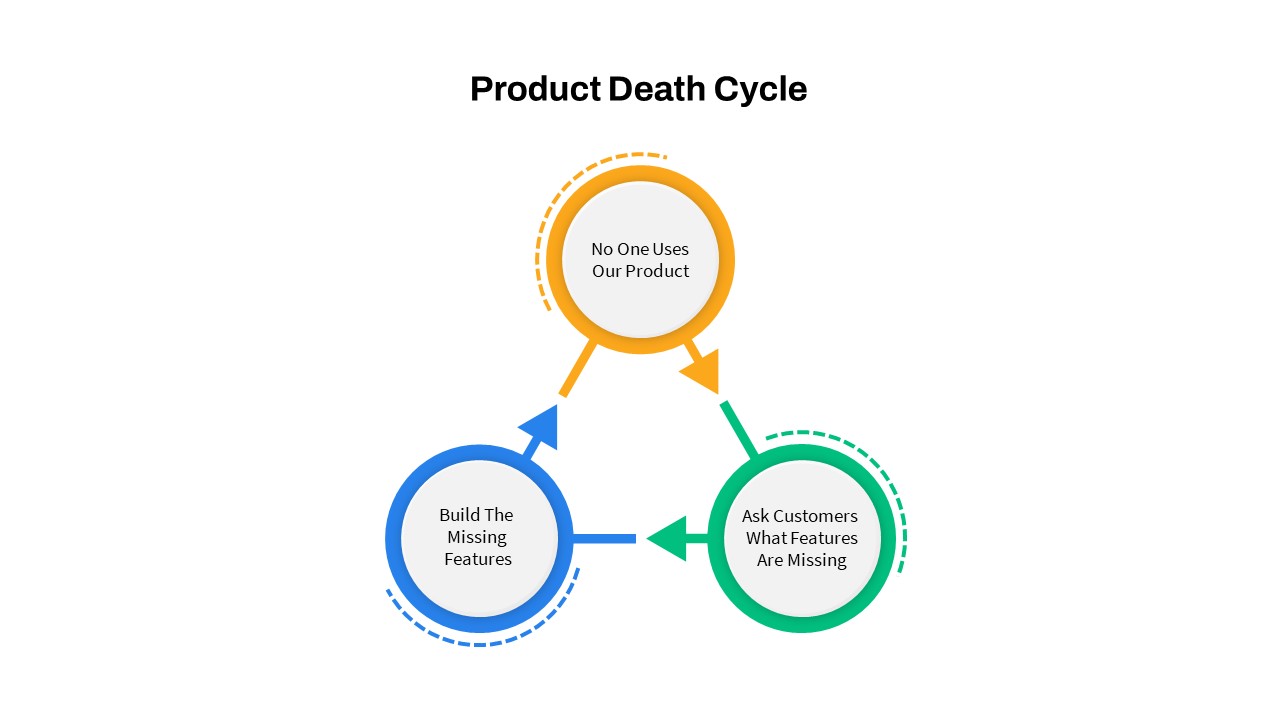
Product Death Cycle Diagram Slide for PowerPoint & Google Slides
Circular
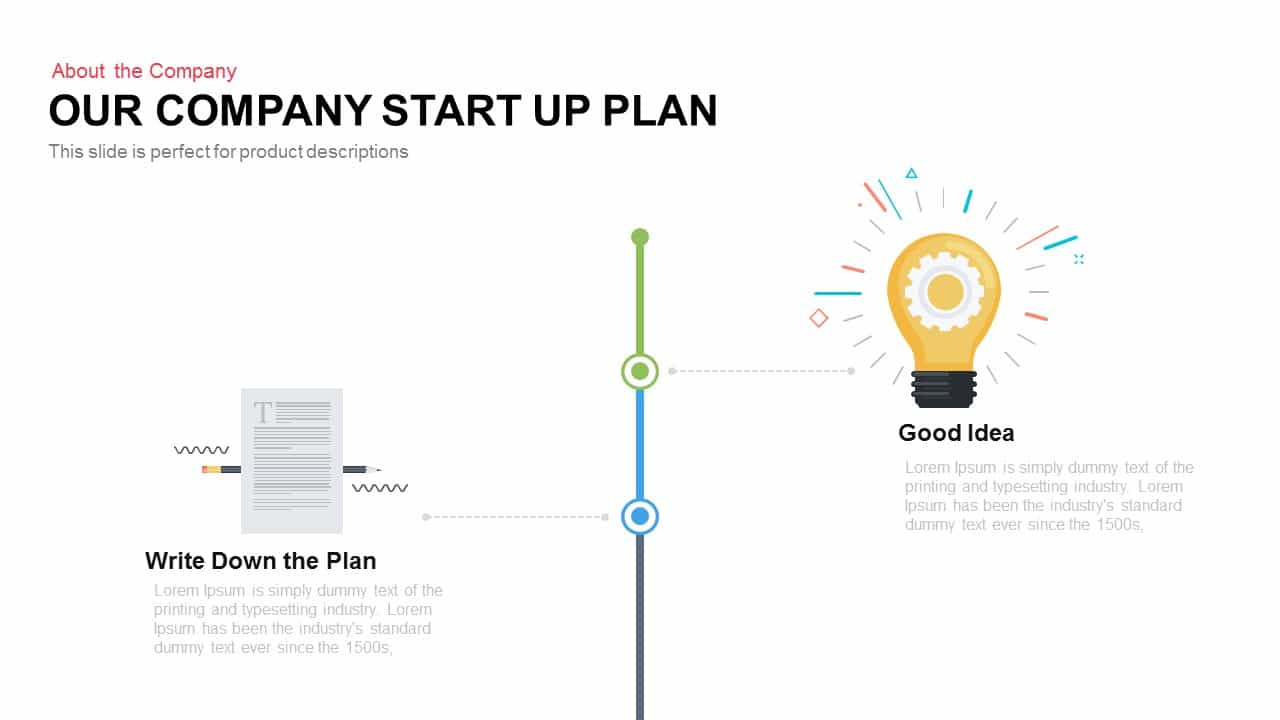
Company Startup Plan Timeline Slide Template for PowerPoint & Google Slides
Timeline
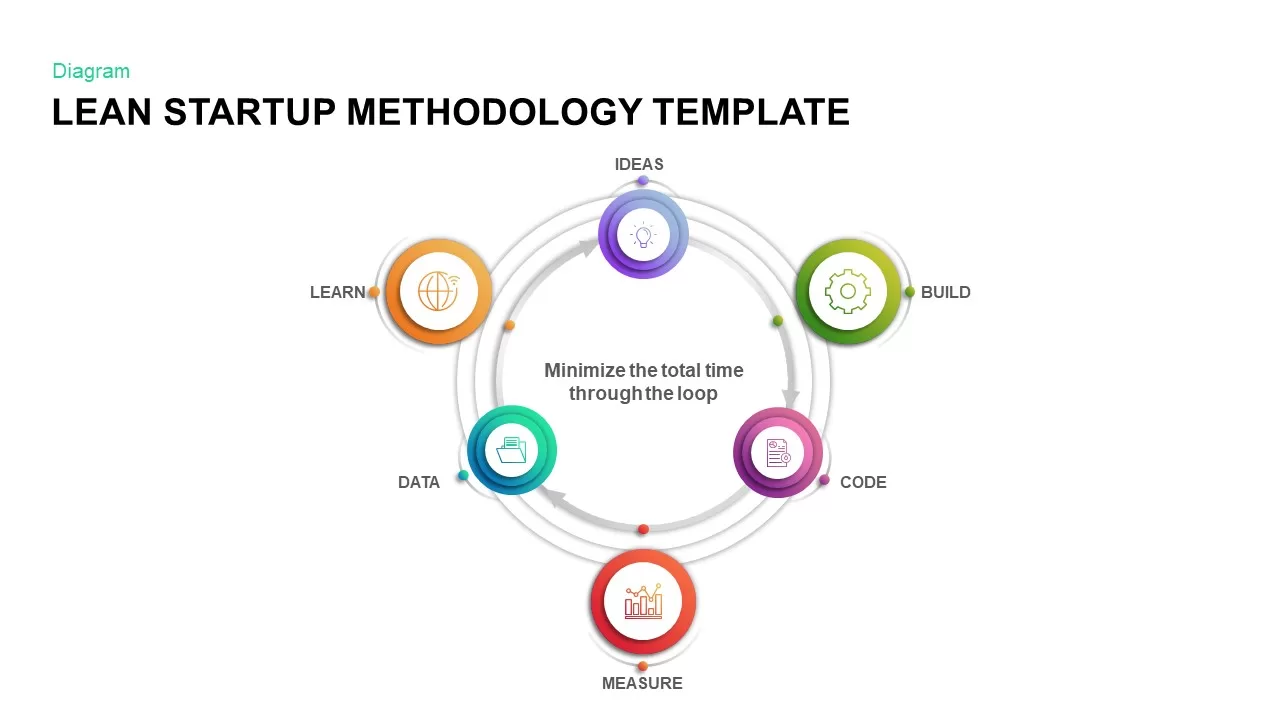
Lean Startup Methodology Infographic Template for PowerPoint & Google Slides
Circular

Modern Gradient Startup Pitch Deck Template for PowerPoint & Google Slides
Pitch Deck
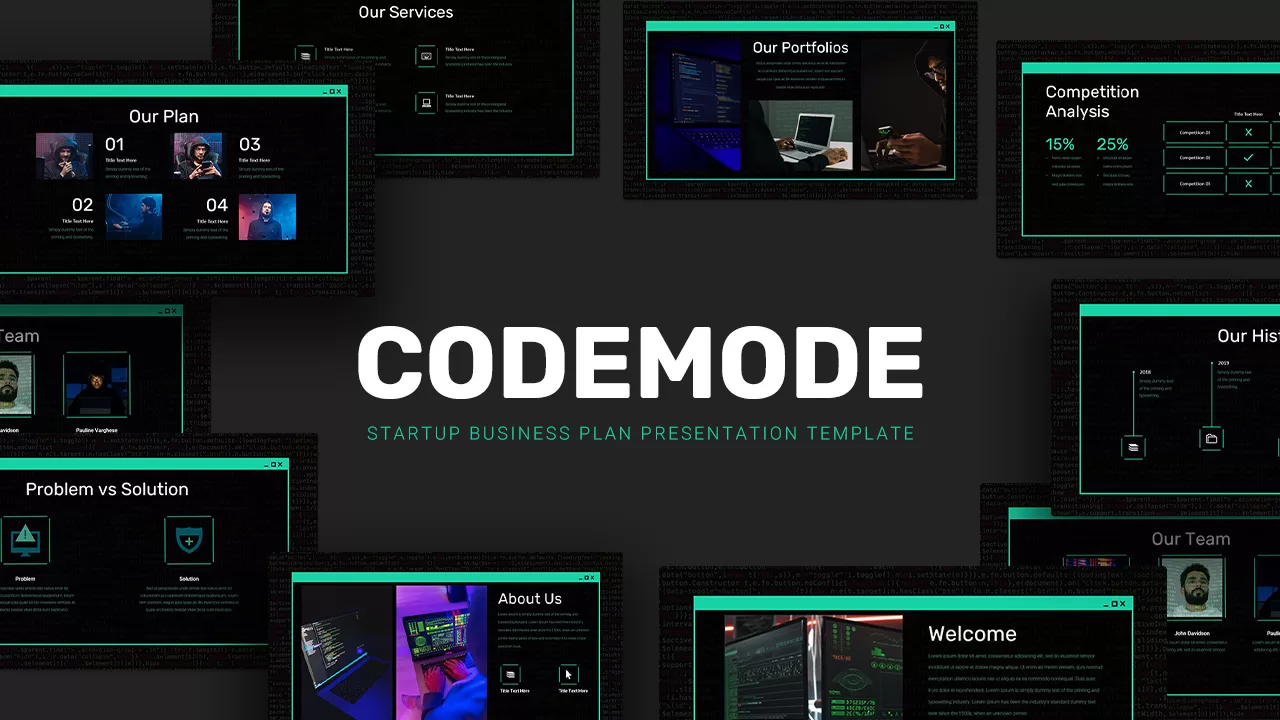
Dark Tech Startup Business Plan Deck Template for PowerPoint & Google Slides
Software Development
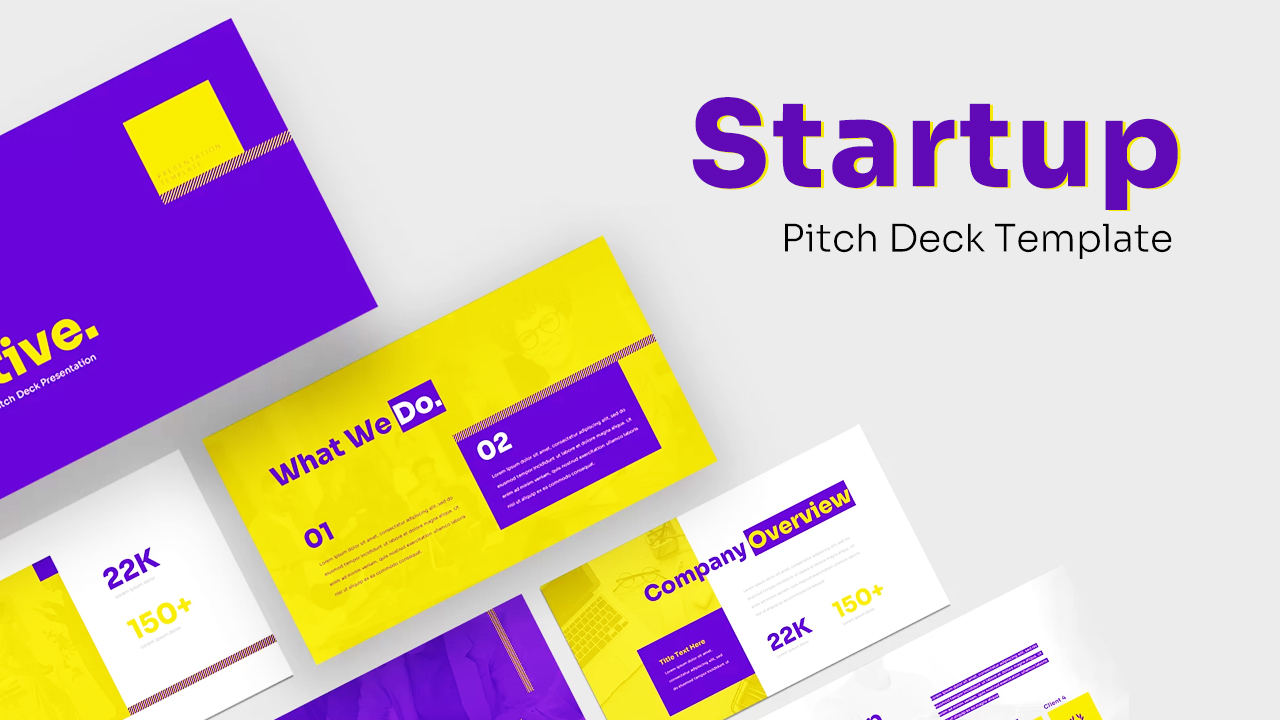
Bold Vibrant Startup Pitch Deck Template for PowerPoint & Google Slides
Pitch Deck
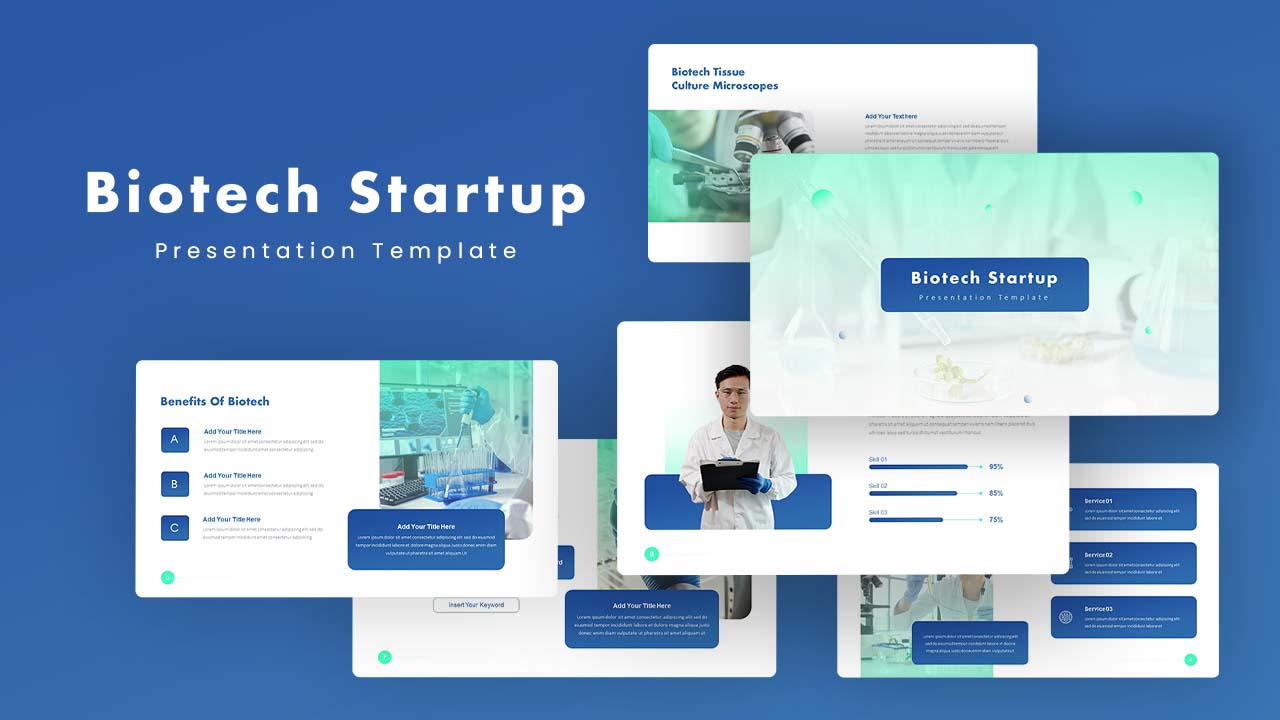
Biotech Startup Profile Pitch Deck Template for PowerPoint & Google Slides
Pitch Deck
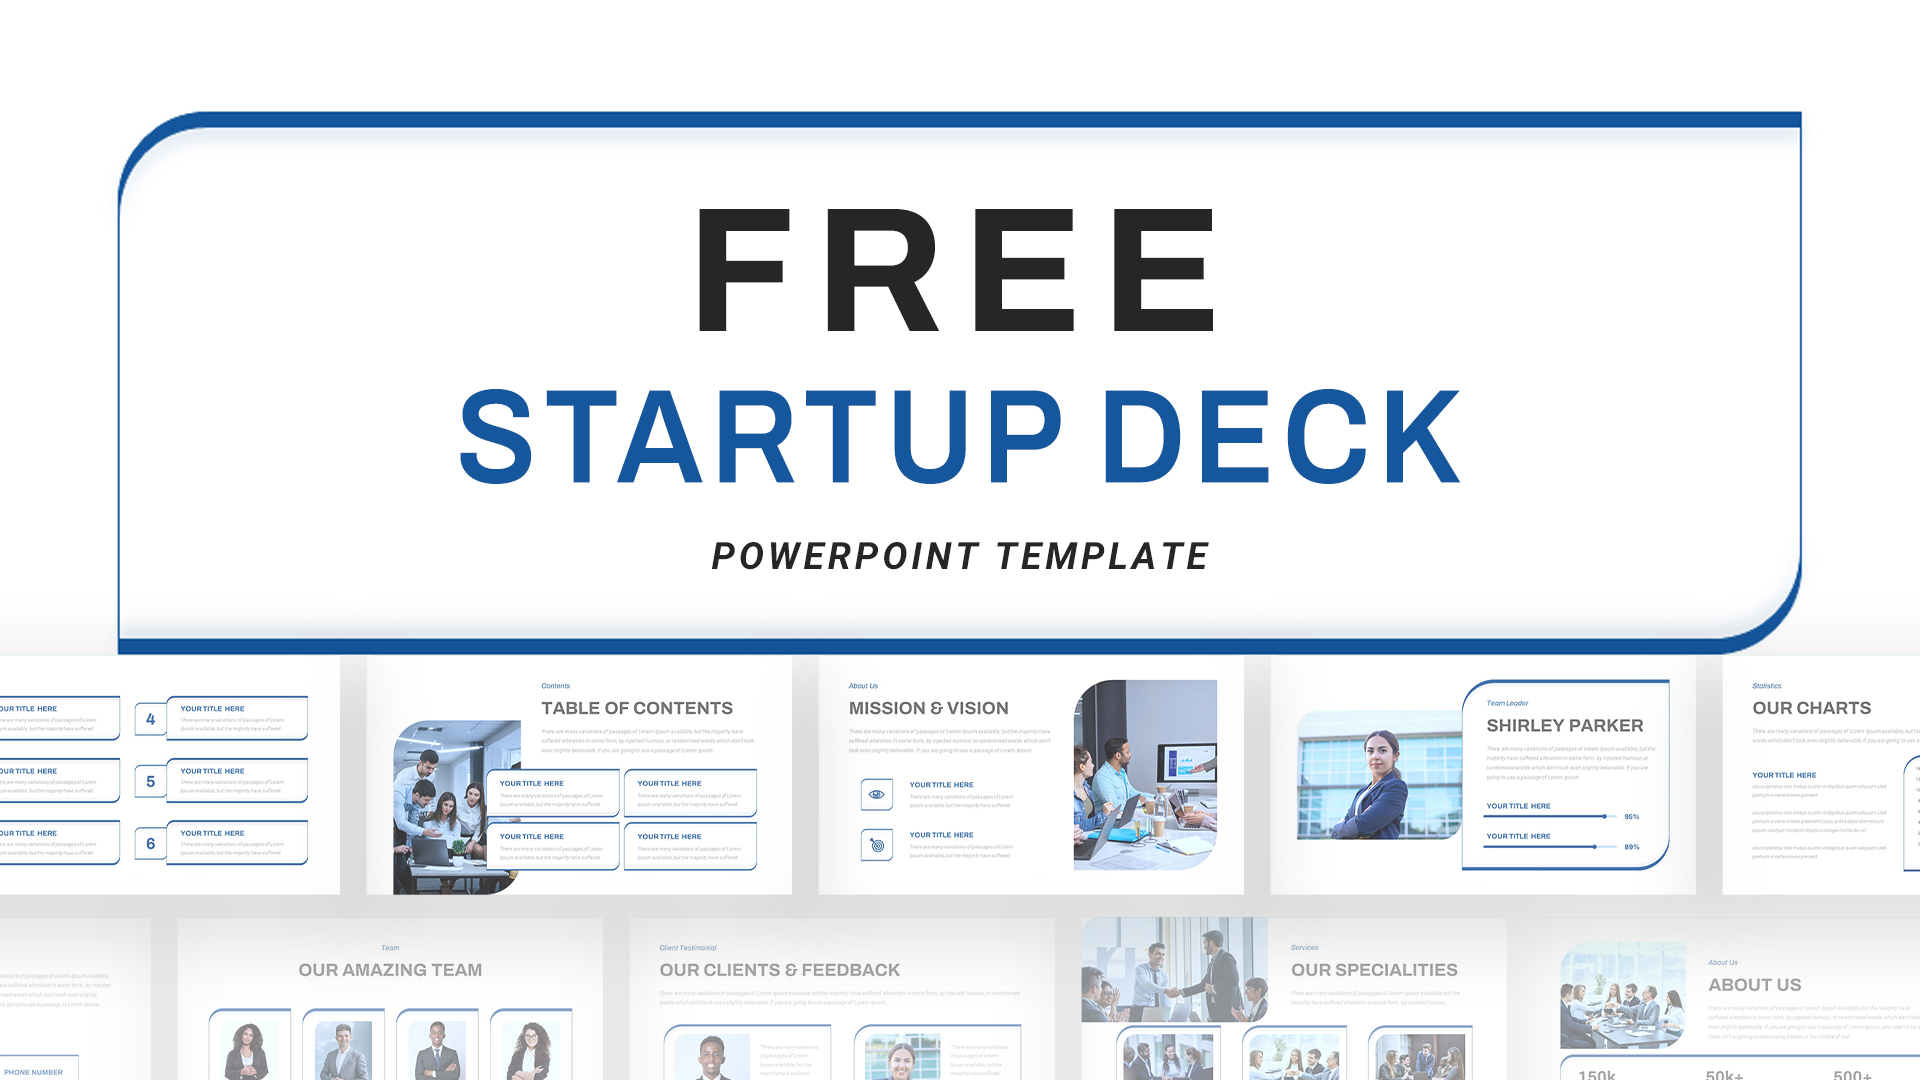
Free Startup Pitch Deck Template for PowerPoint & Google Slides
Pitch Deck
Versatile Startup Roadmap Slide Pack Template for PowerPoint & Google Slides
Timeline
AI Startup Pitch Deck Presentation Template for PowerPoint & Google Slides
Pitch Deck
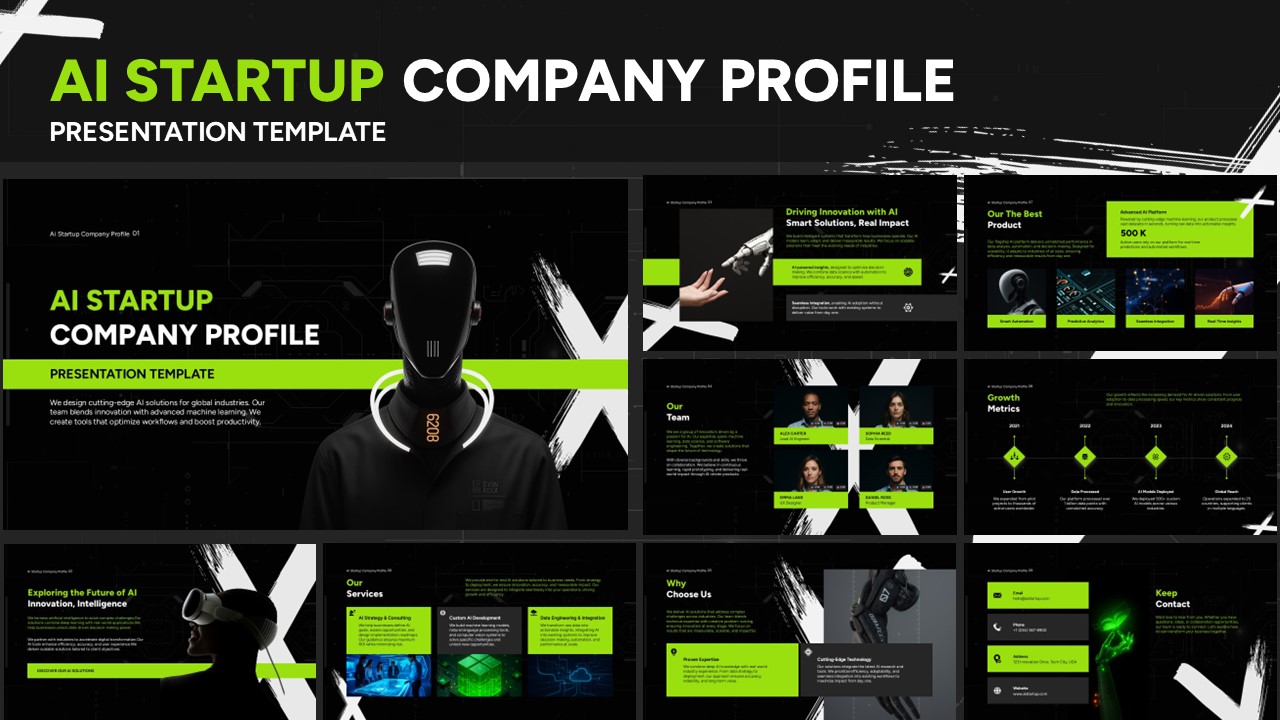
AI Startup Company Profile Template for PowerPoint & Google Slides
Company Profile
Startup Executive Summary Template for PowerPoint & Google Slides
Business Report
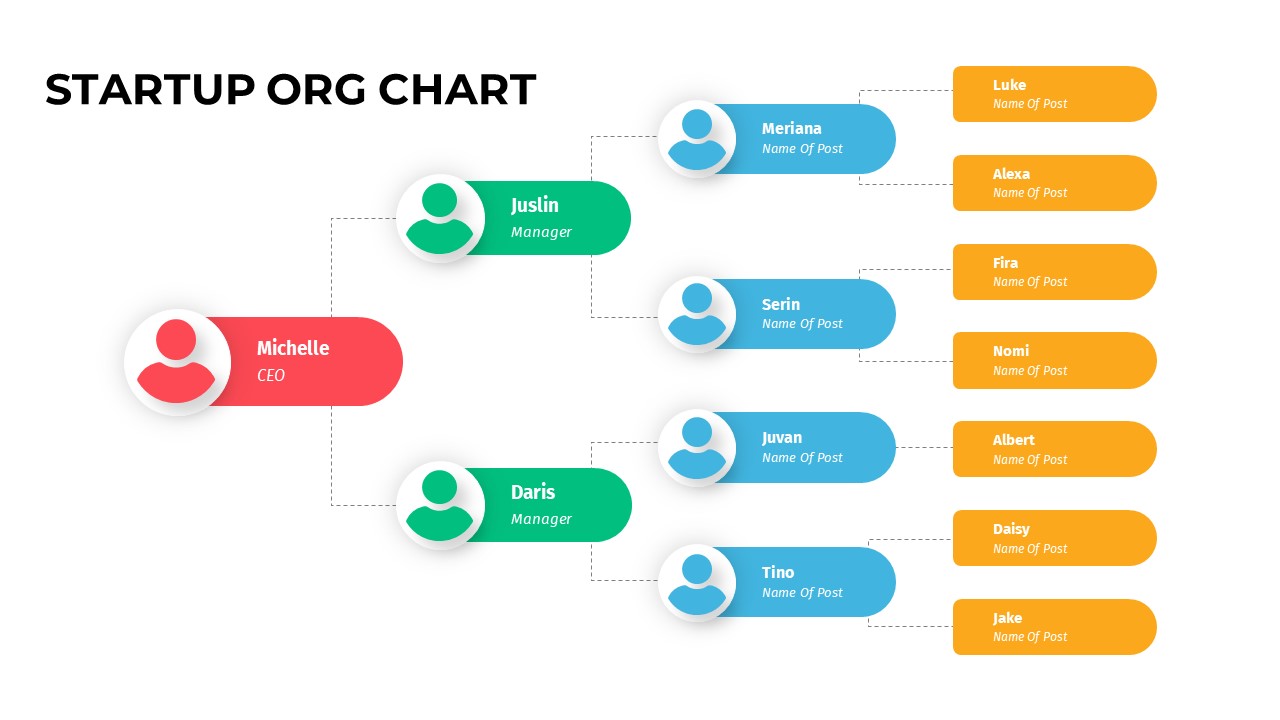
Color-Coded Startup Org Chart Slide for PowerPoint & Google Slides
Org Chart
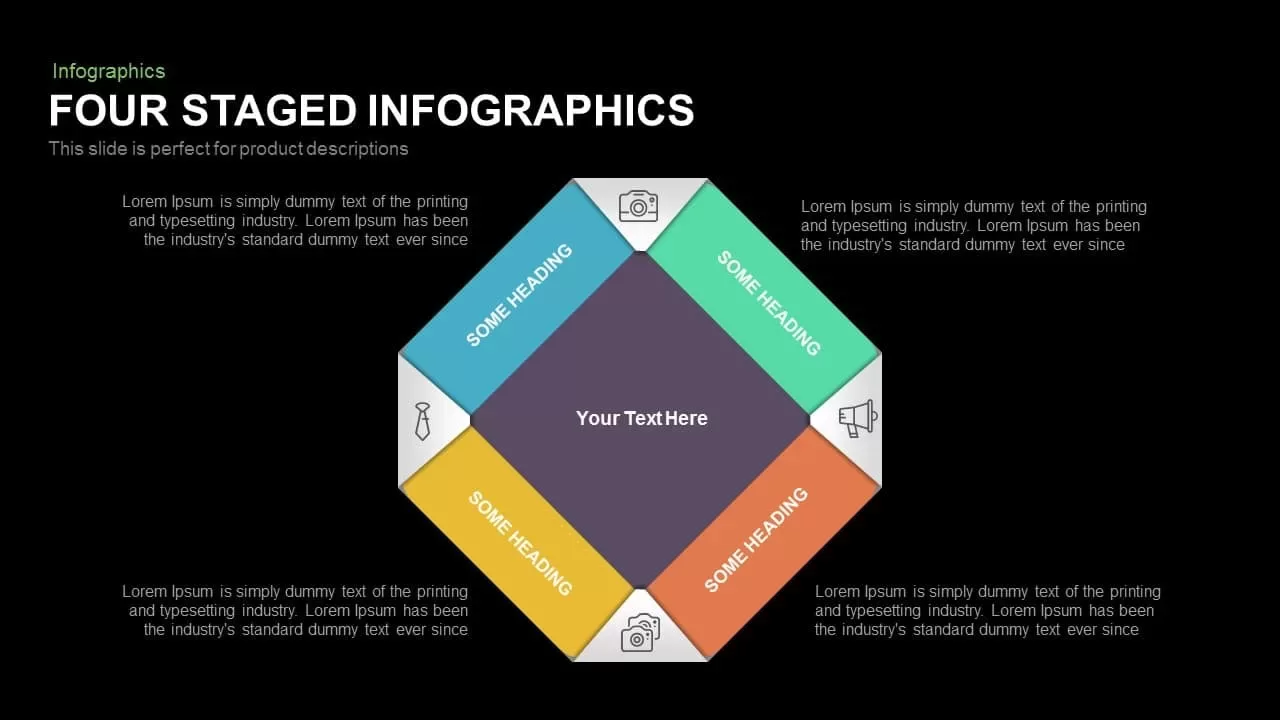
Colorful Four-Stage Infographic Process Template for PowerPoint & Google Slides
Process
Modern Colorful SWOT Quadrant Analysis Template for PowerPoint & Google Slides
SWOT
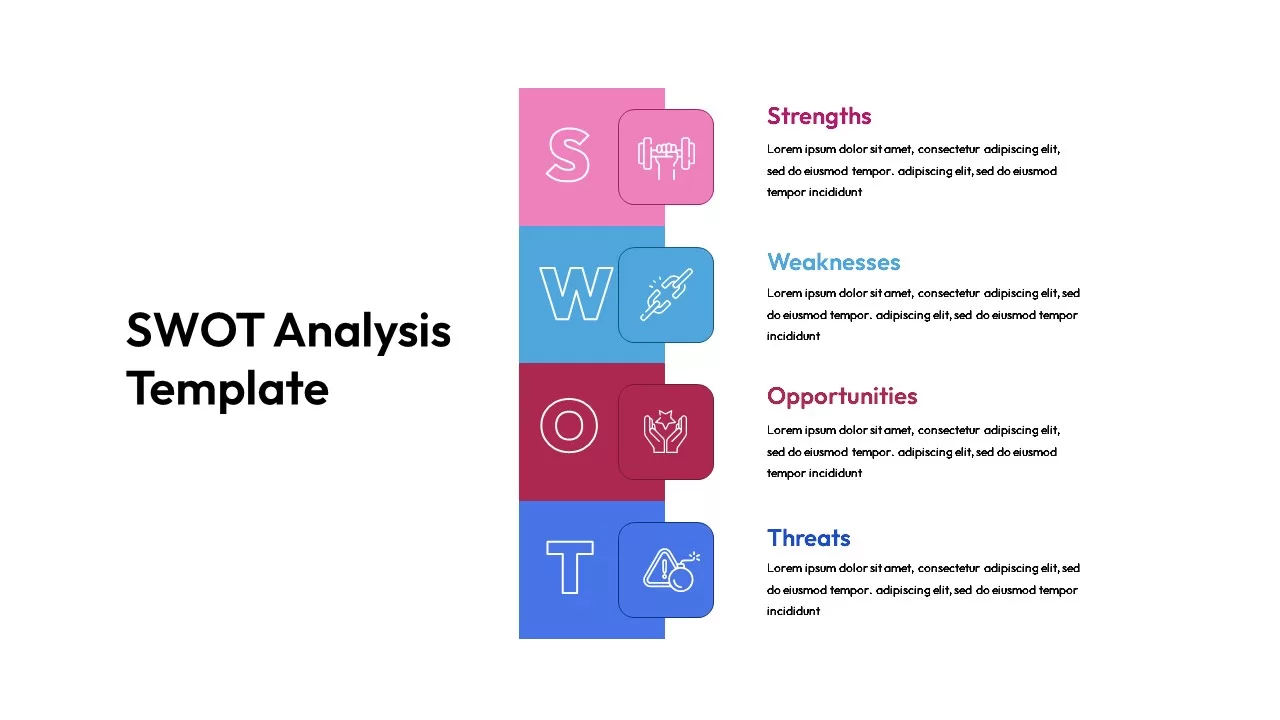
Colorful Vertical SWOT Analysis Layout Template for PowerPoint & Google Slides
SWOT
Colorful Mind Map Template for PowerPoint & Google Slides
Mind Maps
Colorful Process Flow Infographics Template for PowerPoint & Google Slides
Process
Colorful Nursing Presentation Deck Template for PowerPoint & Google Slides
Nursing
Colorful Project Status Dashboard Template for PowerPoint & Google Slides
Project Status
4 Step Vibrant Colorful Methodology Template for PowerPoint & Google Slides
Process
Colorful Hub-and-Spoke Infographic Template for PowerPoint & Google Slides
Circular
Colorful Weekly Schedule Slide Deck Template for PowerPoint & Google Slides
Agenda
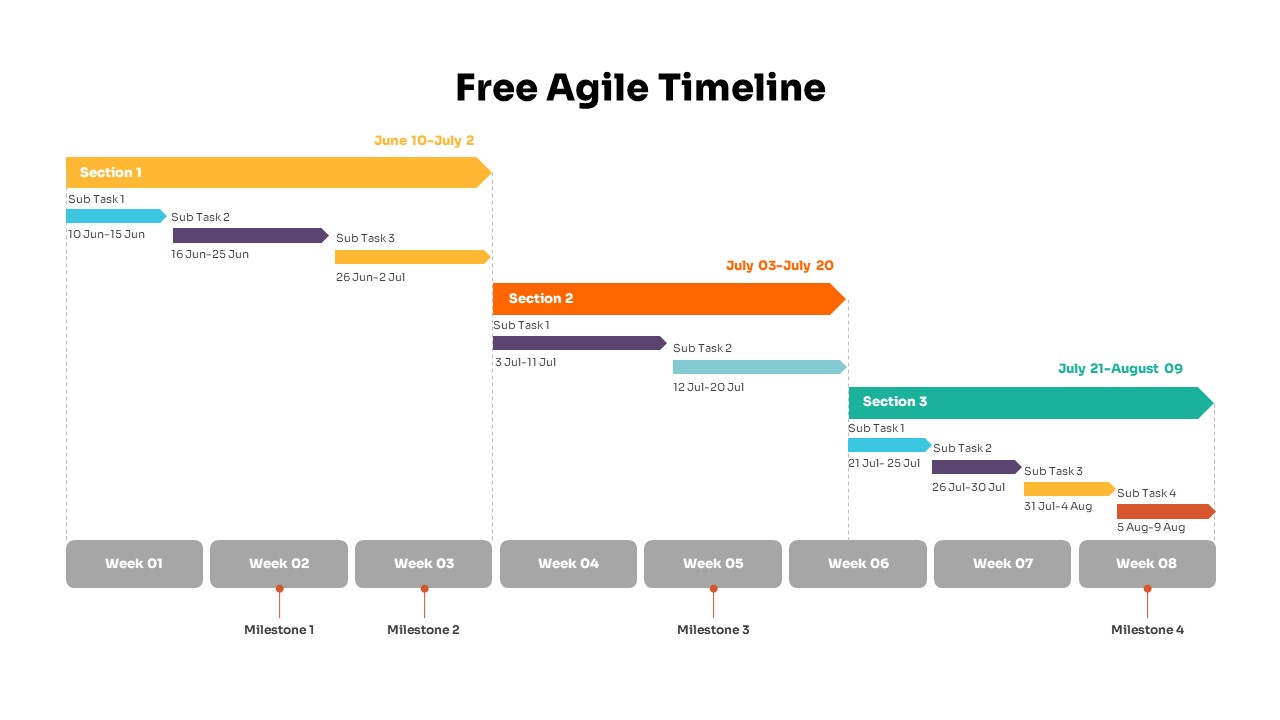
Colorful Agile Timeline Infographic Template for PowerPoint & Google Slides
Timeline
Free
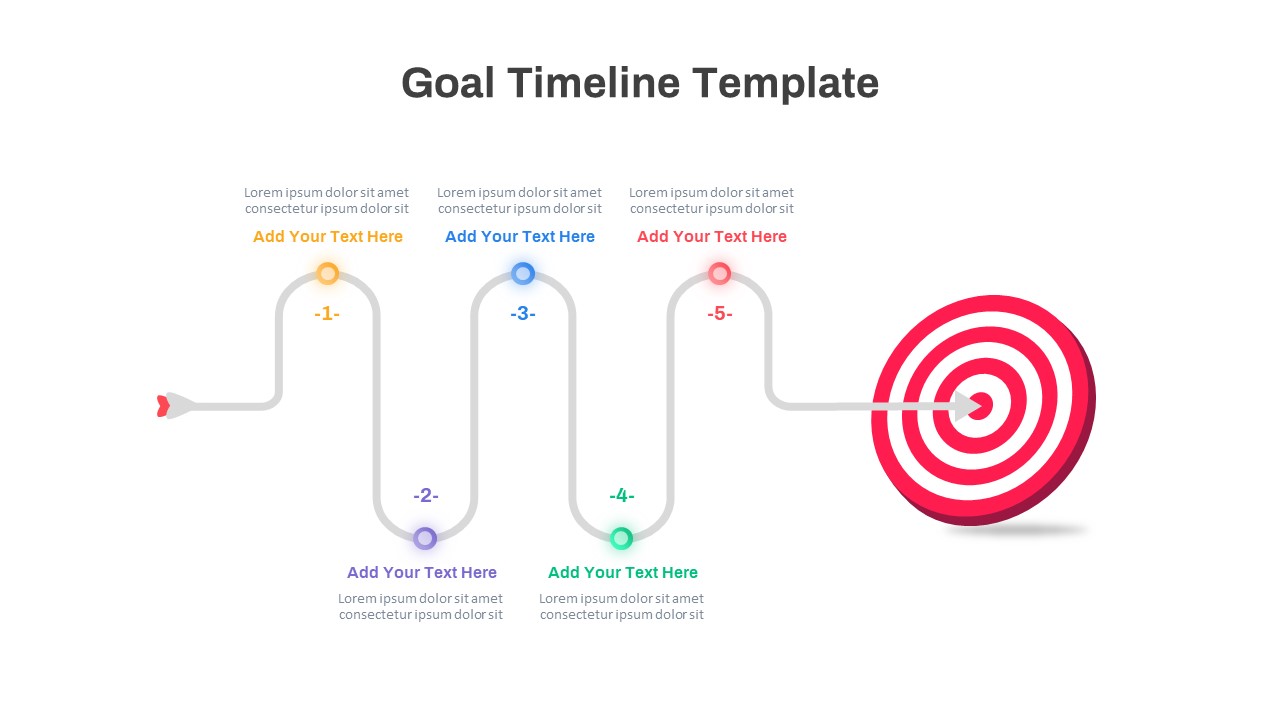
Colorful Five-Step Goal Timeline Template for PowerPoint & Google Slides
Timeline
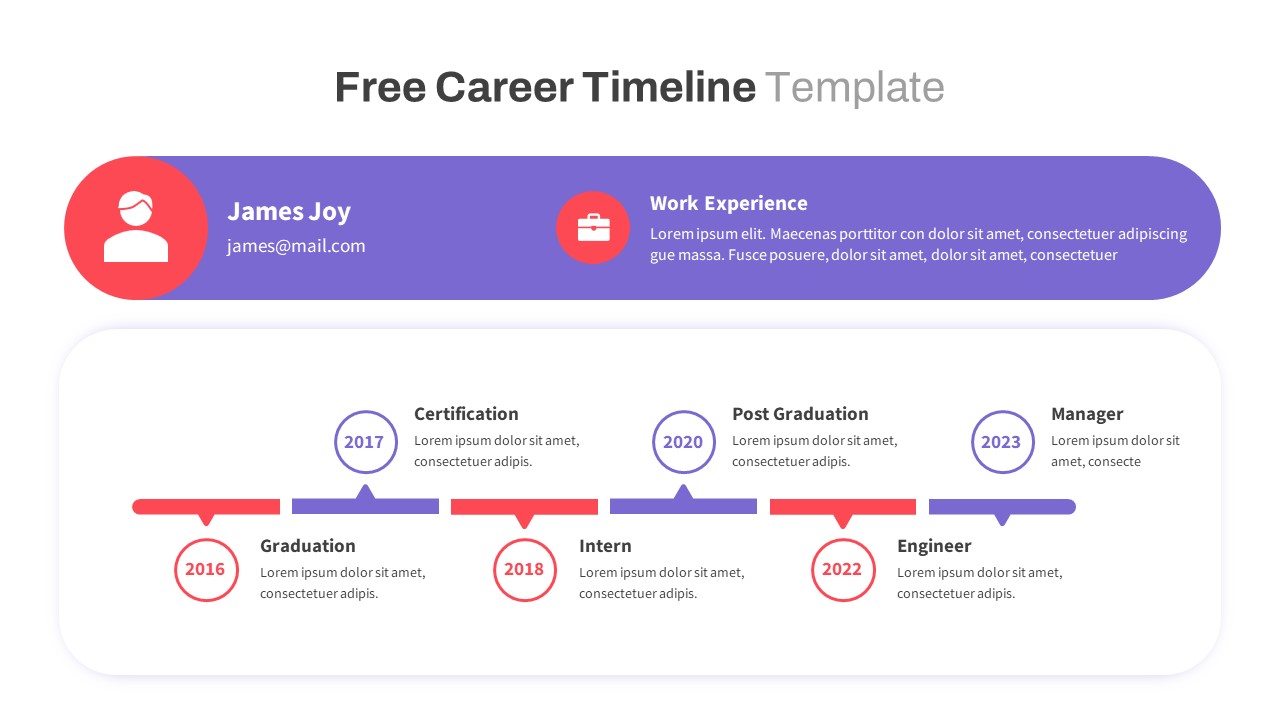
Free Colorful Career Timeline Resume Slide Template for PowerPoint & Google Slides
Timeline
Free
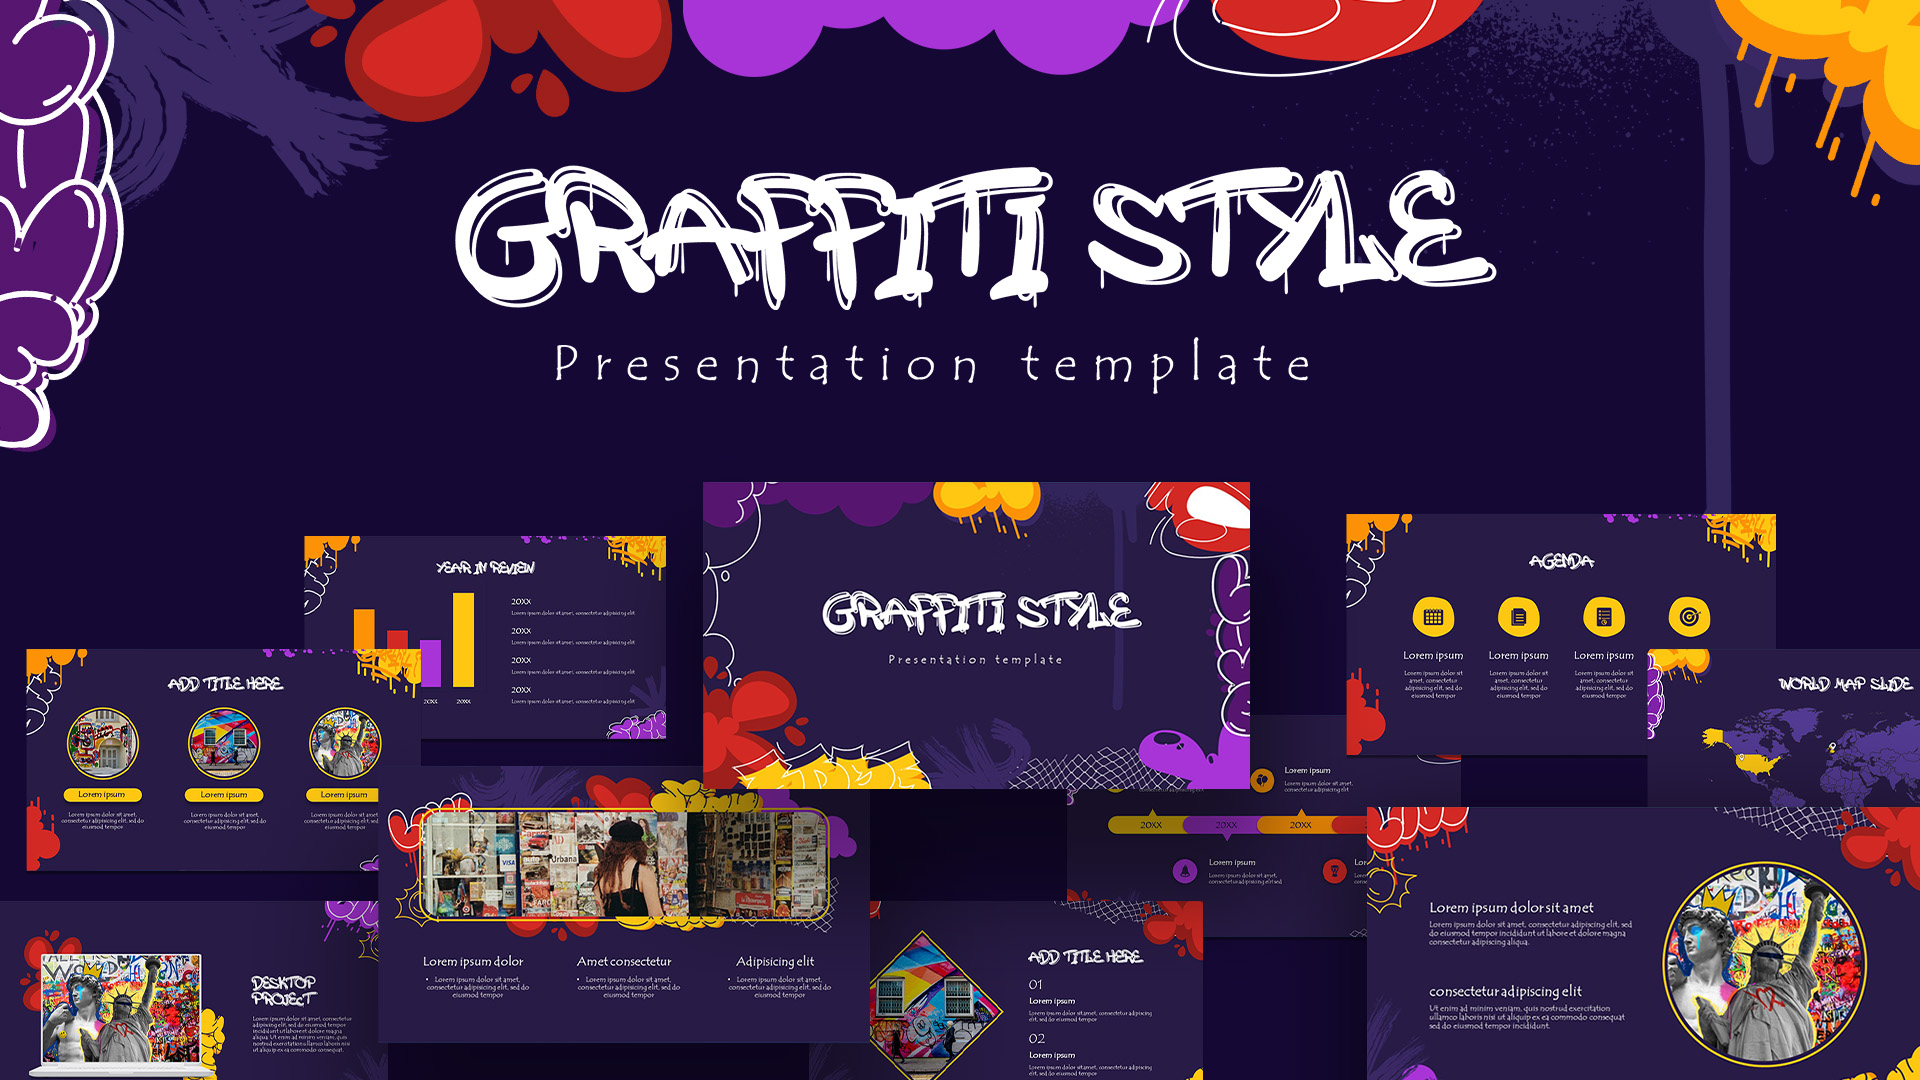
Free Graffiti Style Colorful Presentation Template for PowerPoint & Google Slides
Pitch Deck
Free
Colorful Education Roadmap Workshop Timeline Template for PowerPoint & Google Slides
Roadmap

Free Colorful Infographic Slide Pack Template for PowerPoint & Google Slides
Roadmap
Free
Colorful SWOT Analysis Quadrant Template for PowerPoint & Google Slides
SWOT
Colorful Four-Column Table Layout Template for PowerPoint & Google Slides
Table
Colorful Business Data Comparison Table Template for PowerPoint & Google Slides
Table