Change Kaleidoscope Process Diagram Template for PowerPoint & Google Slides

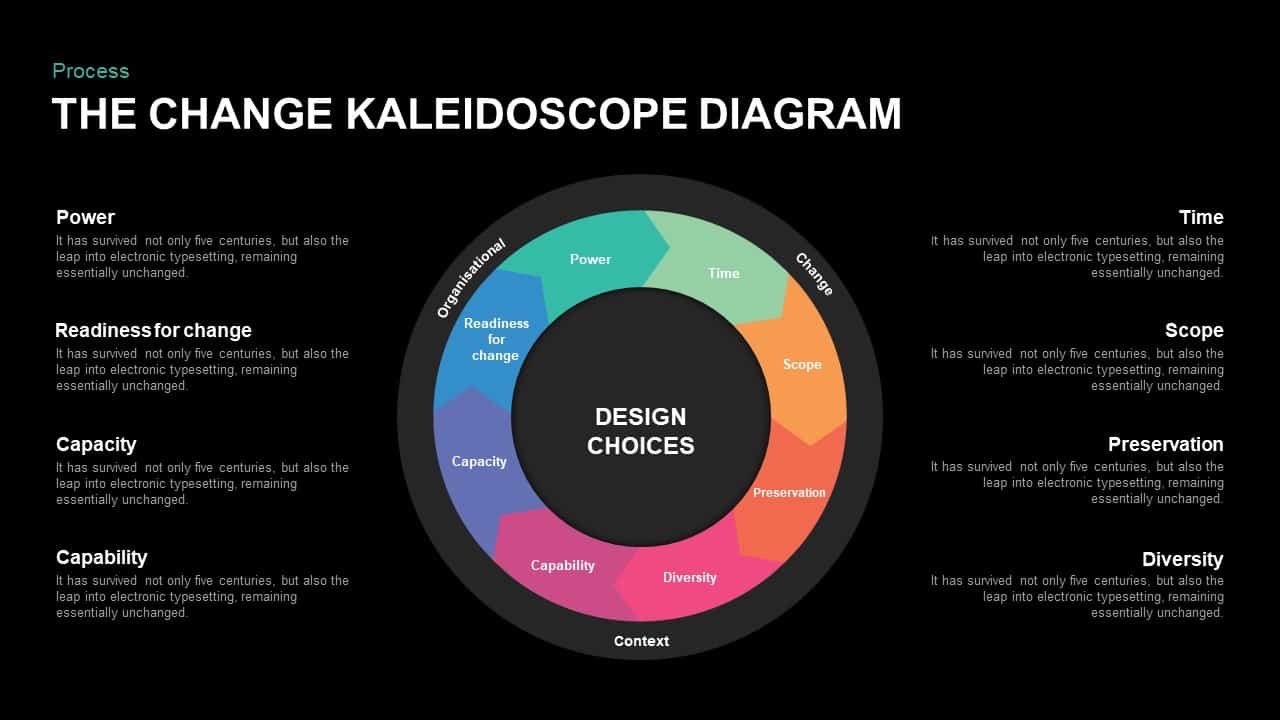
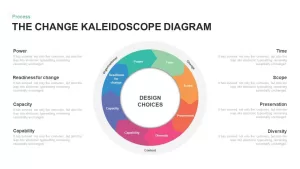

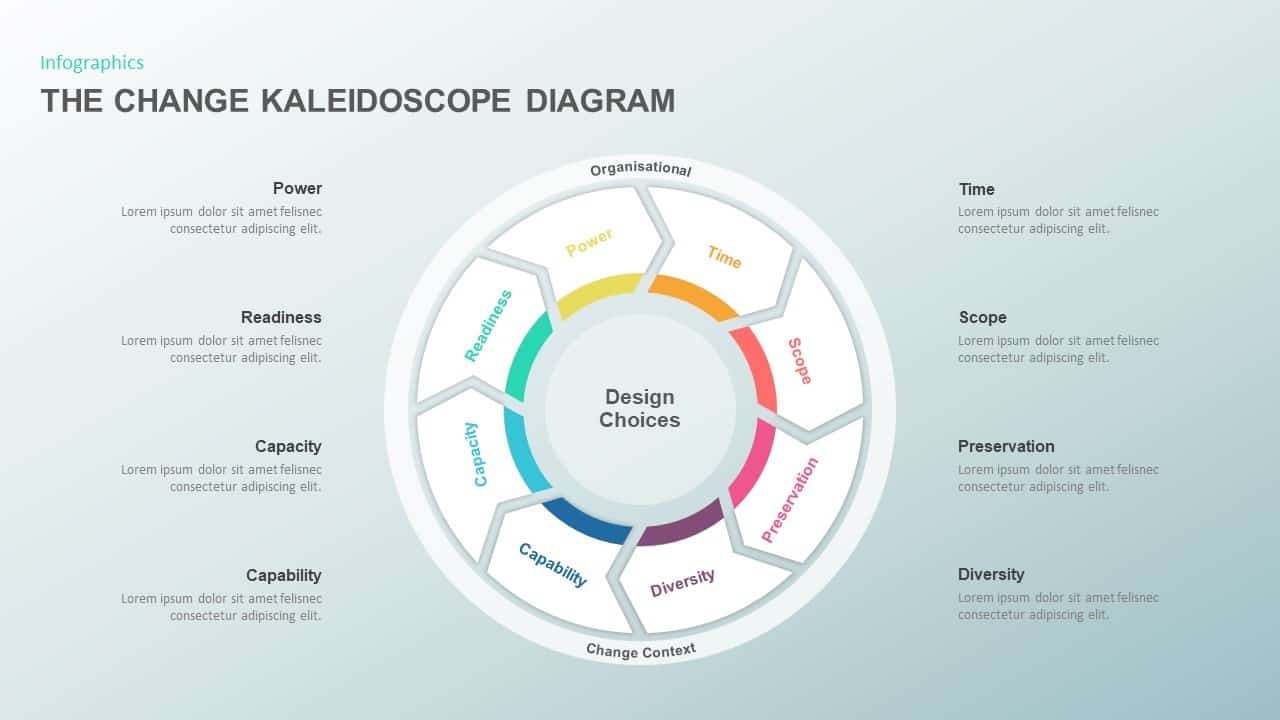
This dynamic kaleidoscope-style diagram brings clarity to complex change and design decisions by arranging eight gradient-colored segments in a seamless circular flow. Each petal-shaped segment represents a core dimension—Power, Time, Scope, Preservation, Diversity, Capability, Capacity, and Readiness for Change—converging on a central “Design Choices” hub. The subtle outer ring labels (Organisational, Change, Context) reinforce the broader framework, while the eight inner labels anchor individual process elements. Viewers can instantly grasp both the macro view and granular factors driving transformation initiatives.
Built entirely with editable vector shapes and master-slide integration, this template empowers you to adapt every component in seconds. Change segment colors or gradient stops to match your brand palette, swap text labels or reposition petals to fit specific methodologies, and adjust the central placeholder with custom icons or titles. The flexible layout supports adding or removing segments, resizing the outer and inner rings, or overlaying data callouts to highlight priority items—making it ideal for evolving project requirements.
The flat design aesthetic pairs clean sans-serif typography with gentle drop shadows, ensuring legibility and modern appeal on screens of any size. Ample white space around the diagram maintains focus, while the gradient transitions lend visual depth without clutter. Use this slide to guide stakeholders through governance frameworks, risk-assessment stages, or capability-building roadmaps, presenting eight interconnected factors in an engaging, memorable format.
Fully compatible with both PowerPoint and Google Slides, the template preserves formatting integrity and simplifies collaborative editing. Whether you’re leading change-management workshops, strategic planning sessions, or executive briefings, leverage this kaleidoscope diagram to illustrate interdependencies, align cross-functional teams, and drive consensus on critical design choices.
Who is it for
Change managers, organizational development consultants, and project leaders will find this diagram invaluable for mapping transformation frameworks. Business strategists, portfolio managers, and workshop facilitators can leverage the visual flow to communicate complex dependencies and decision criteria.
Other Uses
Beyond change management, repurpose this slide for product design sprints, innovation frameworks, or risk-assessment matrices. Customize segment labels to represent market drivers, performance KPIs, or stakeholder priorities, and extend the diagram to suit twelve or more process stages.
Login to download this file

Item ID
SB01126
Related Templates

The Change Kaleidoscope Diagram template for PowerPoint & Google Slides
Pitch Deck
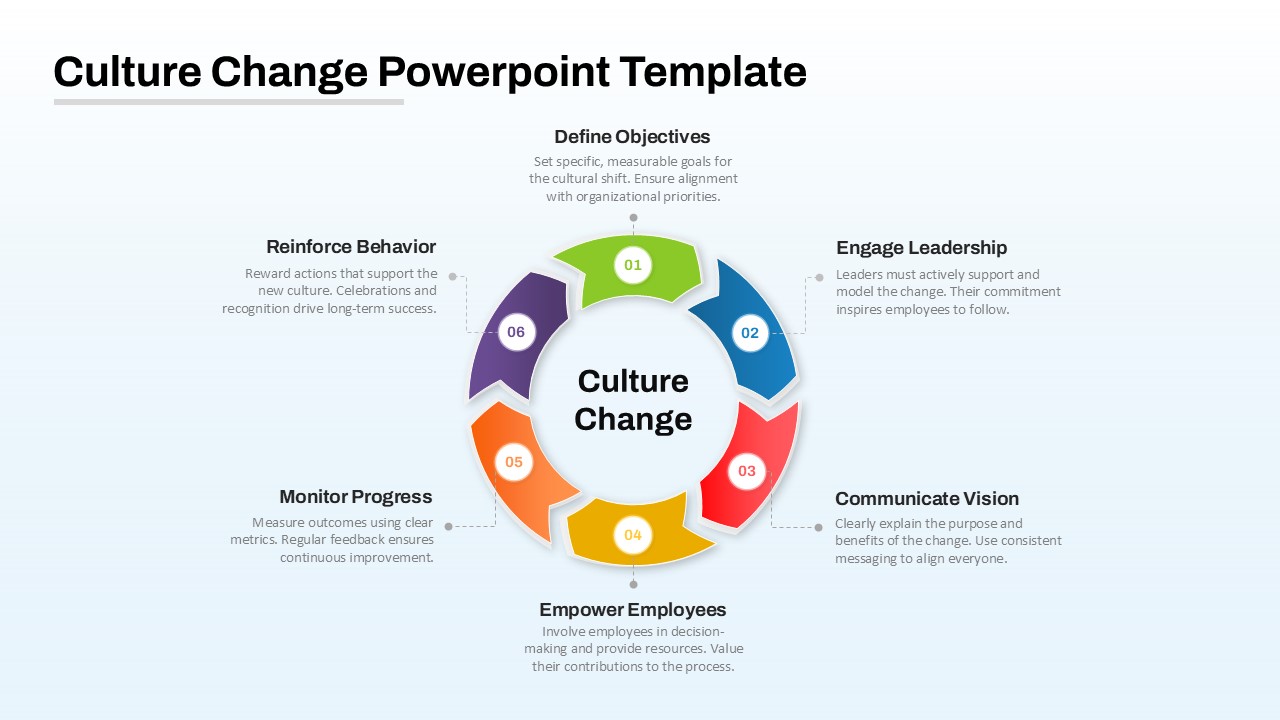
Culture Change Circular Process Diagram Template for PowerPoint & Google Slides
Process
Change Management Process Cycle Diagram Template for PowerPoint & Google Slides
Process
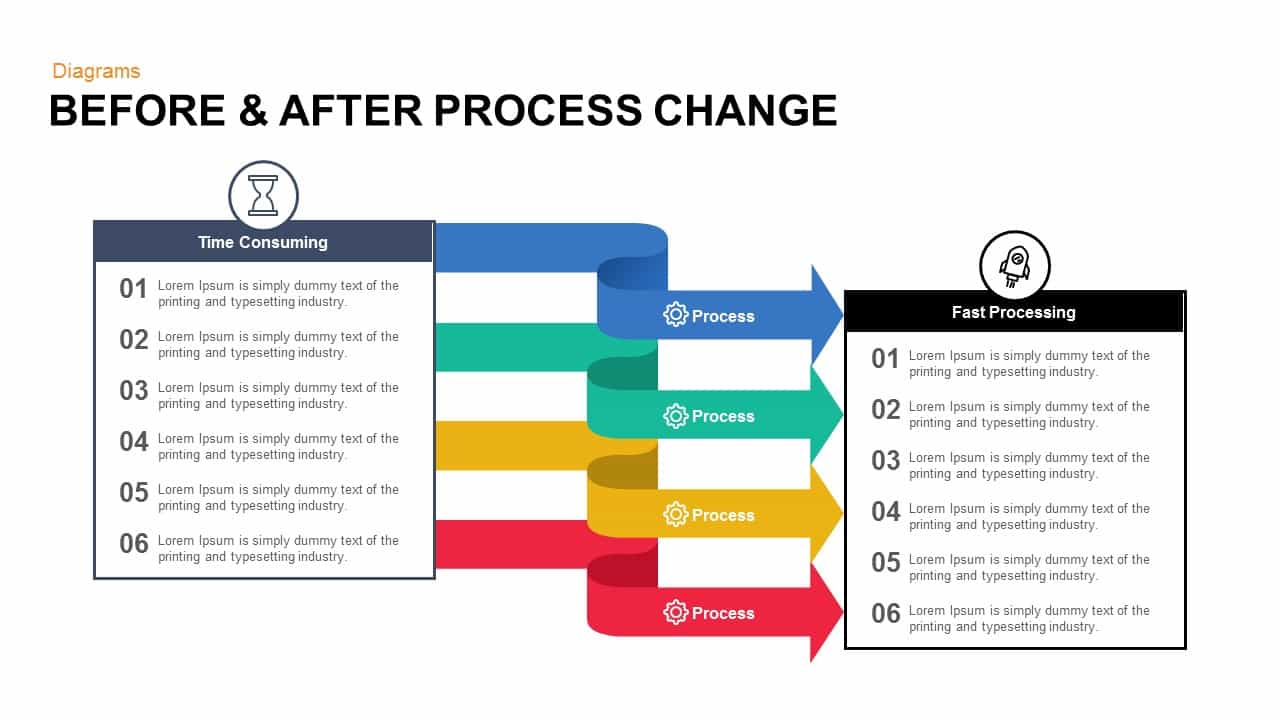
Before & After Process Change template for PowerPoint & Google Slides
Process
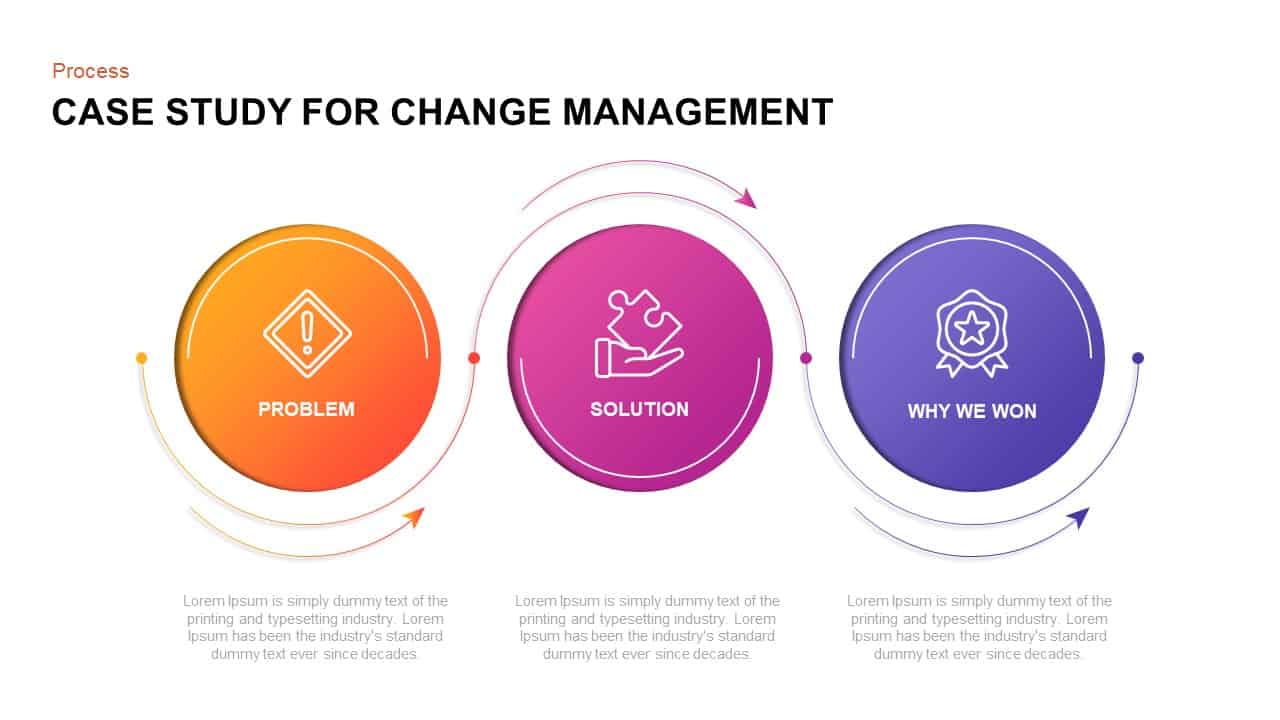
Case Study for Change Management Process Template for PowerPoint & Google Slides
Process
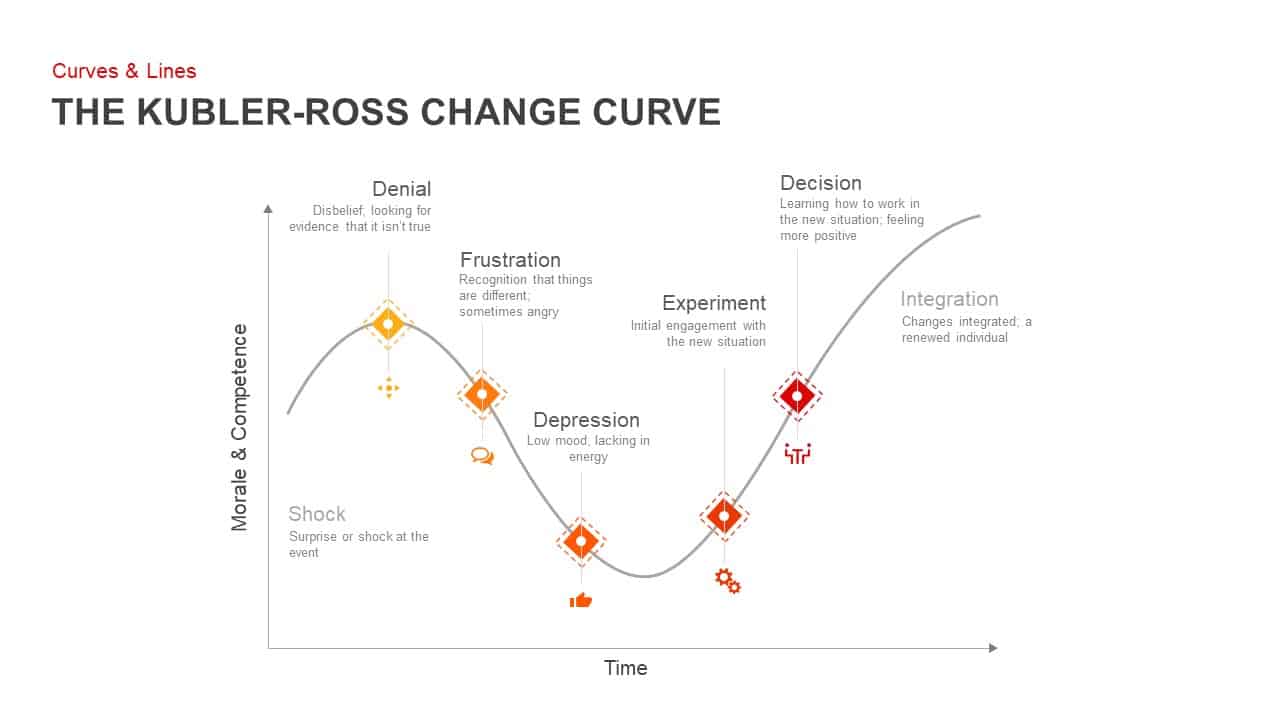
Kubler-Ross Change Curve Diagram Template for PowerPoint & Google Slides
Timeline

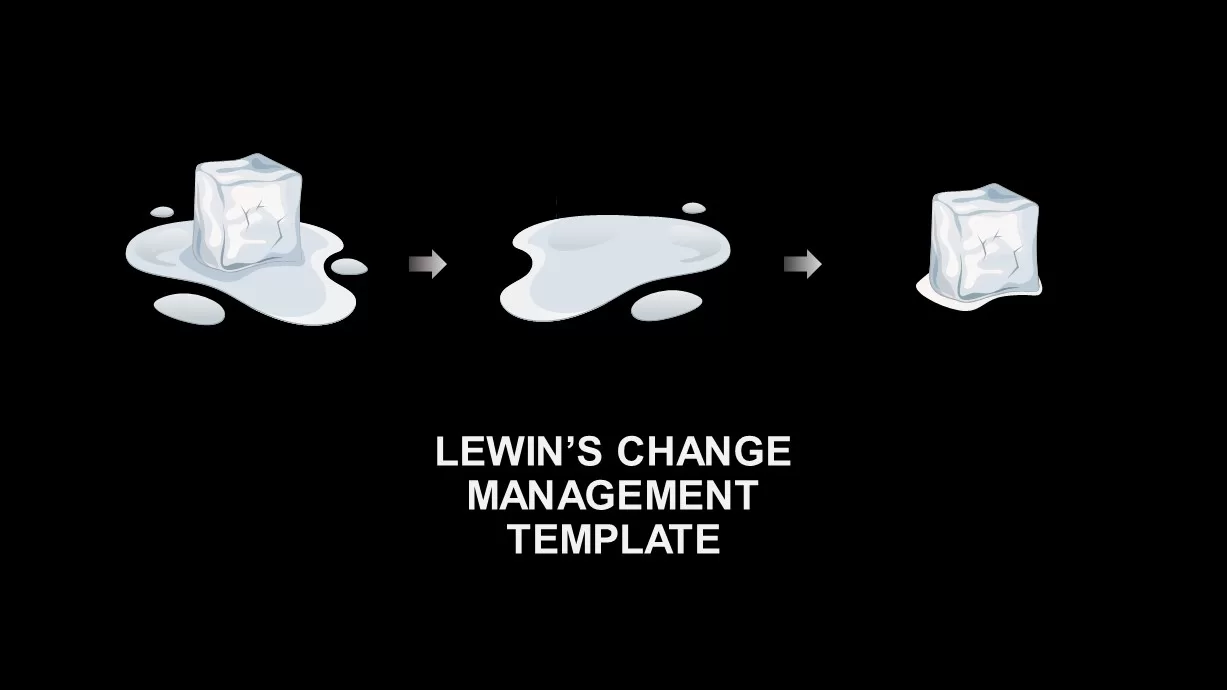
Lewin’s Change Management Diagram Template for PowerPoint & Google Slides
Process
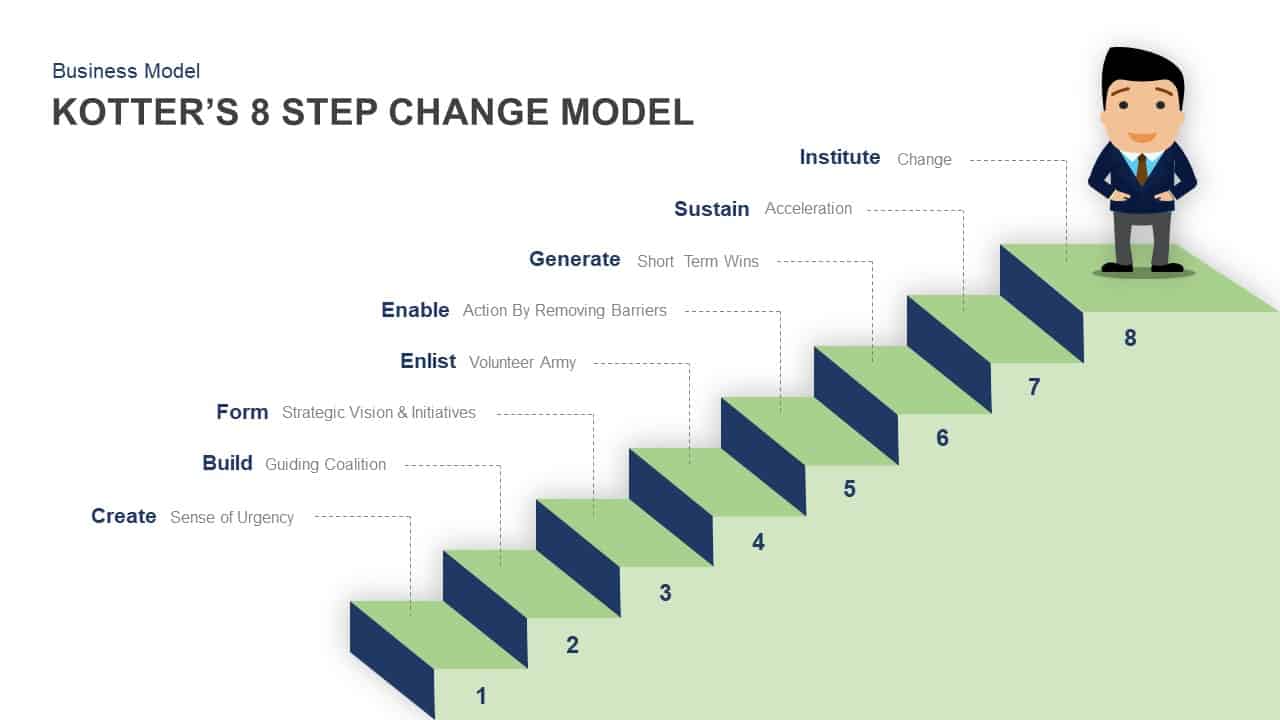
Kotter’s 8 Step Change Model Diagram for PowerPoint & Google Slides
Business Models

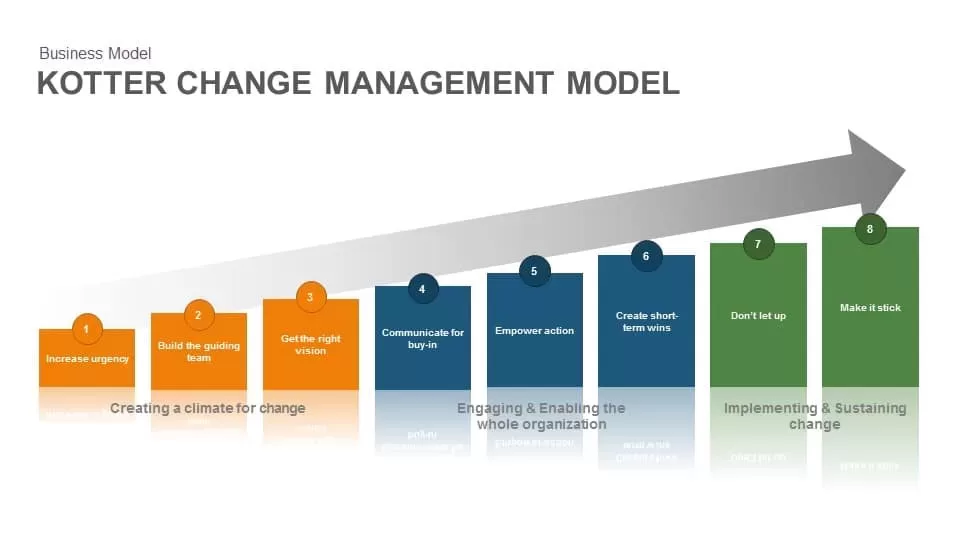
Kotter Change Management Model template for PowerPoint & Google Slides
Business Strategy
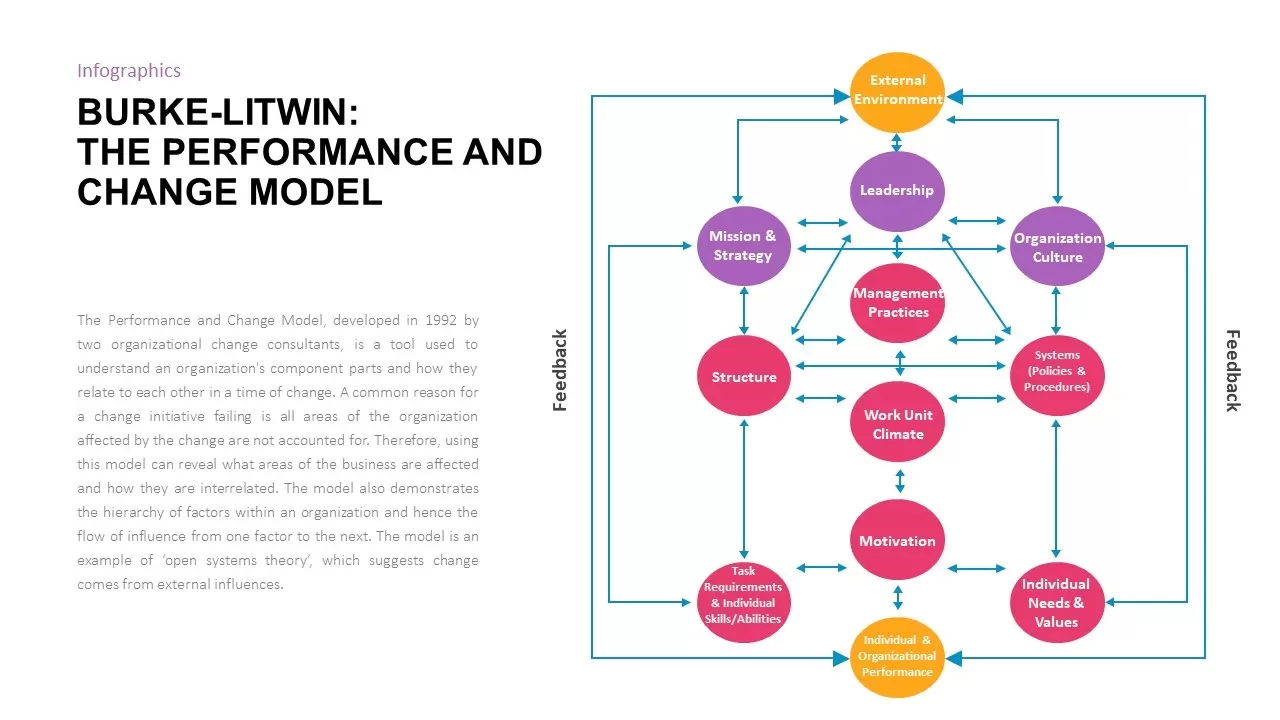
Burke-Litwin Performance and Change Model template for PowerPoint & Google Slides
Infographics
Lewin’s Change Model Overview Template for PowerPoint & Google Slides
Gap

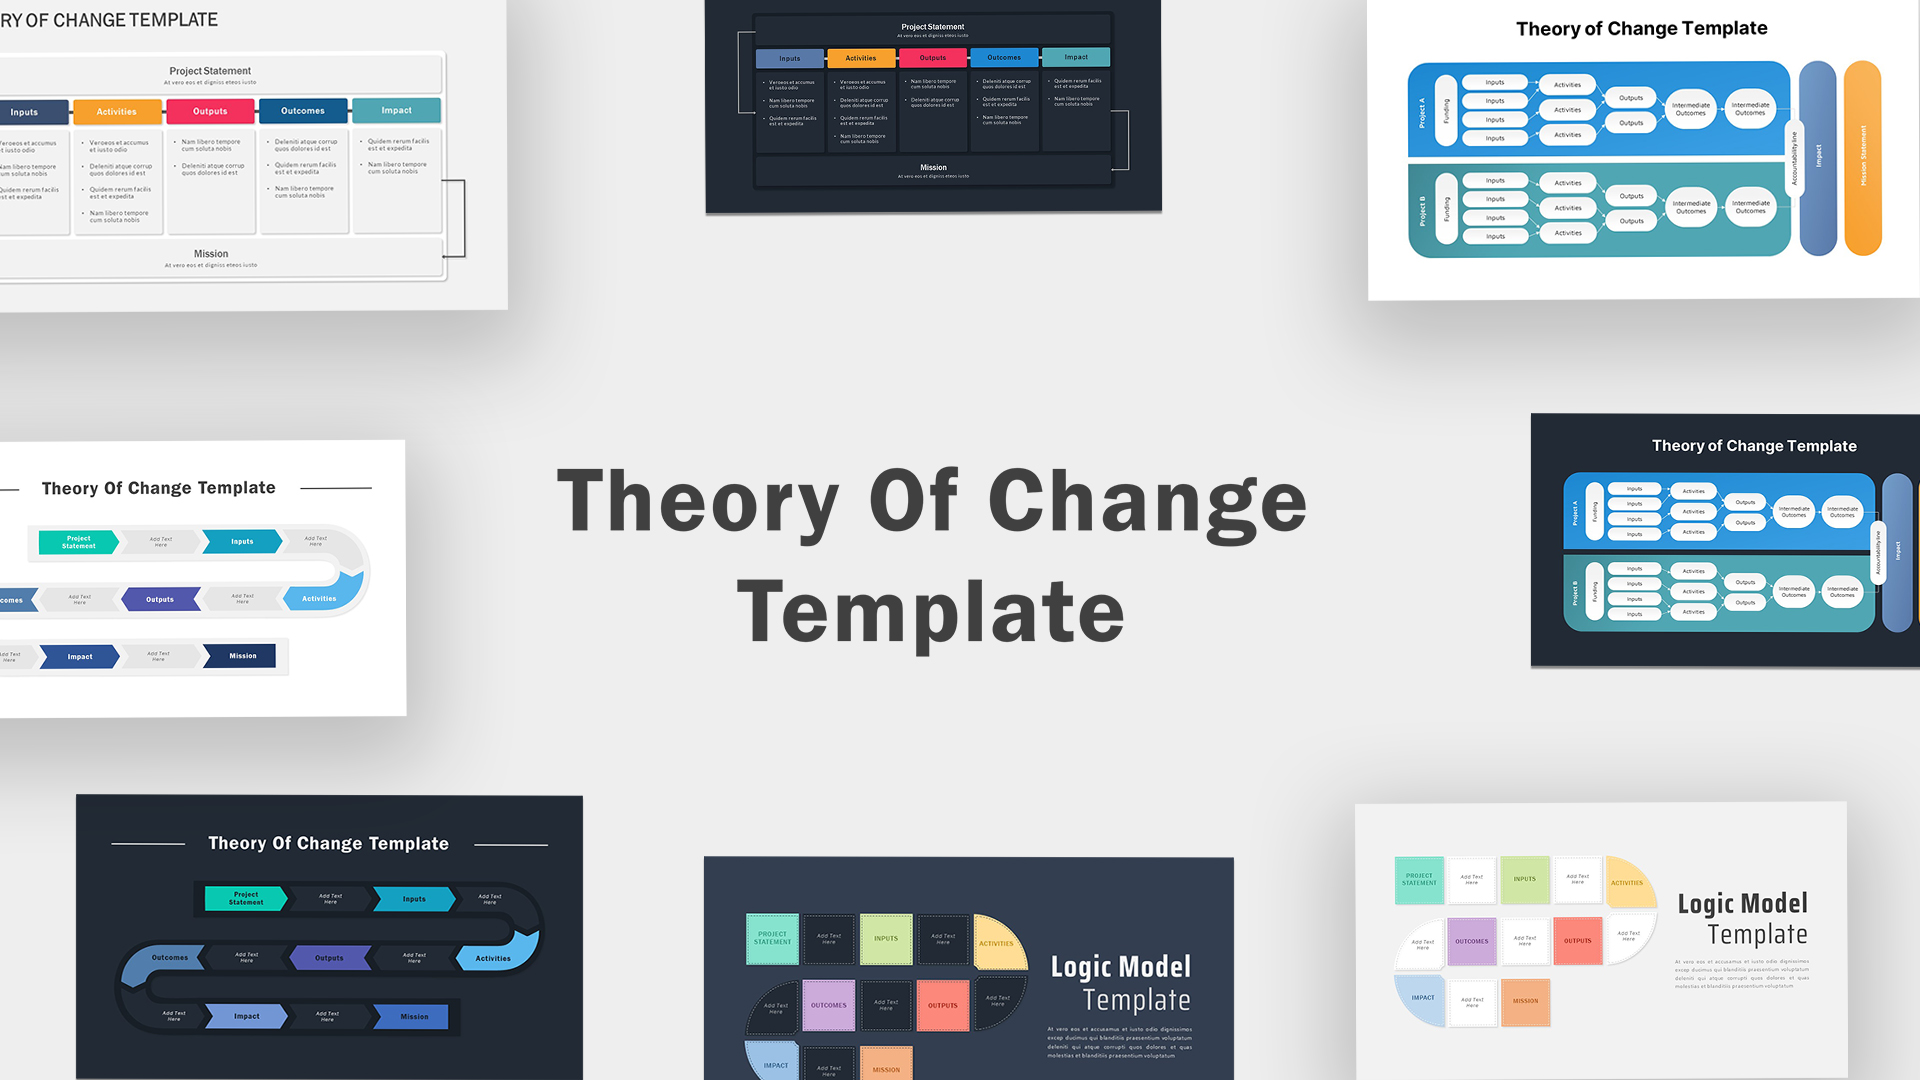
Theory of Change Infographics Pack Template for PowerPoint & Google Slides
Process
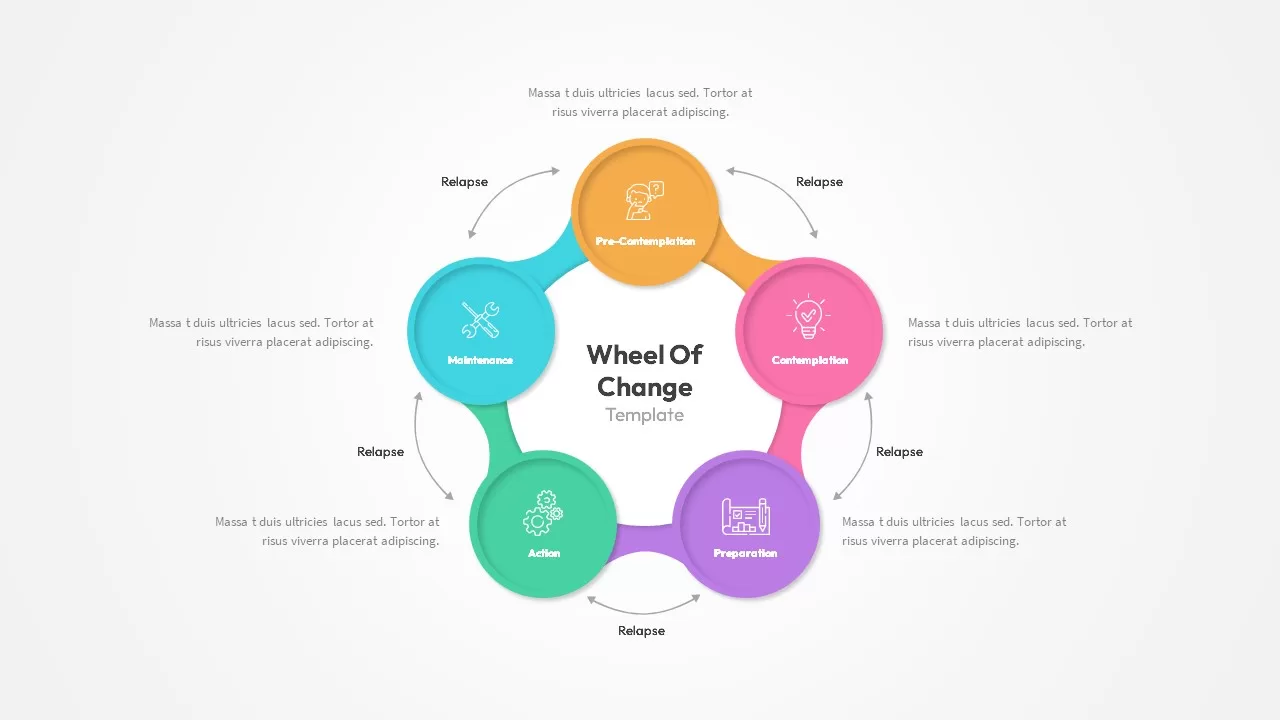
Wheel of Change Model template for PowerPoint & Google Slides
Business Strategy
Change Management Infographic Deck Template for PowerPoint & Google Slides
Business Strategy
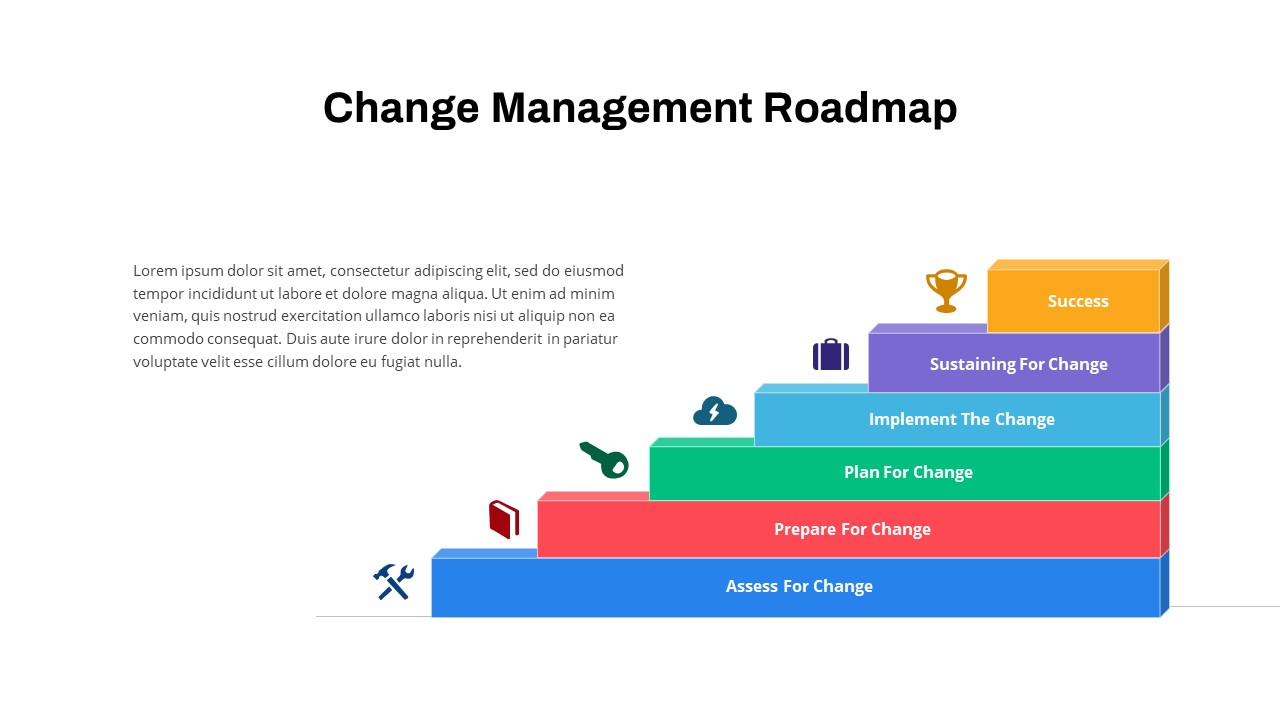
Colorful Change Management Roadmap Template for PowerPoint & Google Slides
Roadmap
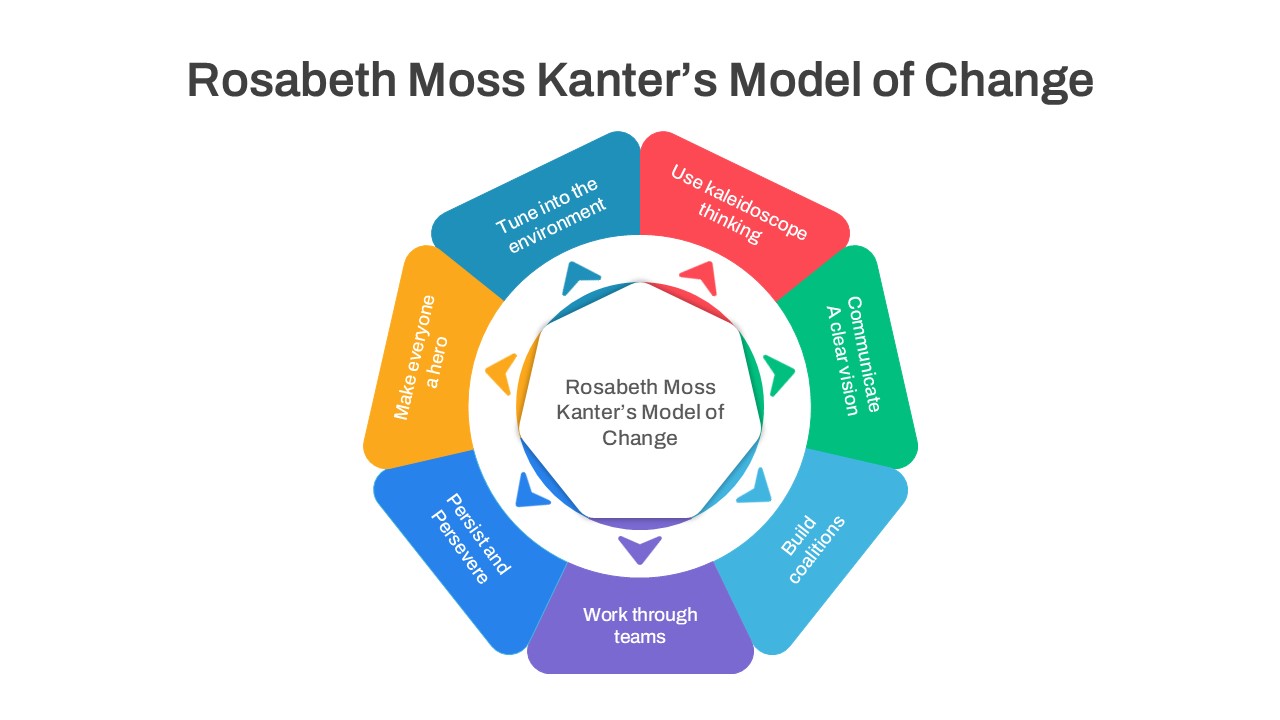
Rosabeth Moss Kanter’s Model of Change Template for PowerPoint & Google Slides
Circular

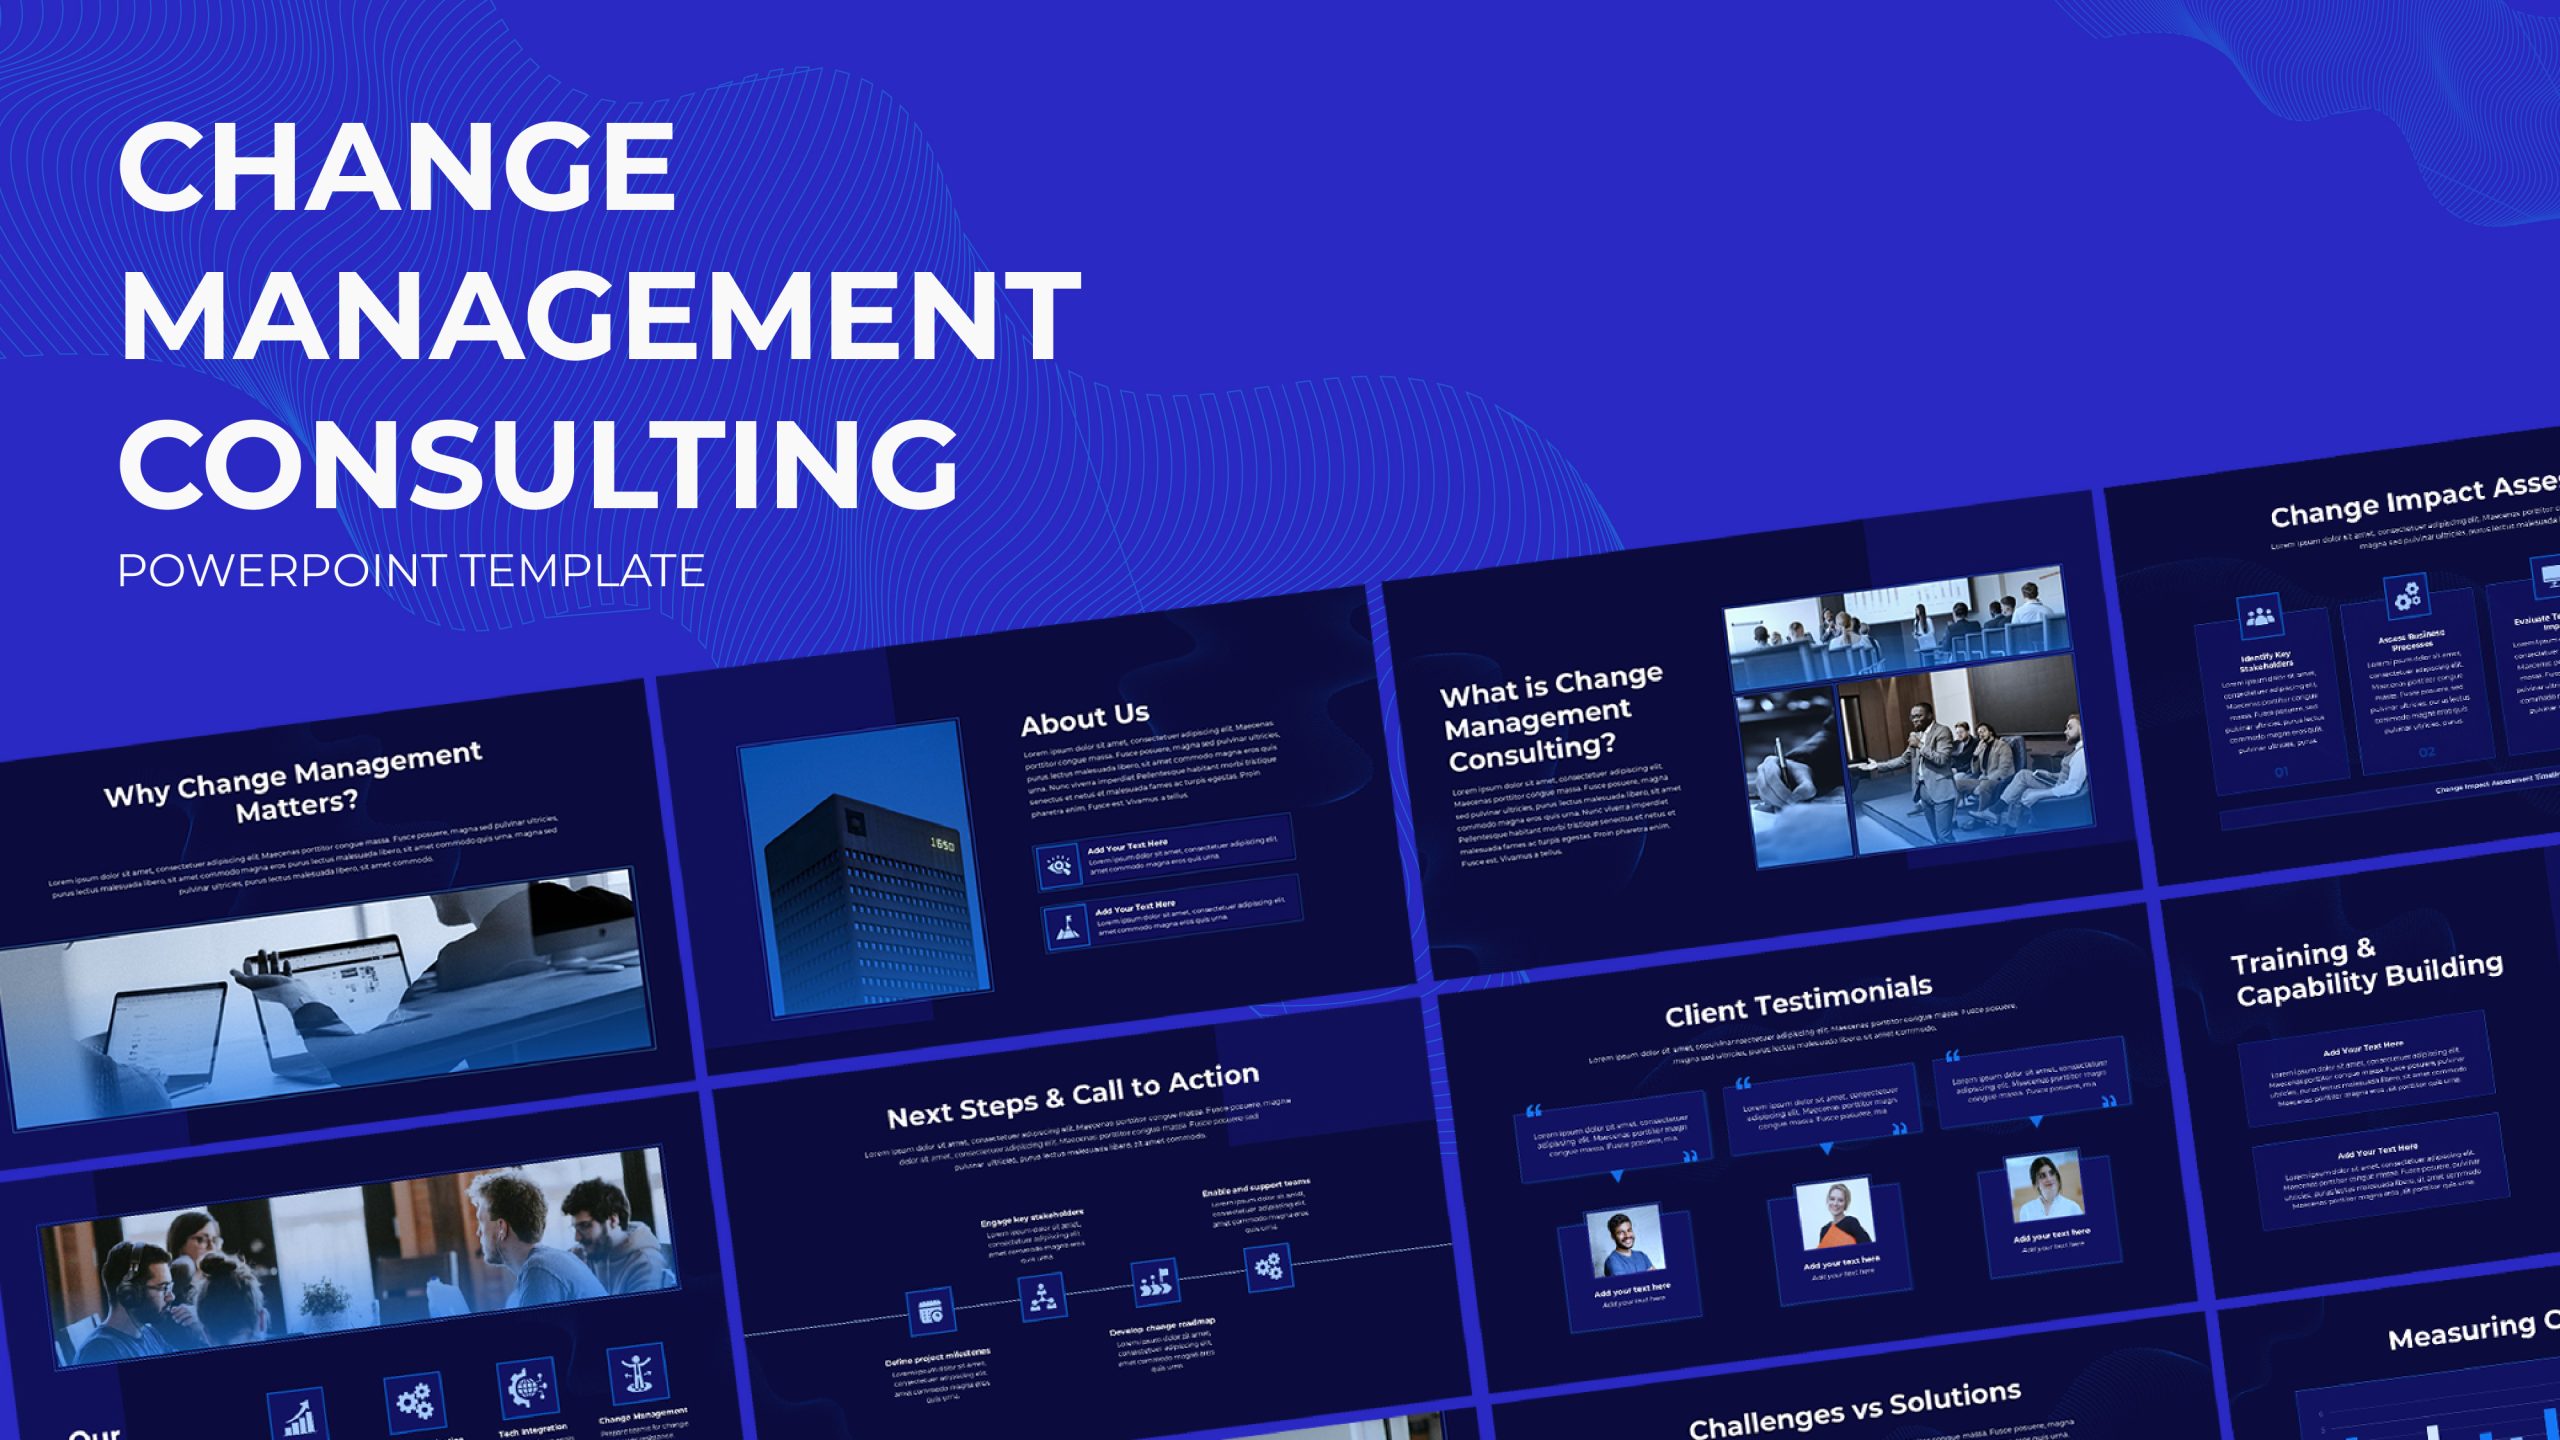
Change Management Consulting template for PowerPoint & Google Slides
Company Profile

Free Climate Change Awareness Deck for PowerPoint & Google Slides
Decks
Free
Gear Process Diagram PowerPoint Template for PowerPoint & Google Slides
Process
Sales Process Workflow Funnel Diagram PowerPoint Template for PowerPoint & Google Slides
Funnel
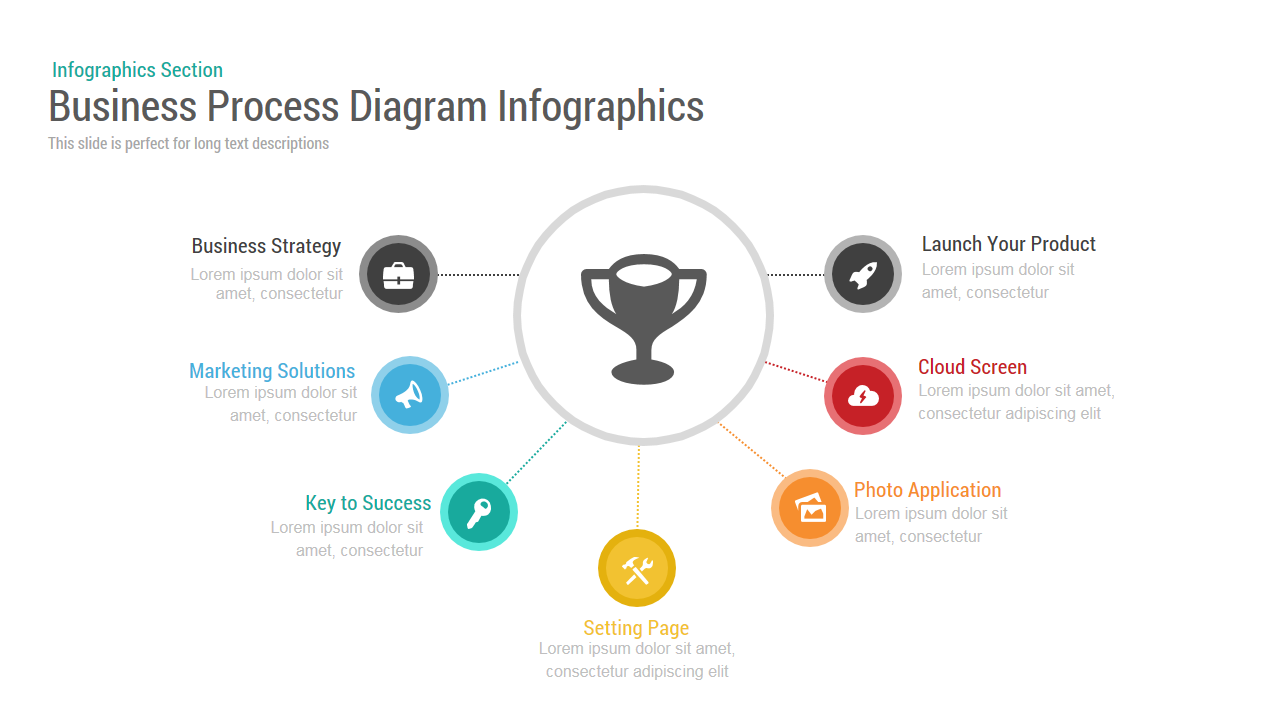
Business Process Diagram template for PowerPoint & Google Slides
Process
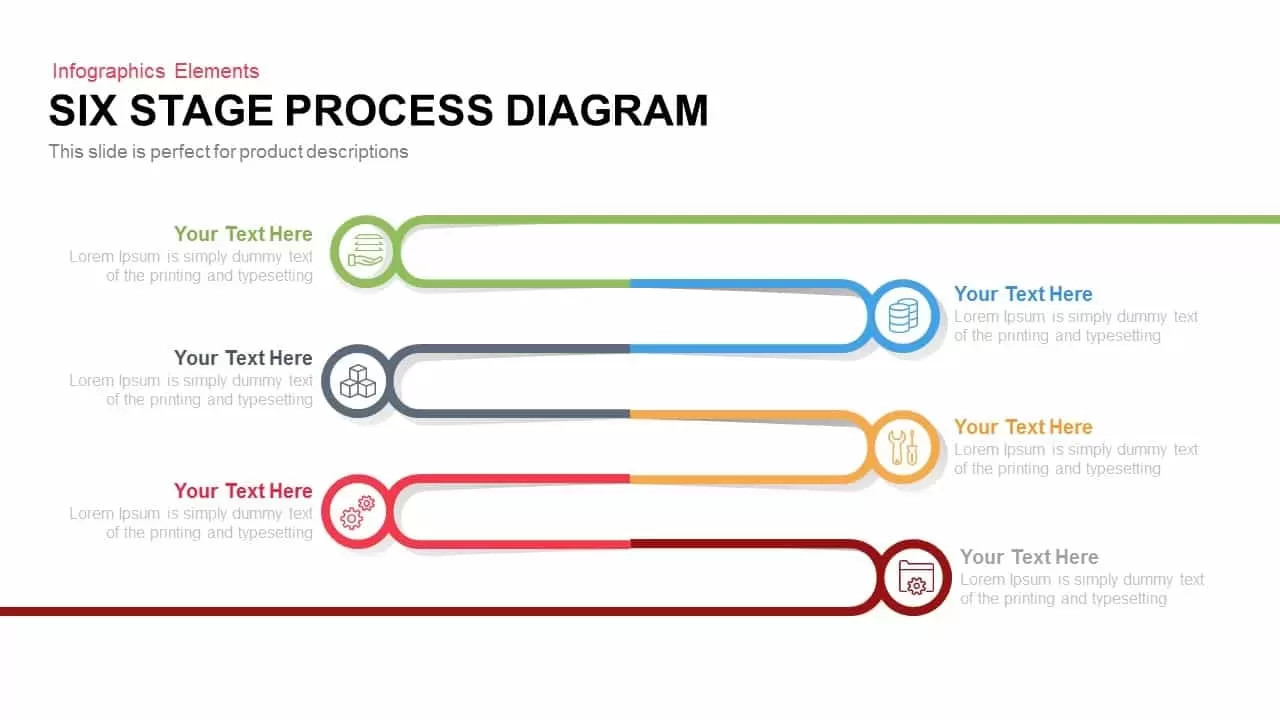
6 Stage Process Diagram Infographic Template for PowerPoint & Google Slides
Process
4 Section Pipe Diagram Process Flow Template for PowerPoint & Google Slides
Process
6-Step Arrow Process Diagram Template for PowerPoint & Google Slides
Process
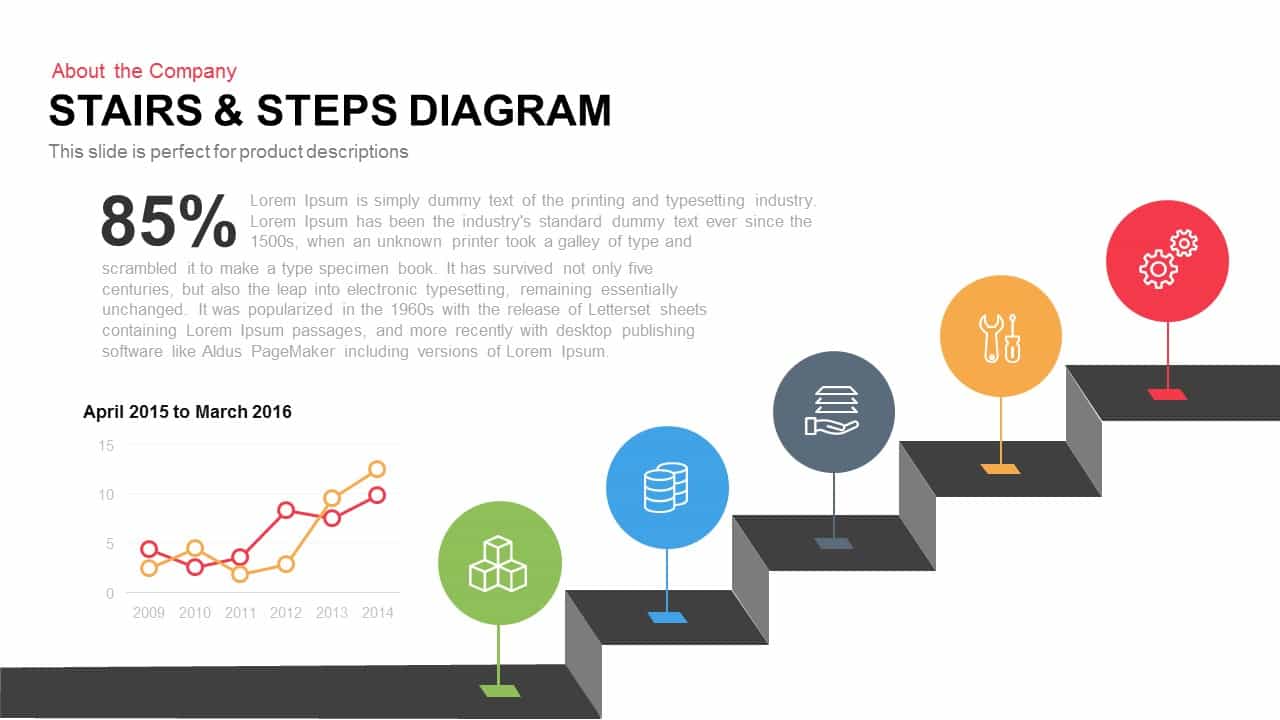
Stairs & Steps Process Diagram template for PowerPoint & Google Slides
Process
7-Step Workflow Process Diagram Template for PowerPoint & Google Slides
Process
Colorful Arrow Process Diagram Template for PowerPoint & Google Slides
Arrow
Professional 3D Gear Process Diagram Template for PowerPoint & Google Slides
Process
Arrow Process Diagram Template for PowerPoint & Google Slides
Process
Gear Process Phase Diagram template for PowerPoint & Google Slides
Process
3D Sphere Arrow Process Diagram template for PowerPoint & Google Slides
Arrow
3D Shape Linear Process Flow Diagram Template for PowerPoint & Google Slides
Process
Product Design Process Diagram Template for PowerPoint & Google Slides
Timeline
Linear Process Flow Circles Diagram Template for PowerPoint & Google Slides
Process
Bubble Circular Process Diagram Template for PowerPoint & Google Slides
Process
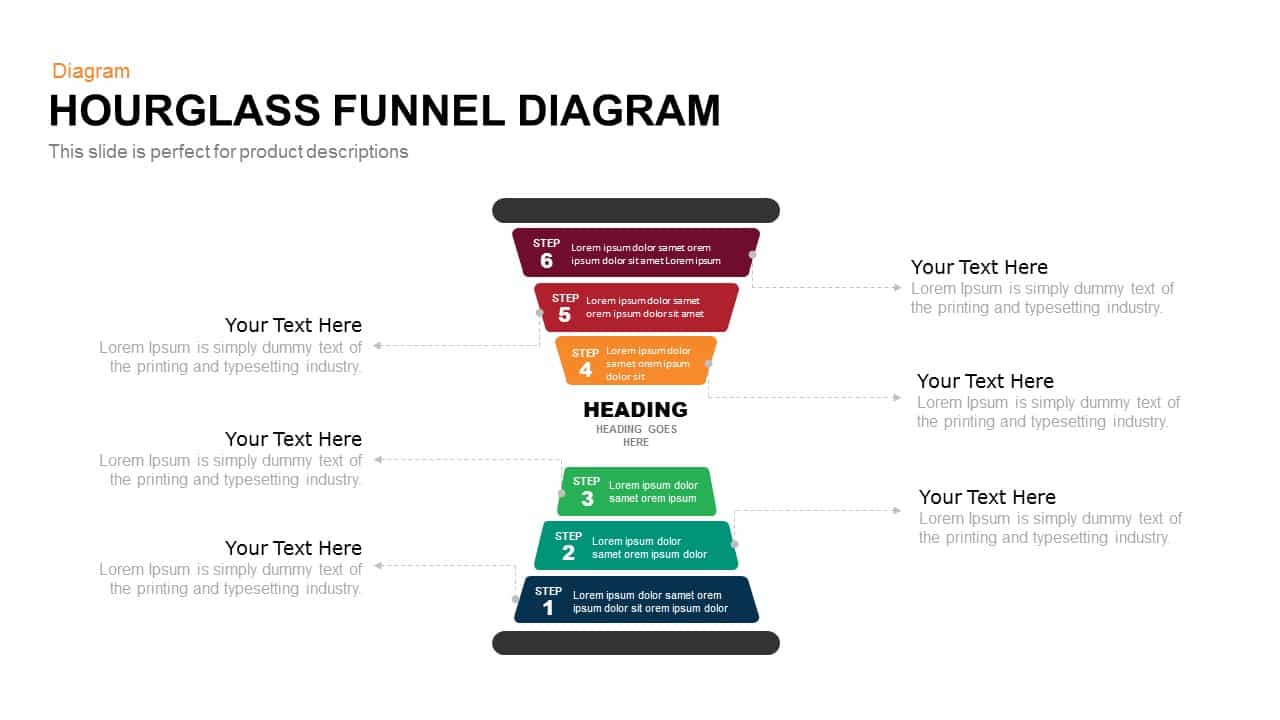
Hourglass Funnel Diagram Process Template for PowerPoint & Google Slides
Funnel
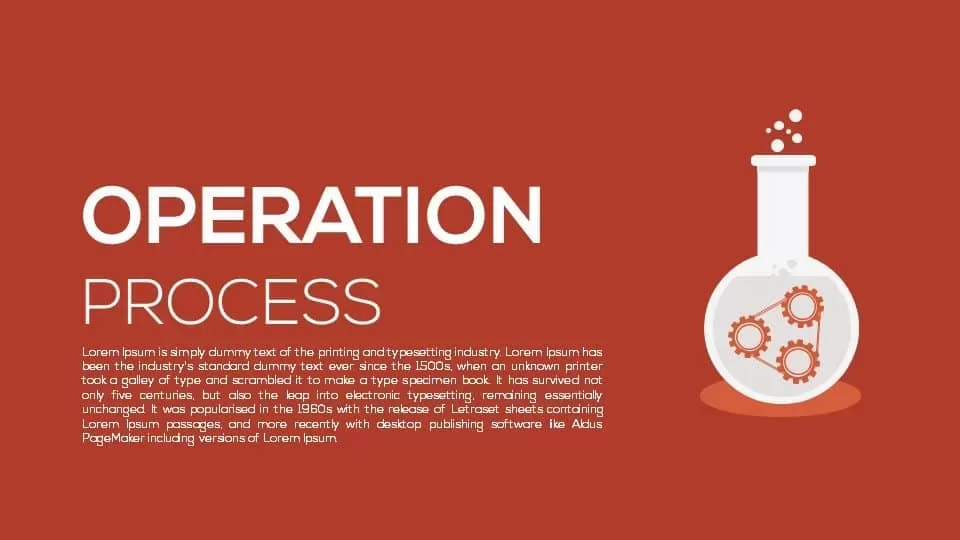
Operation Process Metaphor Diagram Template for PowerPoint & Google Slides
Process
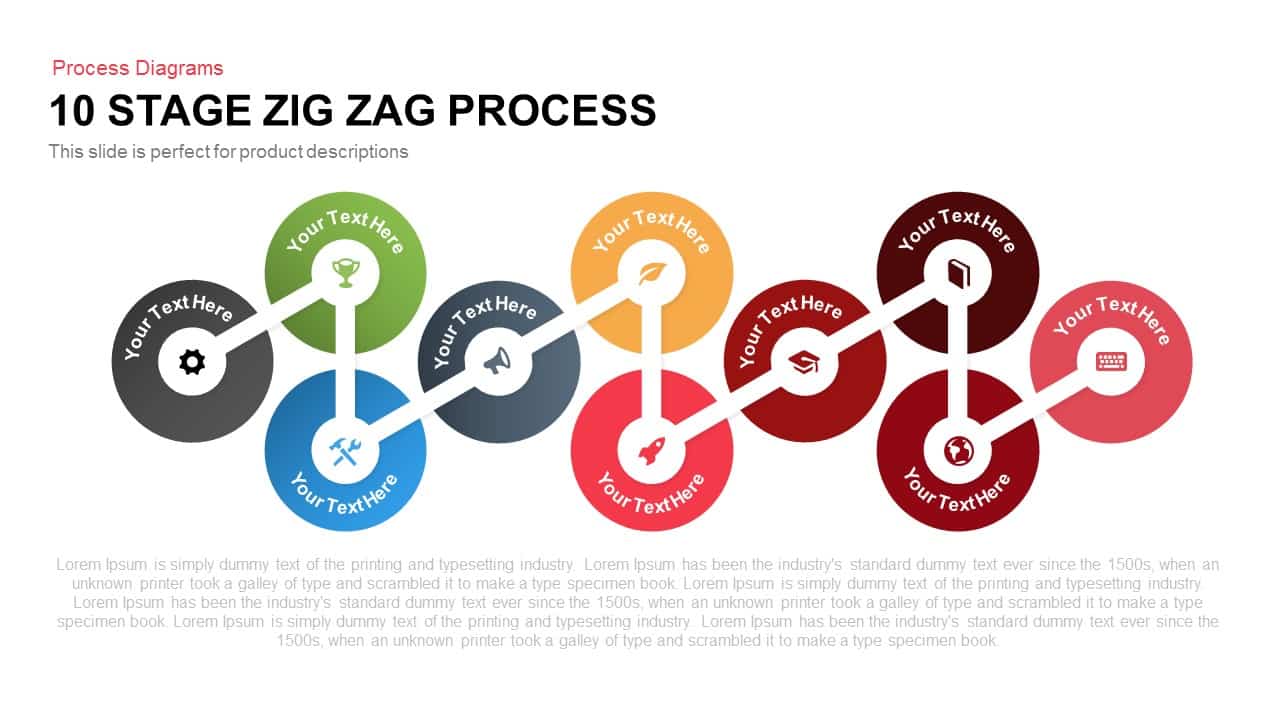
Ten-Stage Zig-Zag Process Diagram Template for PowerPoint & Google Slides
Process
Six-Stage Zig-Zag Process Flow Diagram Template for PowerPoint & Google Slides
Process
Vertical Business Process Flow Diagram Template for PowerPoint & Google Slides
Process
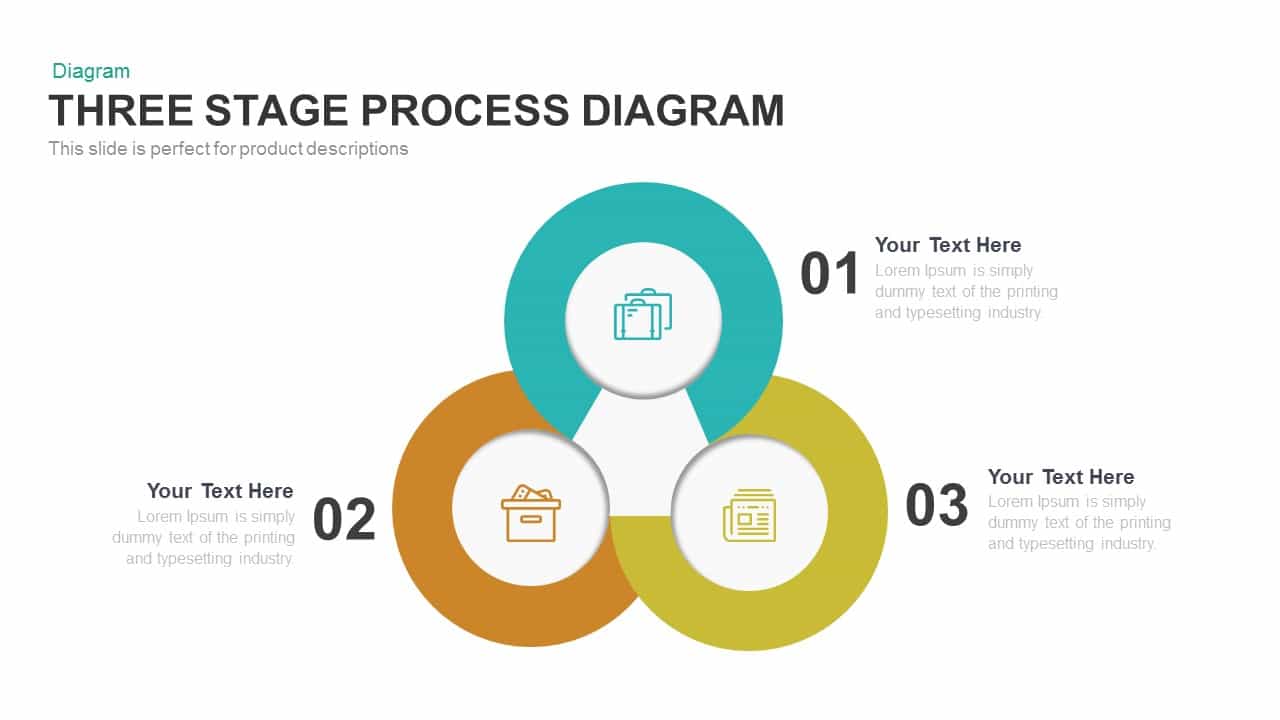
Engaging Three-Stage Process Diagram Template for PowerPoint & Google Slides
Process
Six-Sided Shutter Diagram Process Flow Template for PowerPoint & Google Slides
Process
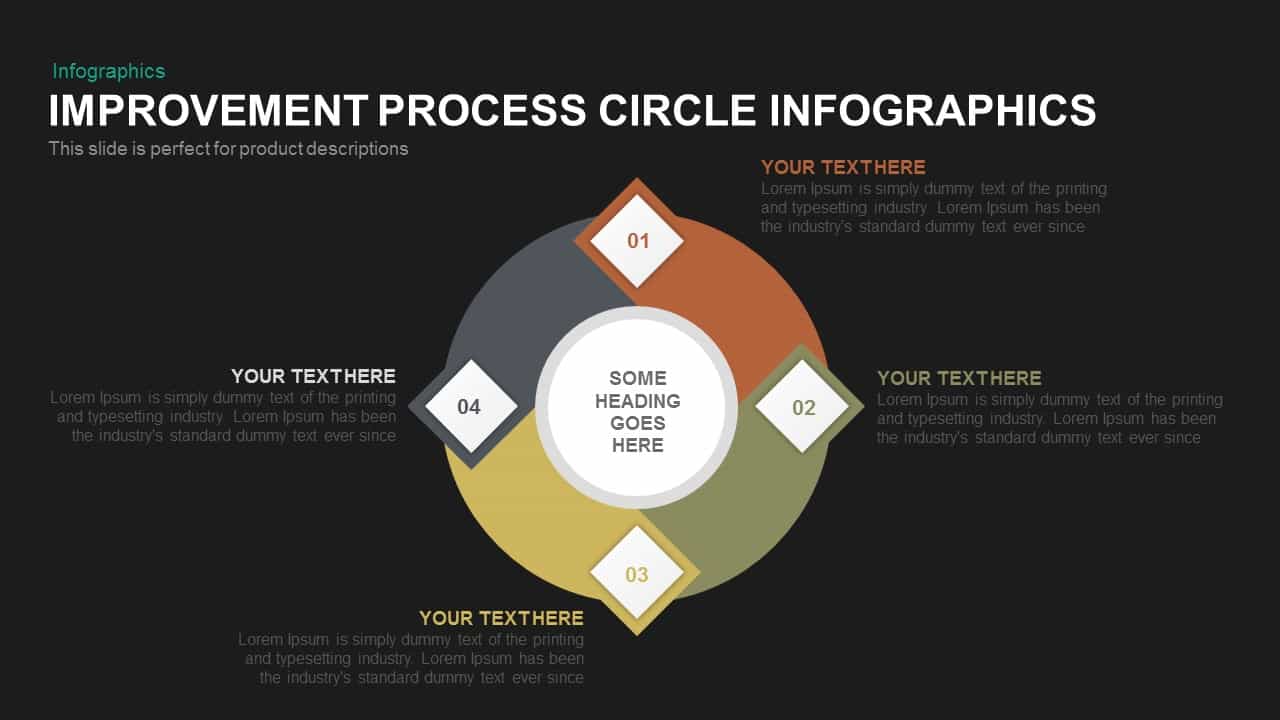
Circular Improvement Process Diagram Template for PowerPoint & Google Slides
Process

Six-Process Circular Arrow Diagram Template for PowerPoint & Google Slides
Circular
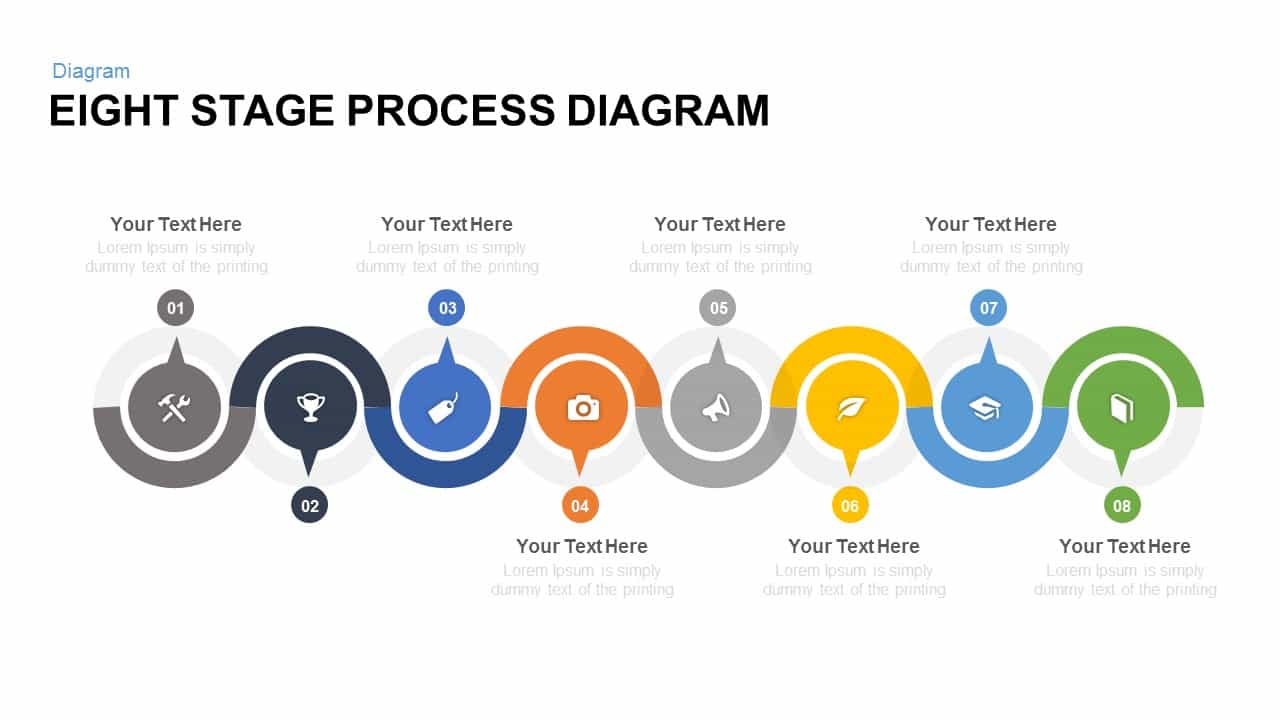
Eight Stage Process Diagram template for PowerPoint & Google Slides
Process
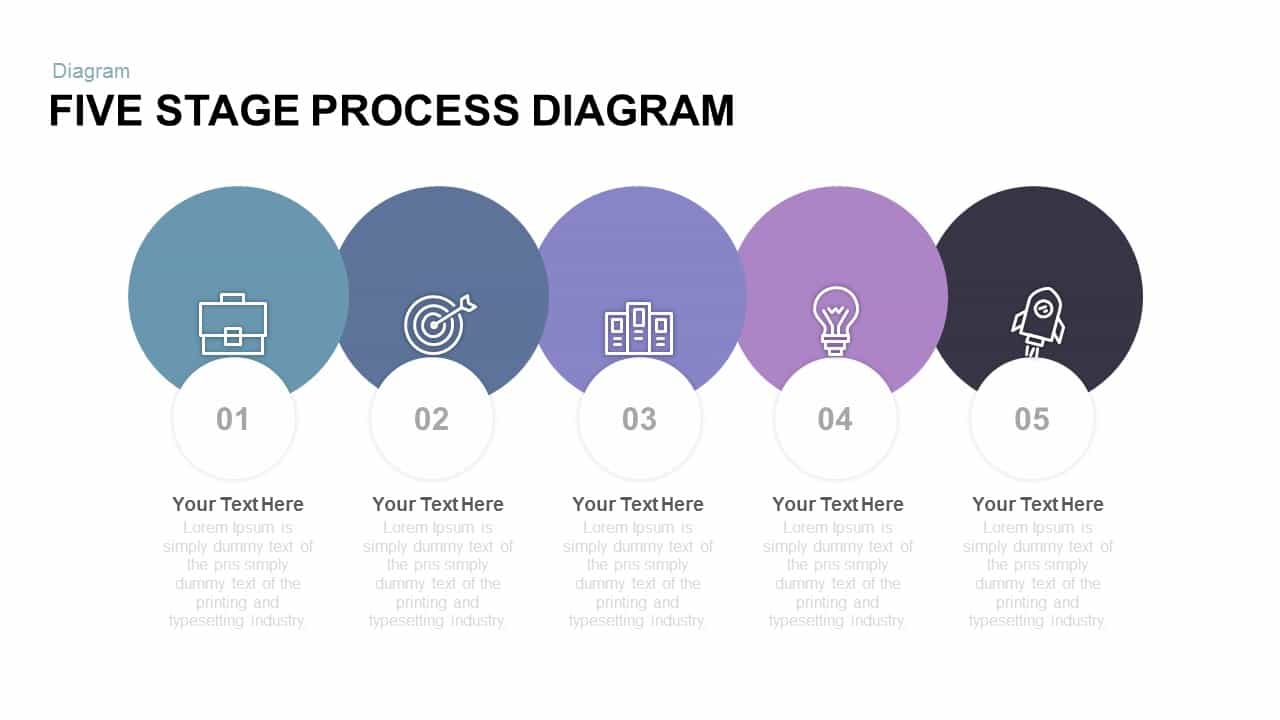
Five Stage Process Diagram template for PowerPoint & Google Slides
Process
Free

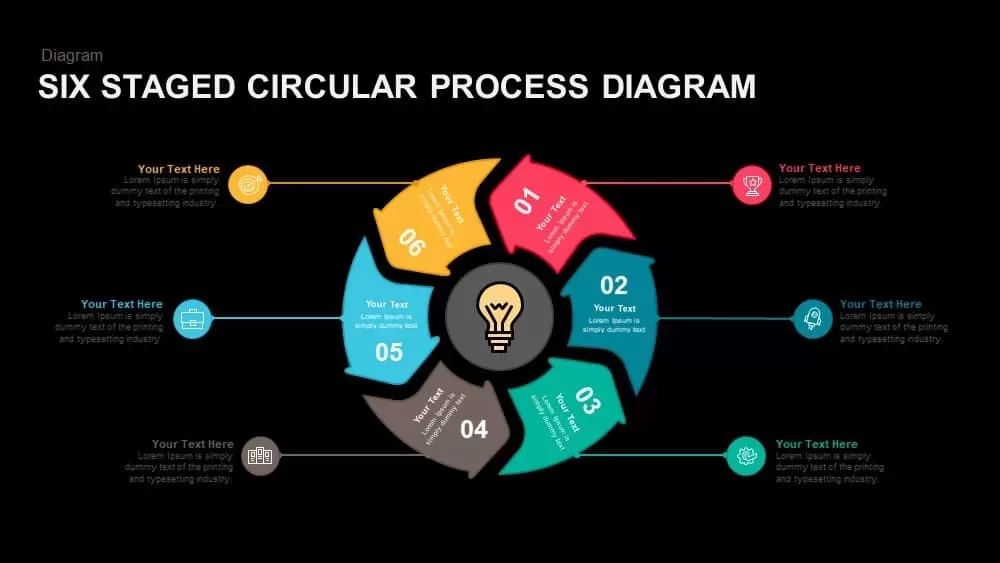
Six-Stage Circular Process Diagram Template for PowerPoint & Google Slides
Process

Four-Plus Process Flow Diagram Template for PowerPoint & Google Slides
Process
Infinity Process Diagram Template for PowerPoint & Google Slides
Process
12-Stage Zig Zag Process Diagram Template for PowerPoint & Google Slides
Process
Three Level Funnel Process Diagram Template for PowerPoint & Google Slides
Funnel
Six Sigma Gear Process Diagram Template for PowerPoint & Google Slides
Process
9-Step Circular Arrows Process Diagram Template for PowerPoint & Google Slides
Process
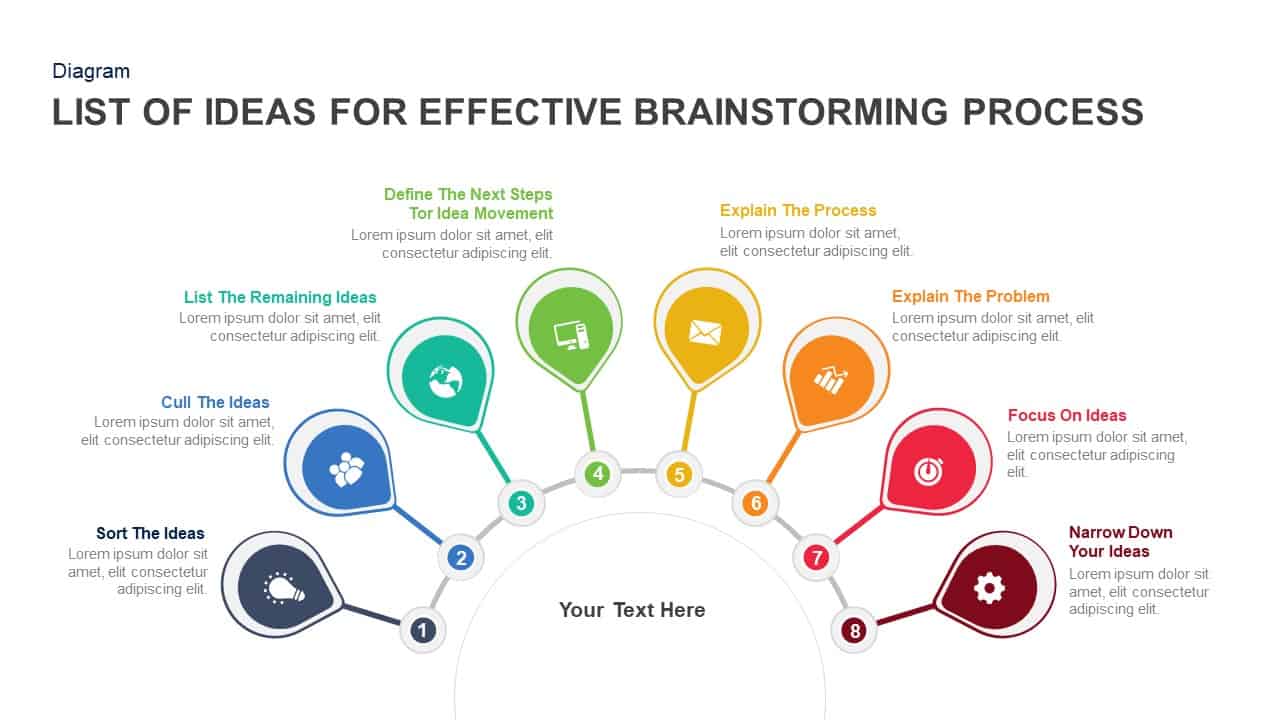
Eight-Step Brainstorming Process Diagram Template for PowerPoint & Google Slides
Process
Five Stage Linear Process Flow Diagram Template for PowerPoint & Google Slides
Process
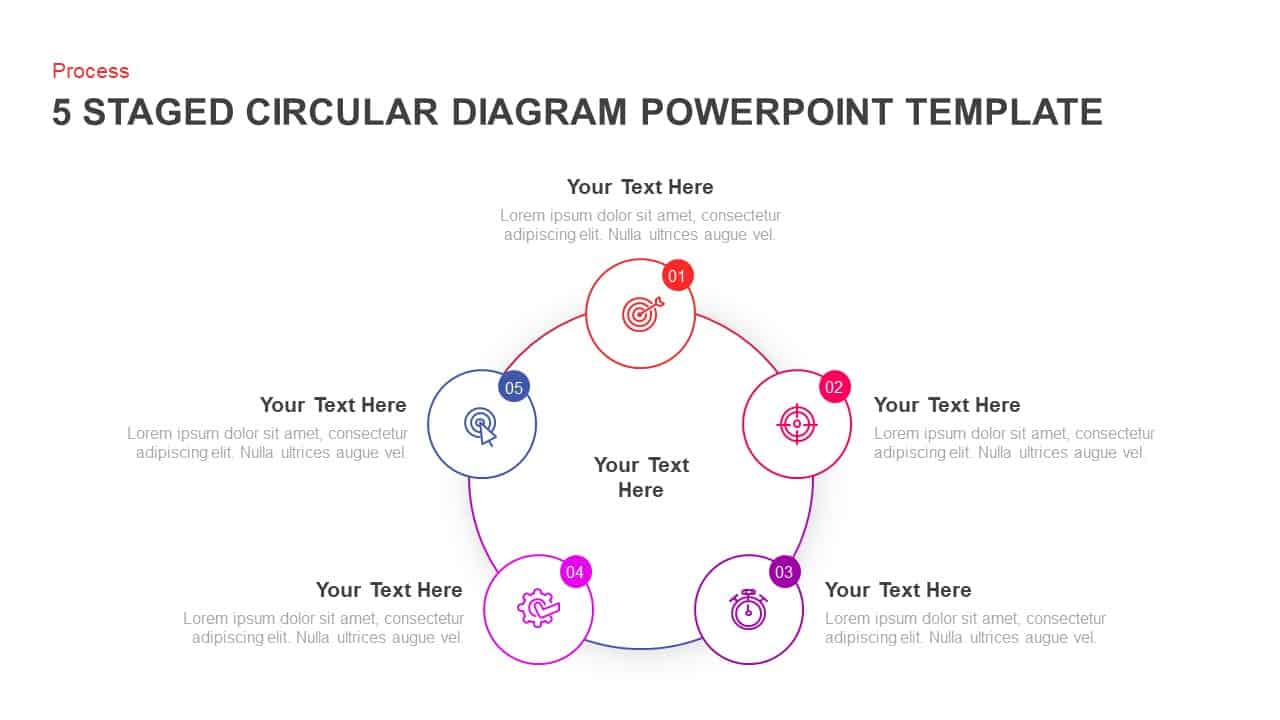
Five-Stage Circular Process Diagram Template for PowerPoint & Google Slides
Circular
Four-Stage Gear Process Diagram Template for PowerPoint & Google Slides
Process
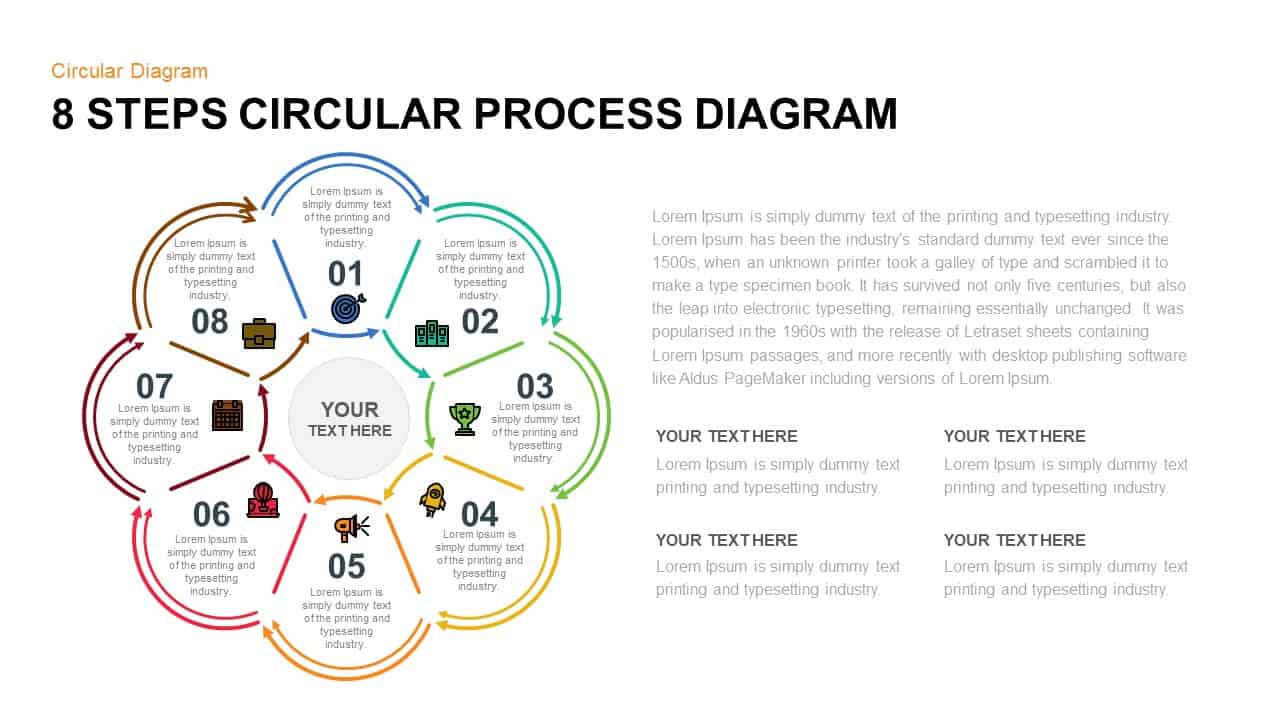
8 Steps Circular Process Diagram Template for PowerPoint & Google Slides
Circular
Five-Stage Circular Process Flow Diagram Template for PowerPoint & Google Slides
Circular
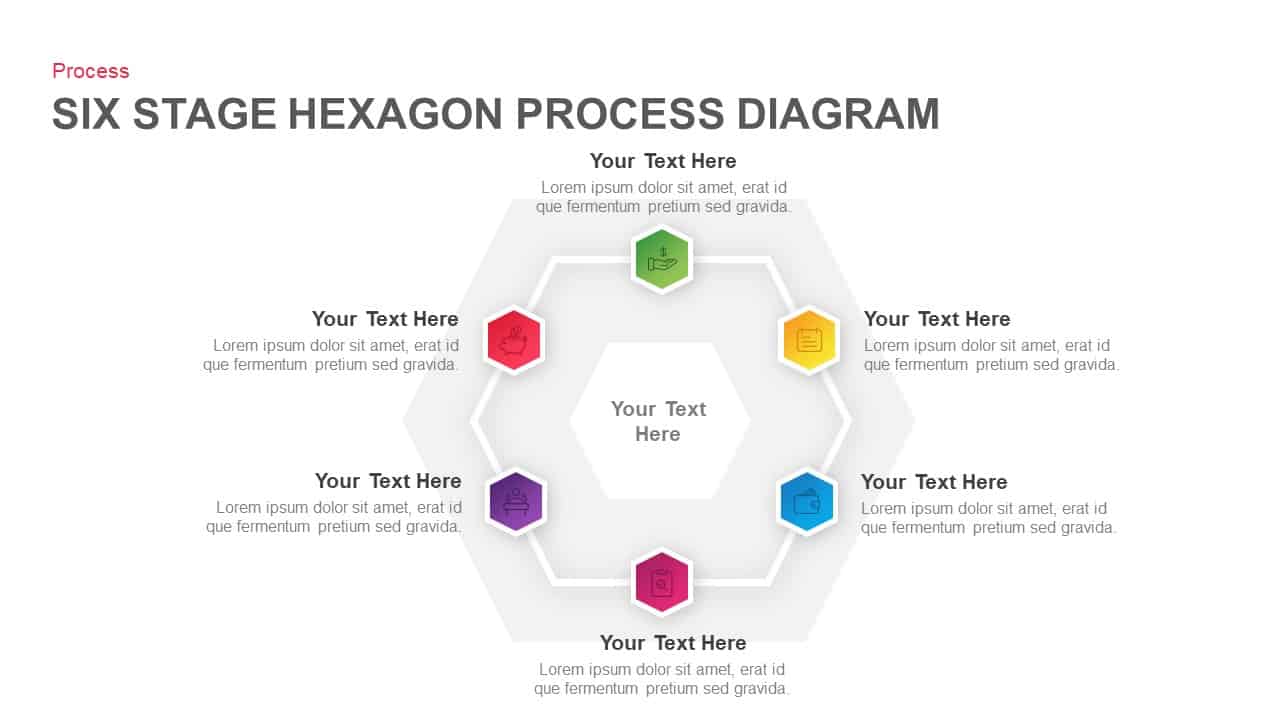
Six Stage Hexagon Process Diagram Template for PowerPoint & Google Slides
Process
5-Stage Gear Process Flow Diagram Template for PowerPoint & Google Slides
Process
Four-Stage Linear Process Flow Diagram Template for PowerPoint & Google Slides
Process
5-Stage Linear Process Flow Diagram Template for PowerPoint & Google Slides
Process
Five-Stage Process Flow Diagram Template for PowerPoint & Google Slides
Process
7 Stage Linear Process Flow Diagram Template for PowerPoint & Google Slides
Process
Modern 5-Step Sales Process Diagram Template for PowerPoint & Google Slides
Process
Two-Path Idea-to-Goal Process Diagram Template for PowerPoint & Google Slides
Infographics
Sales Process Improvement Gear Diagram Template for PowerPoint & Google Slides
Process
Three-Stage Loop Process Diagram Template for PowerPoint & Google Slides
Process
4-Stage Linear Process Flow Diagram Template for PowerPoint & Google Slides
Process
4-Step Linear Process Flow Diagram Template for PowerPoint & Google Slides
Process
Swim Lane Diagram PowerPoint & Google Slides Template for Process Mapping
Business Strategy
Risk Management Process Diagram Template for PowerPoint & Google Slides
Risk Management
Animated Six-Stage 3D Process Diagram Template for PowerPoint & Google Slides
Arrow
Minimal Process Flow Diagram Infographic Template for PowerPoint & Google Slides
Process
Process Flow Diagram template for PowerPoint & Google Slides
Process
Curved Arrow Process Flow Diagram Template for PowerPoint & Google Slides
Process
Curved Arrow Process Flow Diagram Template for PowerPoint & Google Slides
Arrow
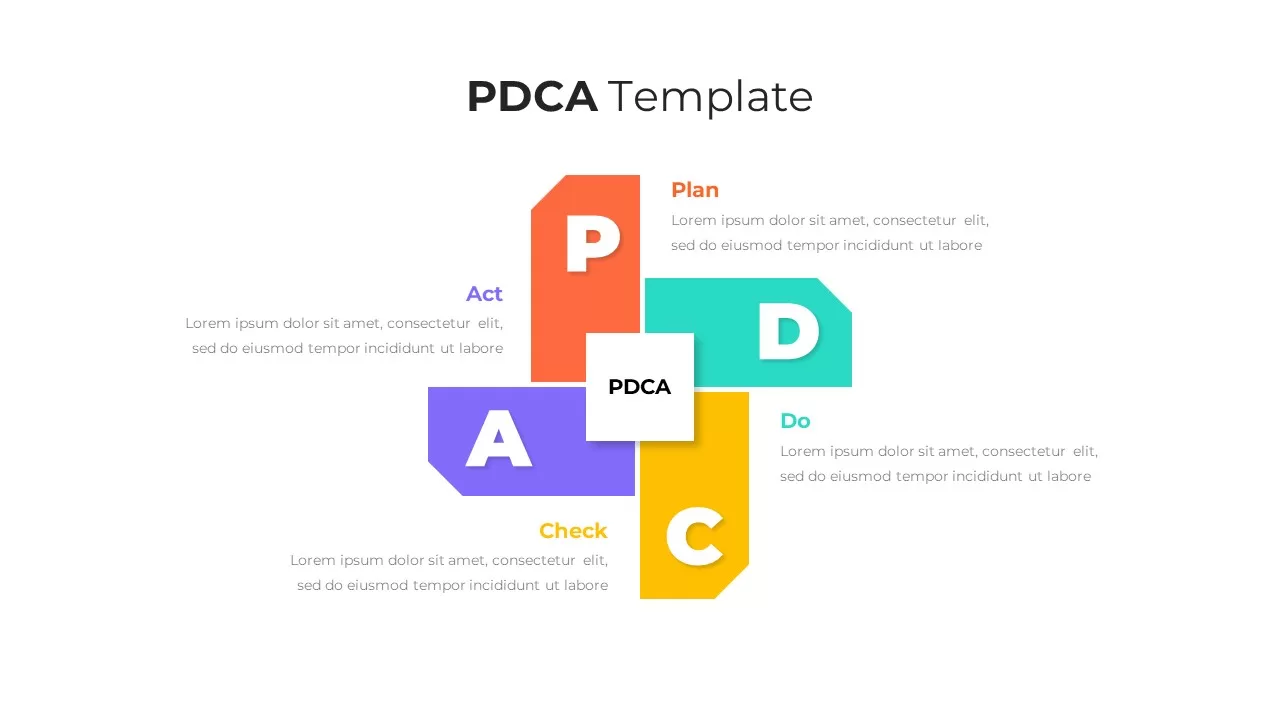
Elegant PDCA Four-Step Process Diagram Template for PowerPoint & Google Slides
Process
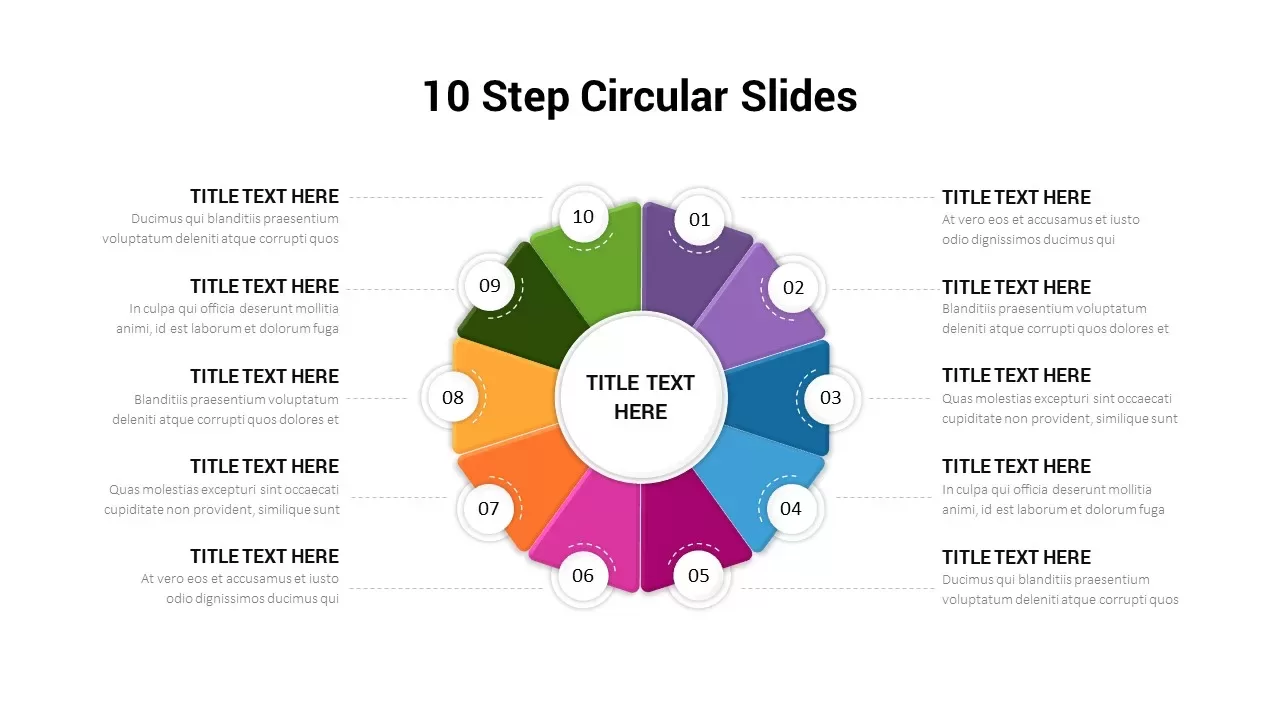
10-Step Circular Process Diagram Template for PowerPoint & Google Slides
Process
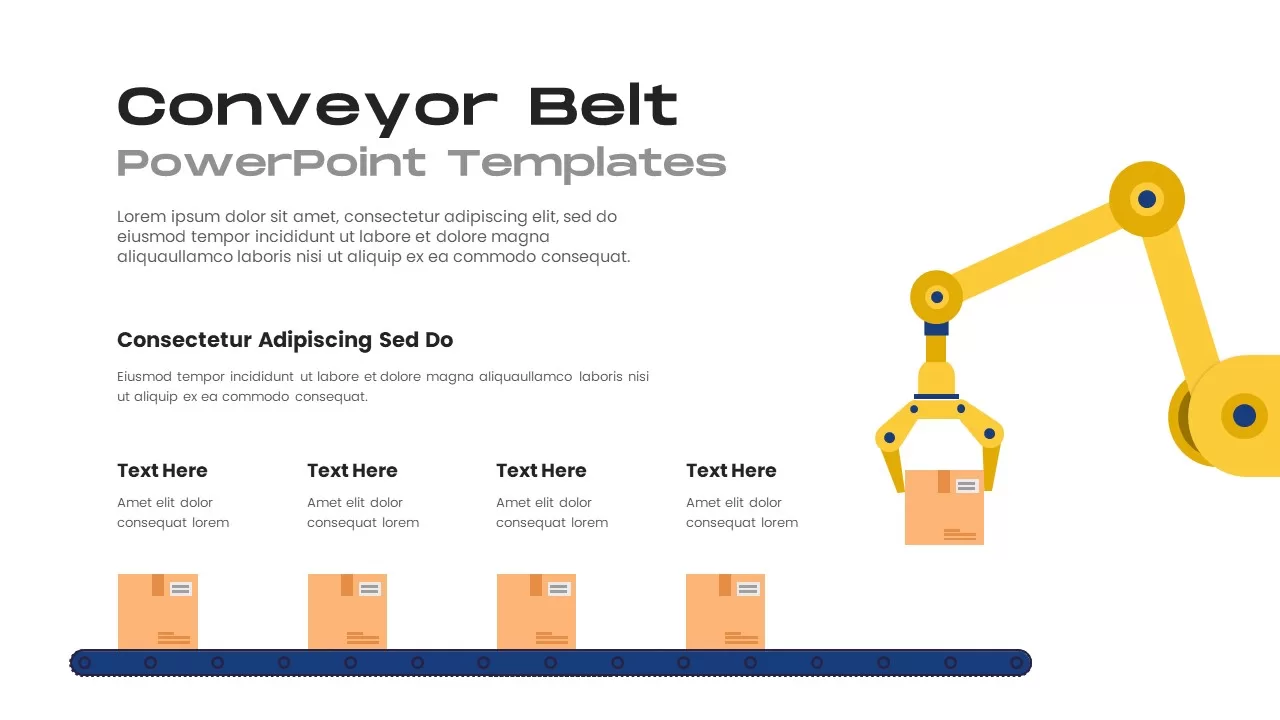
Robotic Conveyor Belt Process Diagram Template for PowerPoint & Google Slides
Process
Pentagon Arrow Process Diagram Template for PowerPoint & Google Slides
Process
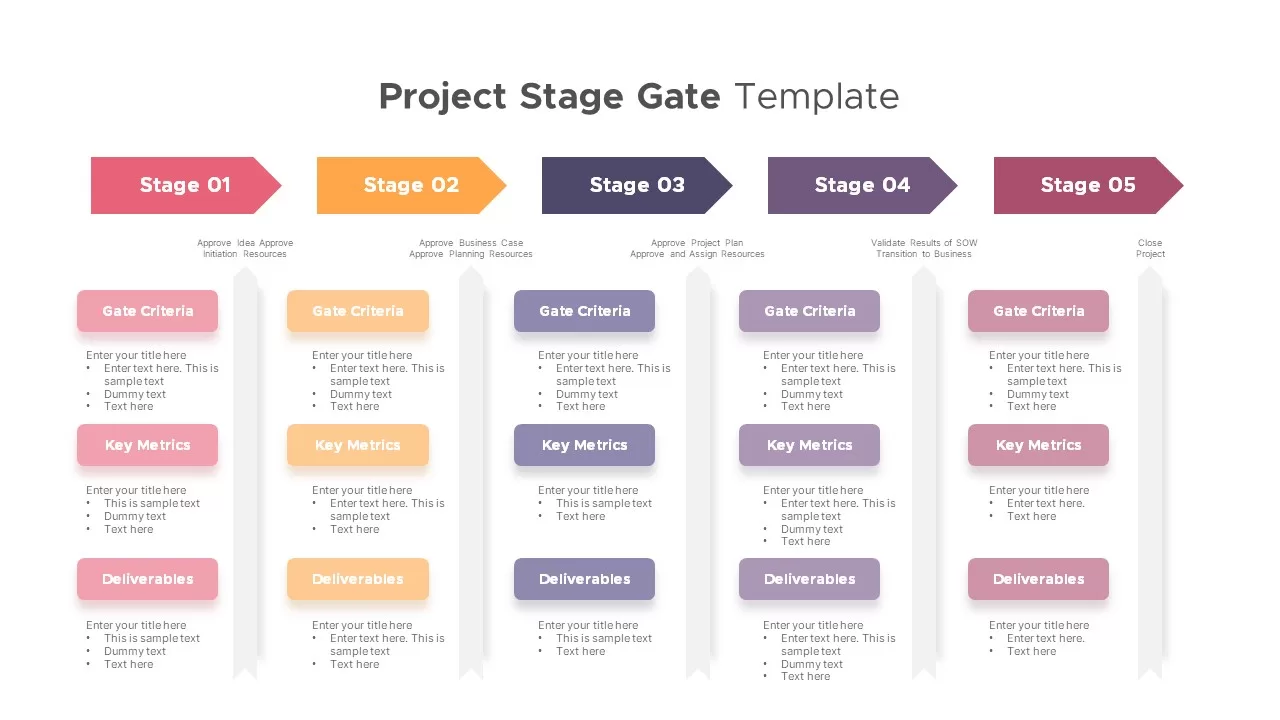
Project Stage Gate Process Diagram Template for PowerPoint & Google Slides
Process
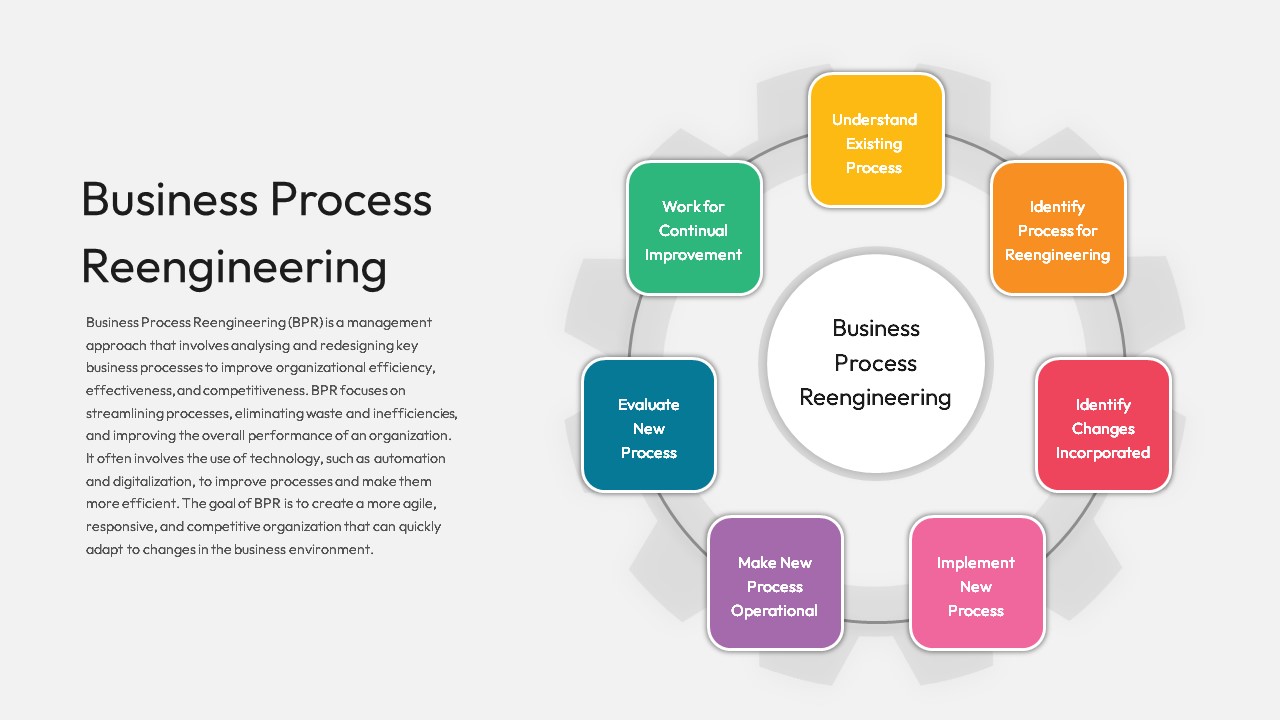
Business Process Reengineering Diagram Template for PowerPoint & Google Slides
Circular
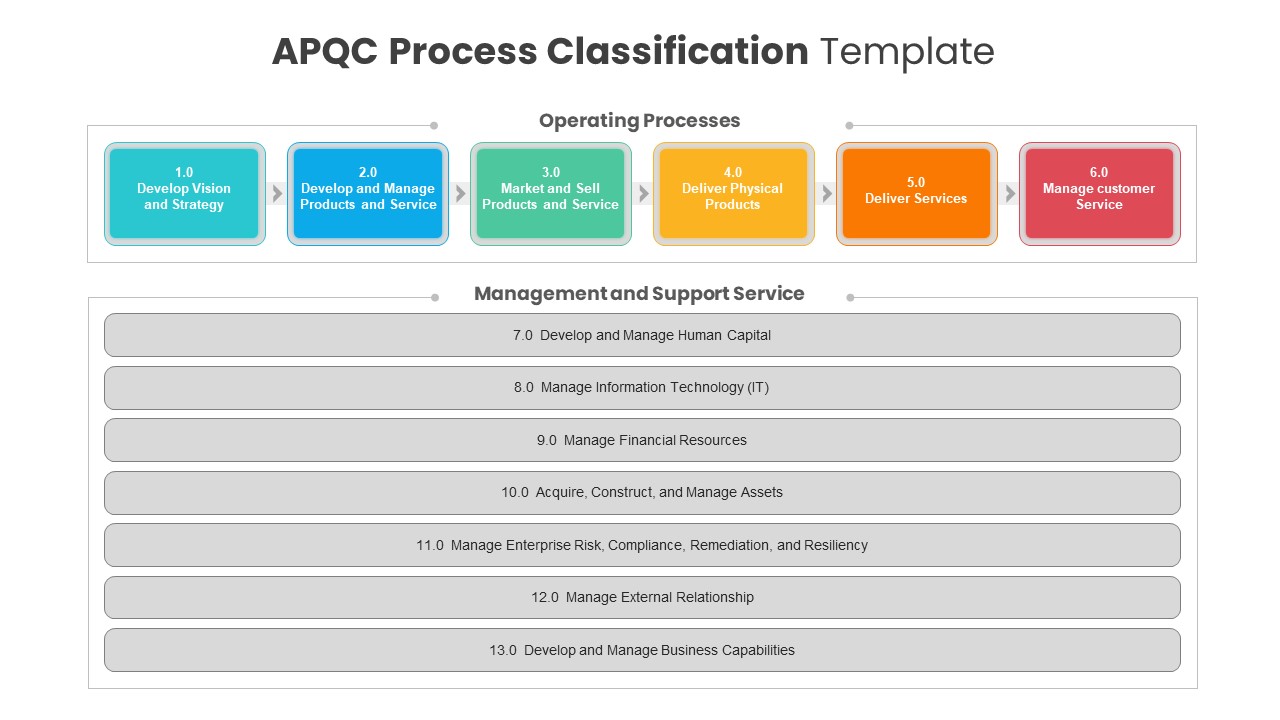
APQC Process Classification Diagram Template for PowerPoint & Google Slides
Process
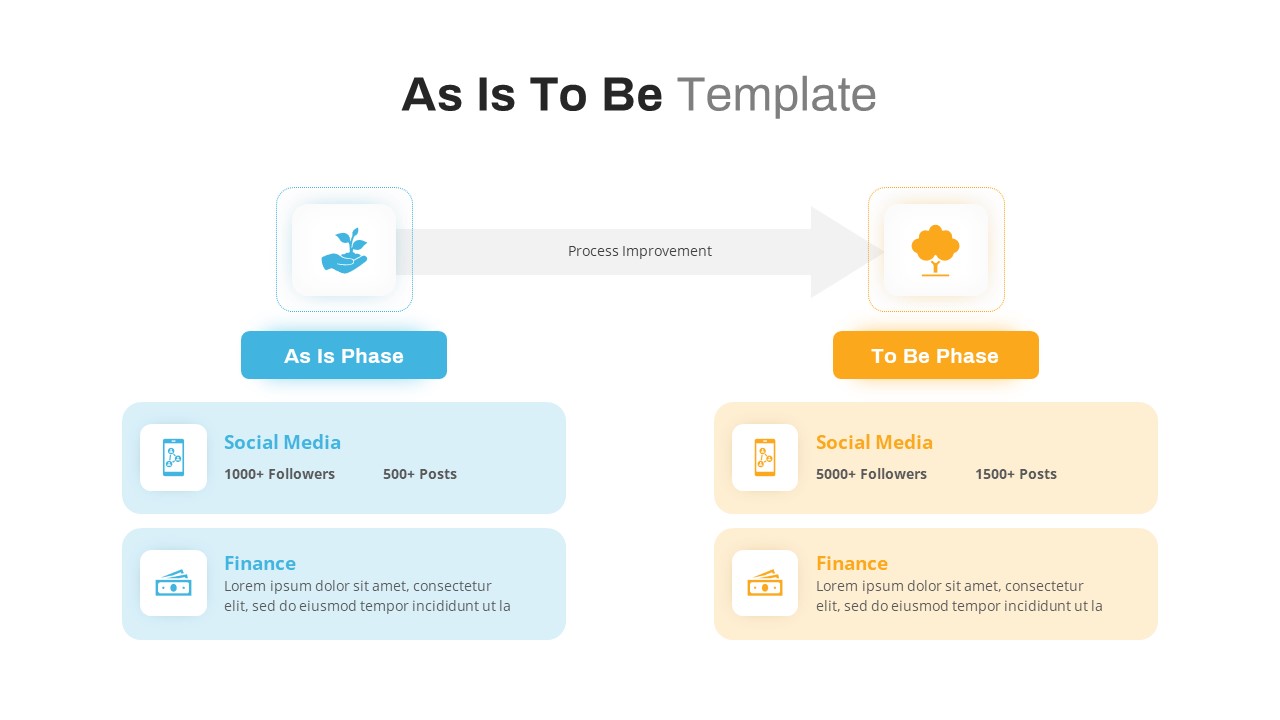
As Is to Be Process Improvement Diagram Template for PowerPoint & Google Slides
Business Strategy
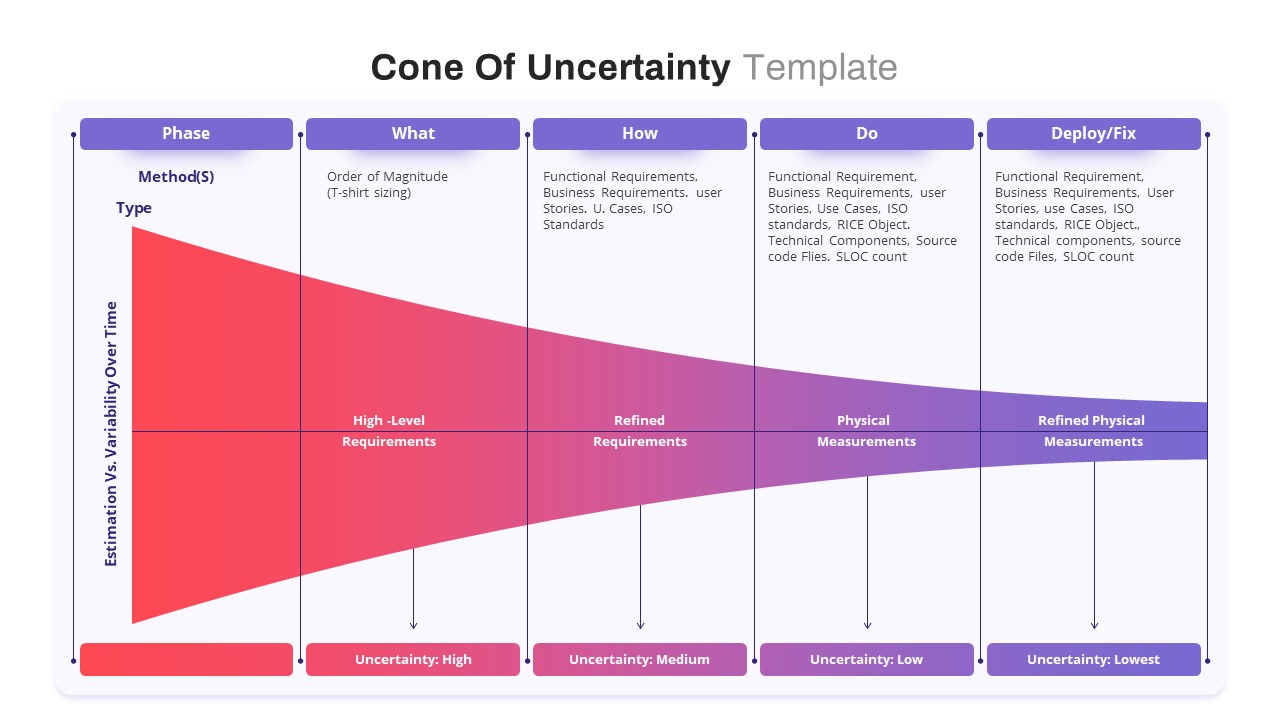
Cone of Uncertainty Process Diagram Template for PowerPoint & Google Slides
Process
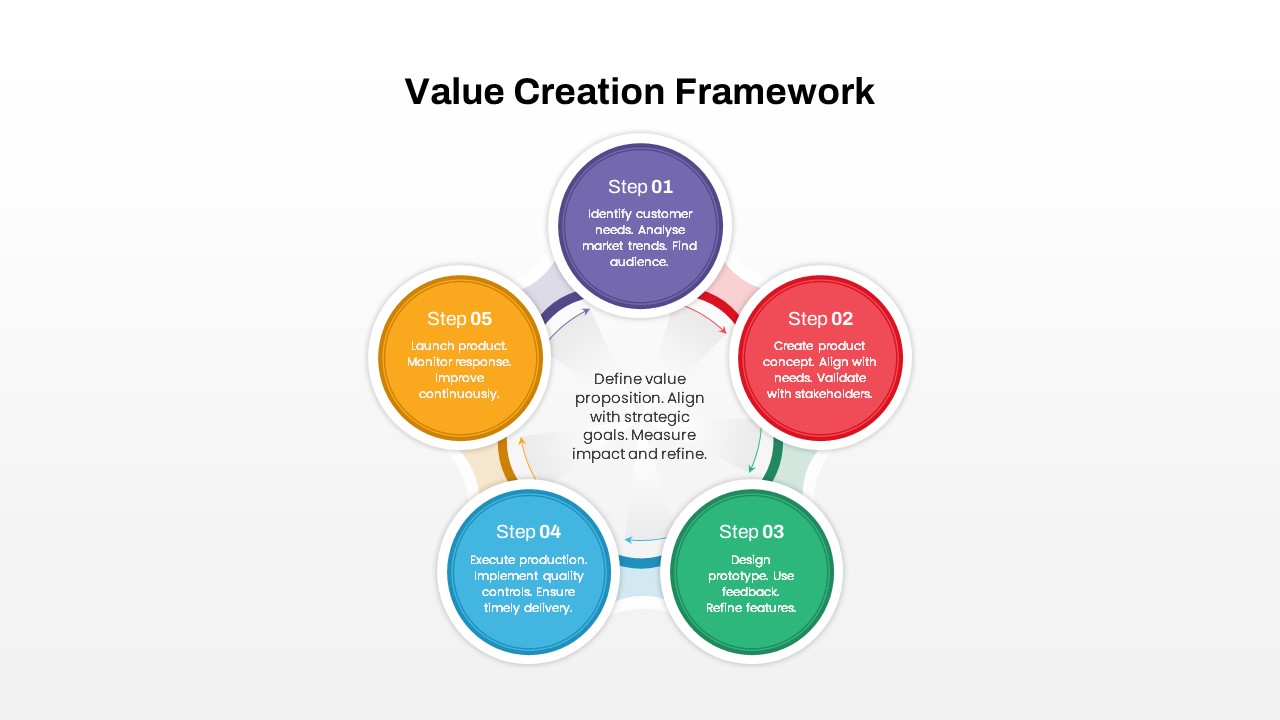
Value Creation Framework Process Diagram Template for PowerPoint & Google Slides
Business Plan
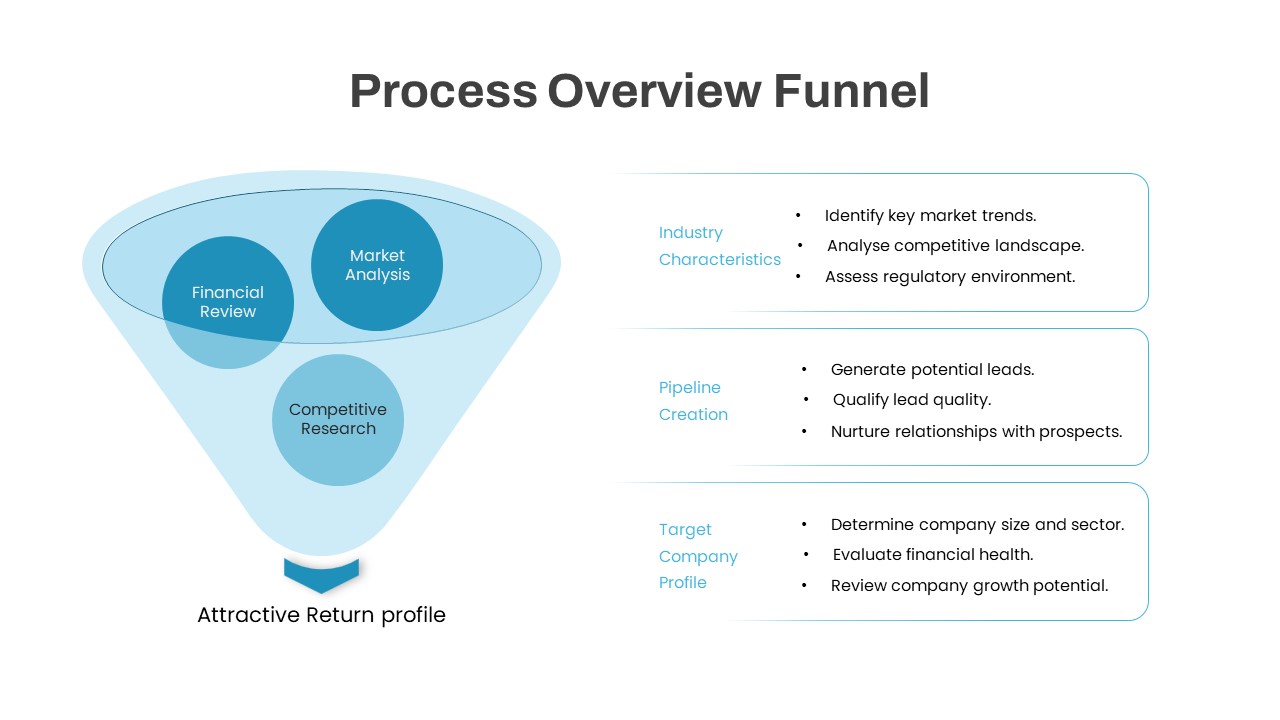
Process Overview Funnel Diagram Template for PowerPoint & Google Slides
Funnel
Capital Investments Process Flow Diagram Template for PowerPoint & Google Slides
Process
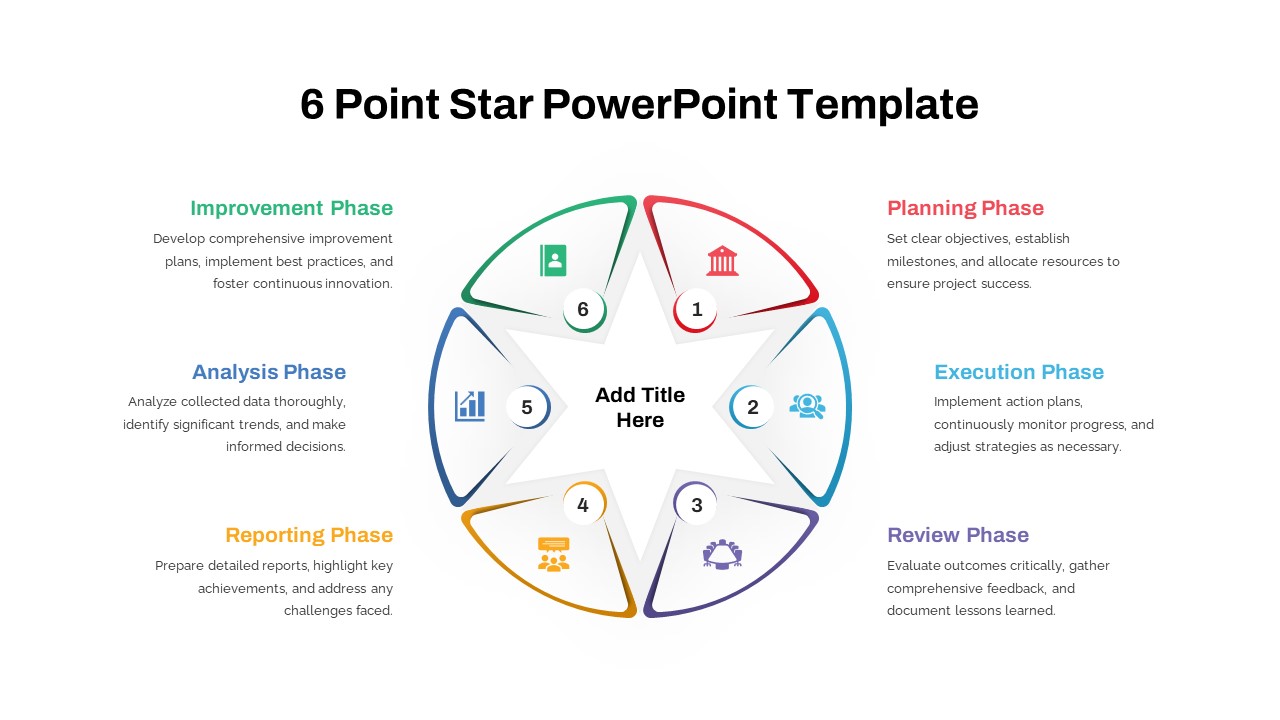
Six-Point Star Process Diagram Template for PowerPoint & Google Slides
Process
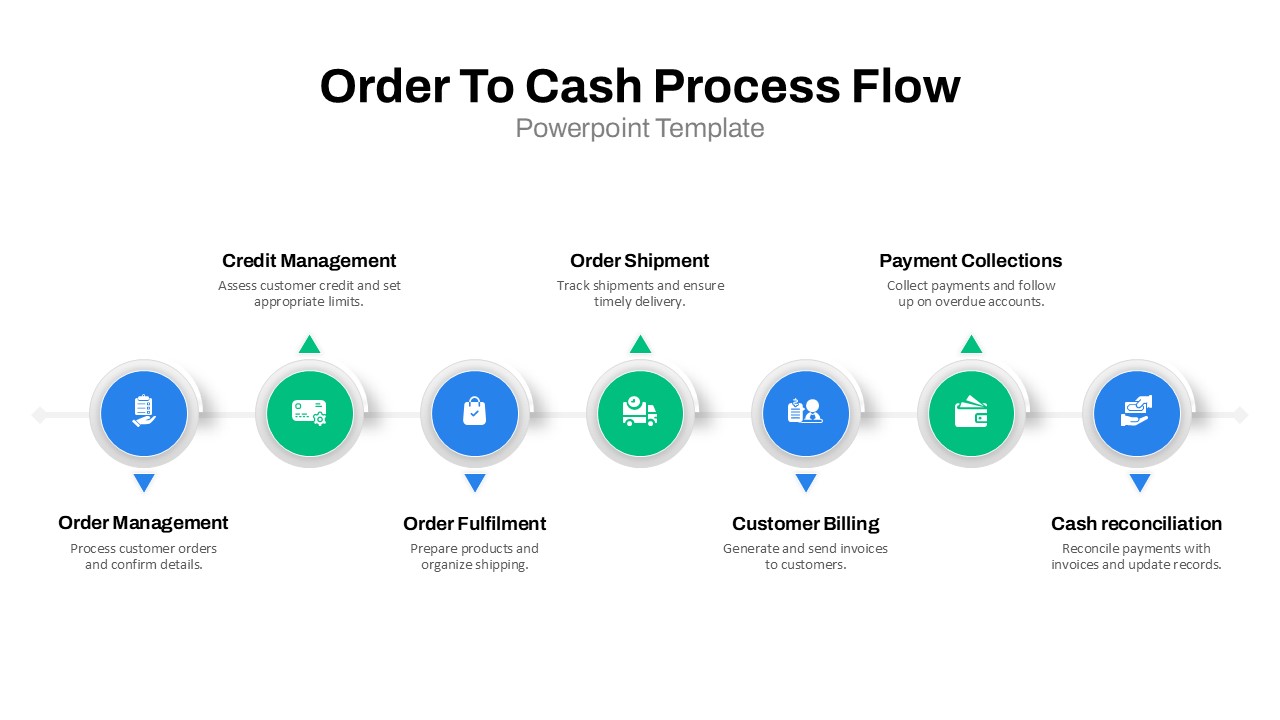
Order to Cash Process Flow Diagram Template for PowerPoint & Google Slides
Process
Bottleneck Process Analysis Diagram Template for PowerPoint & Google Slides
Process
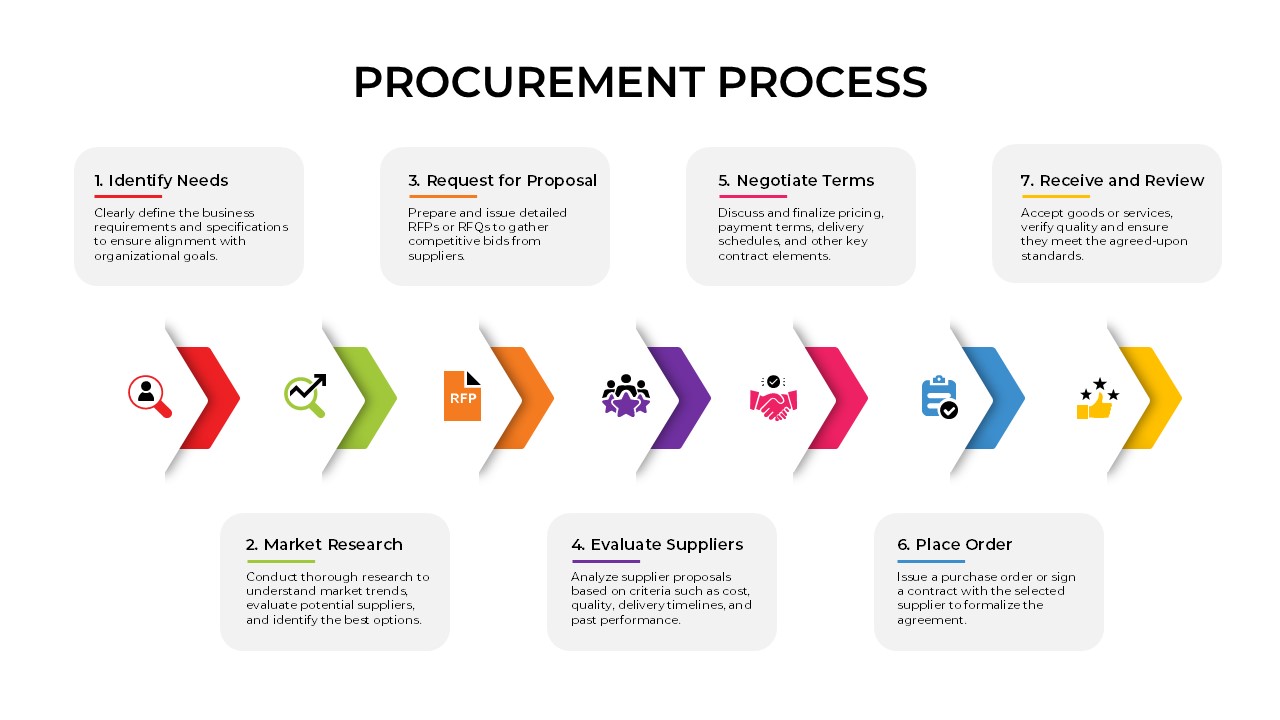
Seven-Step Procurement Process Diagram Template for PowerPoint & Google Slides
Process
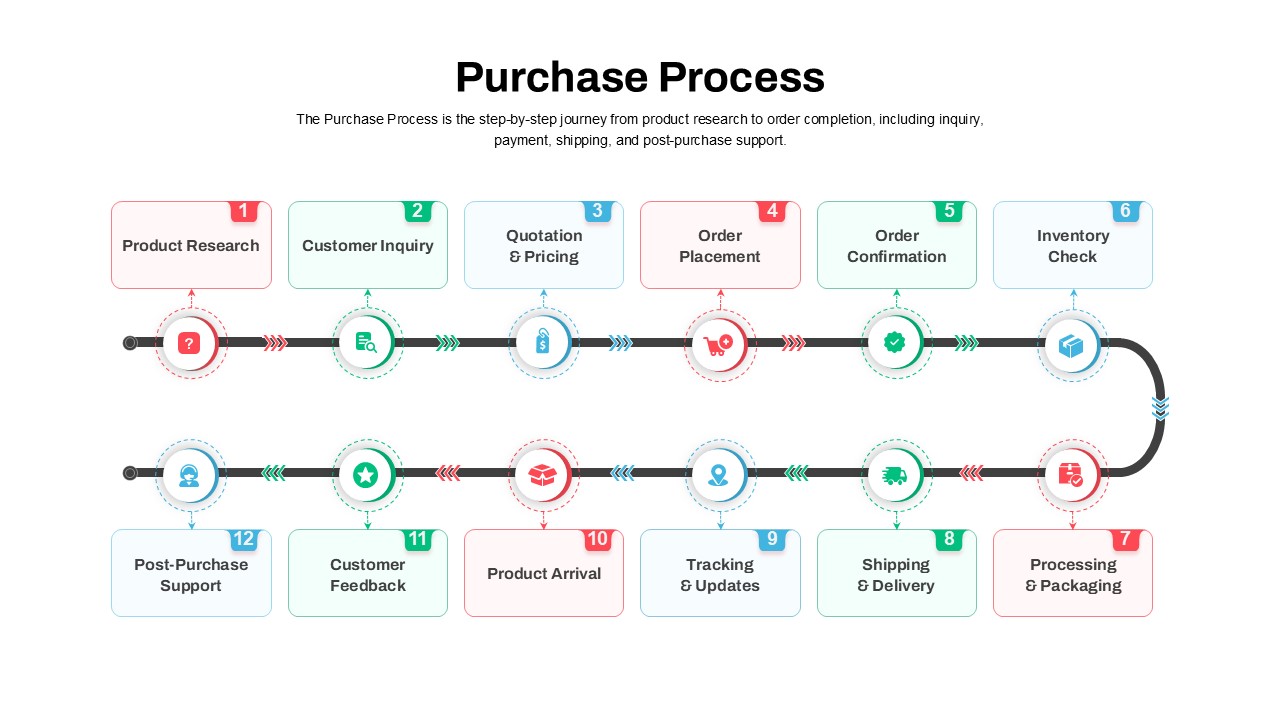
Streamlined Purchase Process Diagram Template for PowerPoint & Google Slides
Timeline
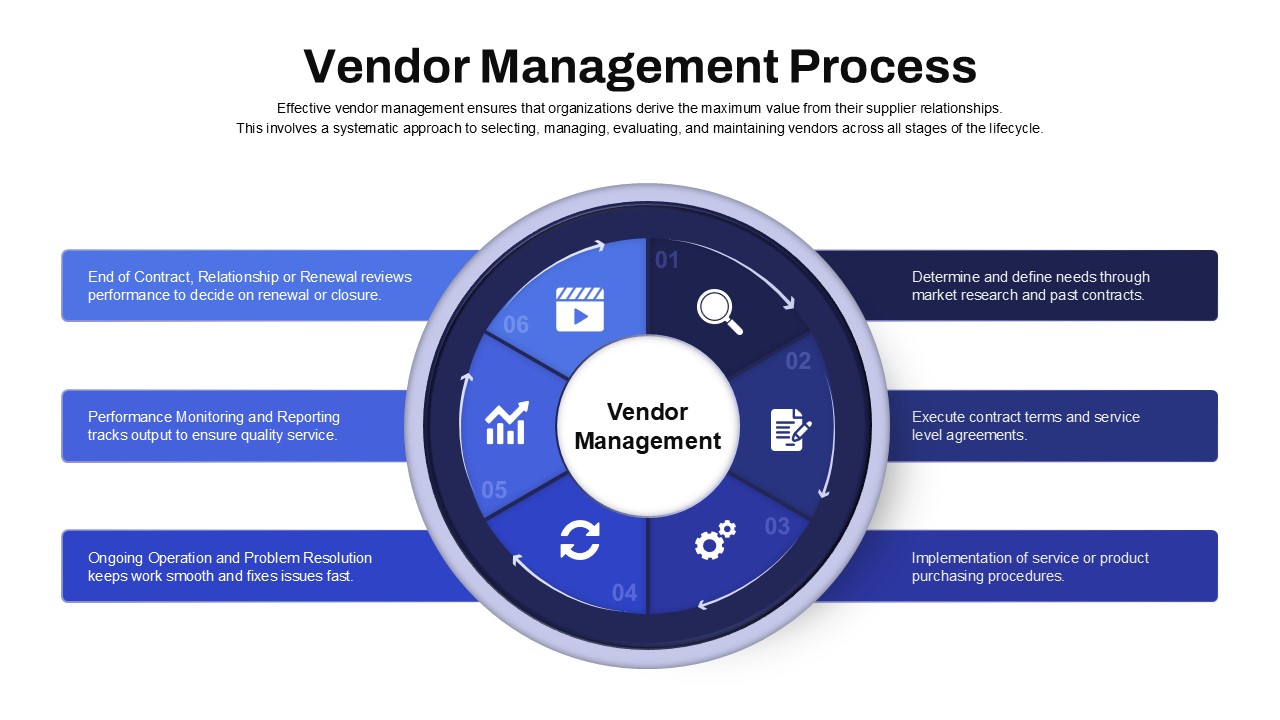
Vendor Management Process Diagram Template for PowerPoint & Google Slides
Process
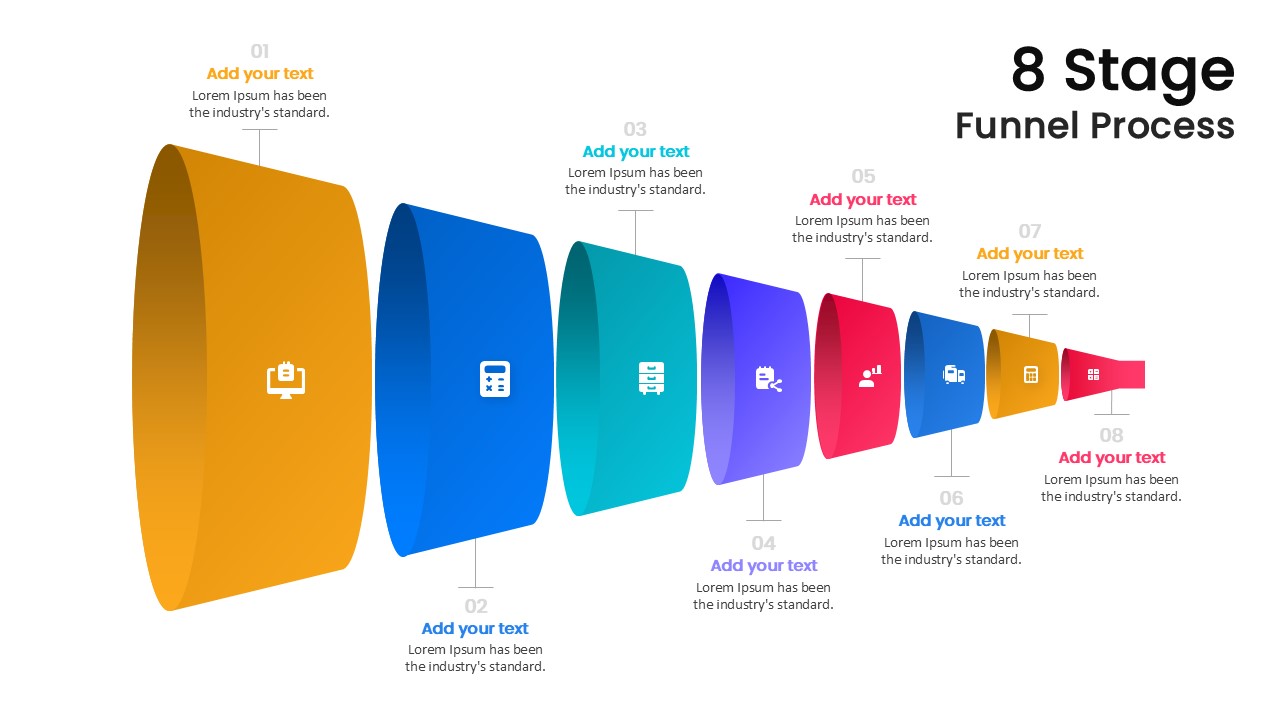
Modern 8-Stage Funnel Process Diagram Template for PowerPoint & Google Slides
Funnel
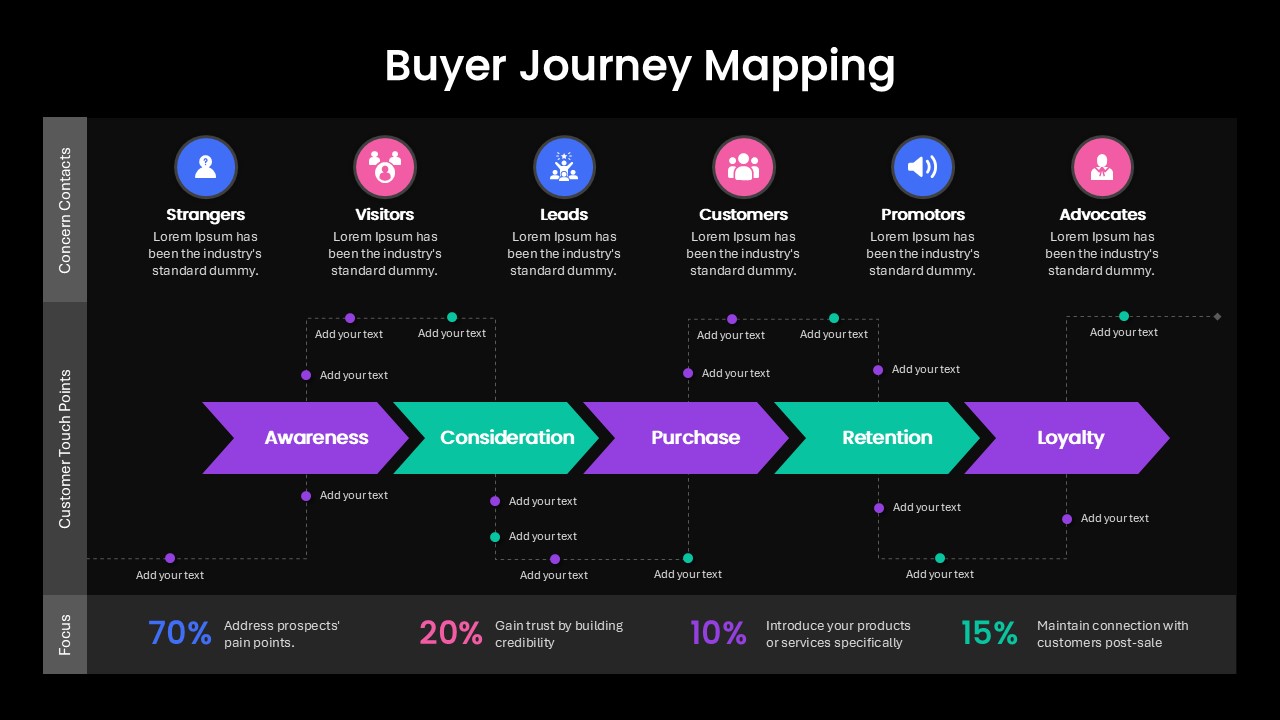
Buyer Journey Mapping Process Diagram Template for PowerPoint & Google Slides
Process
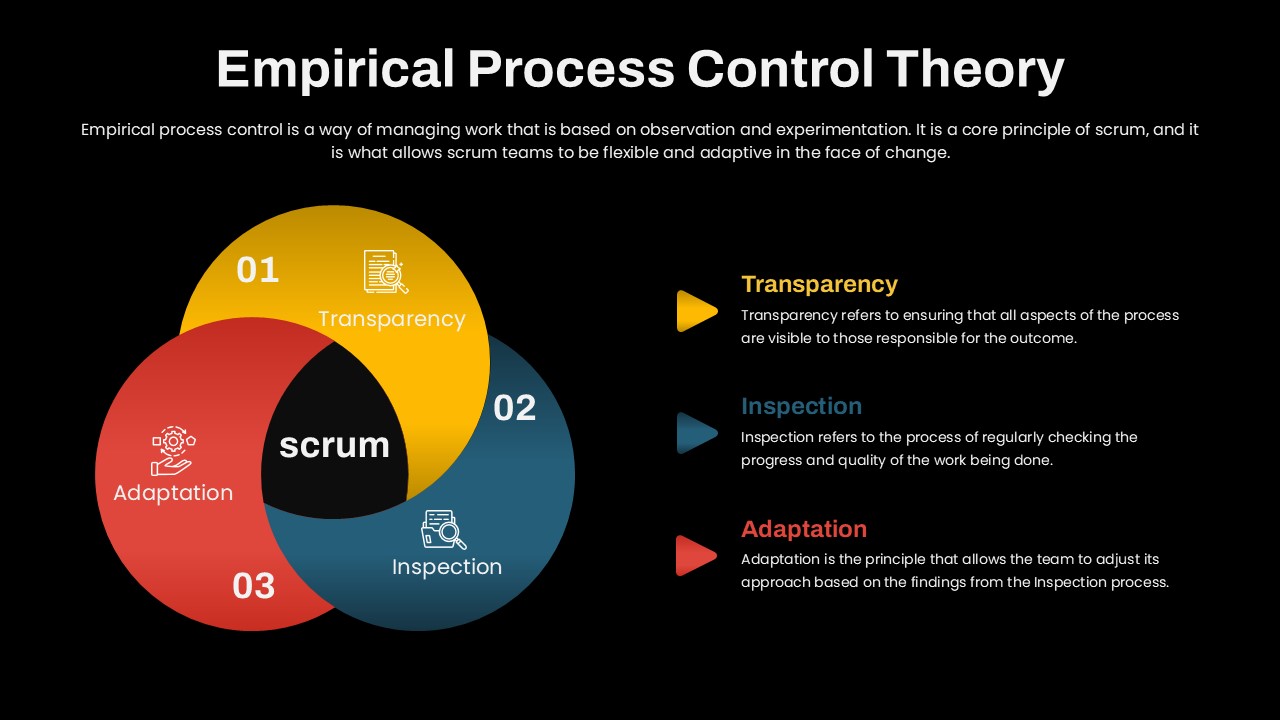
Empirical Process Control Theory Diagram Template for PowerPoint & Google Slides
Circular
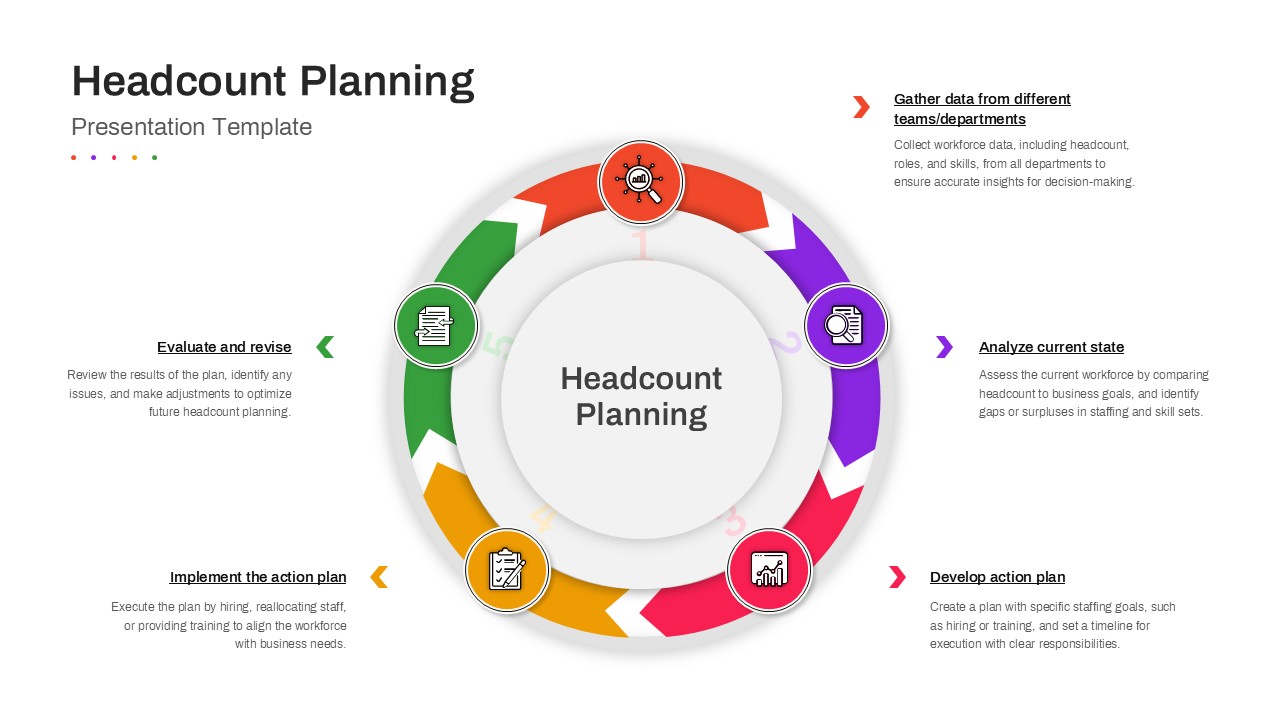
Headcount Planning Circular Process Diagram Template for PowerPoint & Google Slides
HR