Underwater Fishbone Cause-Effect Diagram Template for PowerPoint & Google Slides


Description
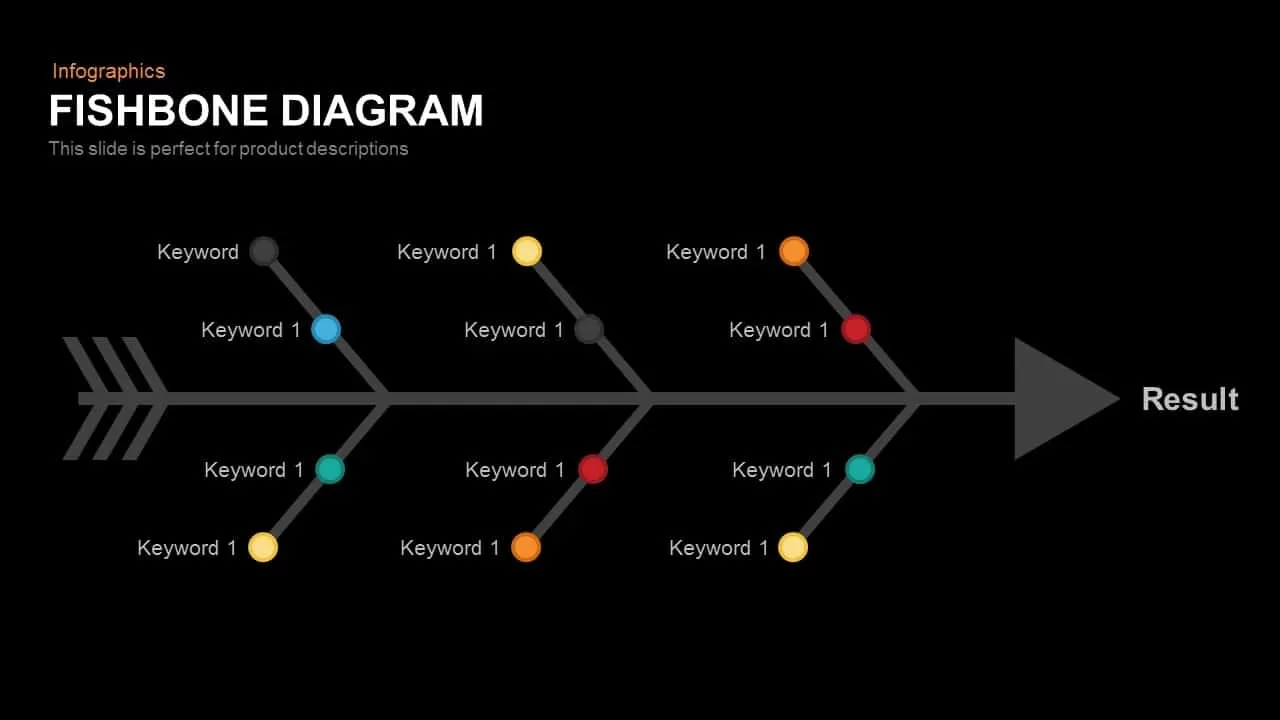
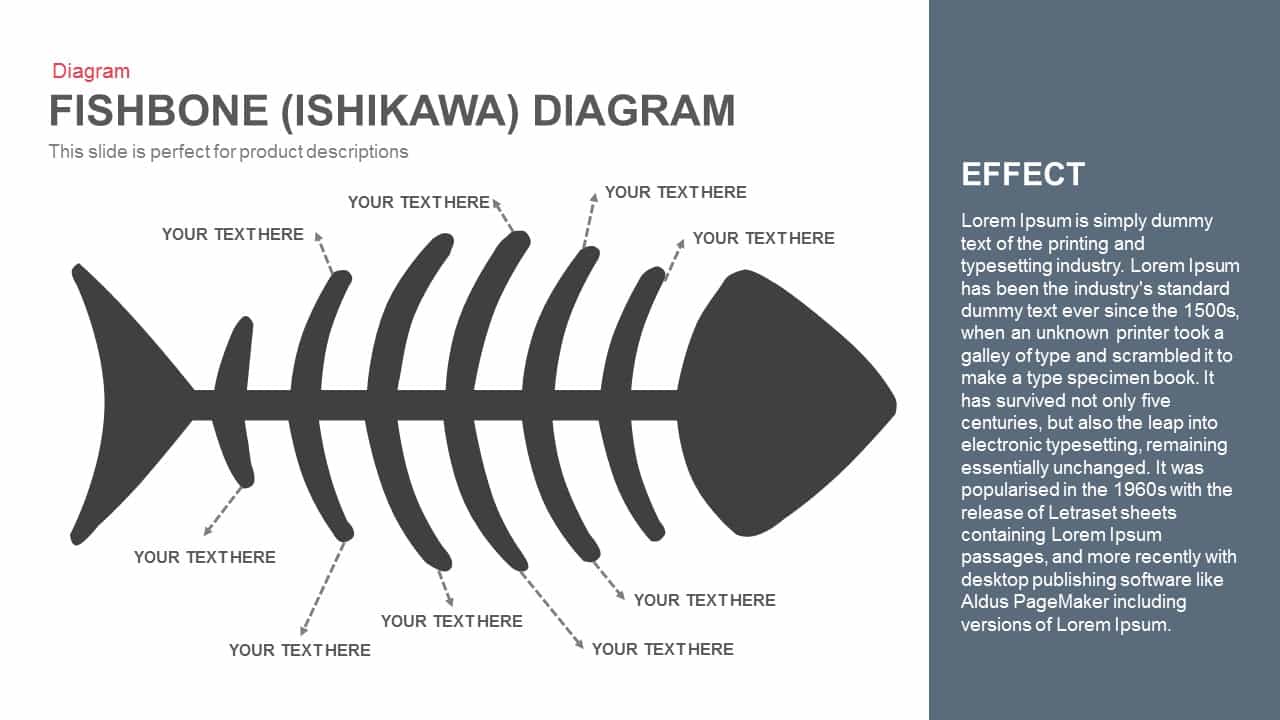
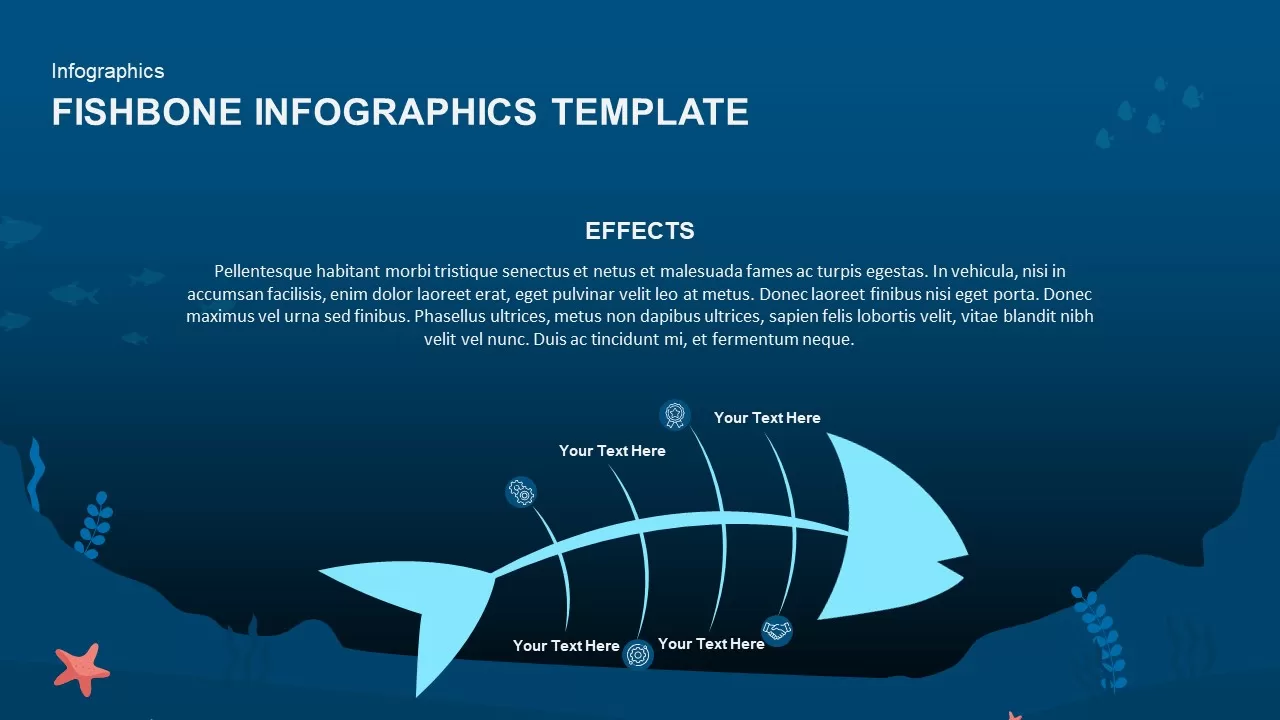
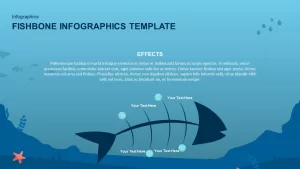
Equip your presentations with a versatile fishbone infographic to analyze root causes and effects in a single, visually engaging layout. This underwater-themed slide features a deep blue gradient background accented by subtle fish silhouettes and seabed motifs, establishing a calm yet professional tone. The central spine resembles a fish skeleton, with six angular ribs extending outward—each equipped with an icon placeholder, colorful accent dots, and dashed connectors to text callouts. At the head, a prominent arrow directs attention to your core effect or outcome label, while each rib identifies an individual cause.
Built in PowerPoint and Google Slides on master layouts, this fishbone template offers seamless customization. Update theme colors to match your brand palette, swap icons via the integrated icon library, change fonts in seconds, and relabel callouts with a single click. Vector-based shapes allow infinite resizing without loss of quality, and grouped elements ensure connectors adjust automatically when items are repositioned. Preconfigured light and dark mode variants guarantee high-contrast readability in any environment. Use progressive entrance animations to reveal the central effect first, then introduce each cause sequentially—guiding your audience through your analysis with clarity and impact.
Beyond root-cause investigations, this slide supports quality assurance workshops, risk assessments, marketing problem-solving sessions, and strategic planning briefings. Simply duplicate the slide to compare scenarios side by side, adjust rib angles, or hide unused segments to tailor the diagram for fewer or additional factors. By combining clear iconography, balanced whitespace, and professional typography, you can drive collaborative discussions, streamline decision-making, and enhance stakeholder buy-in.
Who is it for
Quality managers, consultants, and project leads will leverage this fishbone diagram to facilitate root-cause analysis, process improvement workshops, and risk-management presentations. Marketing analysts and operational teams can also use it to diagnose performance issues and map corrective actions.
Other Uses
Repurpose this infographic for defect tracking, compliance audits, departmental retrospectives, or product launch debriefs. Adapt the rib labels and icons to illustrate customer pain points, resource bottlenecks, or regulatory challenges—turning complex problems into actionable insights.
Login to download this file

Item ID
SB01987
Related Templates

Fishbone Diagram Cause-and-Effect Template for PowerPoint & Google Slides
Process
Fishbone Cause and Effect Diagram Template for PowerPoint & Google Slides
Process
Fishbone Cause and Effect Infographic Template for PowerPoint & Google Slides
Infographics

Cause and Effect Diagram Infographic Template for PowerPoint & Google Slides
Bar/Column
Five-Input Cause and Effect Diagram Template for PowerPoint & Google Slides
Arrow
Fishbone Cause Analysis Diagram Template for PowerPoint & Google Slides
Process
Free Root Cause Analysis Fishbone Diagram Template for PowerPoint & Google Slides
Process
Free
5 Why Fishbone Diagram for Root Cause Analysis in PowerPoint & Google Slides
Process
Snowball Effect Process Diagram Template for PowerPoint & Google Slides
Process
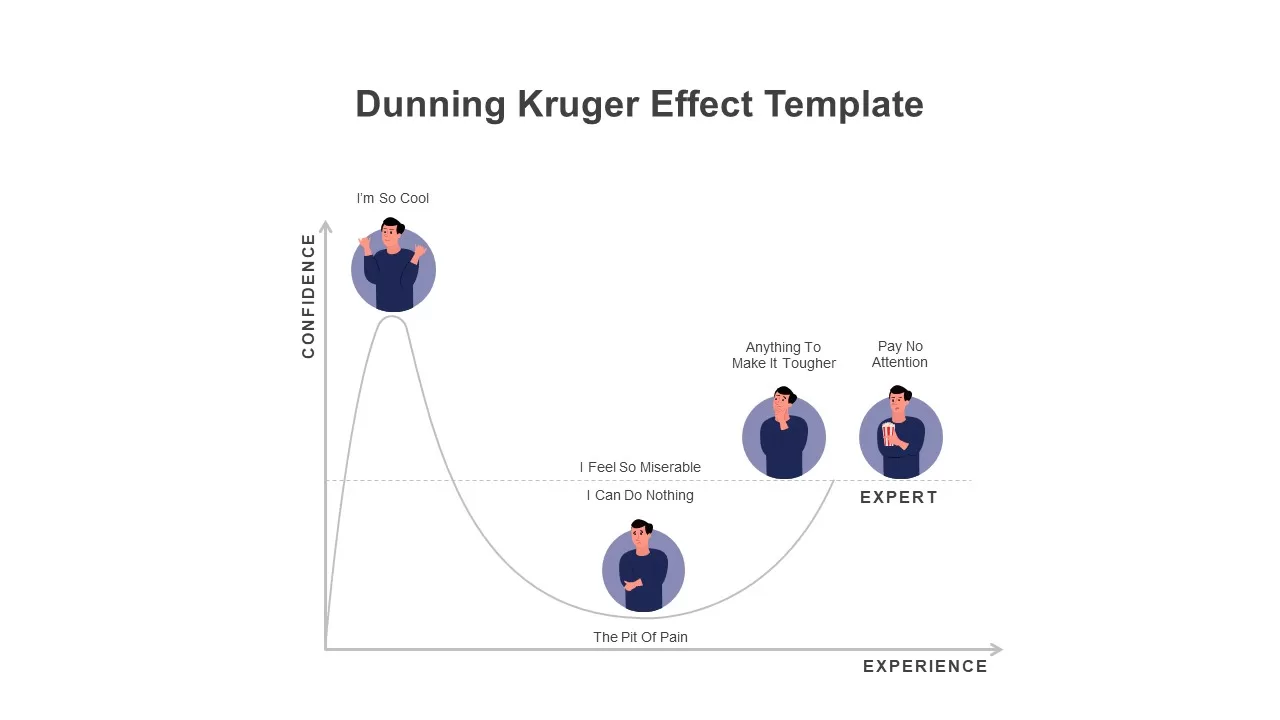
Modern Dunning Kruger Effect Diagram Template for PowerPoint & Google Slides
Business
5Cs of Network Effect Circular Diagram Template for PowerPoint & Google Slides
Circular
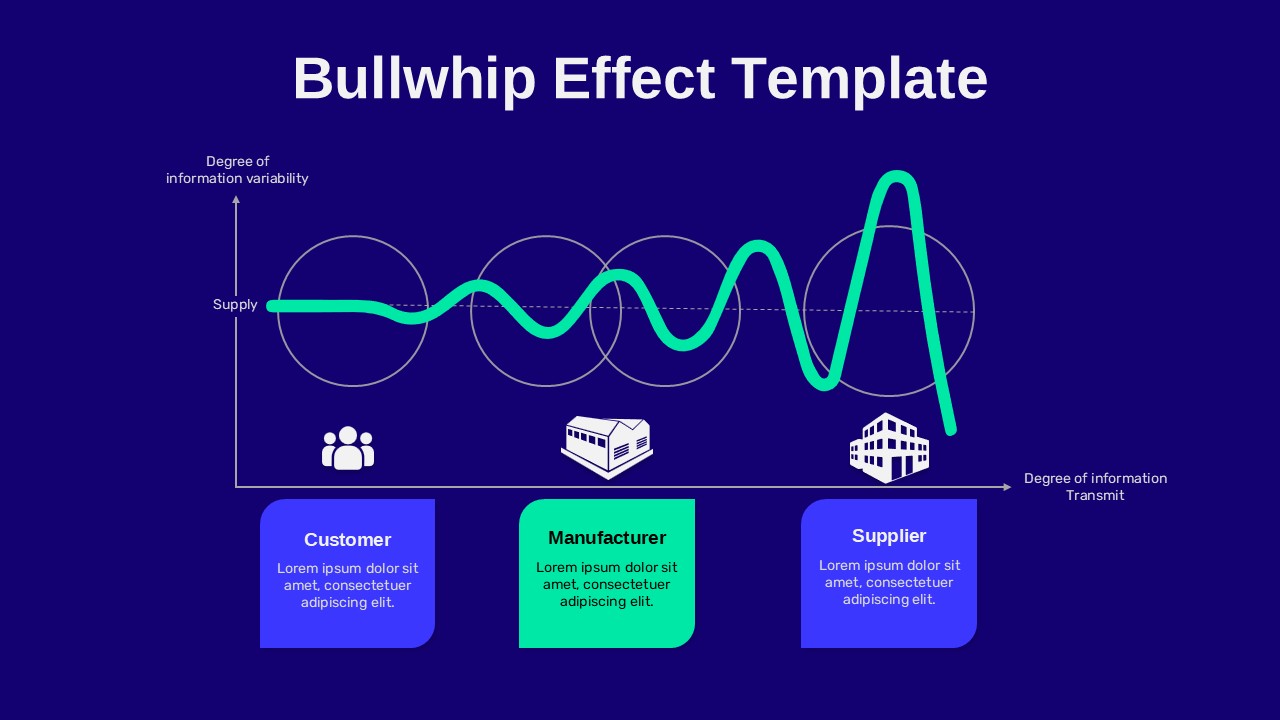
Bullwhip Effect Supply Chain Variability Diagram Template for PowerPoint & Google Slides
Business Models
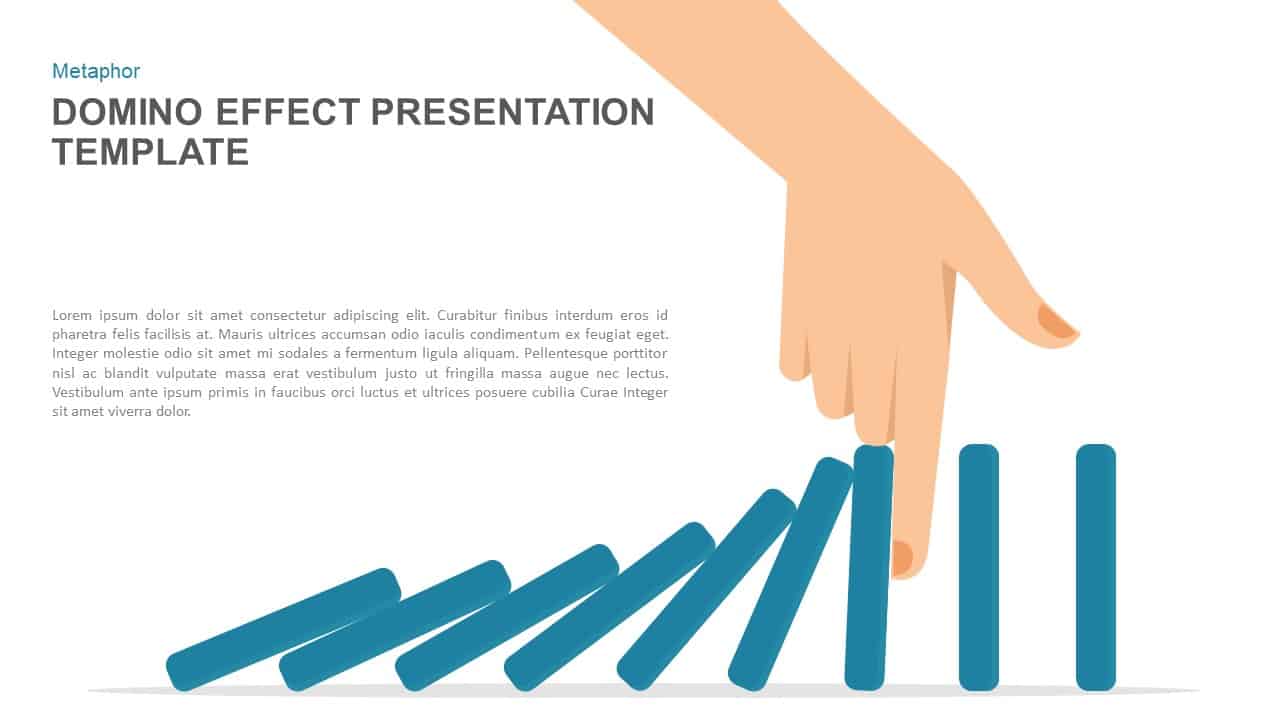
Domino Effect Prevention Presentation Template for PowerPoint & Google Slides
Process
Domino Effect Sequential Infographics Template for PowerPoint & Google Slides
Process
Three-Section Fishbone Process Diagram template for PowerPoint & Google Slides
Process
Fishbone RCA Diagram Template for PowerPoint & Google Slides
Business Strategy
Fishbone Diagram Overview template for PowerPoint & Google Slides
Infographics
Free Color-Coded Fishbone Diagram Template for PowerPoint & Google Slides
Project
Free
Fishbone Diagram Analysis Template for PowerPoint & Google Slides
Flow Charts
Fishbone Process Diagram template for PowerPoint & Google Slides
Infographics
Fishbone (Ishikawa) Diagram for PowerPoint & Google Slides
Process
Fishbone Timeline Infographic Series Template for PowerPoint & Google Slides
Manufacturing
Root Cause Analysis PowerPoint & Google Slides Template for Presentations
Business Strategy
Sky and Tree Root Cause Analysis Deck Template for PowerPoint & Google Slides
Opportunities Challenges
Root Cause Analysis Infographic Pack Template for PowerPoint & Google Slides
Process
Snake Diagram Pack of 8 Slides template for PowerPoint & Google Slides
Process
Gear Process Diagram PowerPoint Template for PowerPoint & Google Slides
Process
Sales Process Workflow Funnel Diagram PowerPoint Template for PowerPoint & Google Slides
Funnel
Puzzle Diagram PowerPoint Template for PowerPoint & Google Slides
Process
Transportation Logistics PowerPoint Diagram template for PowerPoint & Google Slides
Process
Emoji Scale PowerPoint Diagram for PowerPoint & Google Slides
Infographics
4 Step Problem Solving PowerPoint Diagram for PowerPoint & Google Slides
Process
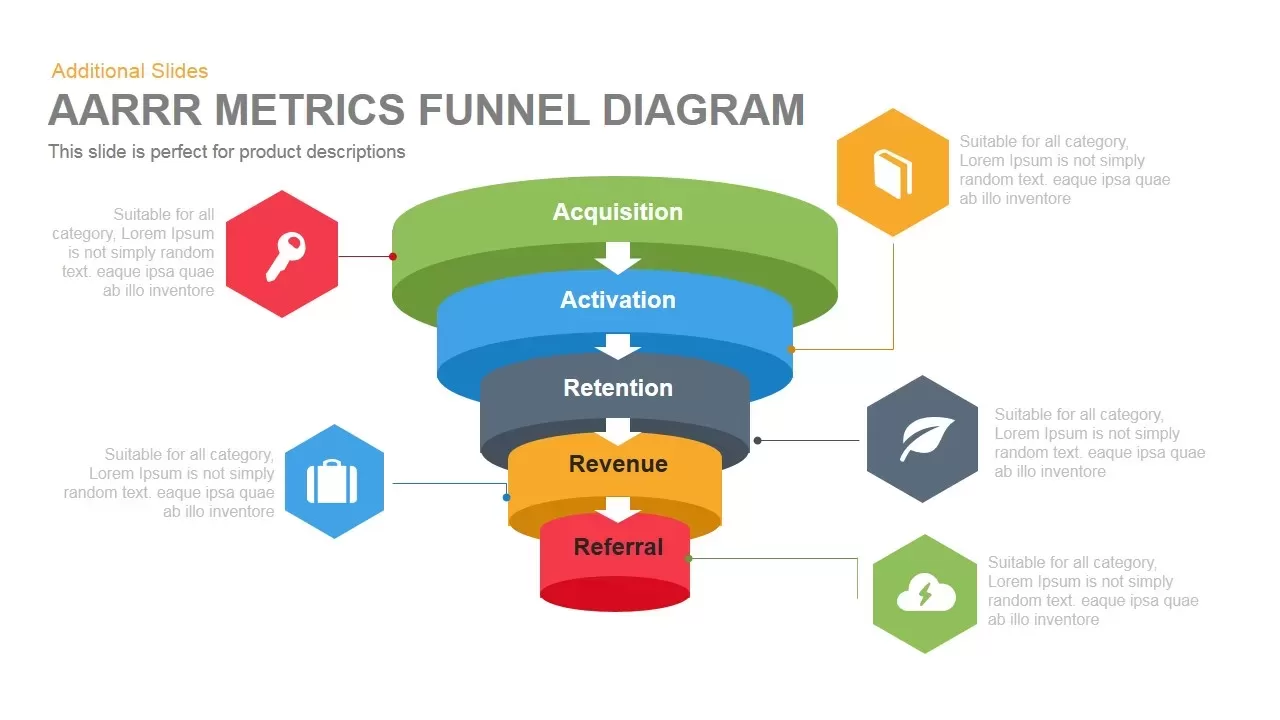
AARRR Funnel Diagram template for PowerPoint & Google Slides
Funnel
Circular Flow Diagram Template for PowerPoint & Google Slides
Infographics
Six Hexagon Stages Process Flow Diagram Template for PowerPoint & Google Slides
Process
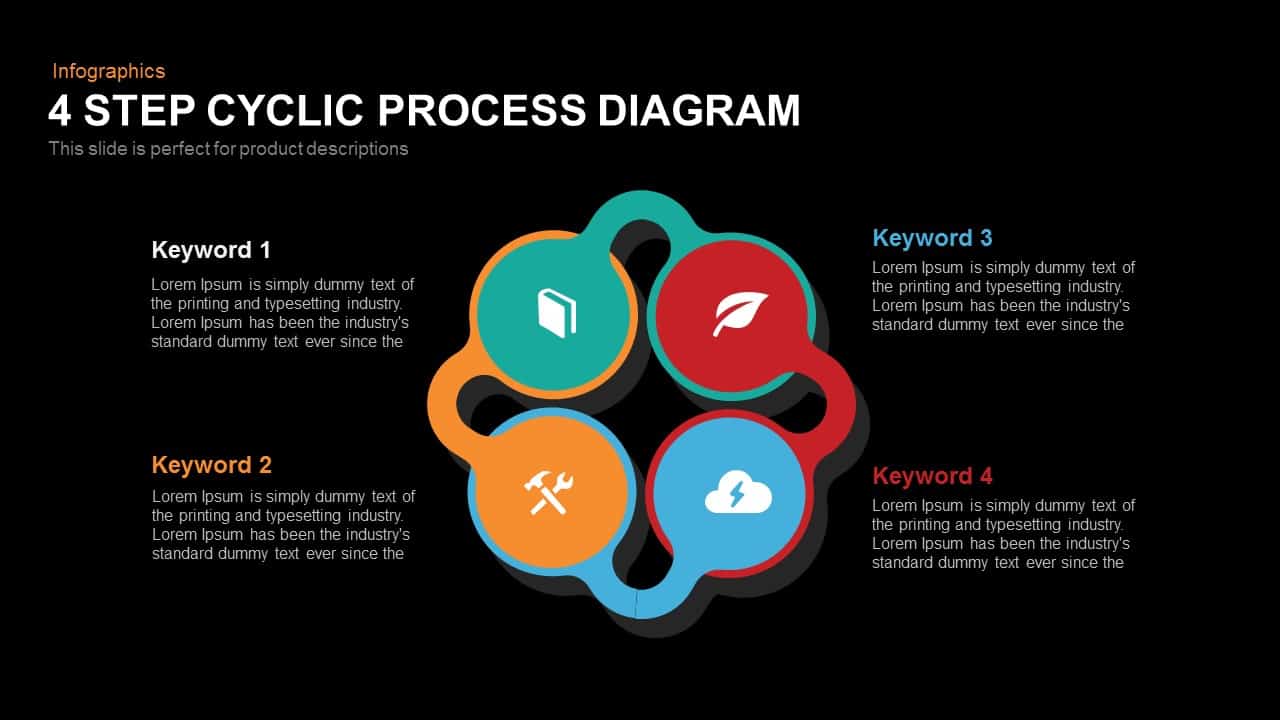
Modern 4-Step Cyclic Process Diagram Template for PowerPoint & Google Slides
Circular
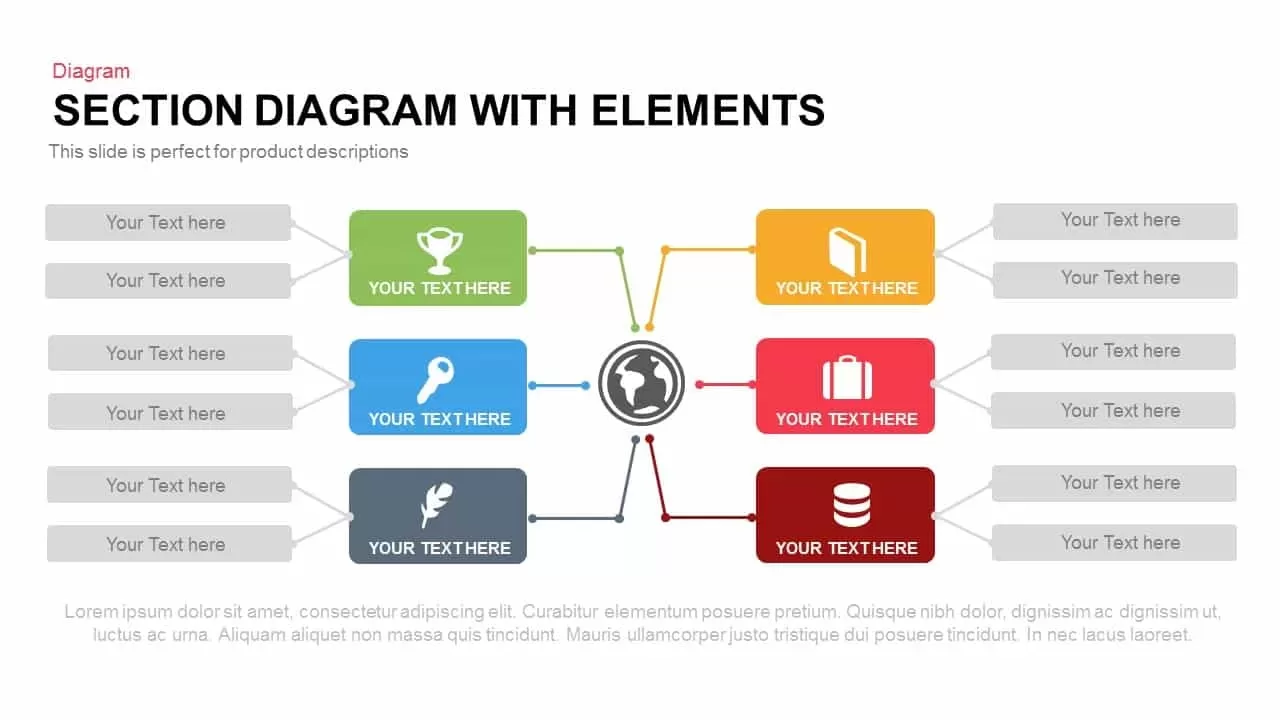
Section Diagram Elements Infographic Template for PowerPoint & Google Slides
Process
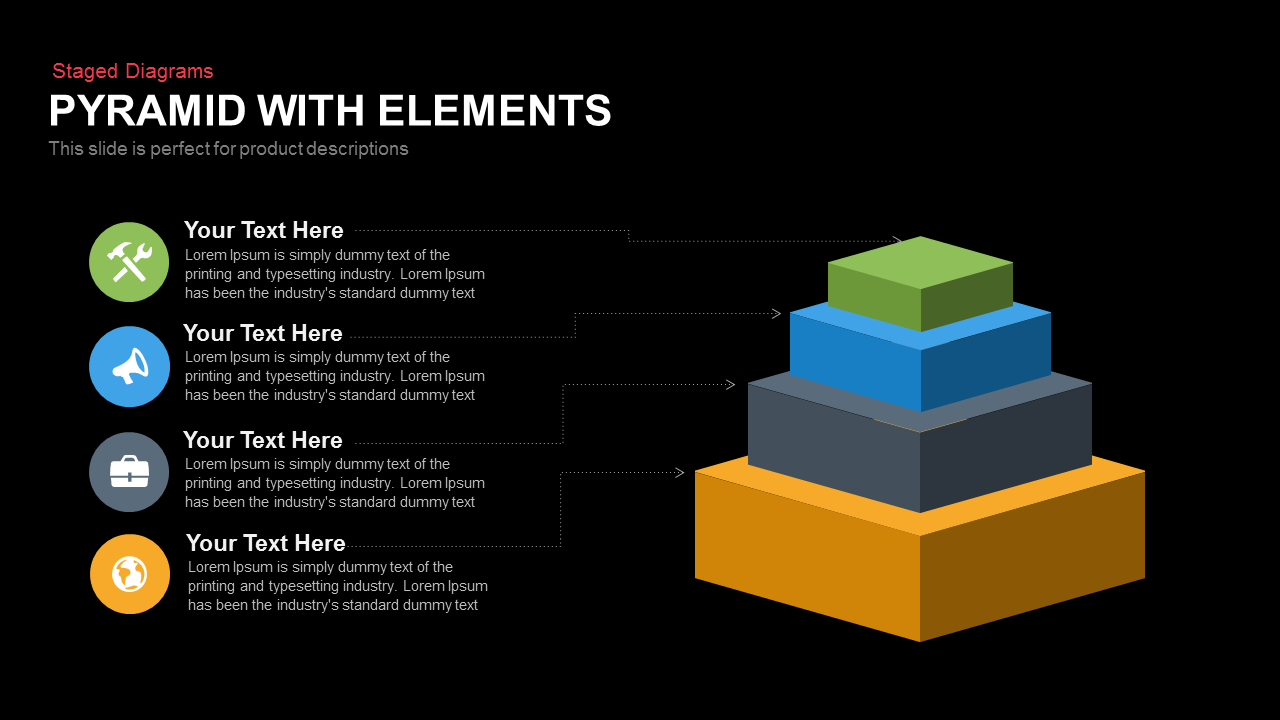
4-Step 3D Pyramid Diagram with Callouts template for PowerPoint & Google Slides
Pyramid
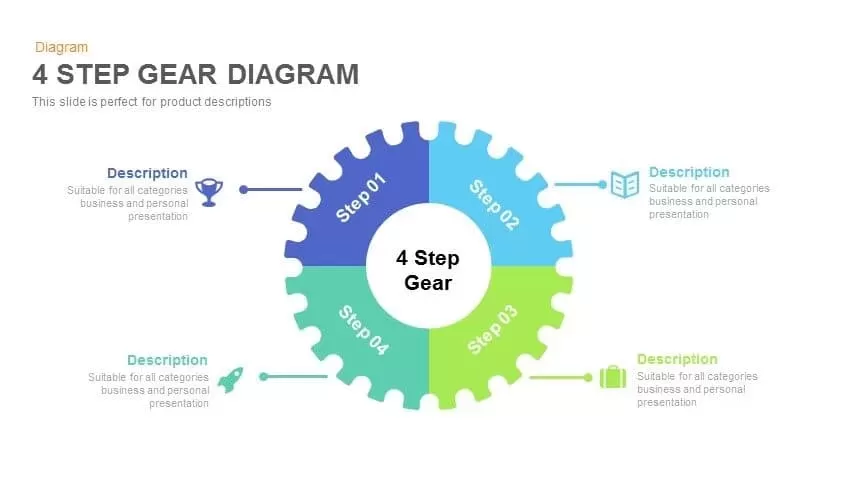
4 Step Gear Diagram Template for PowerPoint & Google Slides
Process

Pie Segment Diagram Four-Step Process Template for PowerPoint & Google Slides
Pie/Donut
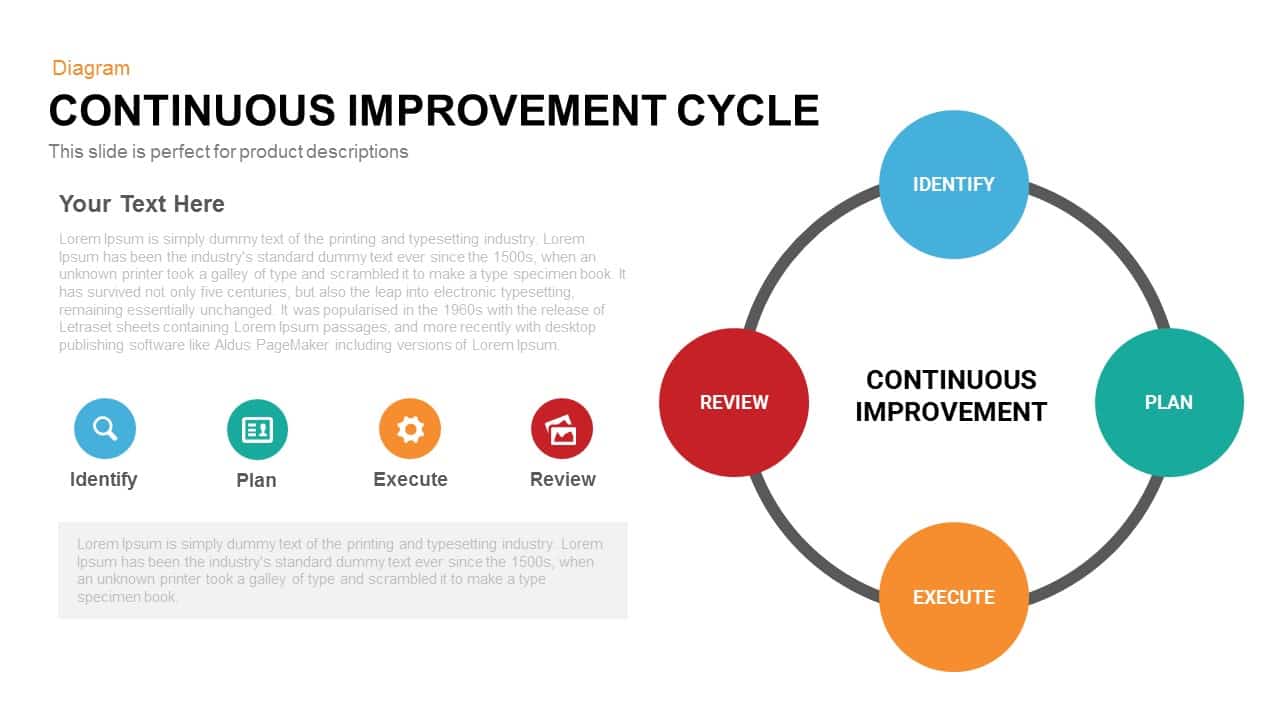
Continuous Improvement Cycle Diagram Template for PowerPoint & Google Slides
Circular
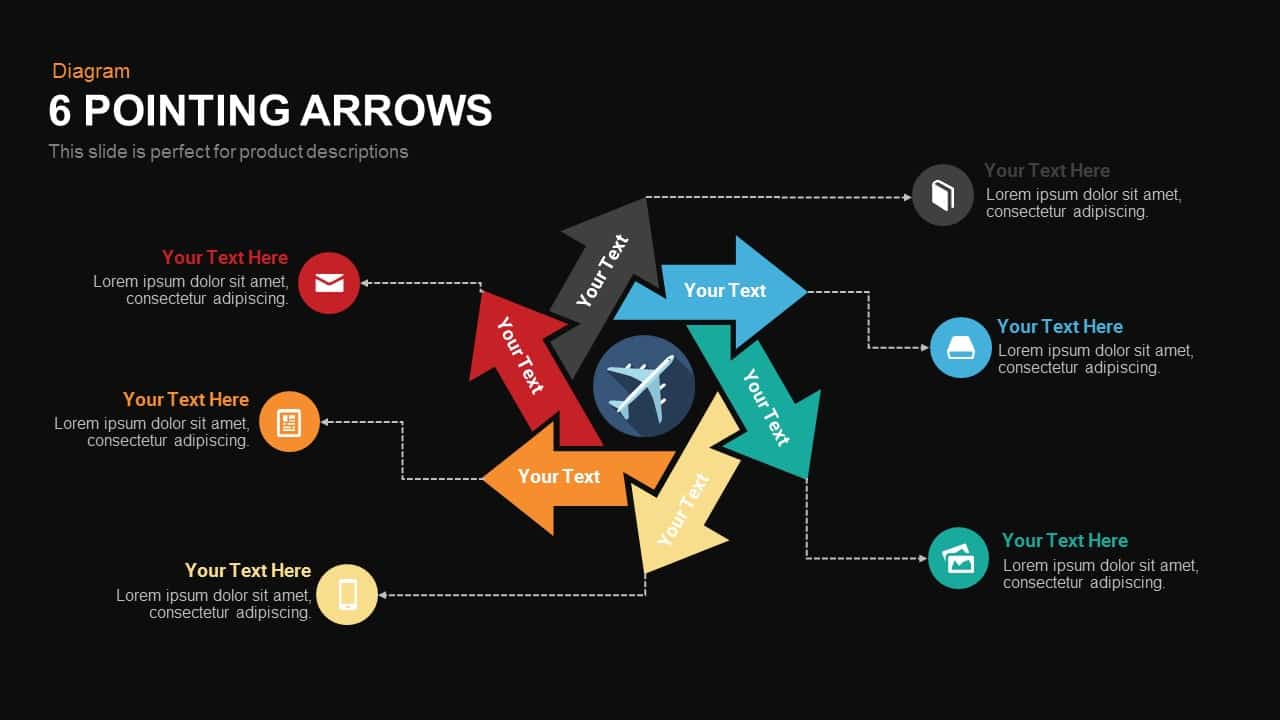
Six Pointing Arrow Process Diagram Template for PowerPoint & Google Slides
Arrow
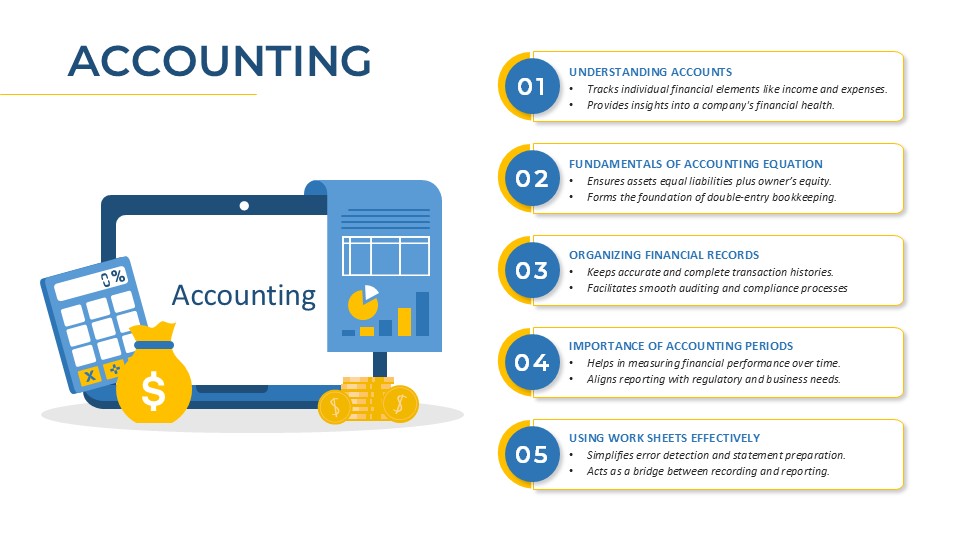
Accounting Process Metaphor Diagram Template for PowerPoint & Google Slides
Accounting
Five-Section Arrow Signpost Diagram Template for PowerPoint & Google Slides
Arrow
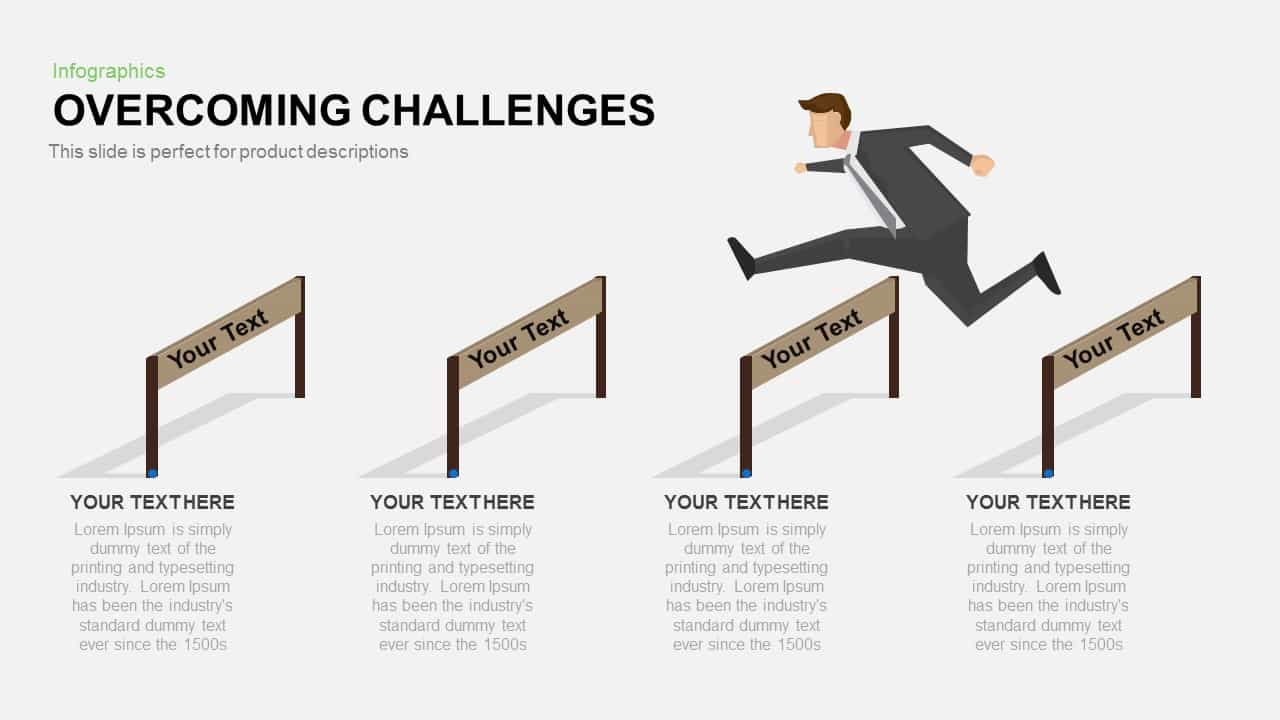
Overcoming Challenges Hurdle Diagram Template for PowerPoint & Google Slides
Process
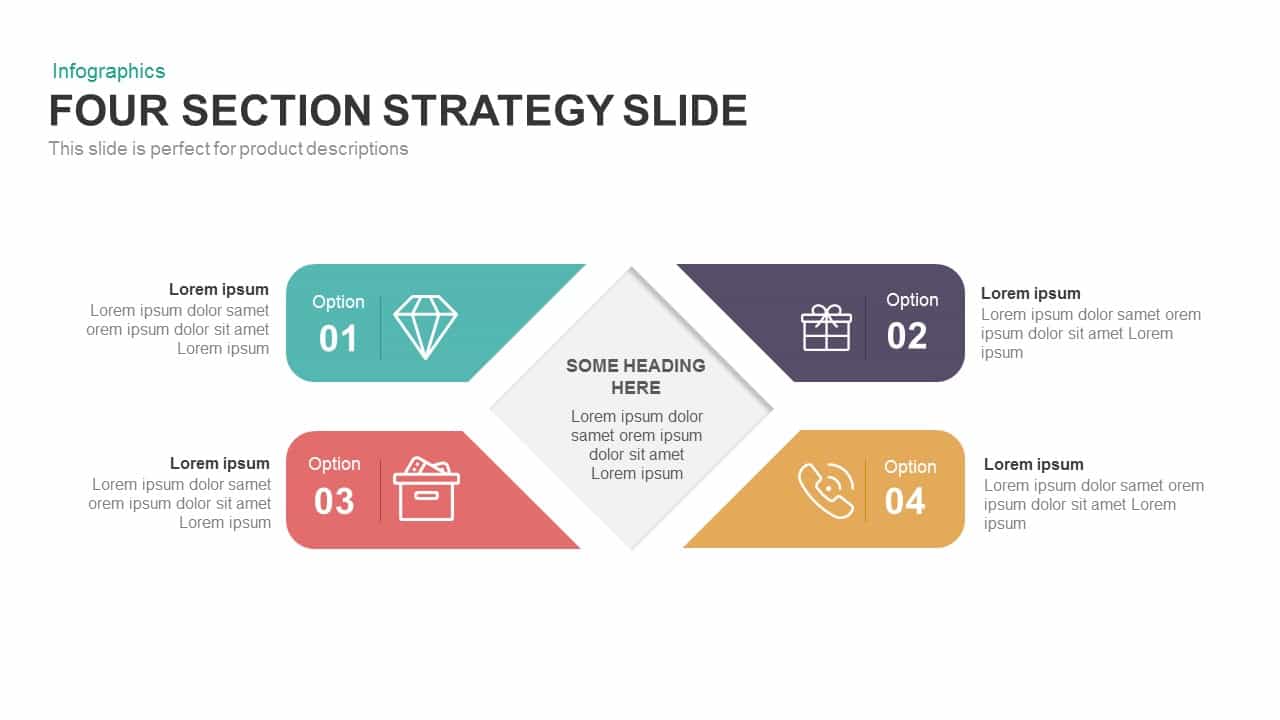
Four-Section Strategy Diagram Slide Template for PowerPoint & Google Slides
Business Strategy
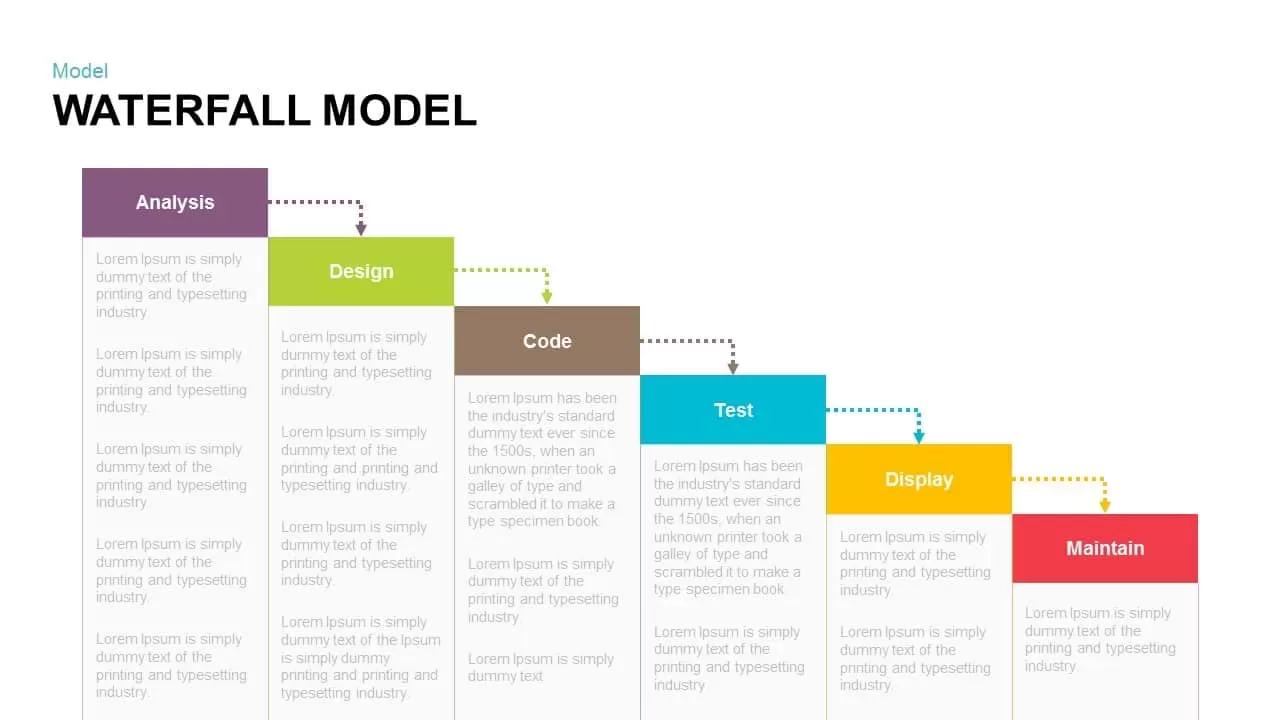
Waterfall Model Diagram Template for PowerPoint & Google Slides
Information Technology
10 Stage Strategic Plan Diagram template for PowerPoint & Google Slides
Process

Elegant Process Support Arrow Diagram Template for PowerPoint & Google Slides
Arrow
Roadmap Diagram template for PowerPoint & Google Slides
Roadmap
Six Hexagon Hub-and-Spoke Diagram Template for PowerPoint & Google Slides
Process
Puzzle-Style SWOT Analysis Table Diagram Template for PowerPoint & Google Slides
SWOT
Eight-Stage Radial Process Flow Diagram Template for PowerPoint & Google Slides
Process
Ten-Stage Business Process Diagram Template for PowerPoint & Google Slides
Process
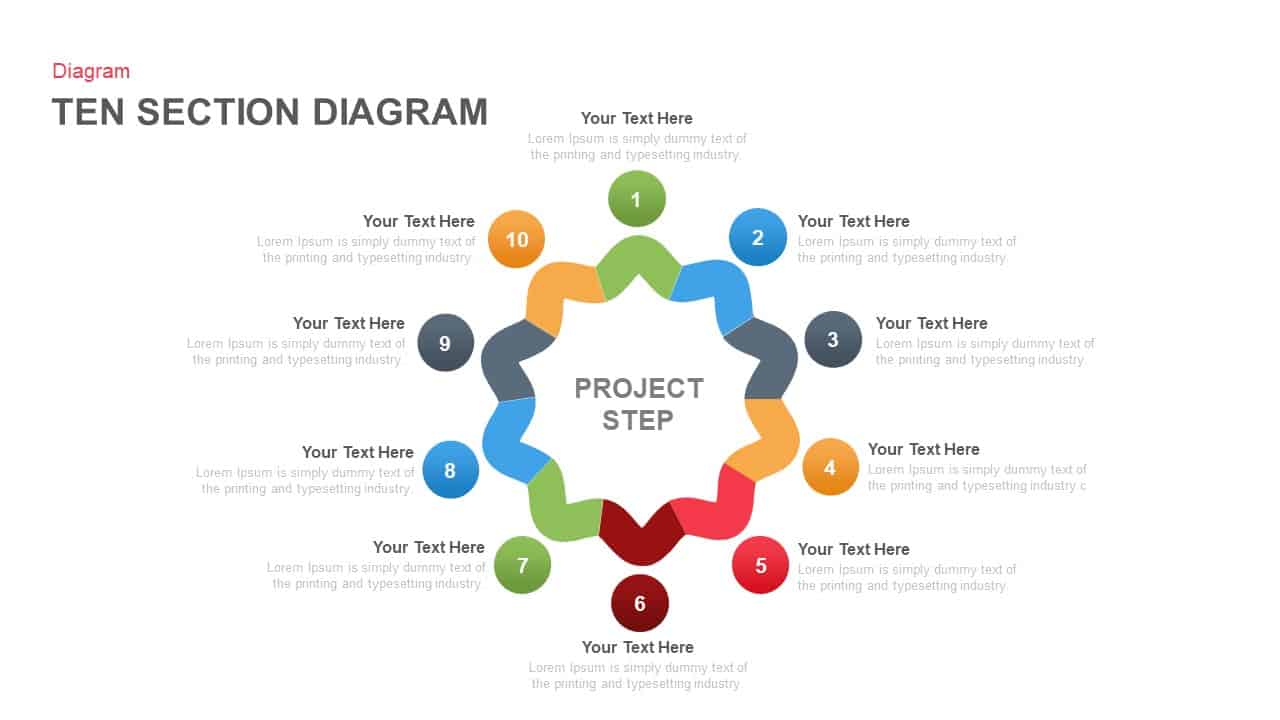
Ten-Section Project Steps Diagram Template for PowerPoint & Google Slides
Process
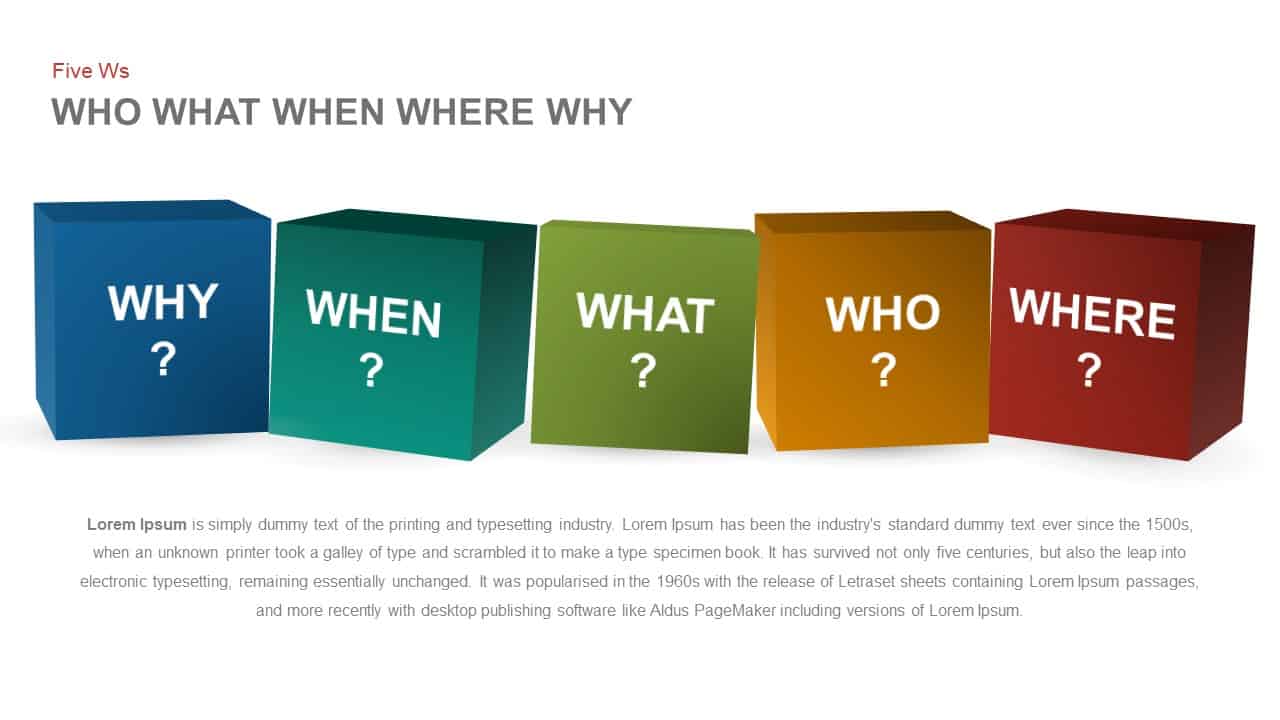
Five Ws Framework Cube Diagram Template for PowerPoint & Google Slides
Comparison
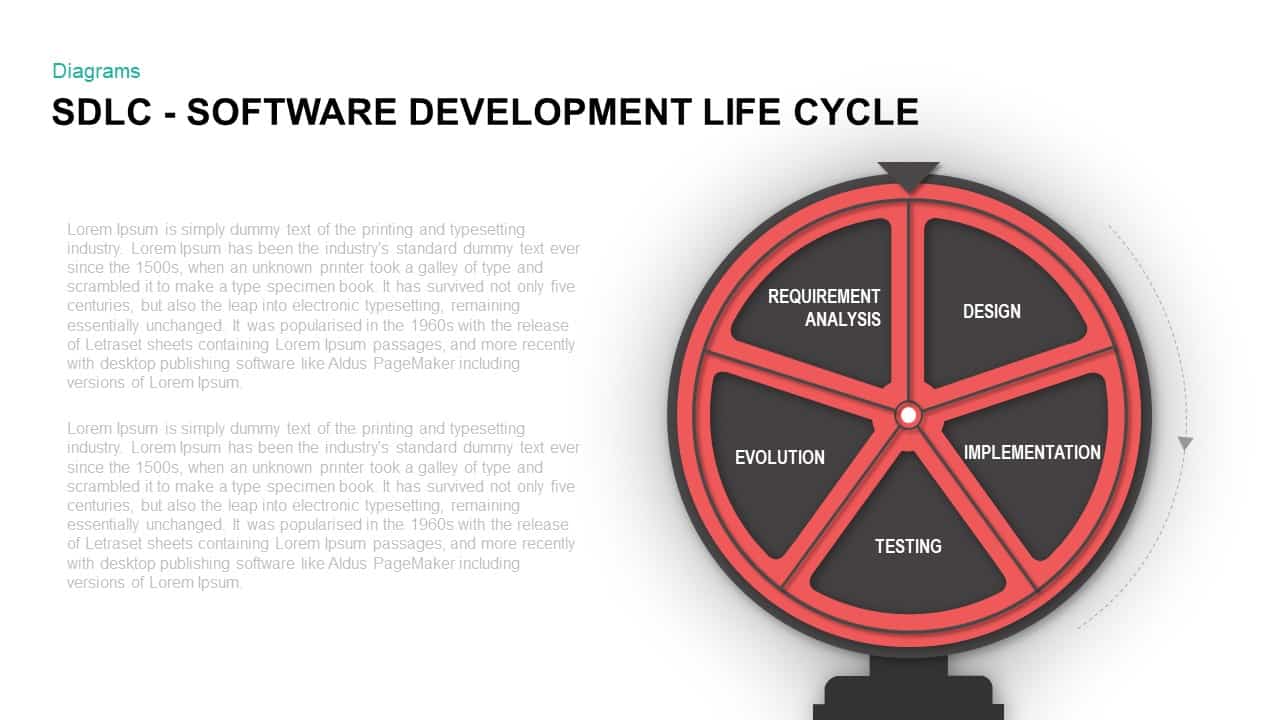
Software Development Life Cycle Diagram Template for PowerPoint & Google Slides
Circular
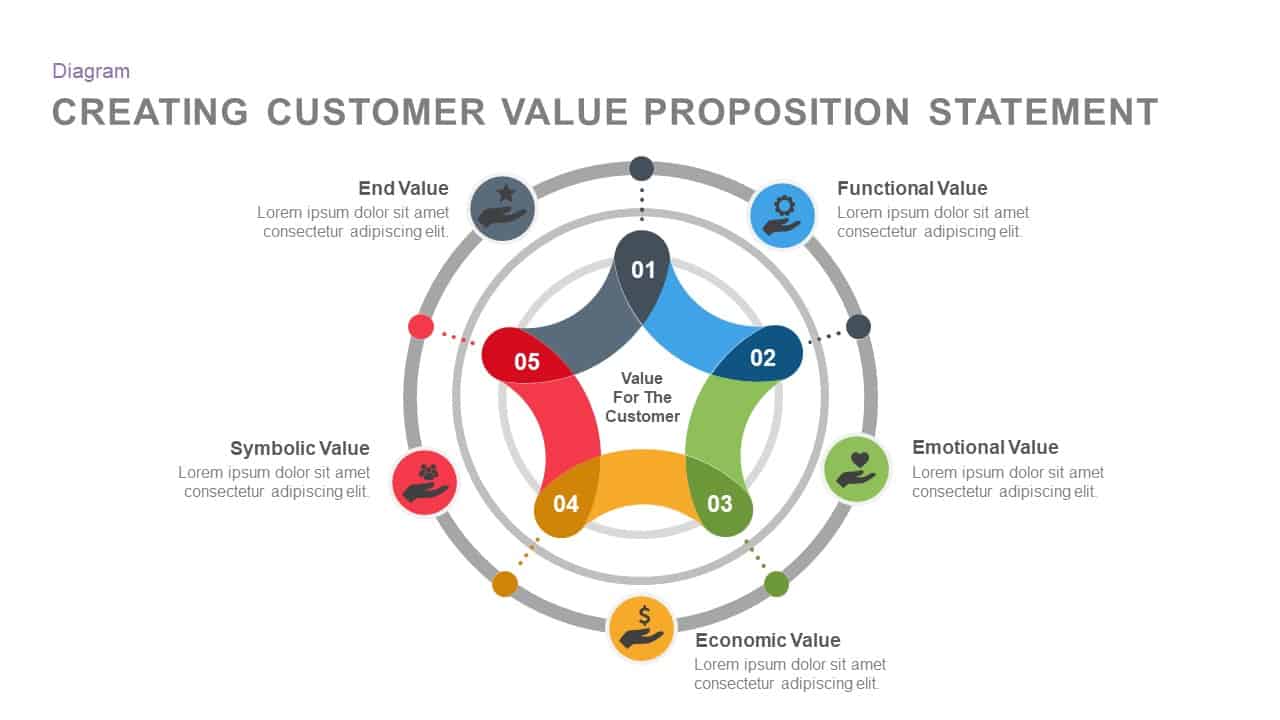
Customer Value Proposition Diagram Template for PowerPoint & Google Slides
Circular
Free Six-Stage Arrow Process Diagram Template for PowerPoint & Google Slides
Process
Free
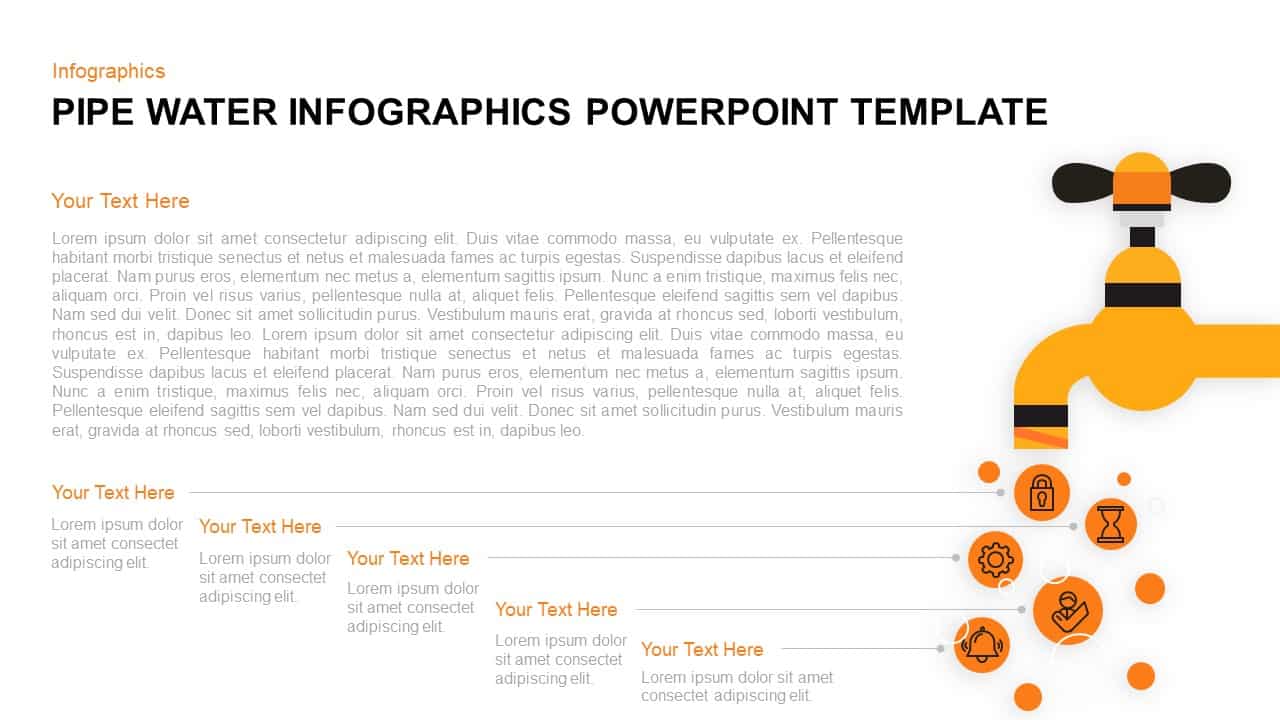
Pipe Water Infographics Flow Diagram Template for PowerPoint & Google Slides
Process
4 Factors Circular Diagram Infographic Template for PowerPoint & Google Slides
Circular
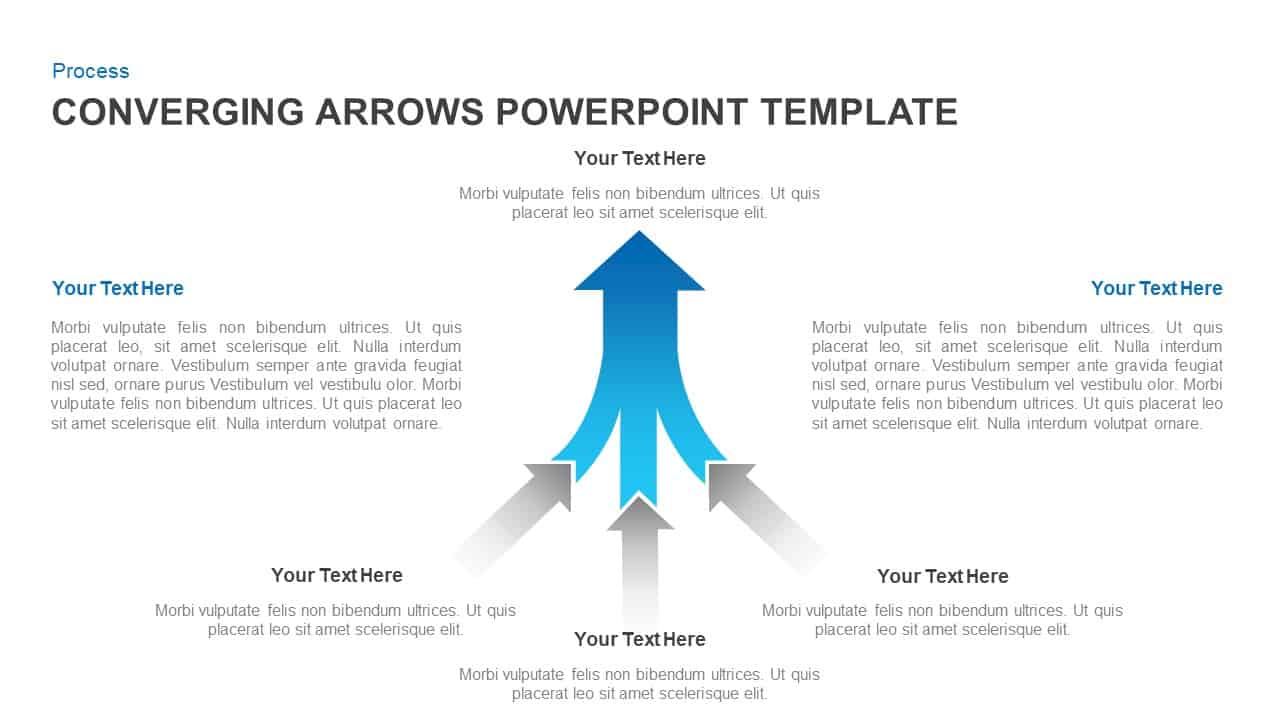
Converging Arrows Process Diagram Template for PowerPoint & Google Slides
Arrow
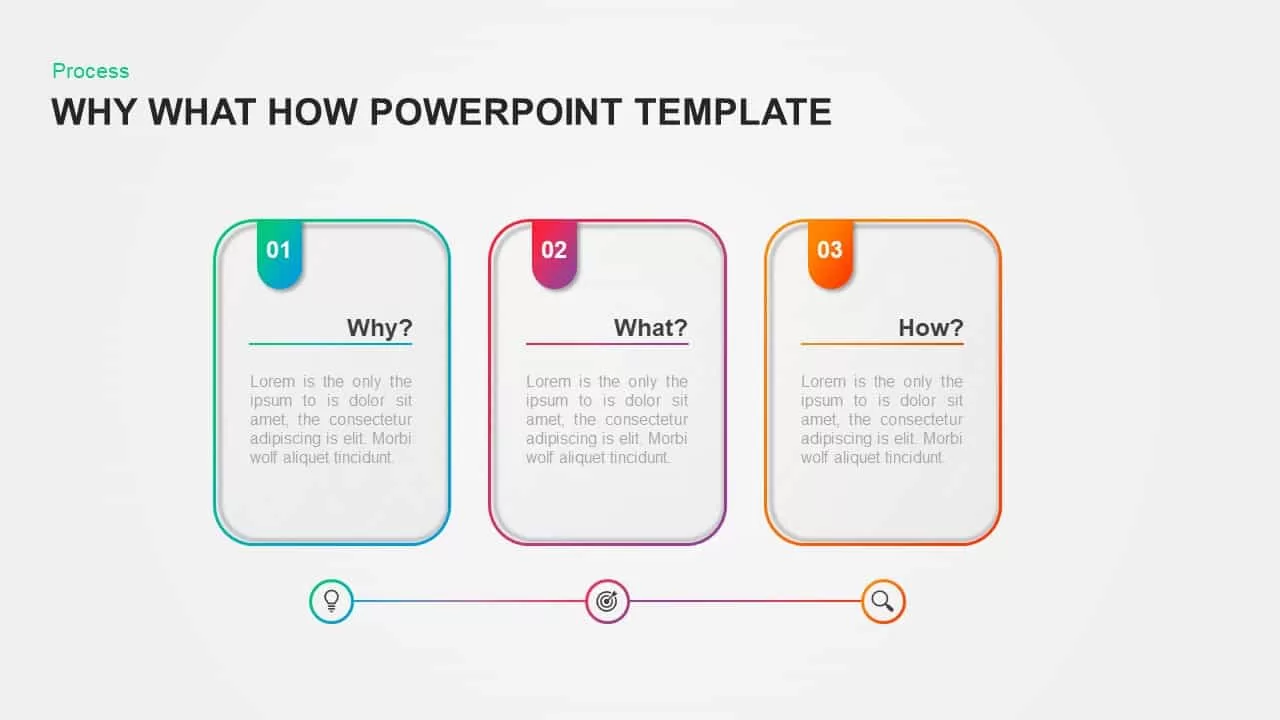
Why What How Process Diagram Template for PowerPoint & Google Slides
Process
4 Stage Linear Process Flow Diagram Template for PowerPoint & Google Slides
Process
Greiner Growth Model Six-Phase Diagram Template for PowerPoint & Google Slides
Business Models
Six-Stage Circular Flow Diagram Template for PowerPoint & Google Slides
Circular
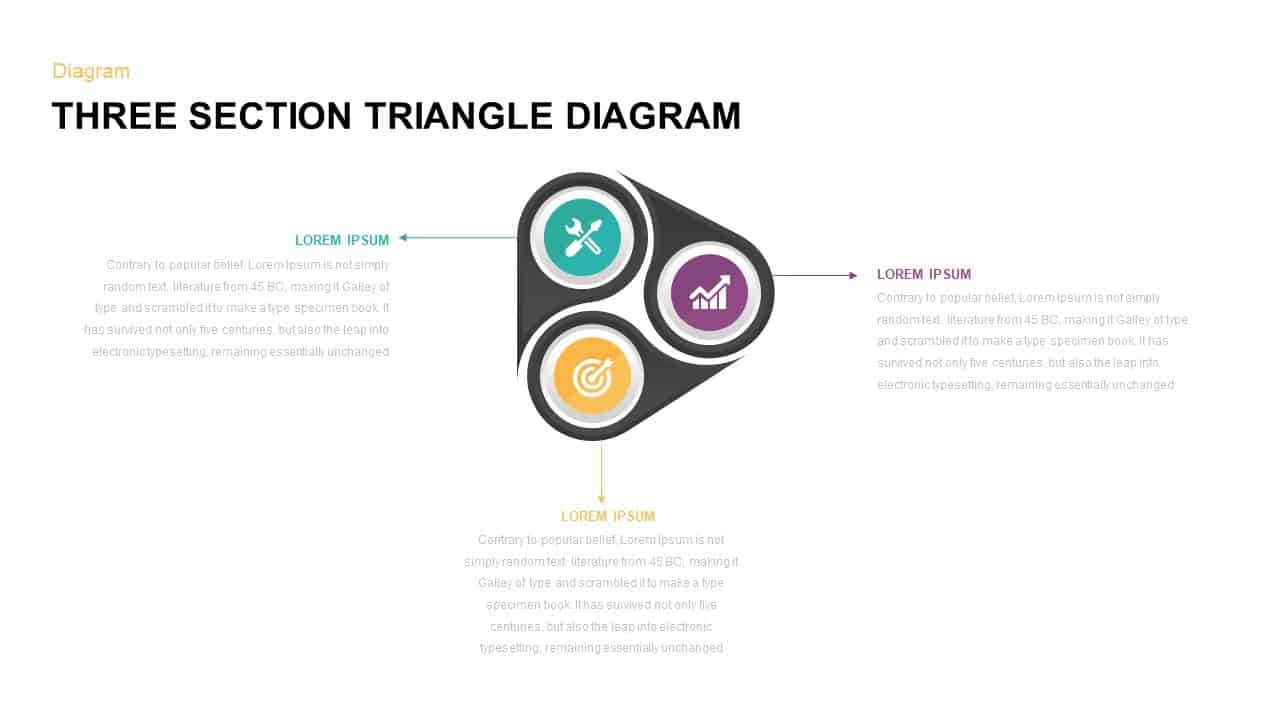
Three Section Triangle Diagram Template for PowerPoint & Google Slides
Process
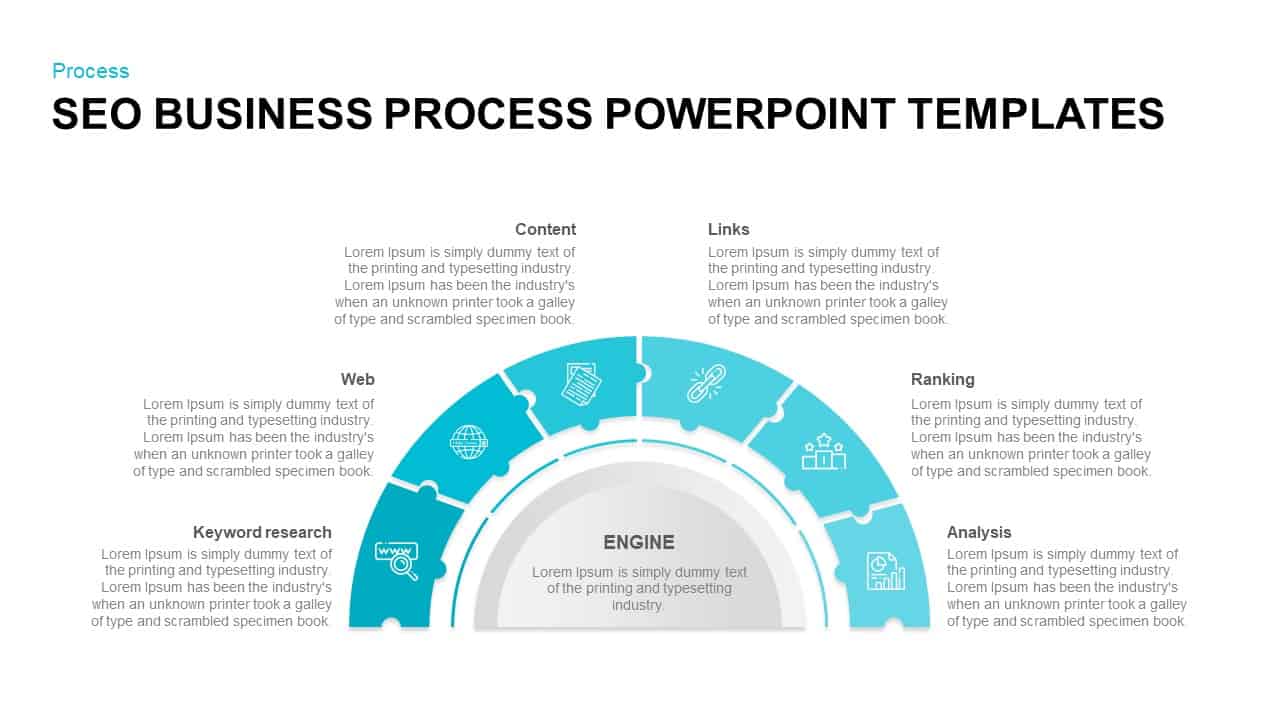
SEO Business Process Puzzle Diagram Template for PowerPoint & Google Slides
Process
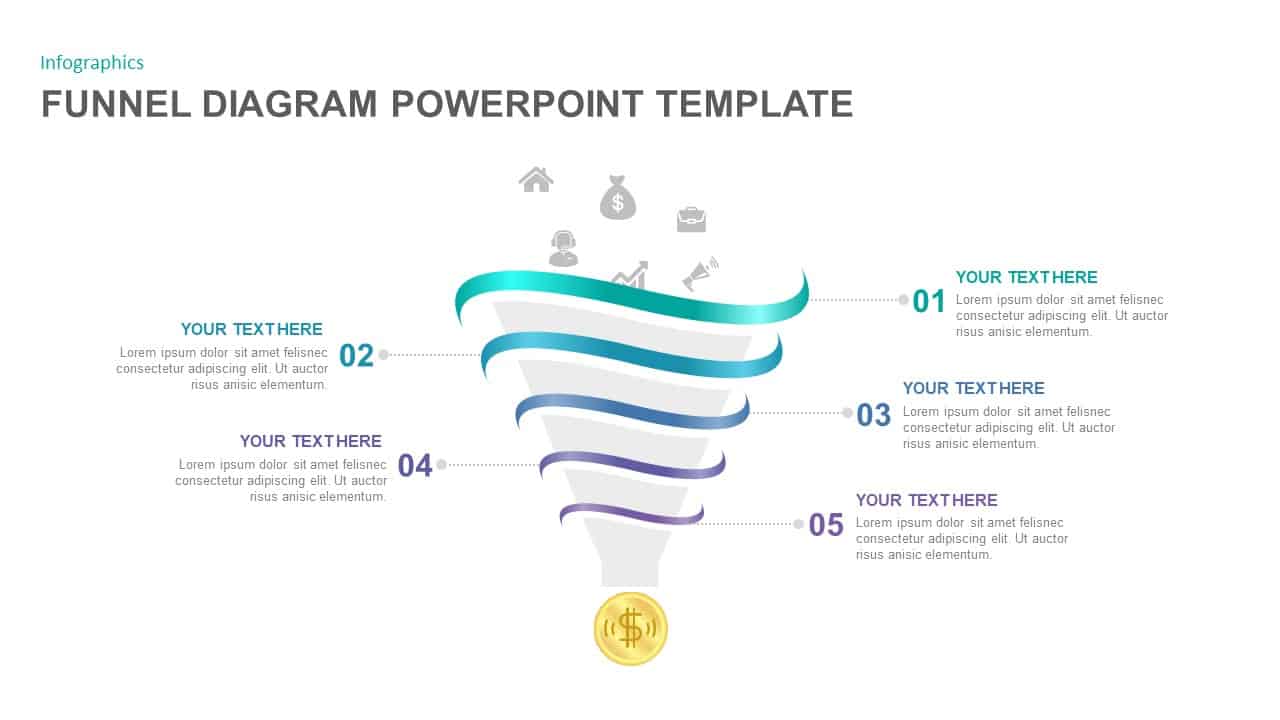
5-Step Colorful Funnel Diagram Template for PowerPoint & Google Slides
Funnel
Modern Gear Venn Diagram Infographic Template for PowerPoint & Google Slides
Comparison
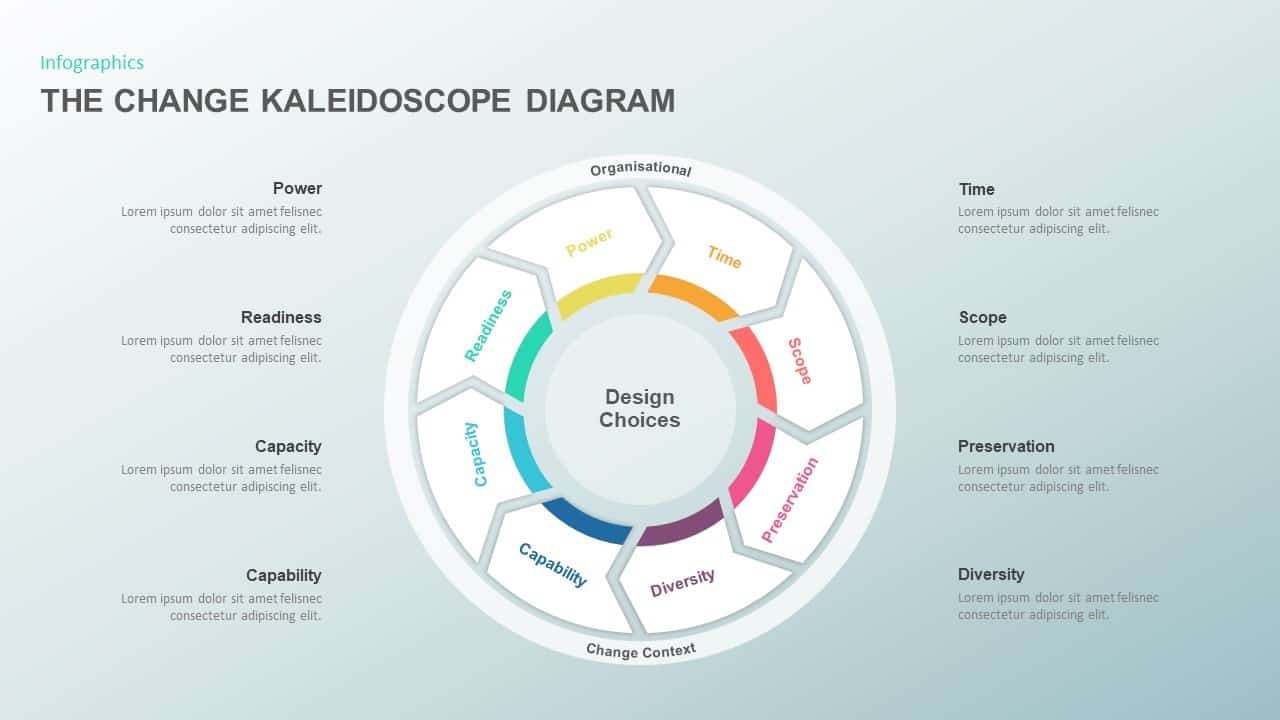
The Change Kaleidoscope Diagram template for PowerPoint & Google Slides
Pitch Deck

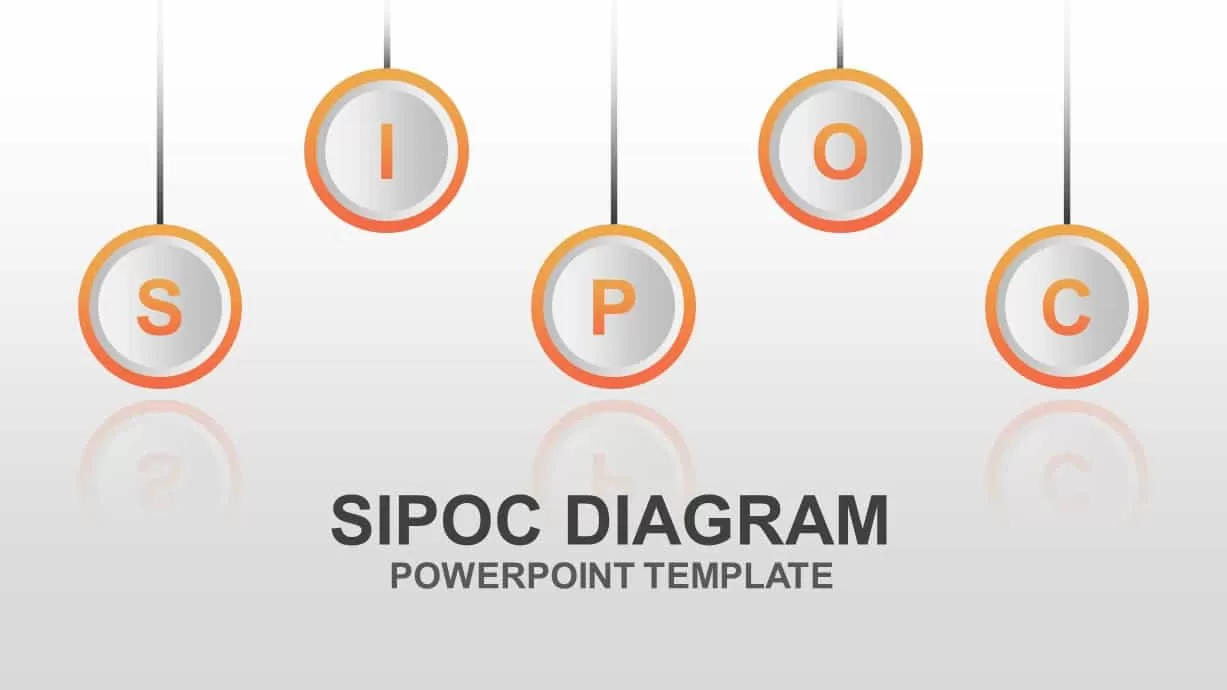
Editable SIPOC Process Diagram Deck Template for PowerPoint & Google Slides
Pitch Deck
Six-Step Output Process Diagram Template for PowerPoint & Google Slides
Process
OODA Loop Diagram template for PowerPoint & Google Slides
Business
Free Venn Diagram template for PowerPoint & Google Slides
Charts
Free
Five-Node Hub and Spoke Diagram Template for PowerPoint & Google Slides
Business Strategy
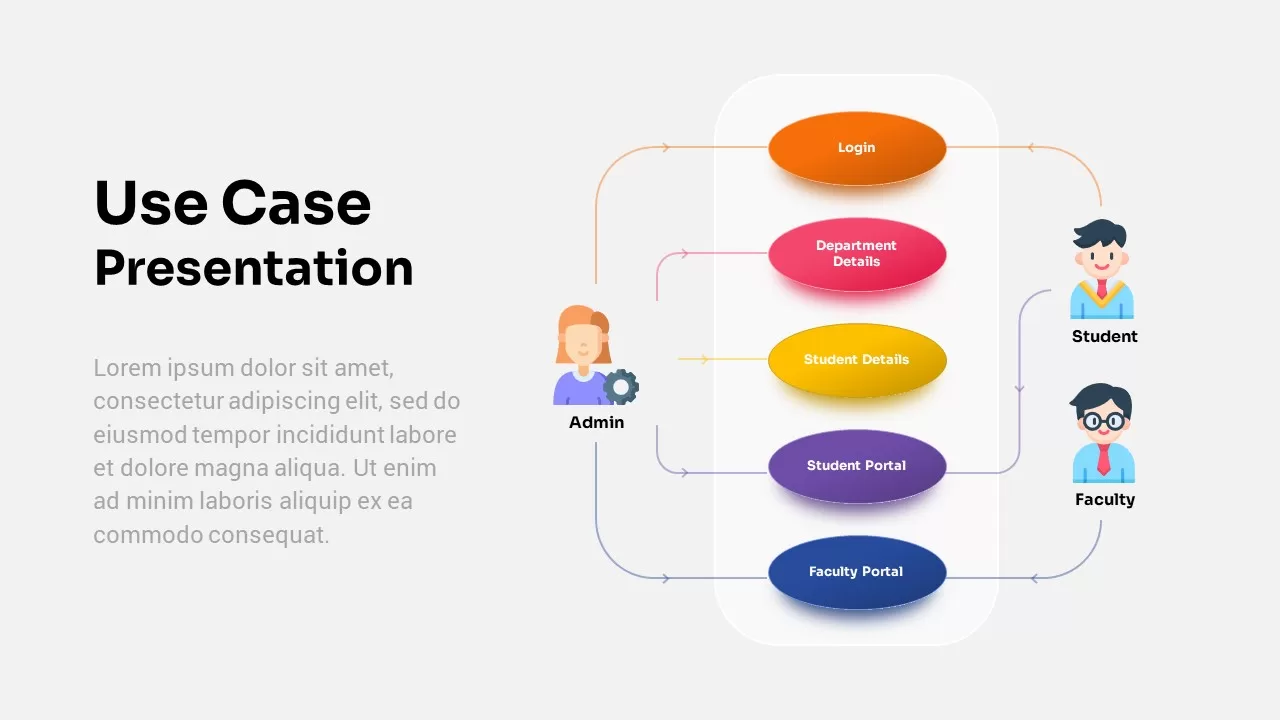
Educational System Use Case Diagram Template for PowerPoint & Google Slides
Software Development
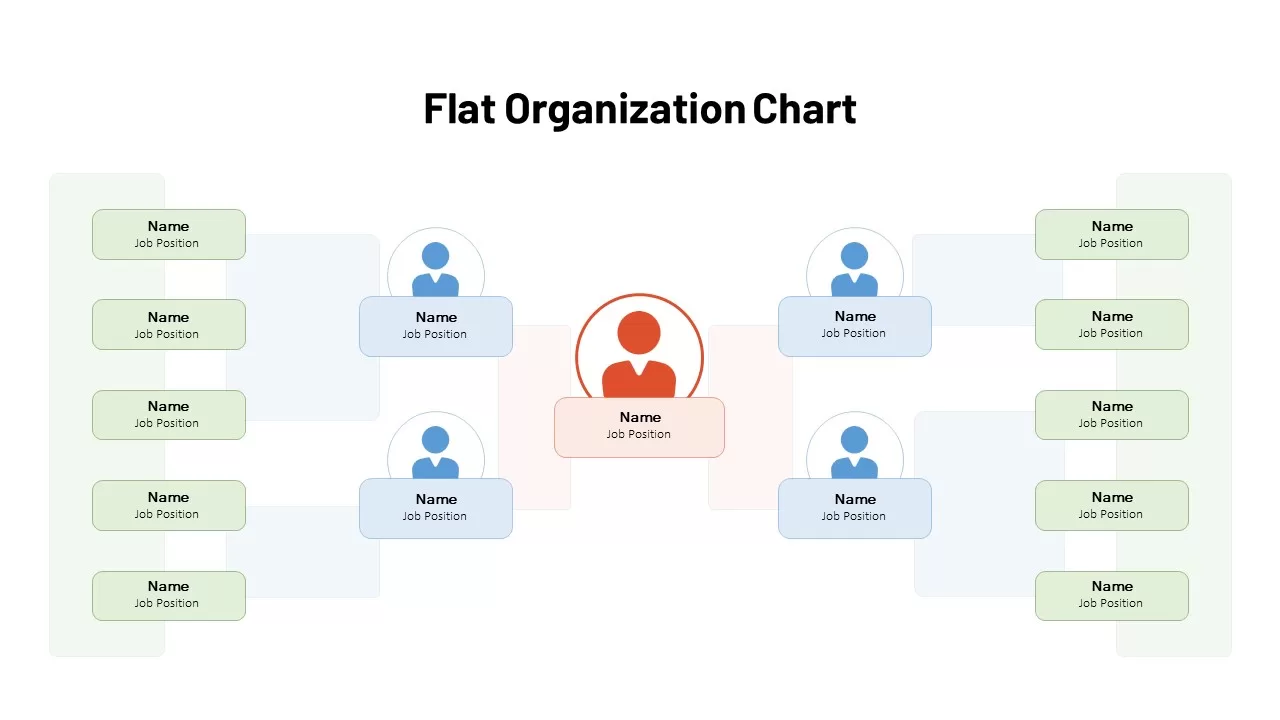
Flat Organization Chart Diagram Template for PowerPoint & Google Slides
Org Chart
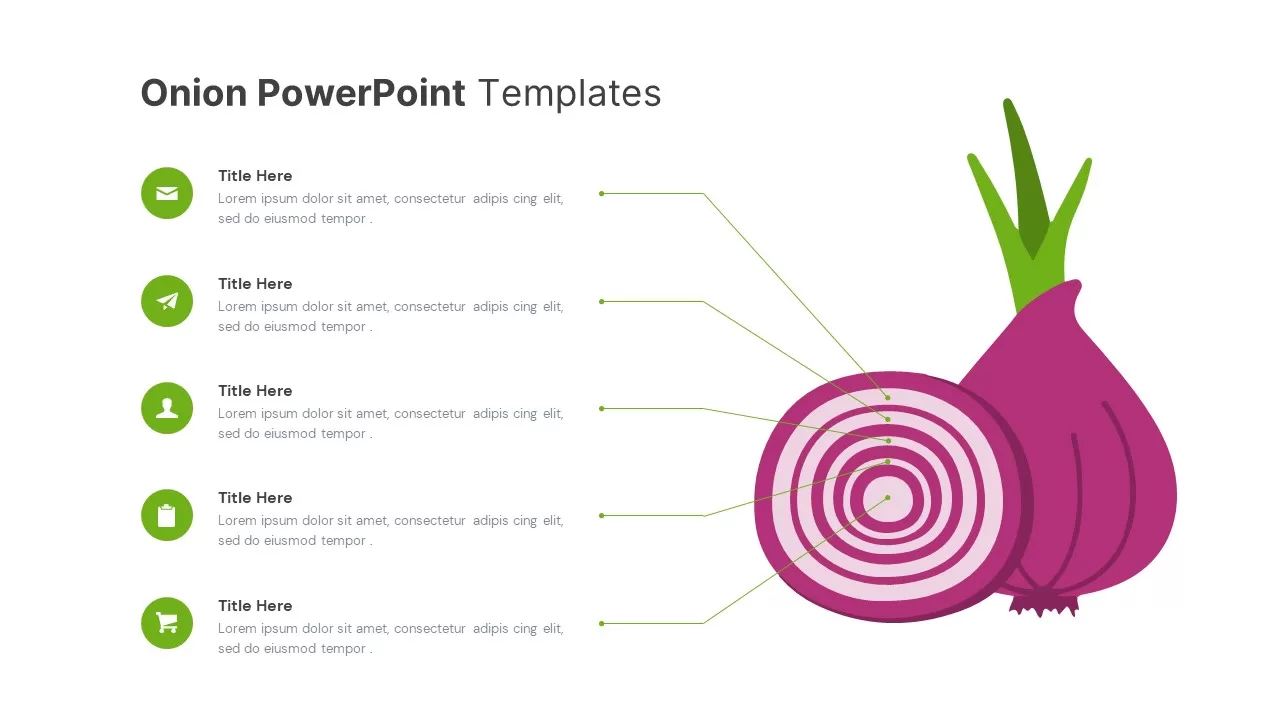
Onion Diagram Callout Template for PowerPoint & Google Slides
Process
Three-Stage S Curve Growth Diagram Template for PowerPoint & Google Slides
Process
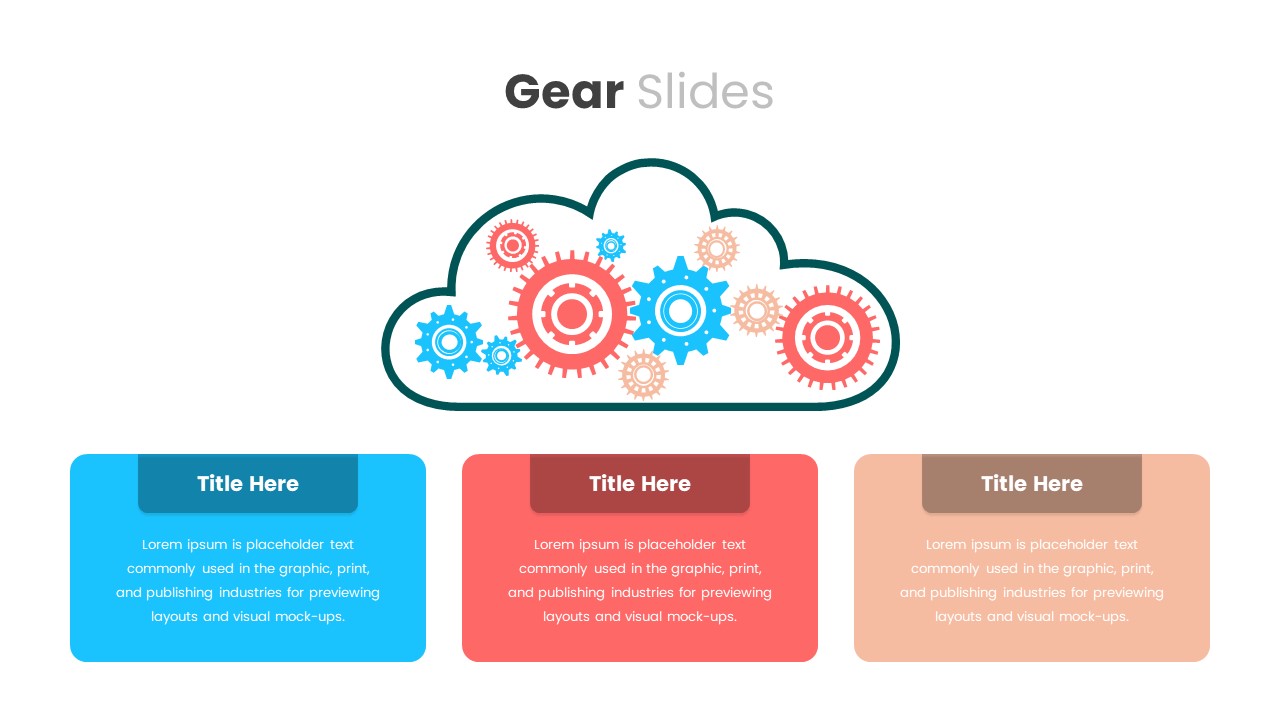
Cloud Gear Automation Diagram Template for PowerPoint & Google Slides
Cloud Computing
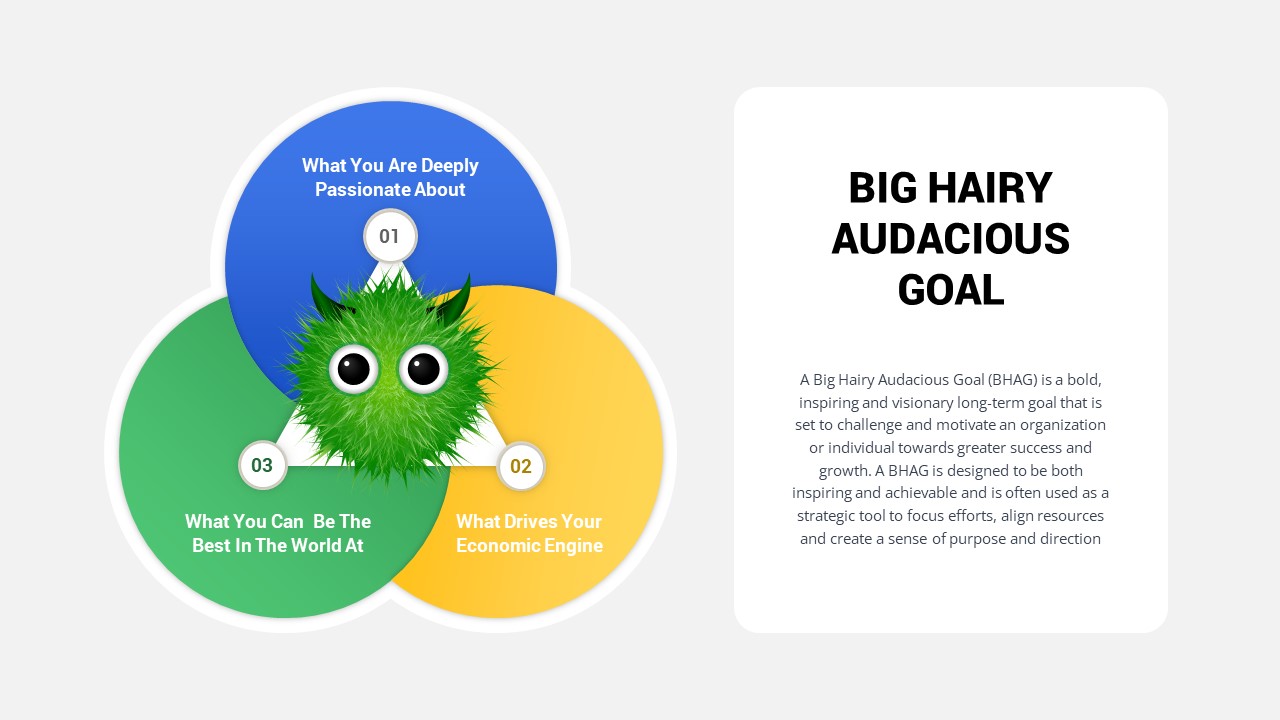
Big Hairy Audacious Goal Venn Diagram Template for PowerPoint & Google Slides
Circular
Professional 6 Circle Venn Diagram Template for PowerPoint & Google Slides
Circular
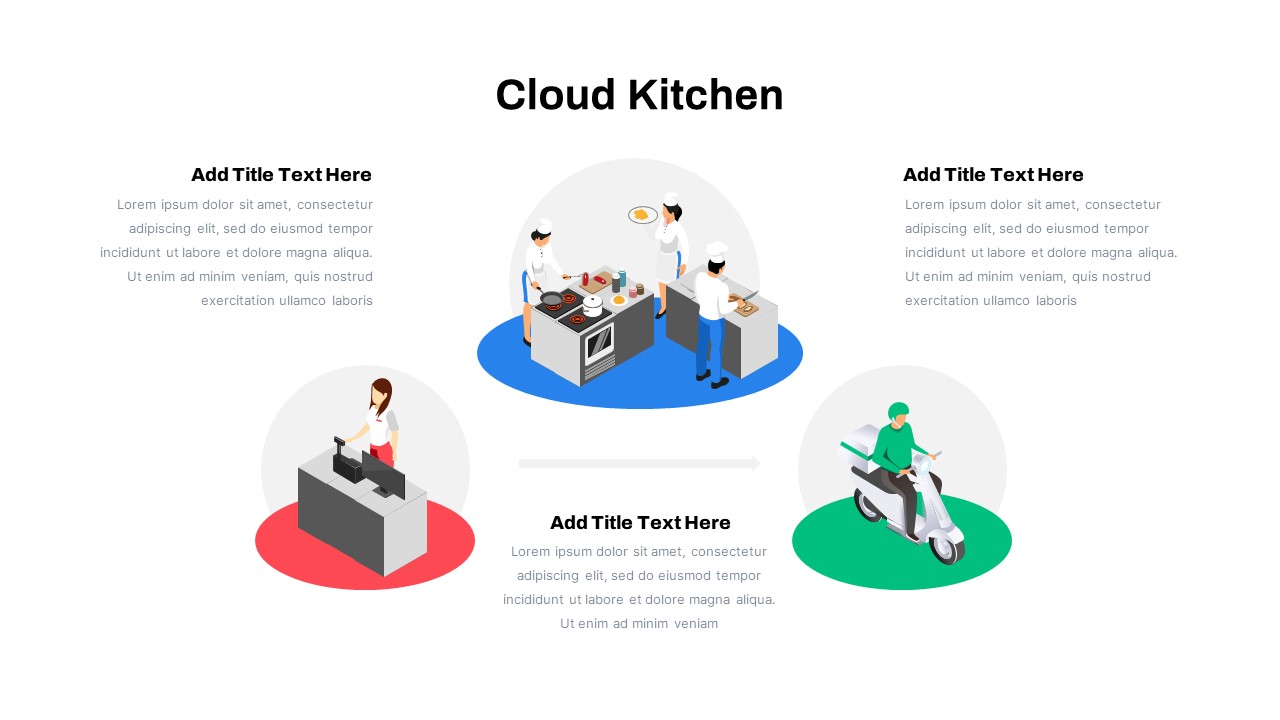
Cloud Kitchen Business Process Diagram Template for PowerPoint & Google Slides
Process
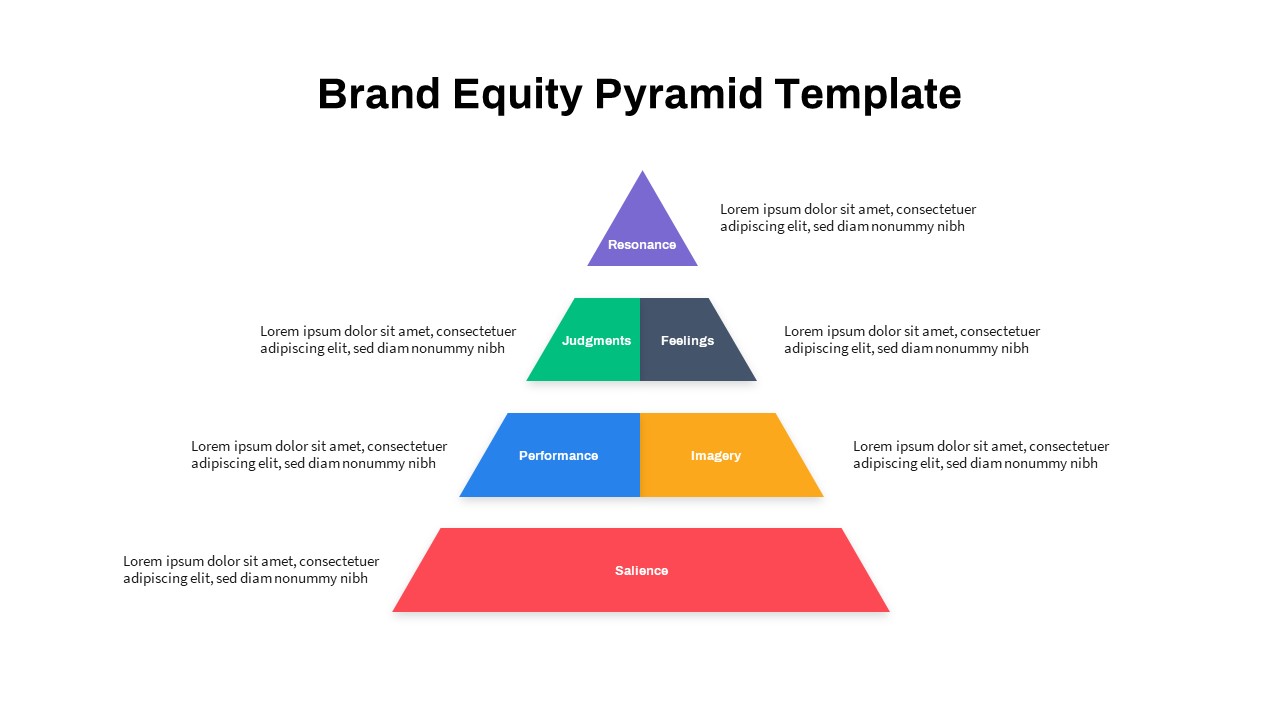
Strategic Brand Equity Pyramid Diagram Template for PowerPoint & Google Slides
Pyramid
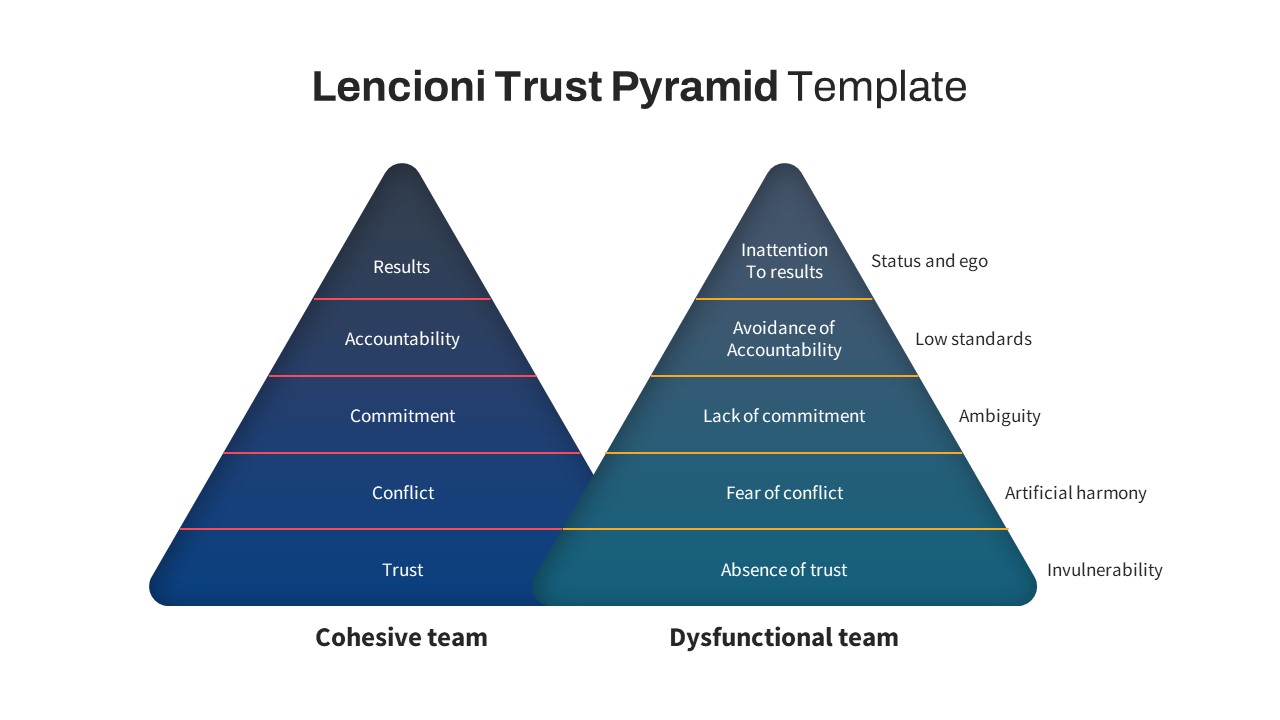
Lencioni Trust Pyramid Diagram Template for PowerPoint & Google Slides
Pyramid
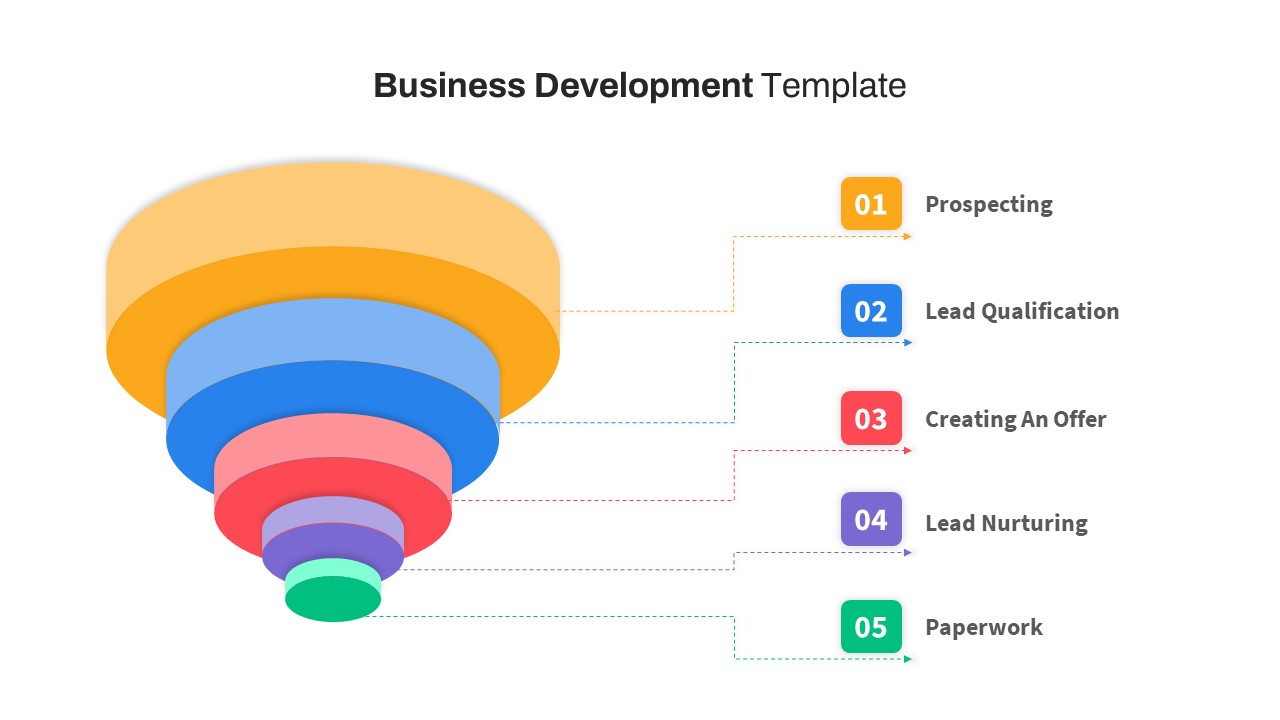
Free Business Development Funnel Diagram Template for PowerPoint & Google Slides
Marketing Funnel
Free
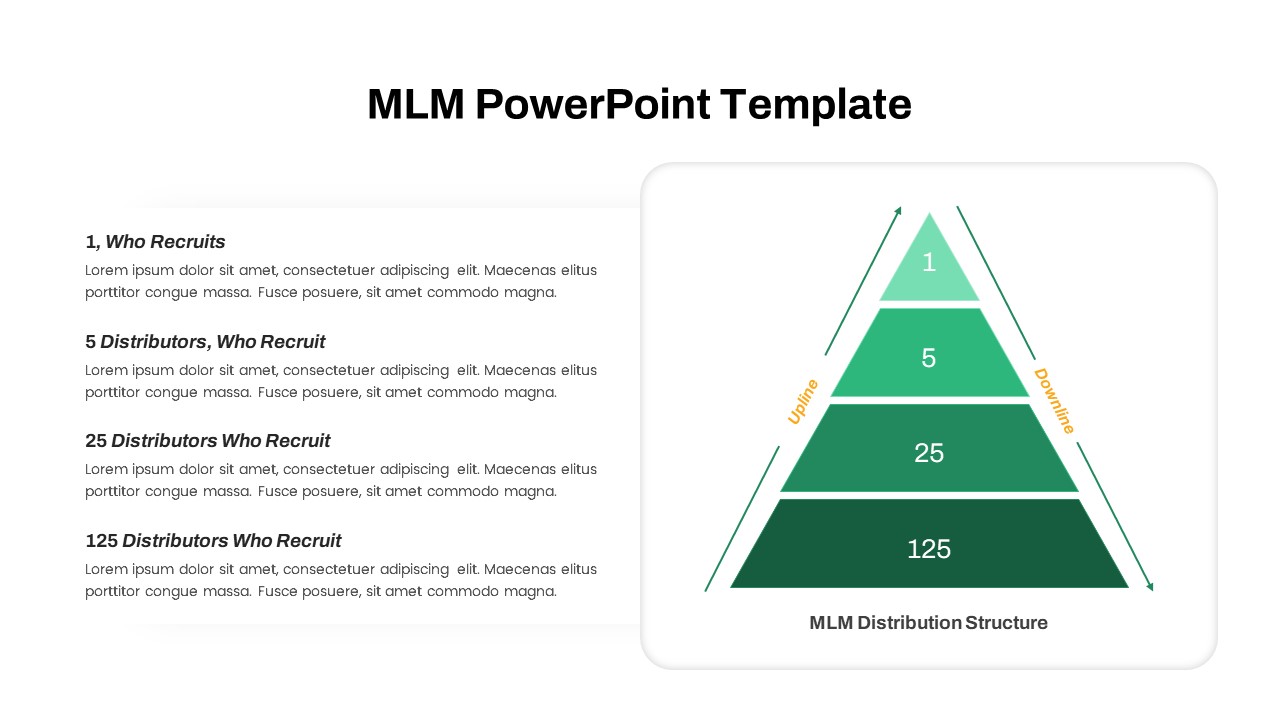
MLM Distribution Pyramid Diagram Template for PowerPoint & Google Slides
Business Models
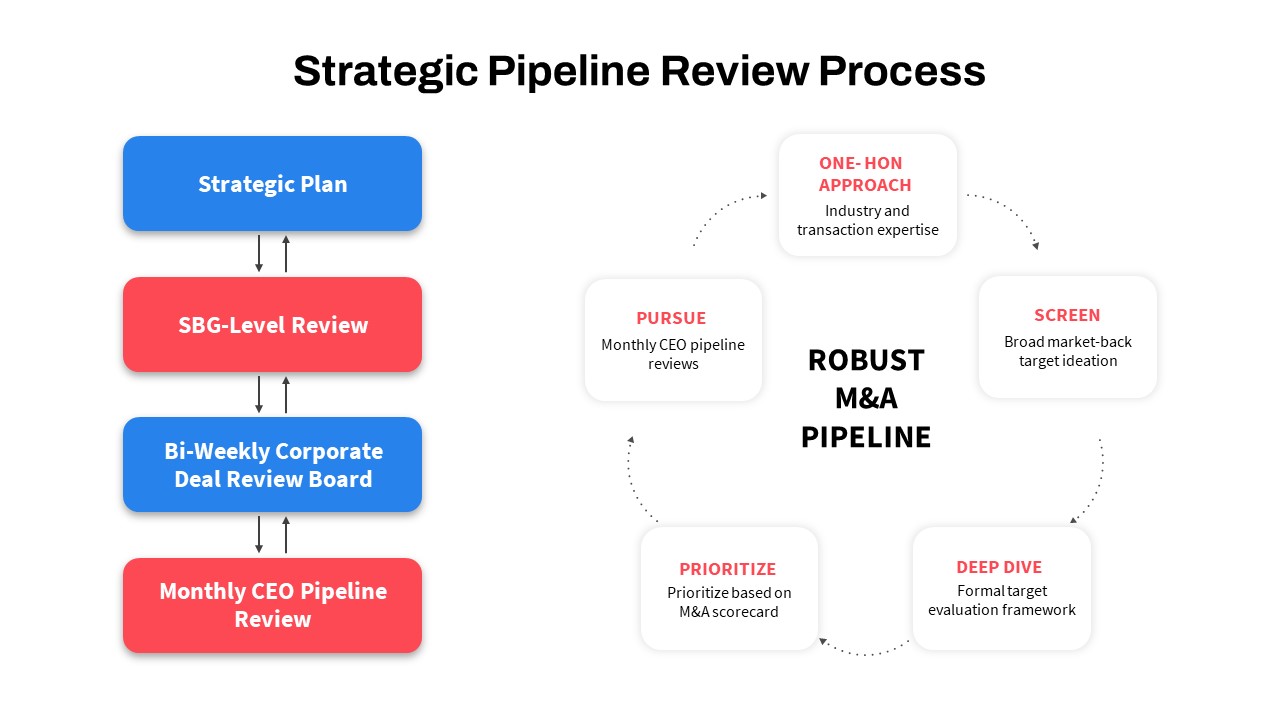
Strategic Pipeline Review Diagram Template for PowerPoint & Google Slides
Business Strategy
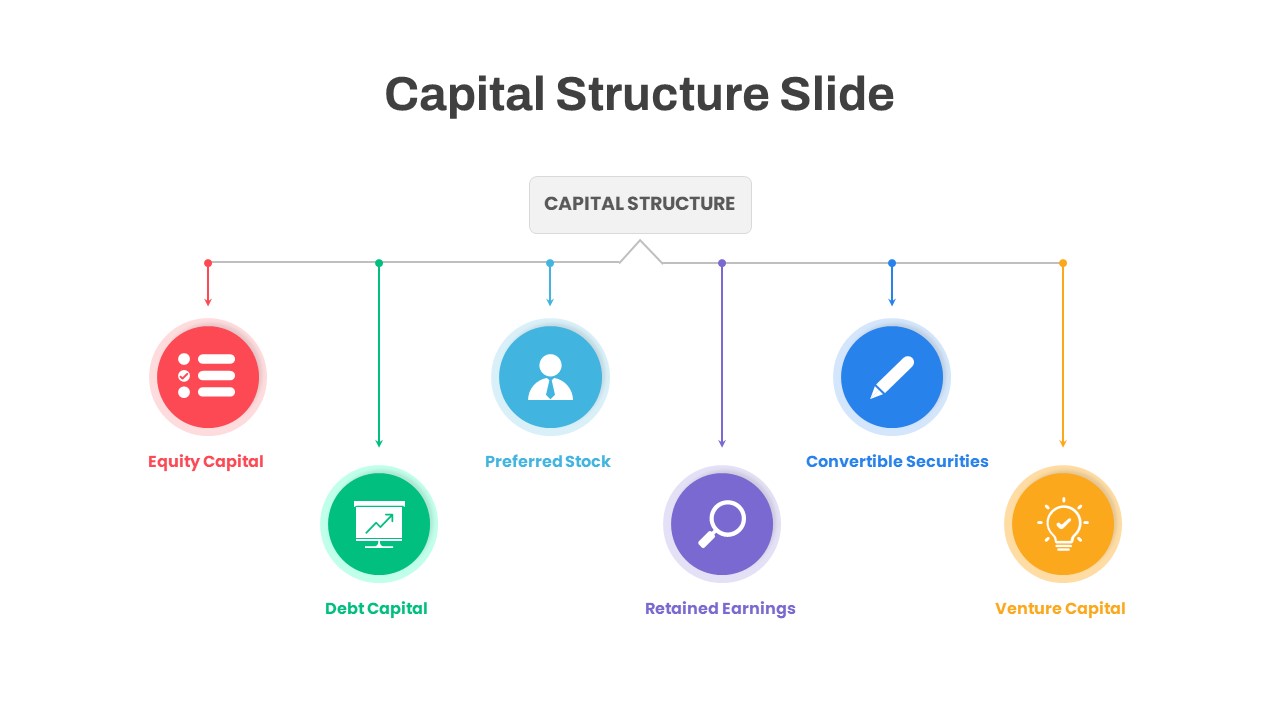
Capital Structure Hub & Spoke Diagram Template for PowerPoint & Google Slides
Process
Data Lake Hub-and-Spoke Diagram Template for PowerPoint & Google Slides
Cloud Computing
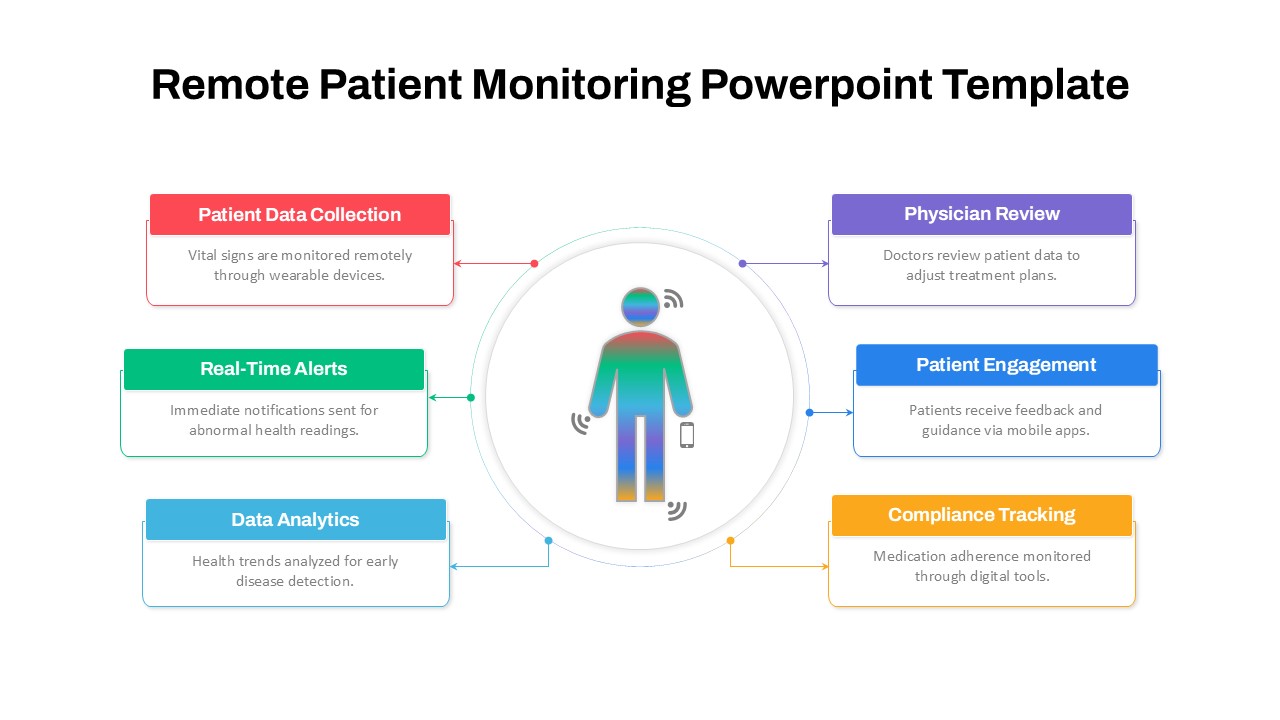
Remote Patient Monitoring Diagram Template for PowerPoint & Google Slides
Health
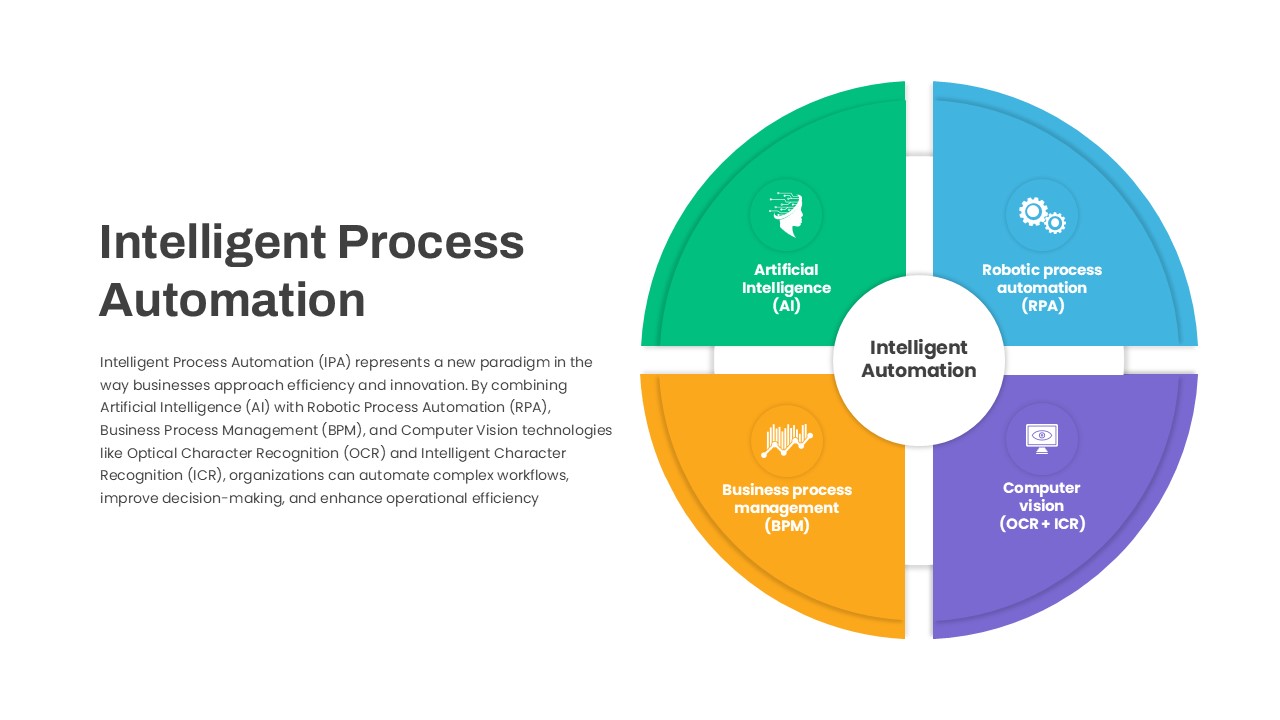
Intelligent Process Automation Diagram Template for PowerPoint & Google Slides
Circular
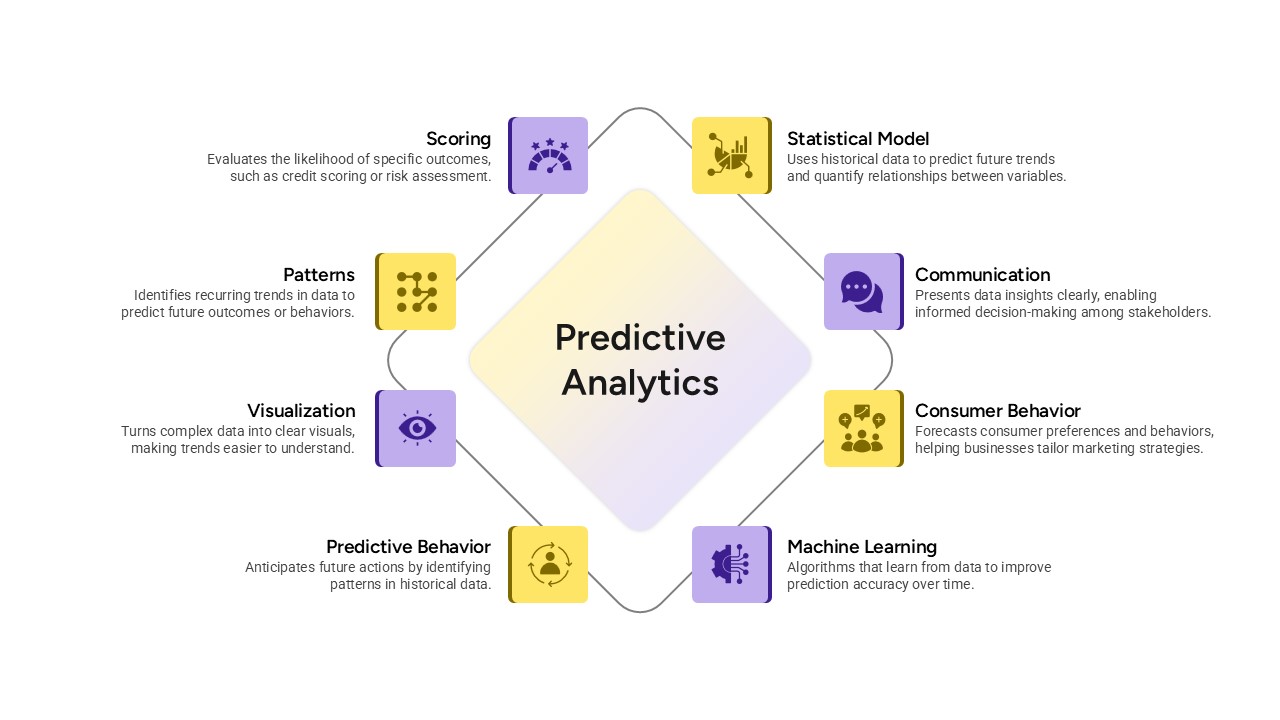
Predictive Analytics Diagram Template for PowerPoint & Google Slides
Process
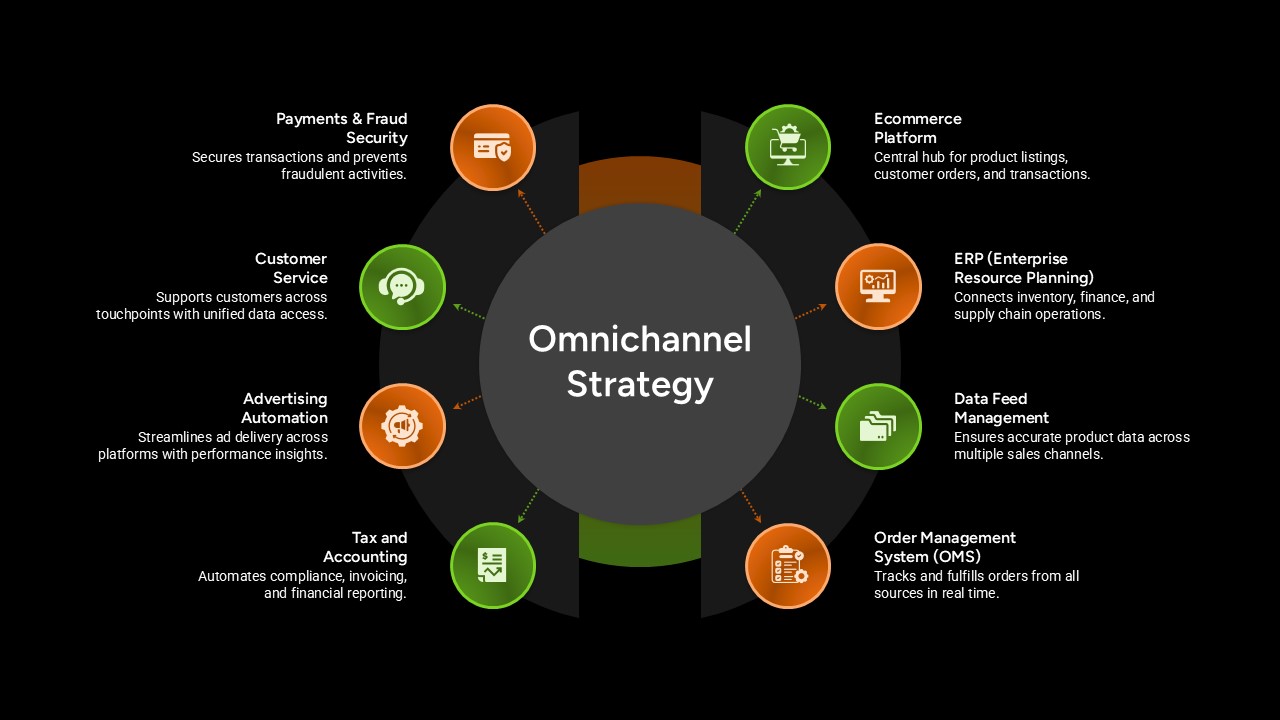
Omnichannel Strategy Circular Diagram Template for PowerPoint & Google Slides
Digital Marketing
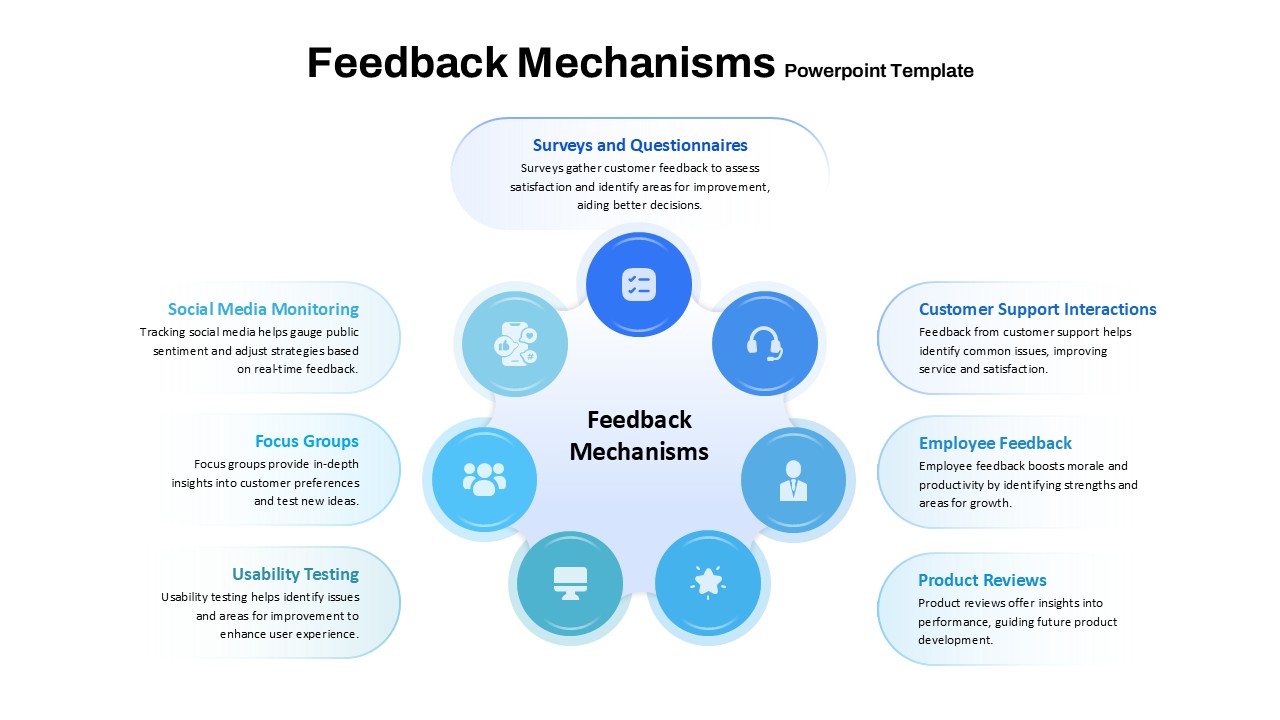
Feedback Mechanisms Circular Diagram Template for PowerPoint & Google Slides
Circular
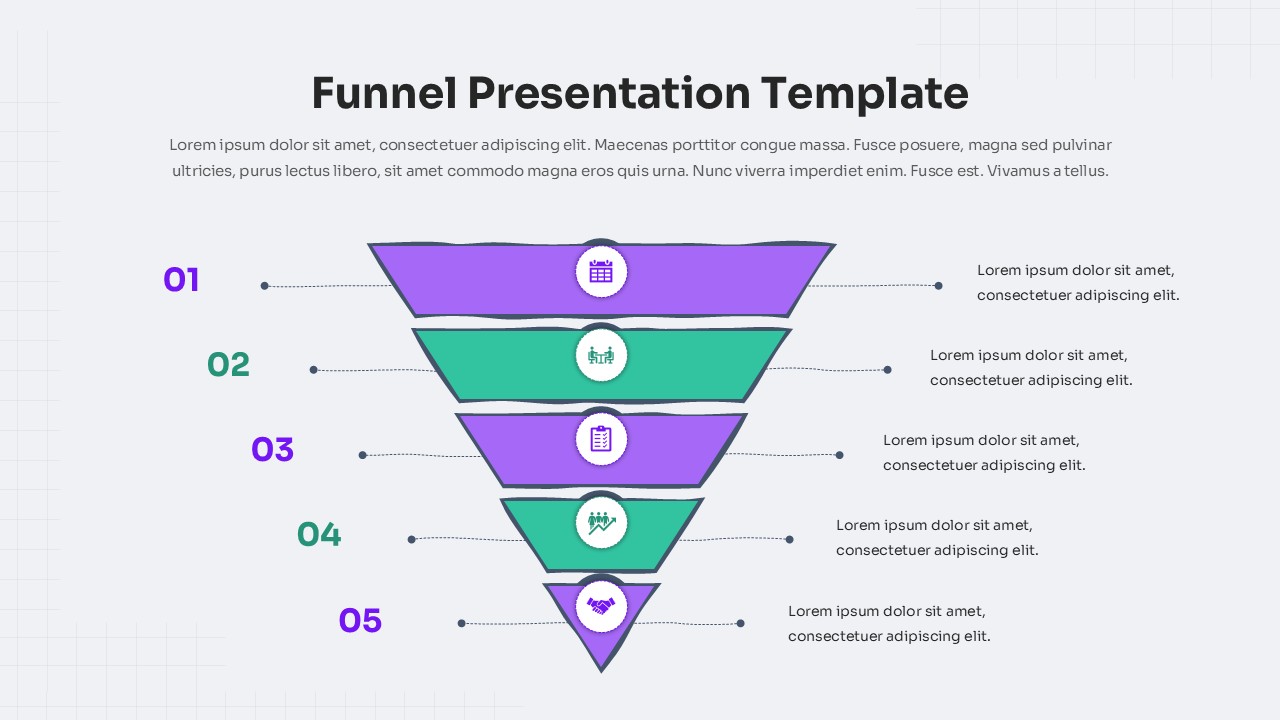
Five-Step Modern Funnel Diagram Template for PowerPoint & Google Slides
Funnel
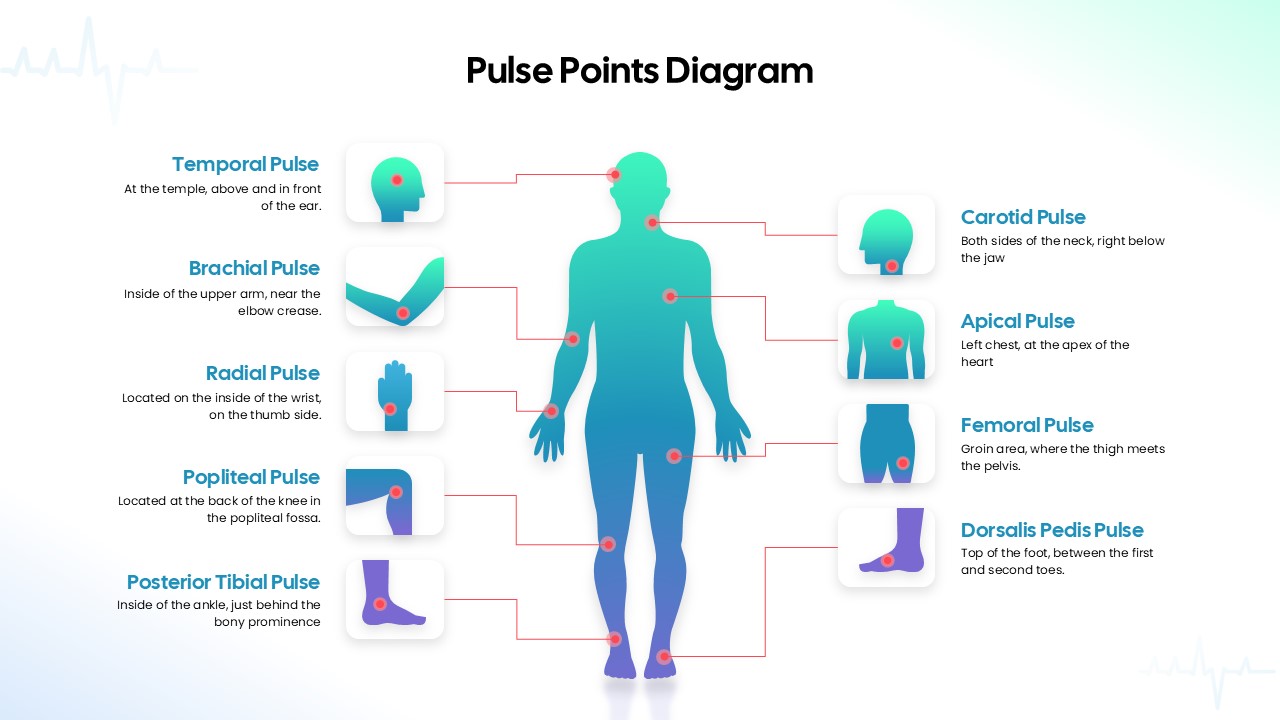
Human Body Pulse Points Diagram Template for PowerPoint & Google Slides
Medical
Operating Channels Comparison Diagram Template for PowerPoint & Google Slides
Business Models
Data-Driven Sales Strategy Diagram Template for PowerPoint & Google Slides
Marketing