Capital Investments Process Flow Diagram Template for PowerPoint & Google Slides

Description
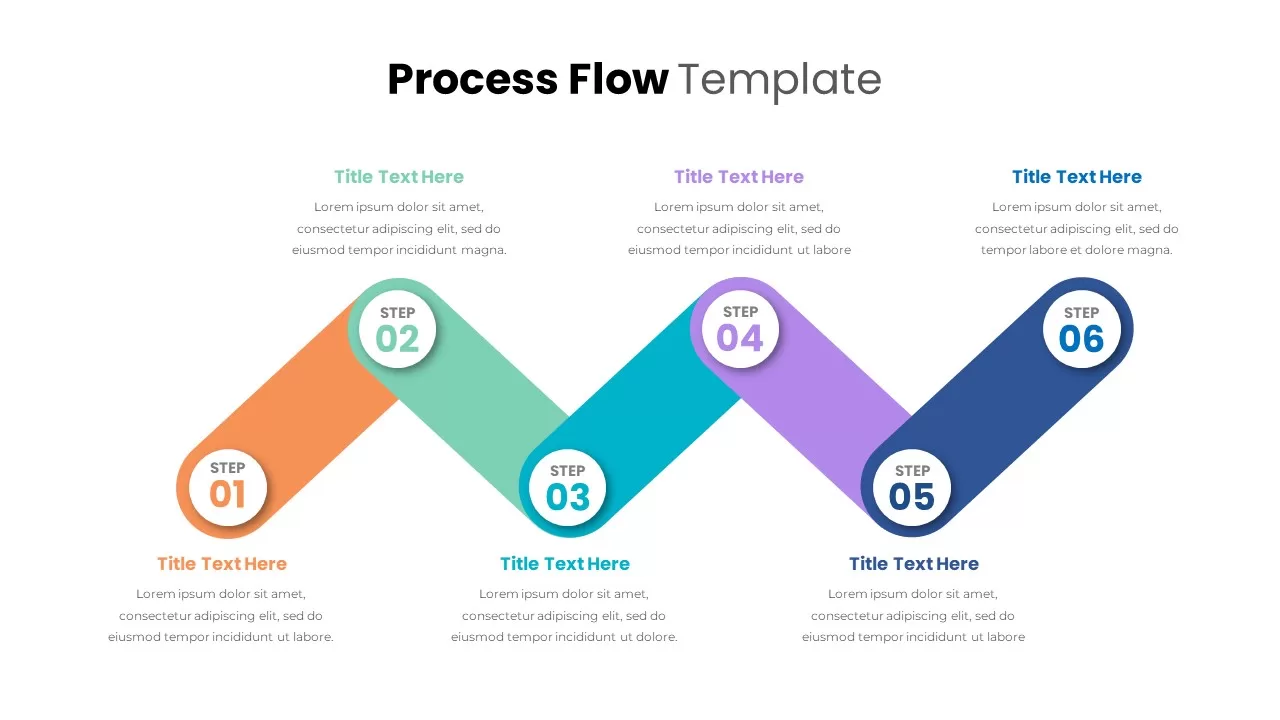
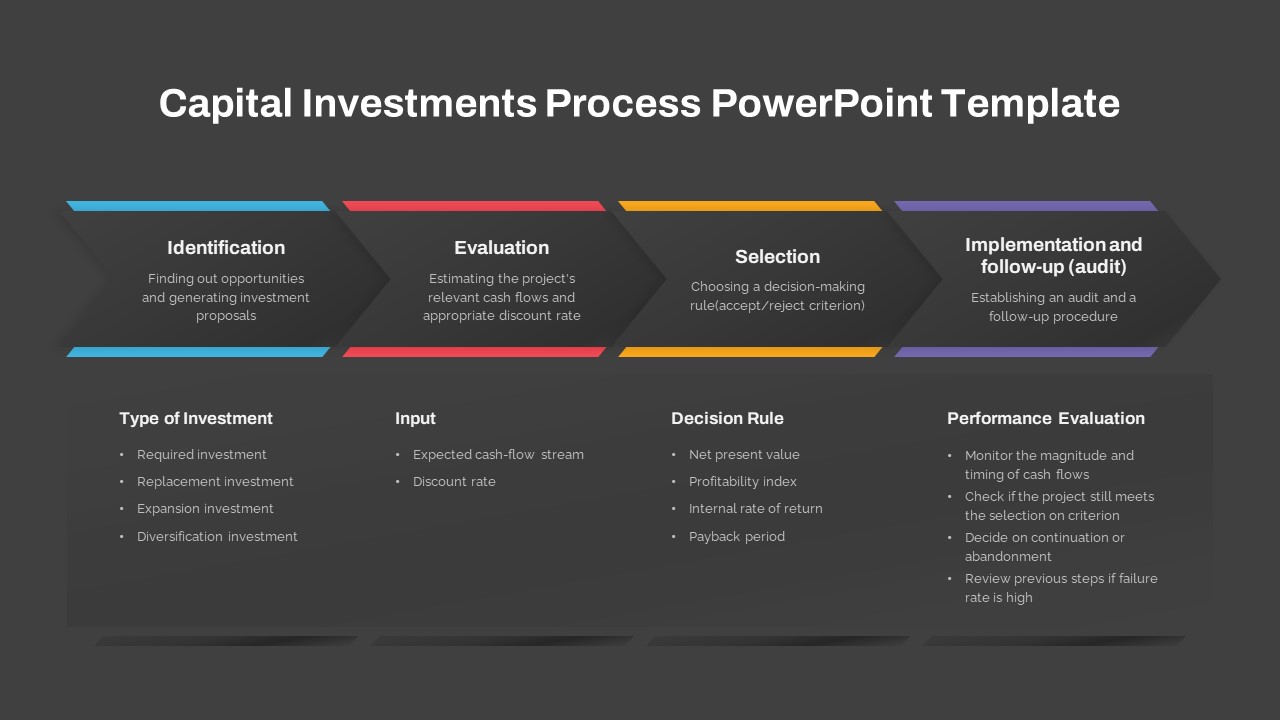
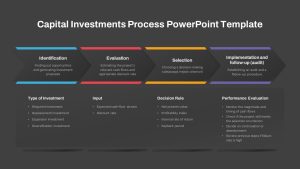
This template presents a streamlined capital investments process diagram, using four horizontal arrow segments to depict the phases of identification, evaluation, selection, and implementation & follow-up (audit). Each arrow features a distinct top-border color—blue, red, yellow, and purple—against a neutral gray fill, ensuring clear visual separation. Below the process bar, four labeled content panels allow you to detail investment types, cash-flow inputs, decision criteria, and performance evaluation guidelines in clean bullet lists. A balanced white-space layout and subtle drop shadows lend a modern, professional aesthetic.
Built on master slides, every element—from arrow shapes and color accents to text panels and list markers—is fully editable via PowerPoint or Google Slides. Drag-and-drop placeholders simplify image or icon swaps, while global theme settings let you adjust color palettes to align with your brand. Replace headers or reconfigure segments in seconds without disturbing the layout’s integrity. Font styles, spacing, and shadow effects have been optimized for maximum readability across devices and screen sizes.
Ideal for board presentations and internal reports, this process diagram template streamlines complex information into a single, visually engaging slide. Its modular design supports rapid customization—duplicate segments for additional steps, rearrange panels for alternate views, or toggle drop shadows and borders on or off. With consistent slide numbering and transition presets, the entire deck maintains continuity. Use this asset to accelerate your planning sessions, training workshops, or executive briefings with minimal setup time.
Each arrow and panel placeholder is designed for drag-and-drop convenience, enabling you to insert icons, logos, or data visualizations without manual alignment. Dual master layouts accommodate light or dark backgrounds, ensuring legibility in any presentation theme.
Who is it for
Financial analysts, project managers, and corporate strategy teams will leverage this slide to map capital-allocation workflows. Consultants, CFOs, and audit departments can also adopt it for investment reviews or compliance reporting.
Other Uses
Beyond capital investments, repurpose the arrow diagram for product development roadmaps, operational audits, risk management frameworks, or any multi-phase process visualization across industries.
Login to download this file

Item ID
SB04353
Related Templates

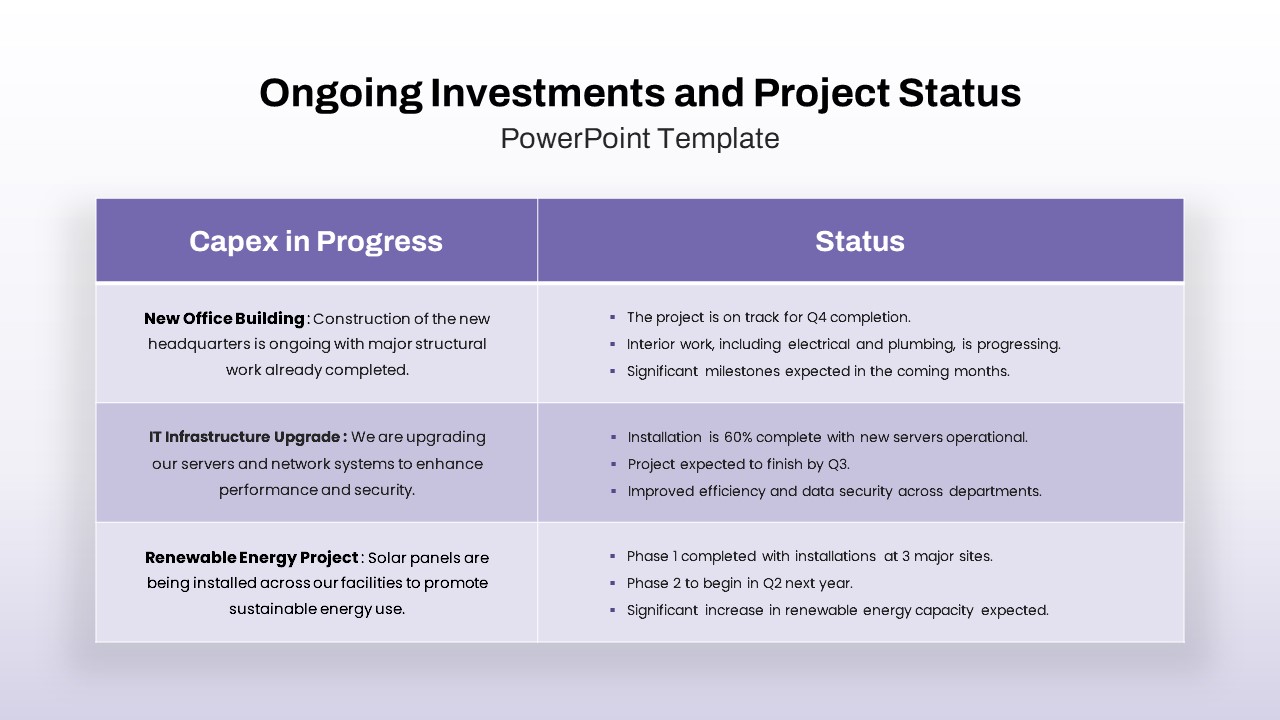
Ongoing Investments and Project Status Template for PowerPoint & Google Slides
Project Status
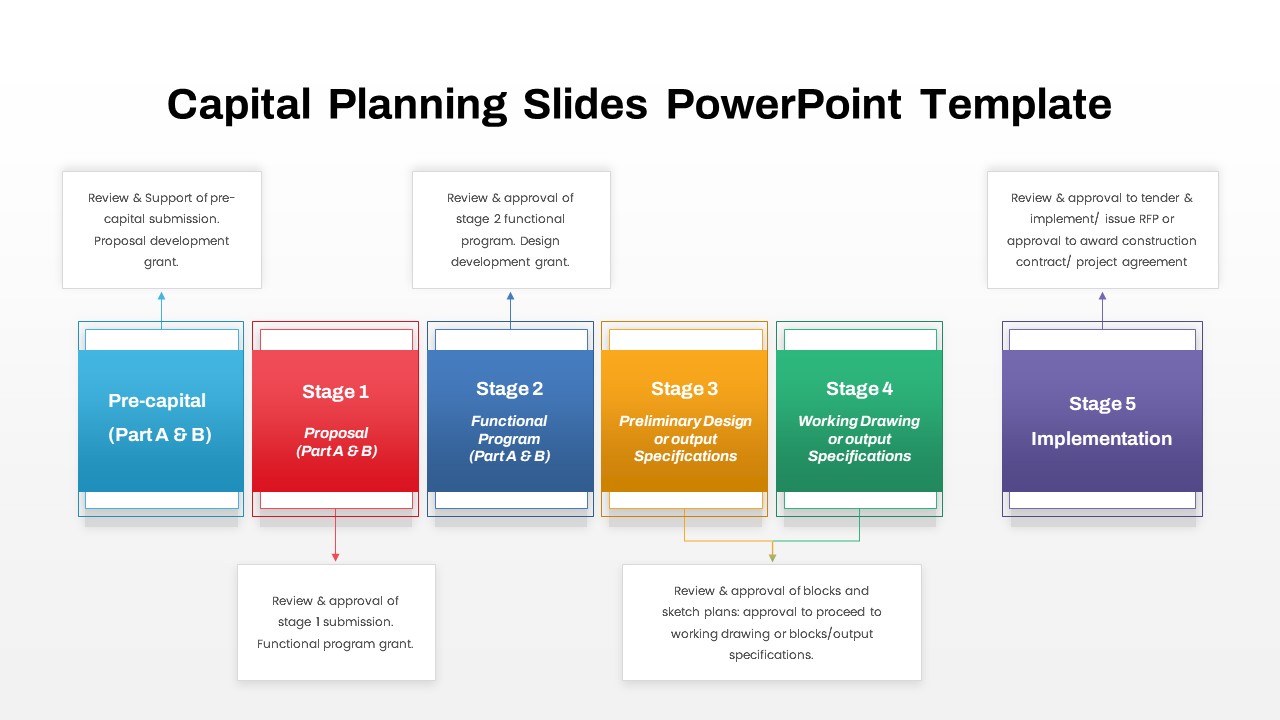
Capital Planning Five-Stage Process template for PowerPoint & Google Slides
Process
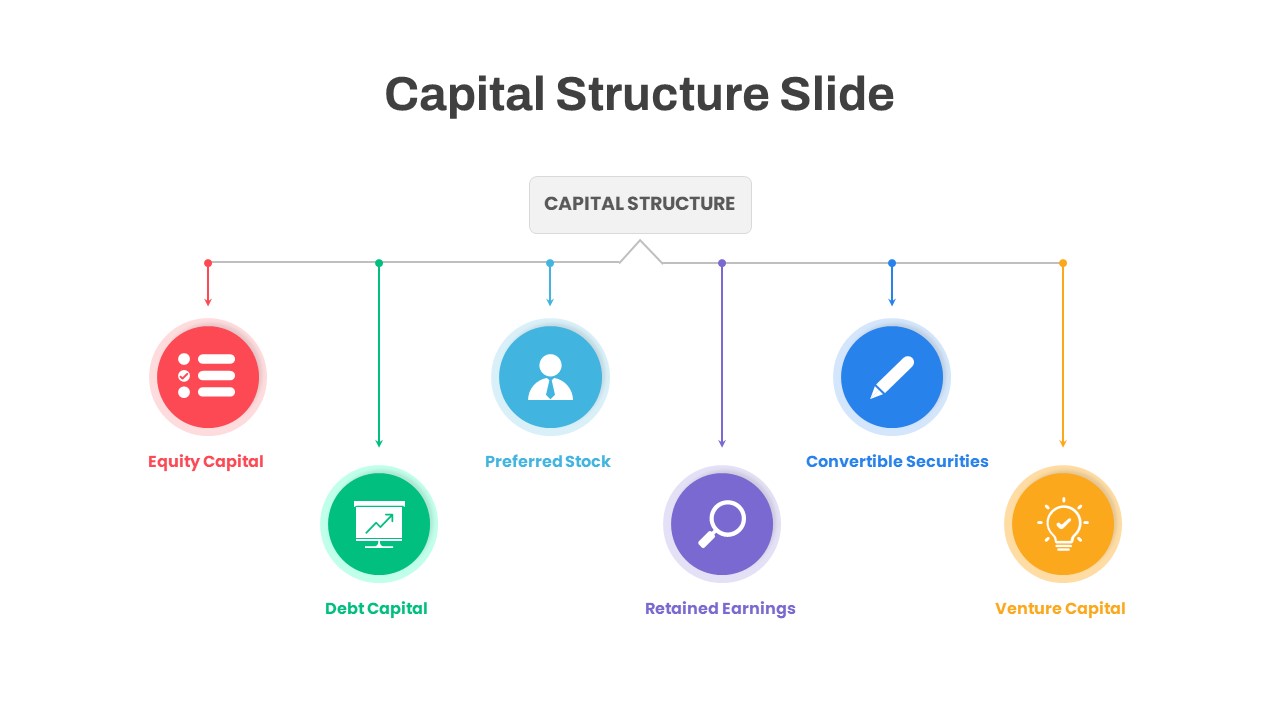
Capital Structure Hub & Spoke Diagram Template for PowerPoint & Google Slides
Process
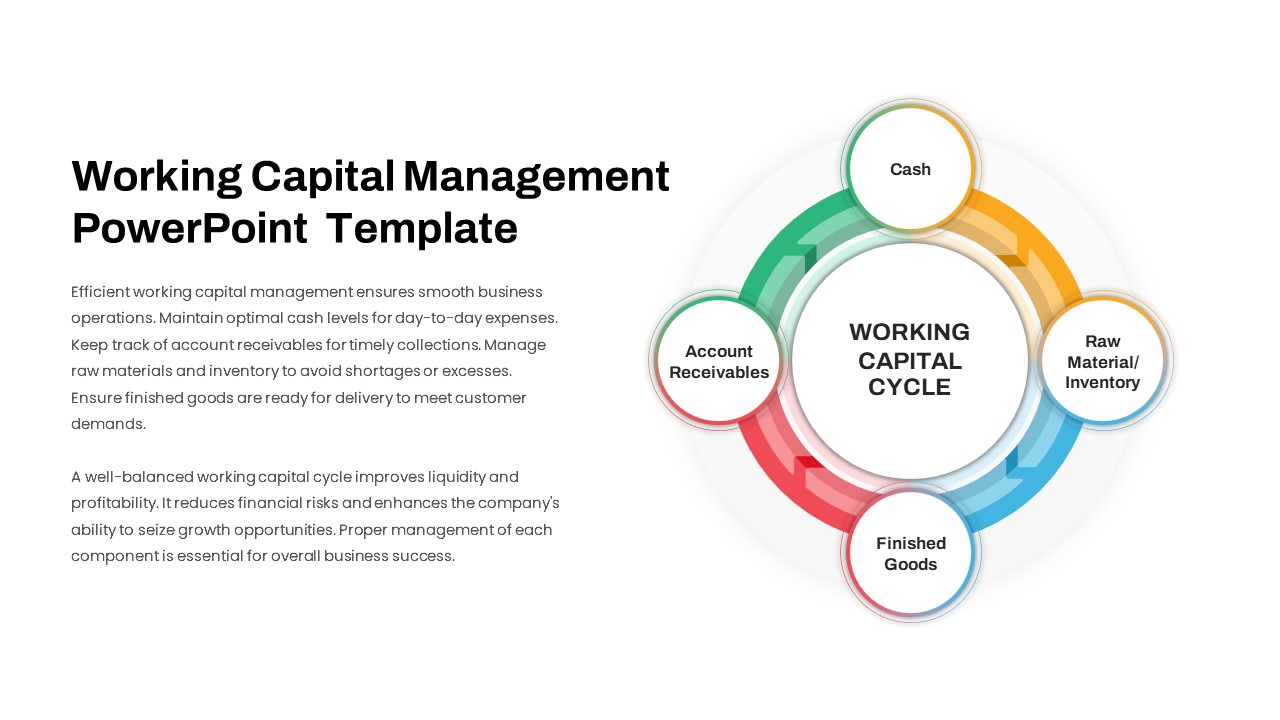
Working Capital Cycle Diagram Template for PowerPoint & Google Slides
Circular
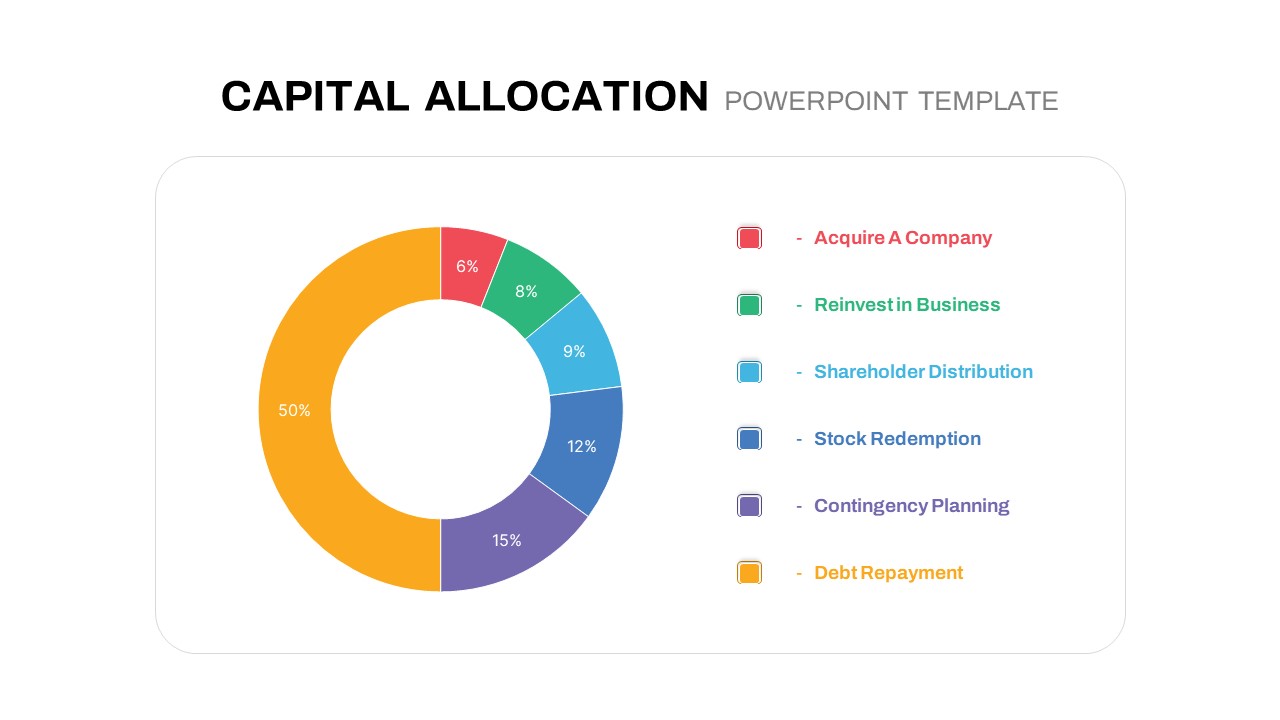
Circular Capital Allocation Diagram Template for PowerPoint & Google Slides
Business Models
Capital Structure Dynamic Split Chart Template for PowerPoint & Google Slides
Comparison Chart
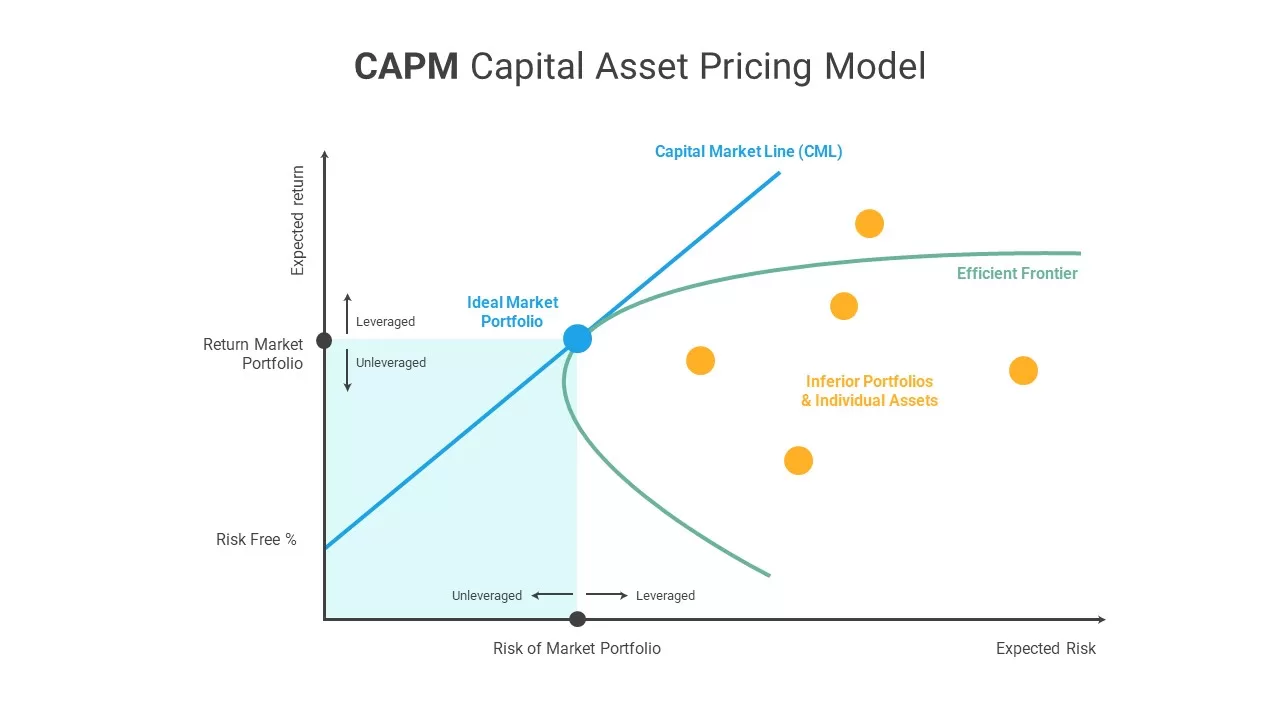
CAPM Capital Asset Pricing Model template for PowerPoint & Google Slides
Finance
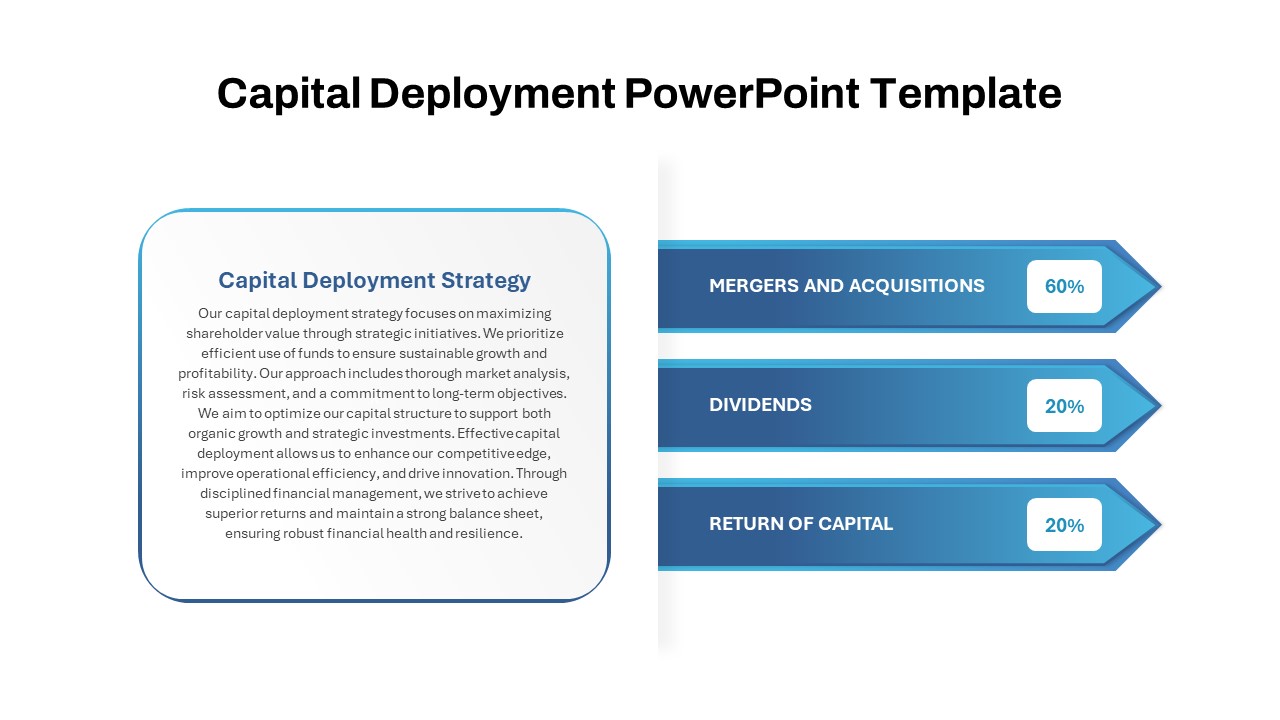
Capital Deployment Percentage Breakdown Template for PowerPoint & Google Slides
Pitch Deck
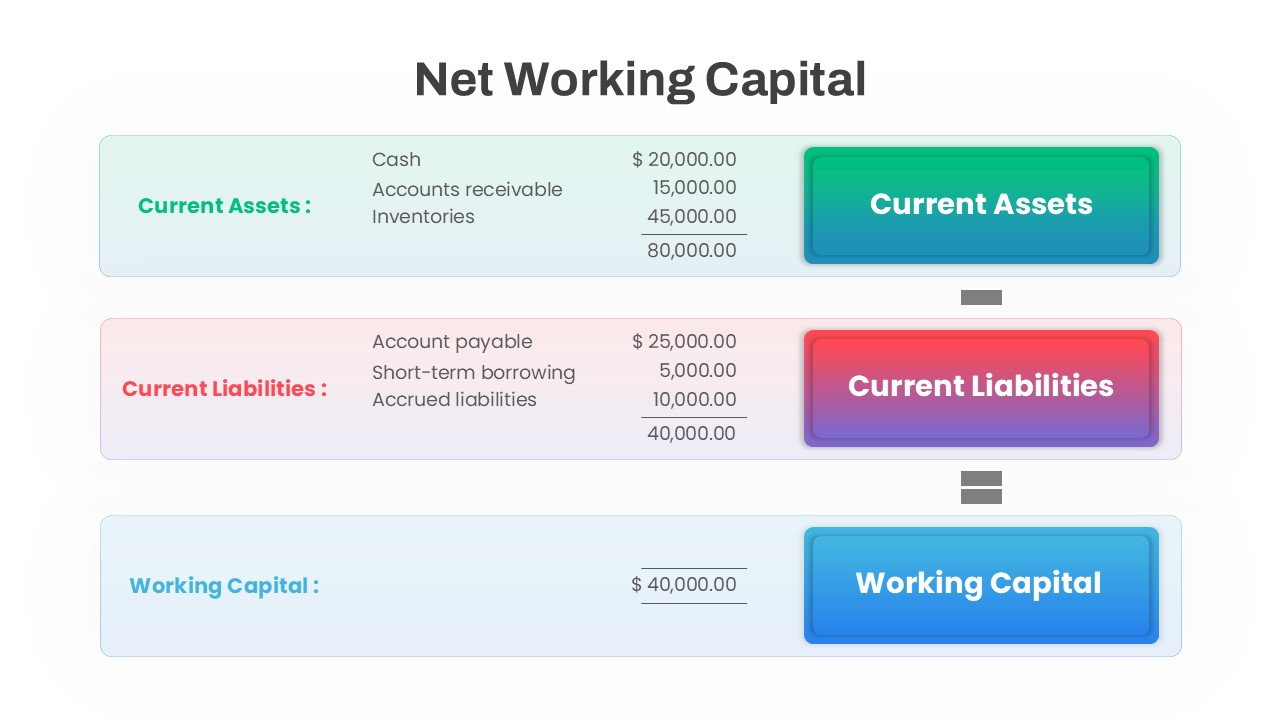
Net Working Capital Calculation Template for PowerPoint & Google Slides
Finance
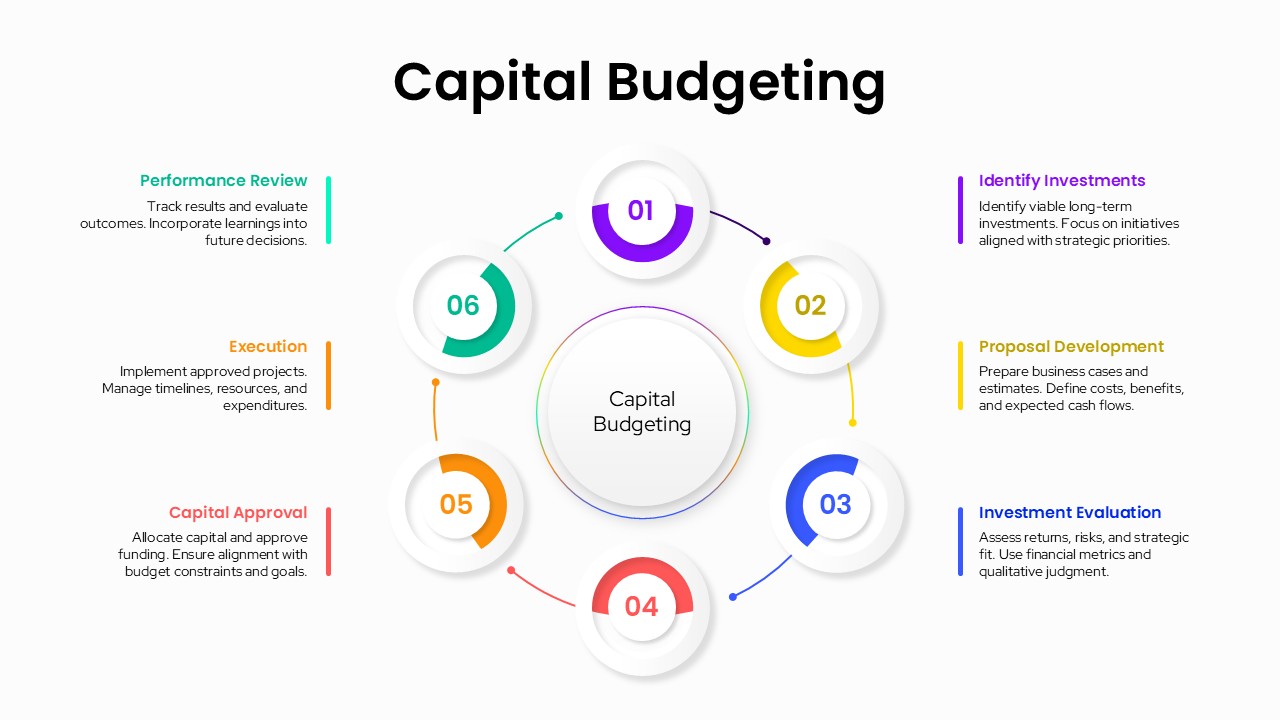
Capital Budgeting Template for PowerPoint & Google Slides
Finance
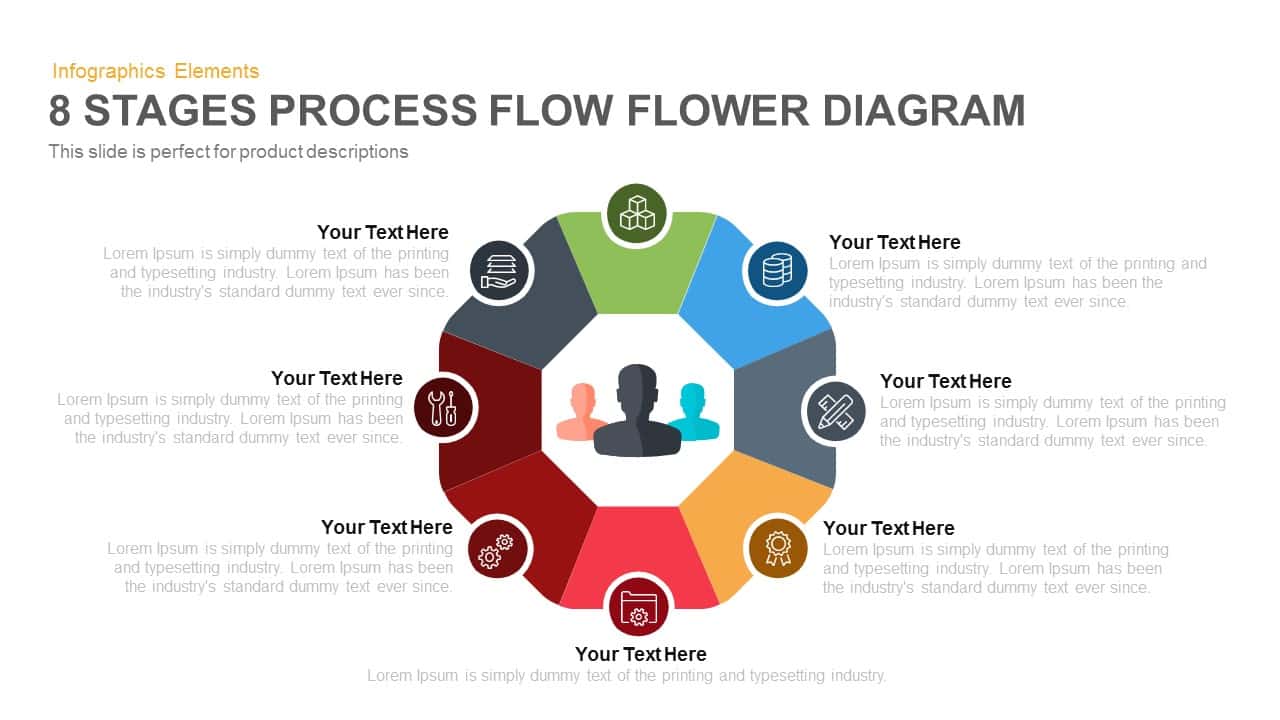
8-Stage Process Flow Flower Diagram Template for PowerPoint & Google Slides
Infographics
4 Section Pipe Diagram Process Flow Template for PowerPoint & Google Slides
Process
Dynamic Shield Process Flow Diagram template for PowerPoint & Google Slides
Process
Six Hexagon Stages Process Flow Diagram Template for PowerPoint & Google Slides
Process
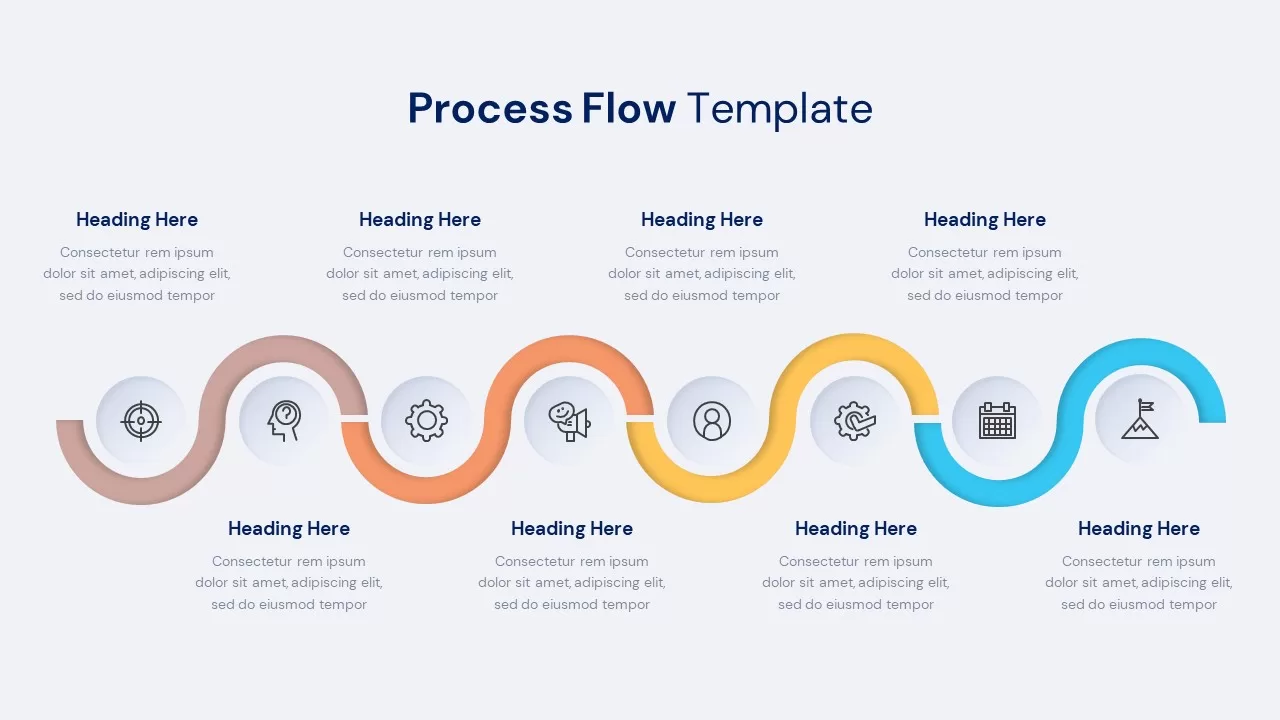
Process Flow Diagram template for PowerPoint & Google Slides
Infographics

15-Step Process Flow Diagram Template for PowerPoint & Google Slides
Process
3D Shape Linear Process Flow Diagram Template for PowerPoint & Google Slides
Process
Linear Process Flow Circles Diagram Template for PowerPoint & Google Slides
Process
Six-Stage Zig-Zag Process Flow Diagram Template for PowerPoint & Google Slides
Process
Vertical Business Process Flow Diagram Template for PowerPoint & Google Slides
Process
Six-Sided Shutter Diagram Process Flow Template for PowerPoint & Google Slides
Process

10 Stages Business Flow Process Diagram template for PowerPoint & Google Slides
Business

Eight-Stage Radial Process Flow Diagram Template for PowerPoint & Google Slides
Process
Four-Plus Process Flow Diagram Template for PowerPoint & Google Slides
Process
Five Stage Linear Process Flow Diagram Template for PowerPoint & Google Slides
Process
Five-Stage Linear Process Flow Diagram Template for PowerPoint & Google Slides
Process
Six-Step Hexagon Process Flow Diagram Template for PowerPoint & Google Slides
Process
Five-Stage Circular Process Flow Diagram Template for PowerPoint & Google Slides
Circular
5-Stage Gear Process Flow Diagram Template for PowerPoint & Google Slides
Process
3D Seven-Stage Process Flow Diagram Template for PowerPoint & Google Slides
Process
Four-Stage Linear Process Flow Diagram Template for PowerPoint & Google Slides
Process
5-Stage Linear Process Flow Diagram Template for PowerPoint & Google Slides
Process
5 Stage Linear Process Flow Diagram Template for PowerPoint & Google Slides
Process
Five-Stage Process Flow Diagram Template for PowerPoint & Google Slides
Process
4 Stage Linear Process Flow Diagram Template for PowerPoint & Google Slides
Process
7 Stage Linear Process Flow Diagram Template for PowerPoint & Google Slides
Process
8 Step Circular Process Flow Diagram Template for PowerPoint & Google Slides
Process
4 Stage Linear Process Flow Diagram Template for PowerPoint & Google Slides
Process
6-Step Business Process Flow Diagram Template for PowerPoint & Google Slides
Process
6-Step Circular Process Flow Diagram Template for PowerPoint & Google Slides
Process
4-Stage Linear Process Flow Diagram Template for PowerPoint & Google Slides
Process
4-Step Linear Process Flow Diagram Template for PowerPoint & Google Slides
Process
Business Process Management Flow Diagram Template for PowerPoint & Google Slides
Process
Colorful 8-Stage Droplet Process Flow Diagram Template for PowerPoint & Google Slides
Process
Minimal Process Flow Diagram Infographic Template for PowerPoint & Google Slides
Process
Process Flow Diagram template for PowerPoint & Google Slides
Process
Curved Arrow Process Flow Diagram Template for PowerPoint & Google Slides
Process
Curved Arrow Process Flow Diagram Template for PowerPoint & Google Slides
Arrow
3D Conveyor Belt Process Flow Diagram Template for PowerPoint & Google Slides
Process
E-Waste Management Process Flow Diagram Template for PowerPoint & Google Slides
Process
Comprehensive Process Flow Diagram Template for PowerPoint & Google Slides
Process
Animated Gears Process Flow Diagram Template for PowerPoint & Google Slides
Process
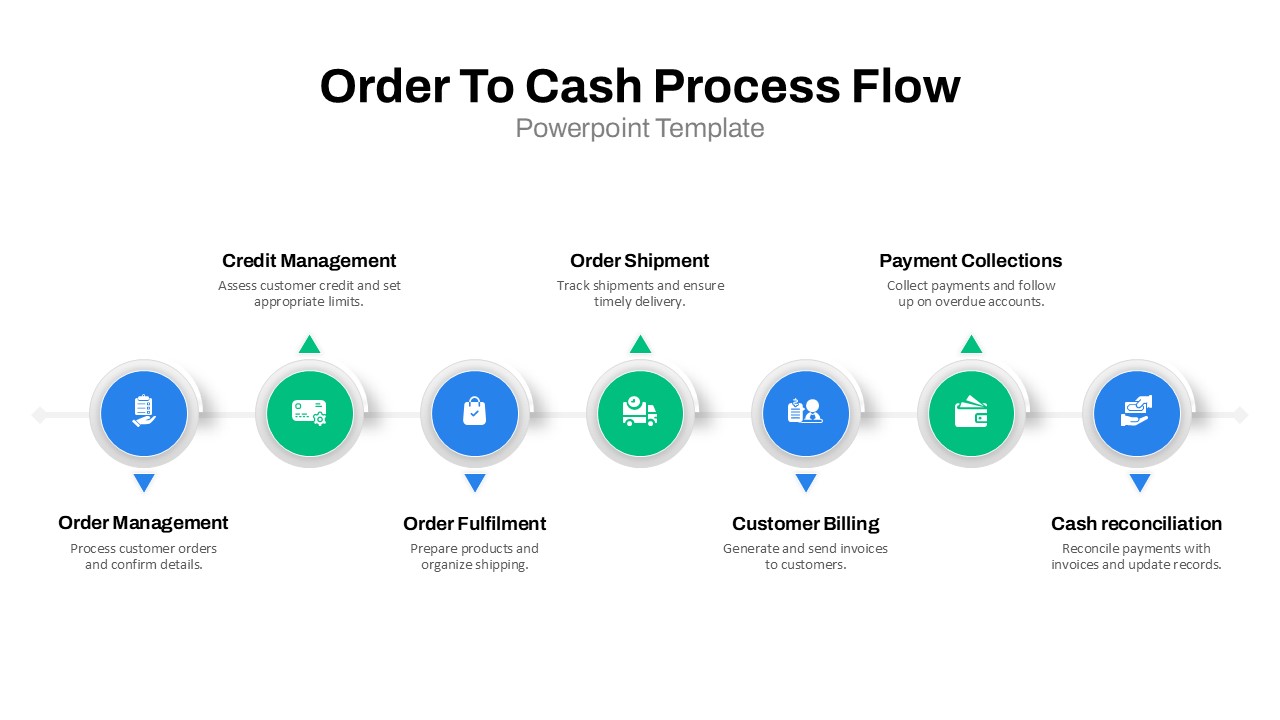
Order to Cash Process Flow Diagram Template for PowerPoint & Google Slides
Process
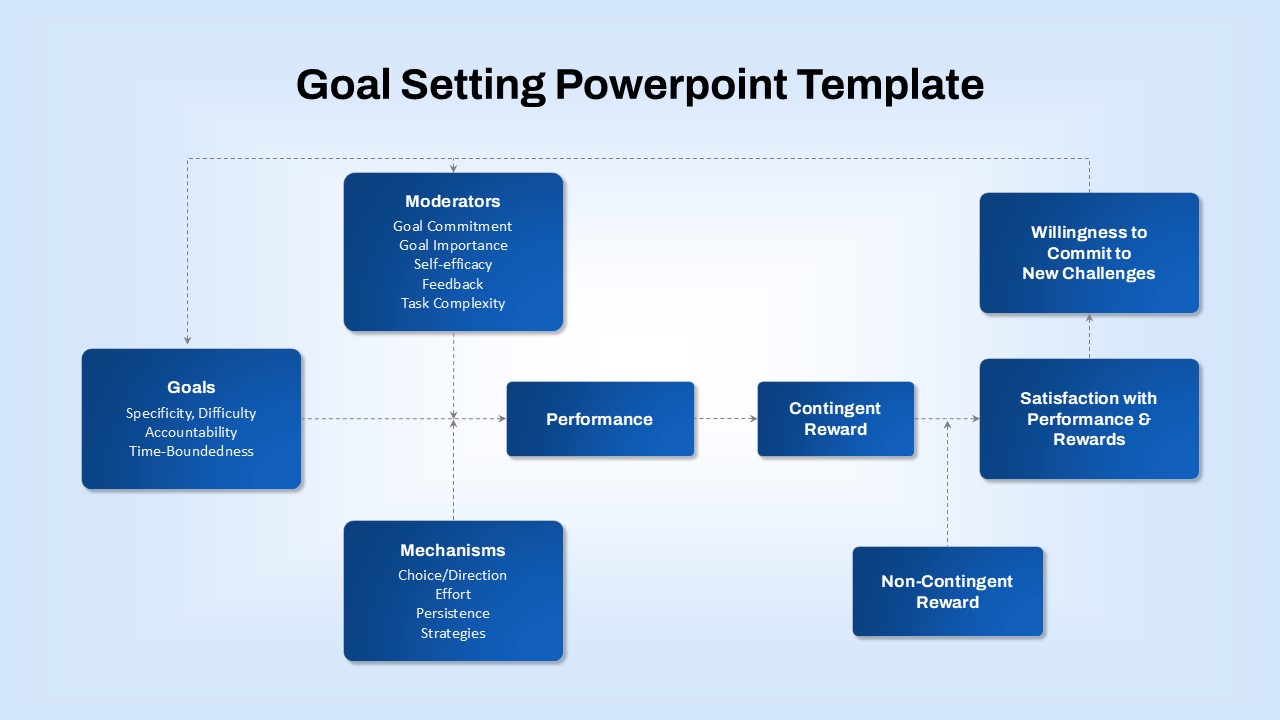
Goal-Setting Process Flow Diagram Template for PowerPoint & Google Slides
Goals
Resume Screening Process Flow Diagram Template for PowerPoint & Google Slides
Process
Q-Learning Process Flow Diagram Template for PowerPoint & Google Slides
Process
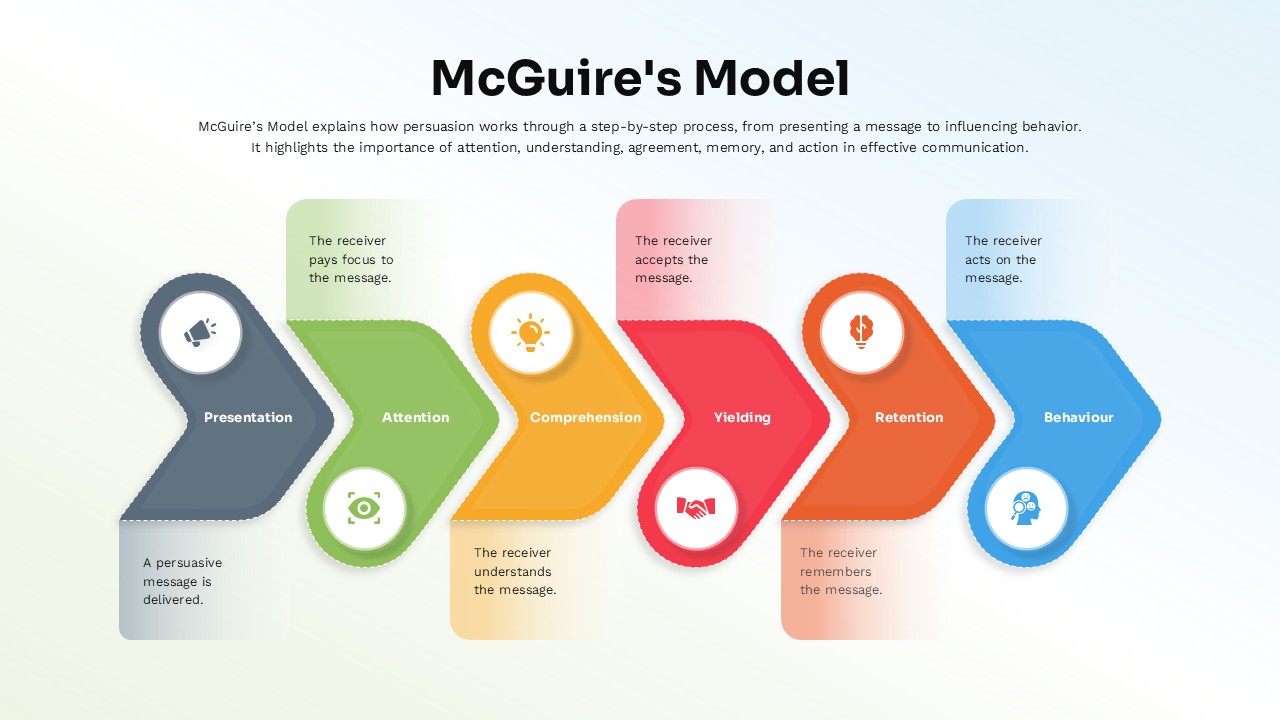
McGuire’s Persuasion Process Flow Diagram Template for PowerPoint & Google Slides
Marketing
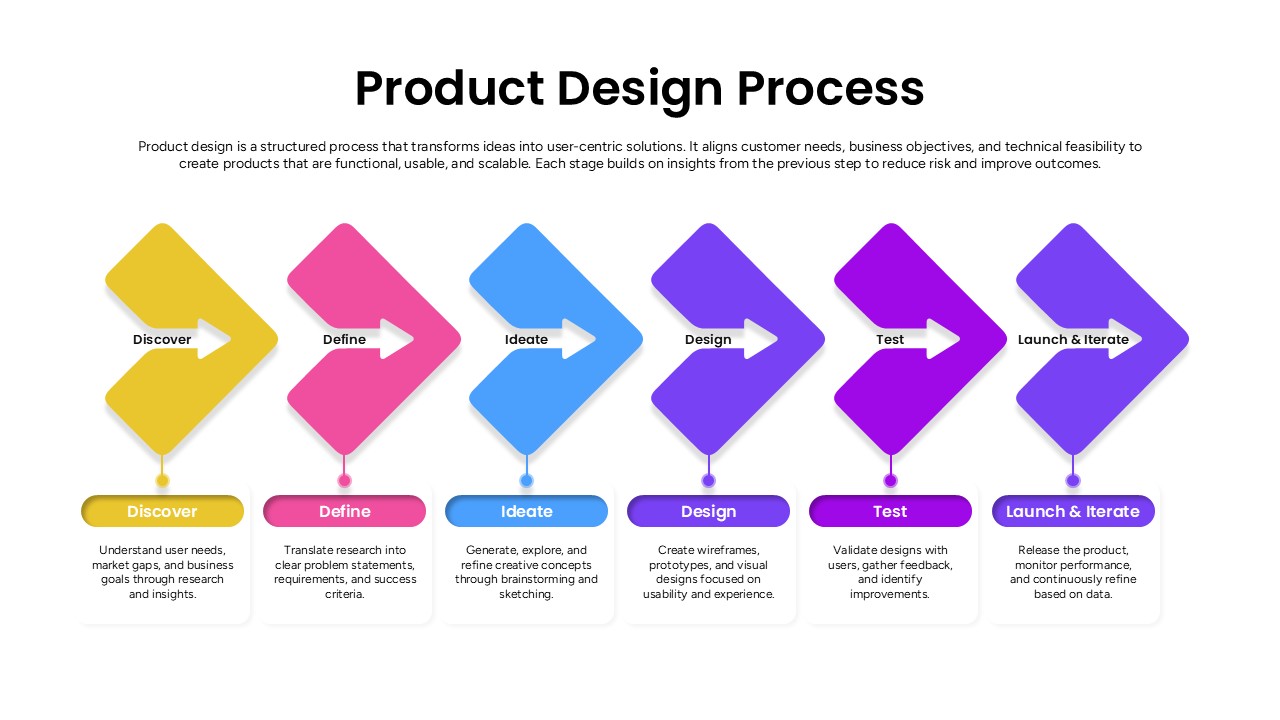
Product Design Process Flow Diagram Template for PowerPoint & Google Slides
Process
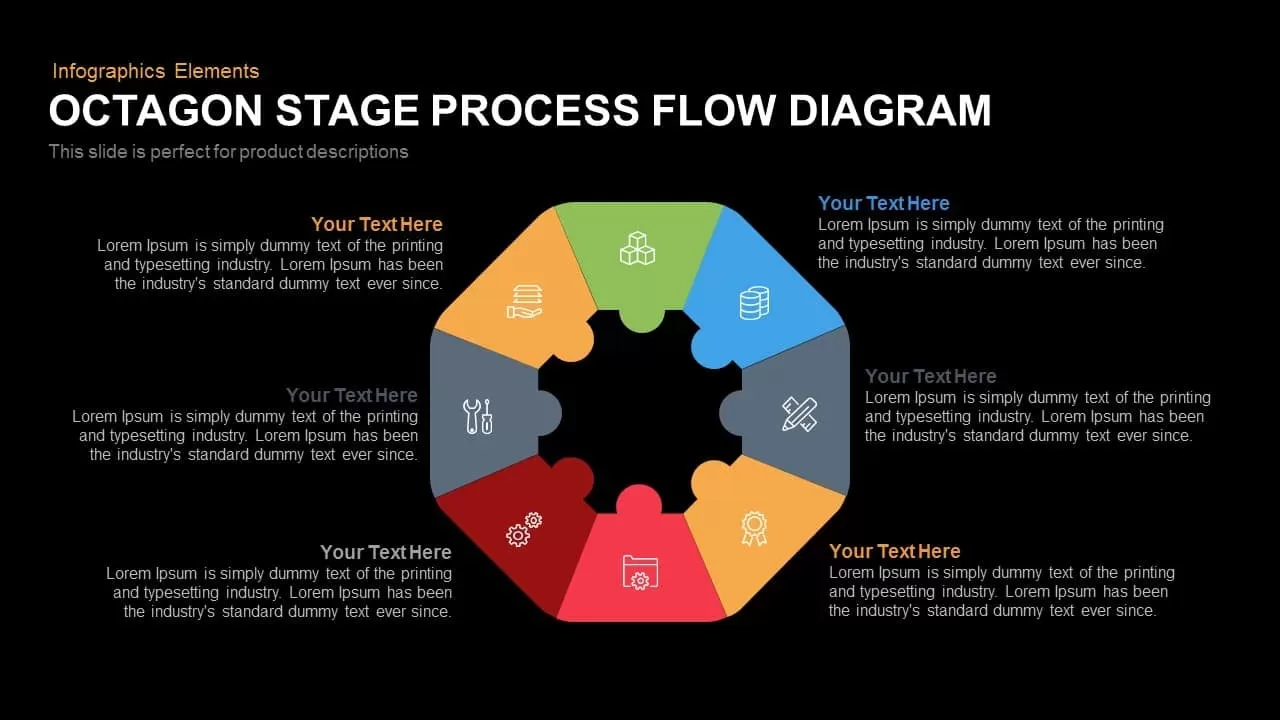
Octagon Stage Process Flow Diagram for PowerPoint & Google Slides
Process
8 Step Linear Process Flow Diagram for PowerPoint & Google Slides
Process
5 Step Process Flow Diagram for PowerPoint & Google Slides
Process

Color-Coded SIPOC Diagram with Process Flow for PowerPoint & Google Slides
Process
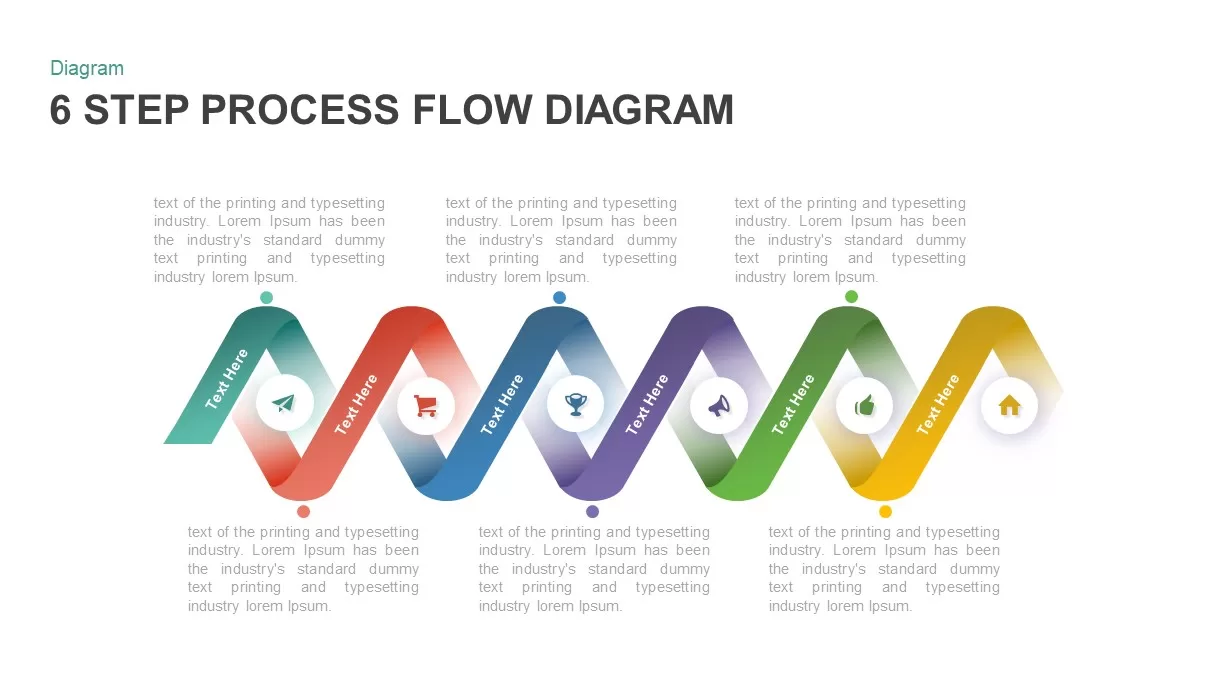
6 Step Process Flow Diagram for PowerPoint & Google Slides
Charts
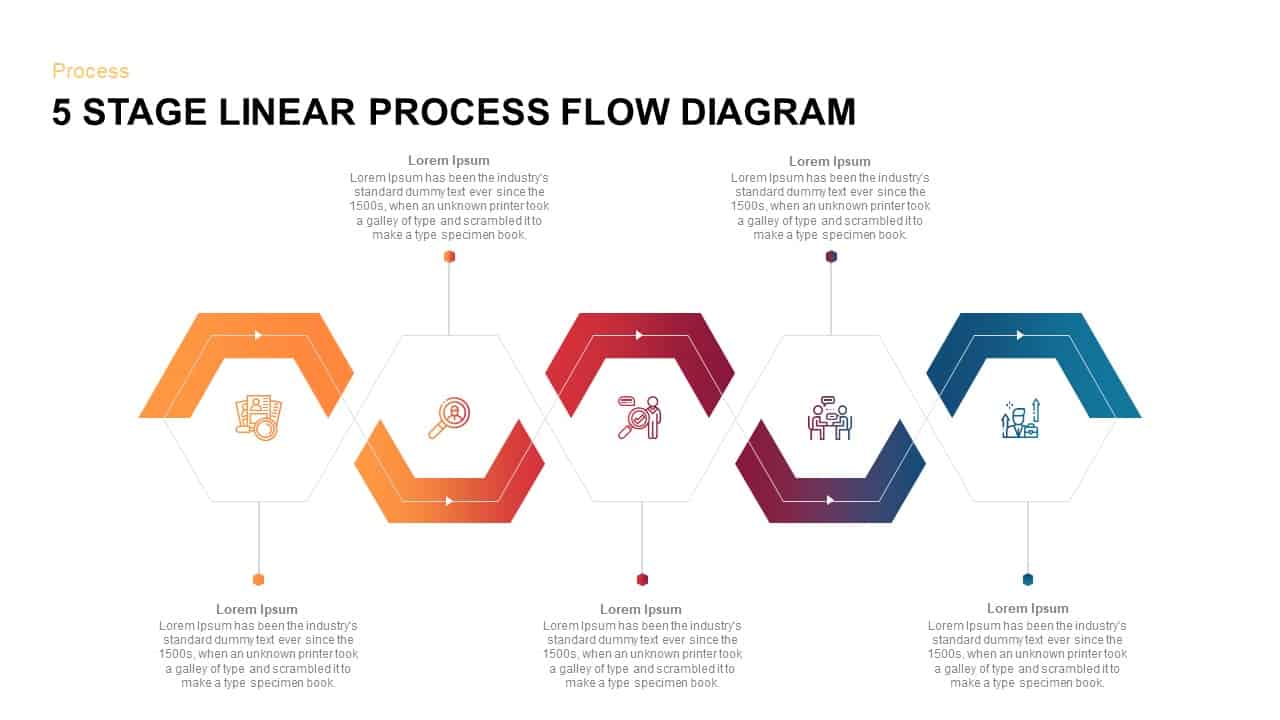
5 Steps Linear Process Flow Diagram template
Process
Octagon Process Flow template for PowerPoint & Google Slides
Process
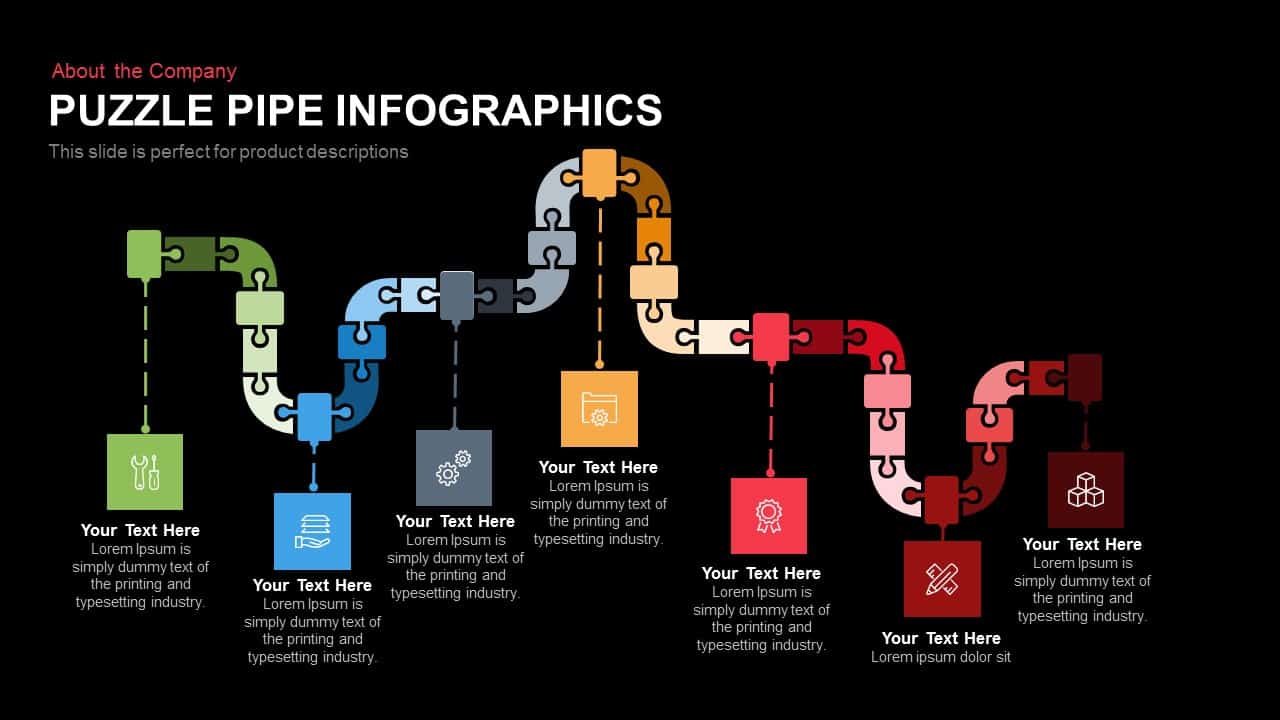
Puzzle Pipe Infographics Process Flow Template for PowerPoint & Google Slides
Process
Five Stage Linear Process Flow Template for PowerPoint & Google Slides
Process
5-Stage Arrow Infographics Process Flow Template for PowerPoint & Google Slides
Arrow
Five-Stage Direct Flow Arrow Process Template for PowerPoint & Google Slides
Arrow
Isometric Five-Stage Process Flow Template for PowerPoint & Google Slides
Process
Five-Step Hexagonal Process Flow Template for PowerPoint & Google Slides
Process
Gradient Chevron Five-Stage Process Flow Template for PowerPoint & Google Slides
Arrow
5-Step Circular Gradient Process Flow Template for PowerPoint & Google Slides
Process
Recognition-Primed Decision Process Flow Template for PowerPoint & Google Slides
Flow Charts
Process Flow Overview template for PowerPoint & Google Slides
Business
Process Flow Steps template for PowerPoint & Google Slides
Business Plan
Colorful Process Flow Template for PowerPoint & Google Slides
Process
Colorful Process Flow Infographics Template for PowerPoint & Google Slides
Process
Process Flow Template for PowerPoint & Google Slides
Process
Free
Process Flow Template for PowerPoint & Google Slides
Process
Free
4 stage Process Flow template for PowerPoint & Google Slides
Process
Circle Arrows Process Flow template for PowerPoint & Google Slides
Process
Circular Arrows Process Flow template for PowerPoint & Google Slides
Process
Curved Arrow Process Flow template for PowerPoint & Google Slides
Process
Circular Arrows Process Flow template for PowerPoint & Google Slides
Process
Circular Arrows Process Flow template for PowerPoint & Google Slides
Process
Circle Arrow Process Flow template for PowerPoint & Google Slides
Process
Circle Arrow Process Flow template for PowerPoint & Google Slides
Process
Hexagonal Process Flow Template for PowerPoint & Google Slides
Process
Conveyor Belt Sequential Process Flow Template for PowerPoint & Google Slides
Process
Current vs Future Process Flow Template for PowerPoint & Google Slides
Comparison
Five-Phase Project Intake Process Flow Template for PowerPoint & Google Slides
Process
Talent Acquisition Process Flow Template for PowerPoint & Google Slides
Recruitment

DevOps Infographics & Process Flow Template for PowerPoint & Google Slides
Information Technology
Neurology Neuron Structure Process Flow Template for PowerPoint & Google Slides
Health
Wastewater Treatment Process Flow Chart Template for PowerPoint & Google Slides
Flow Charts
Animated Process Flow Chart Template for PowerPoint & Google Slides
Infographics
Banking as a Service (BaaS) Process Flow Template for PowerPoint & Google Slides
Process
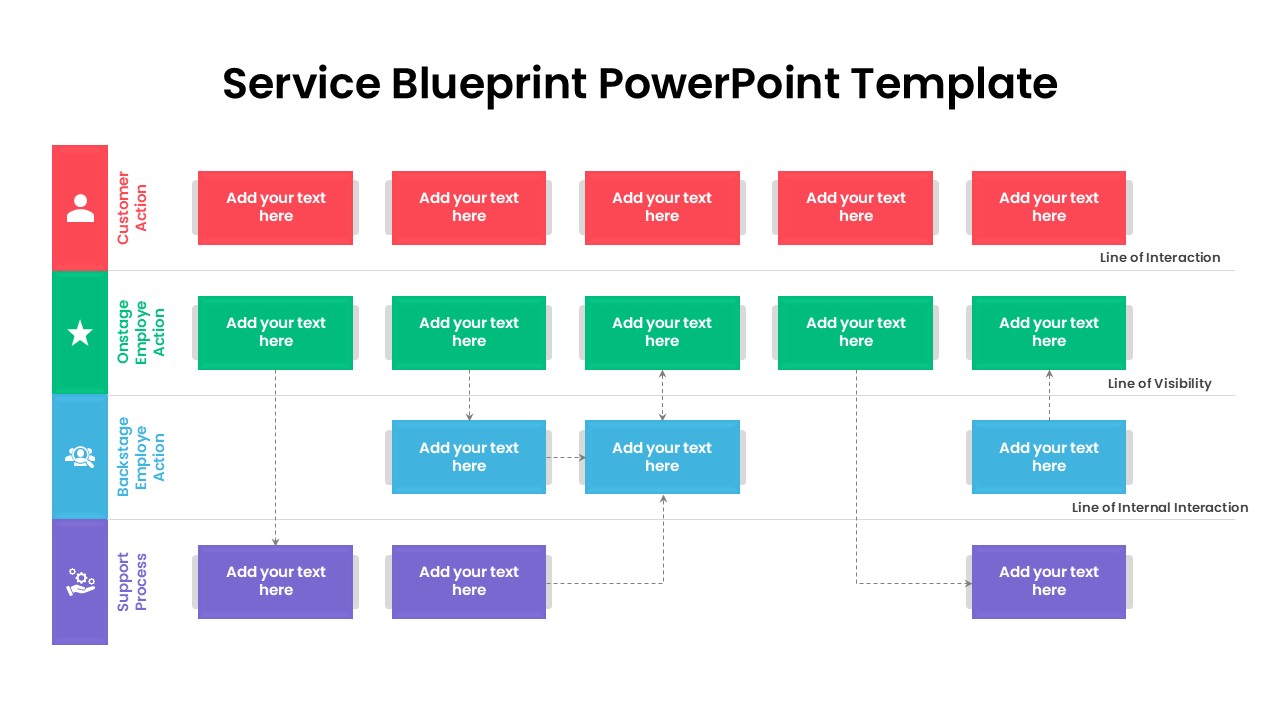
Service Blueprint Process Flow Template for PowerPoint & Google Slides
Process
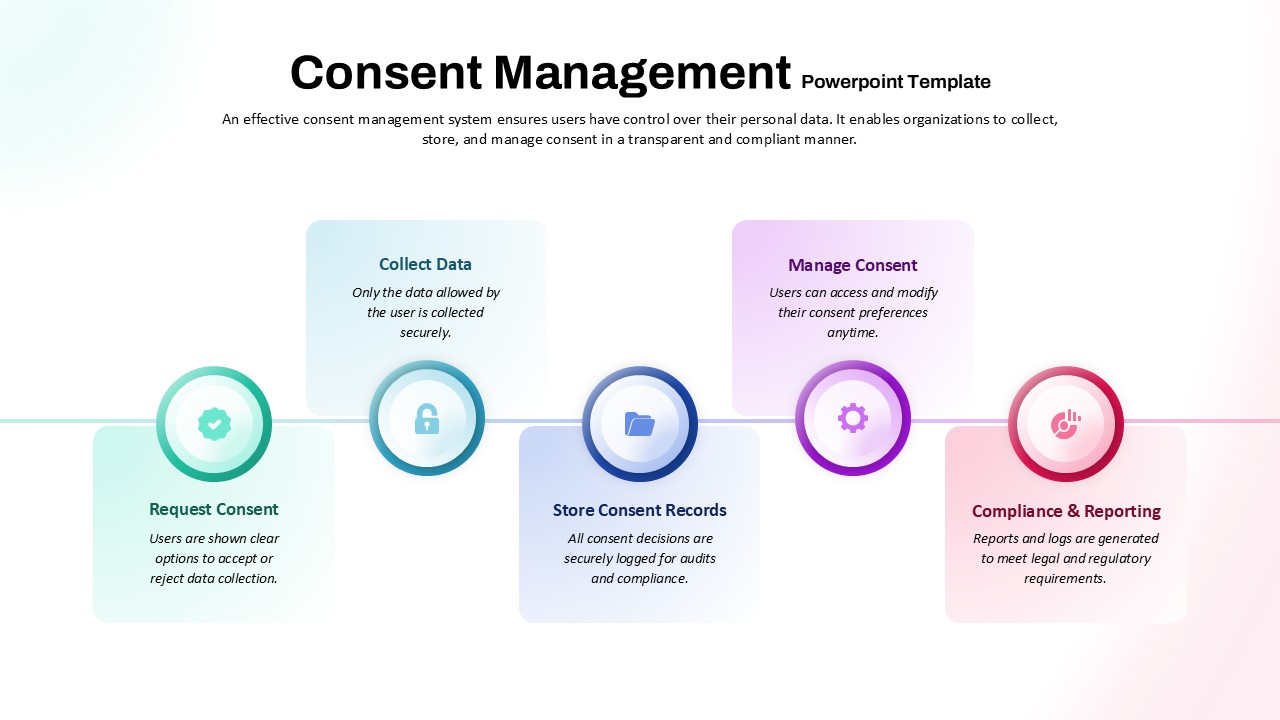
Consent Management System Process Flow Template for PowerPoint & Google Slides
Process