Capex vs Opex Comparison Template for PowerPoint & Google Slides


Description
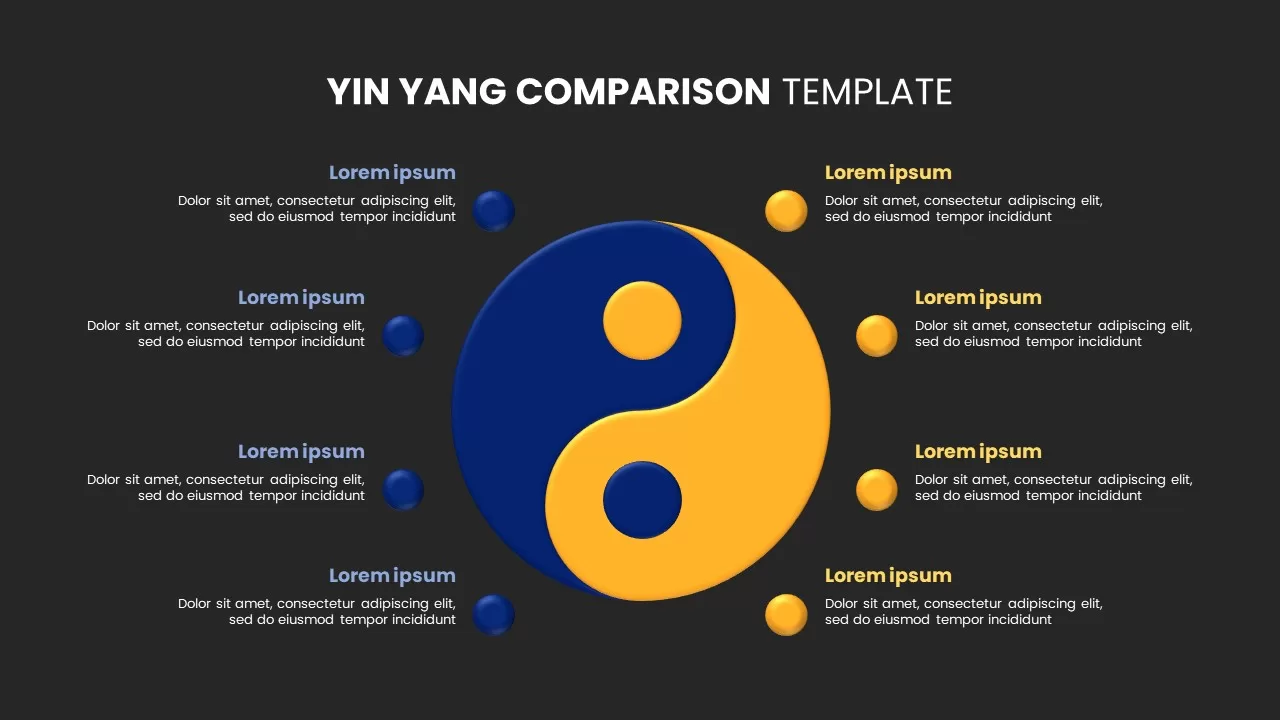
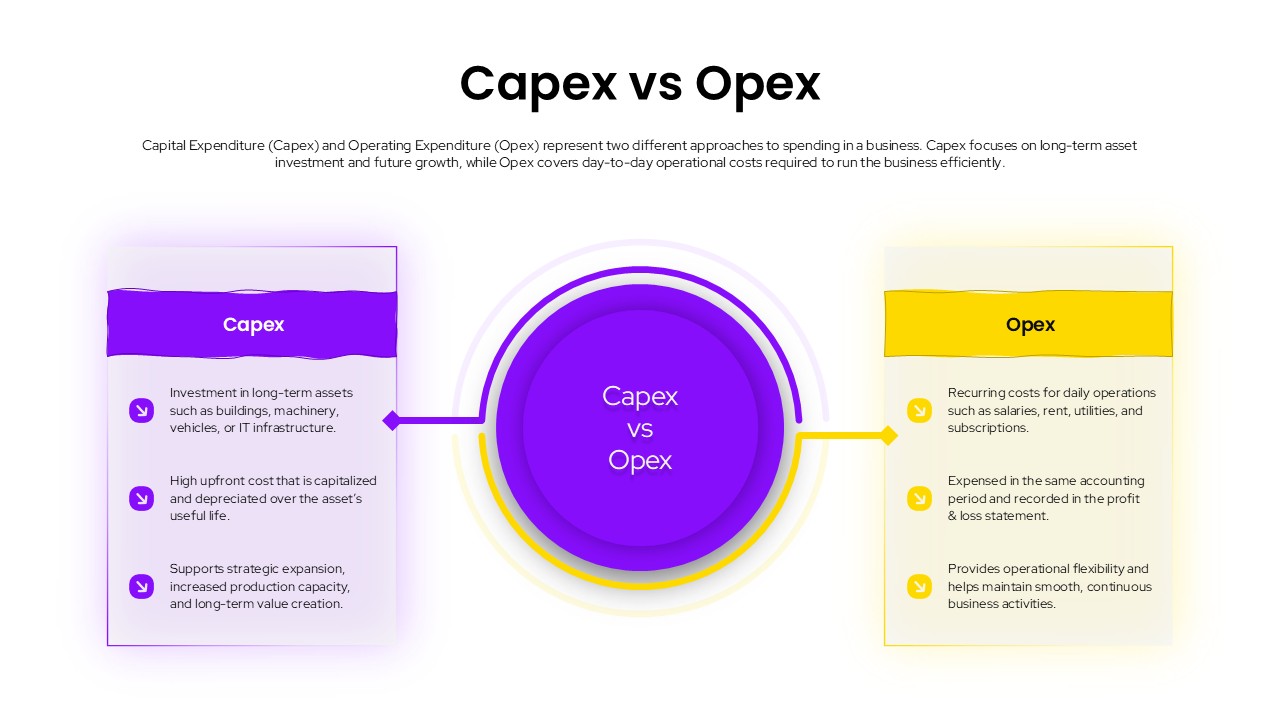
This professional Capex vs Opex comparison template provides a clear visual distinction between capital expenditures and operational expenditures through a symmetrical two-column layout. The template features a central circular focal point connecting both concepts with strategic color coding – purple for Capex and yellow for Opex. Each section includes three bullet points with checkmark icons, making complex financial concepts easily digestible. Available in both dark and light themes, this template uses modern gradient designs and high-contrast elements to ensure maximum visual impact and readability.
Who is it for
This template is ideal for financial managers, business analysts, CFOs, accounting professionals, and consultants who need to explain spending strategies and investment decisions. It’s perfect for corporate finance teams conducting budget planning sessions, business school instructors teaching financial concepts, and executives presenting to stakeholders about expenditure classifications and their strategic implications.
Other Uses
Beyond basic Capex vs Opex comparisons, this template can be adapted for various business comparison scenarios including cost-benefit analyses, strategic planning presentations, investor briefings, financial training workshops, and audit presentations. It’s also valuable for procurement teams explaining purchasing decisions, startup founders discussing funding allocation, and management consultants delivering client recommendations on financial optimization strategies.
Frequently Asked Questions
What's the difference between the dark and light theme versions?
Can I customize the bullet points for my specific Capex and Opex examples?
Login to download this file

Item ID
SB05856Designed By
Naseeba Sithara
Related Templates

Service Zoom Feature Slides Comparison template for PowerPoint & Google Slides
Process
Simple Comparison Table Template for PowerPoint & Google Slides
Comparison
Four-Tier Pricing Comparison Table Template for PowerPoint & Google Slides
Comparison
Speedometer Infographic Gauge Comparison Template for PowerPoint & Google Slides
Comparison
Four Section Comparison Chart Diagram Template for PowerPoint & Google Slides
Infographics
3-Column Comparison template for PowerPoint & Google Slides
Comparison

Clean Mobile Service Comparison Slide Template for PowerPoint & Google Slides
Comparison

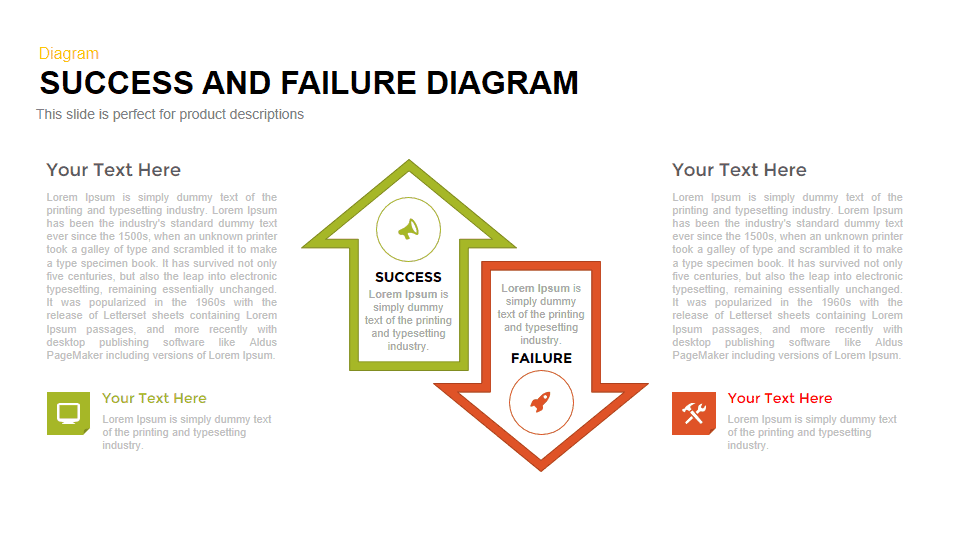
Success vs Failure Comparison Diagram Template for PowerPoint & Google Slides
Comparison
Scale Metaphor Metrics Comparison Template for PowerPoint & Google Slides
Charts
Four-Plan Pricing Table Comparison Template for PowerPoint & Google Slides
Comparison
Dual Percentage Comparison Metaphor Template for PowerPoint & Google Slides
Comparison
Interactive Product Comparison Bar Chart Template for PowerPoint & Google Slides
Bar/Column

Comparison Pricing Table Infographic Template for PowerPoint & Google Slides
Comparison Chart
Tornado Chart Data Comparison Slide Template for PowerPoint & Google Slides
Bar/Column
Radar Chart Product Comparison Template for PowerPoint & Google Slides
Comparison Chart
Six-Metric Green Product Comparison Template for PowerPoint & Google Slides
Comparison
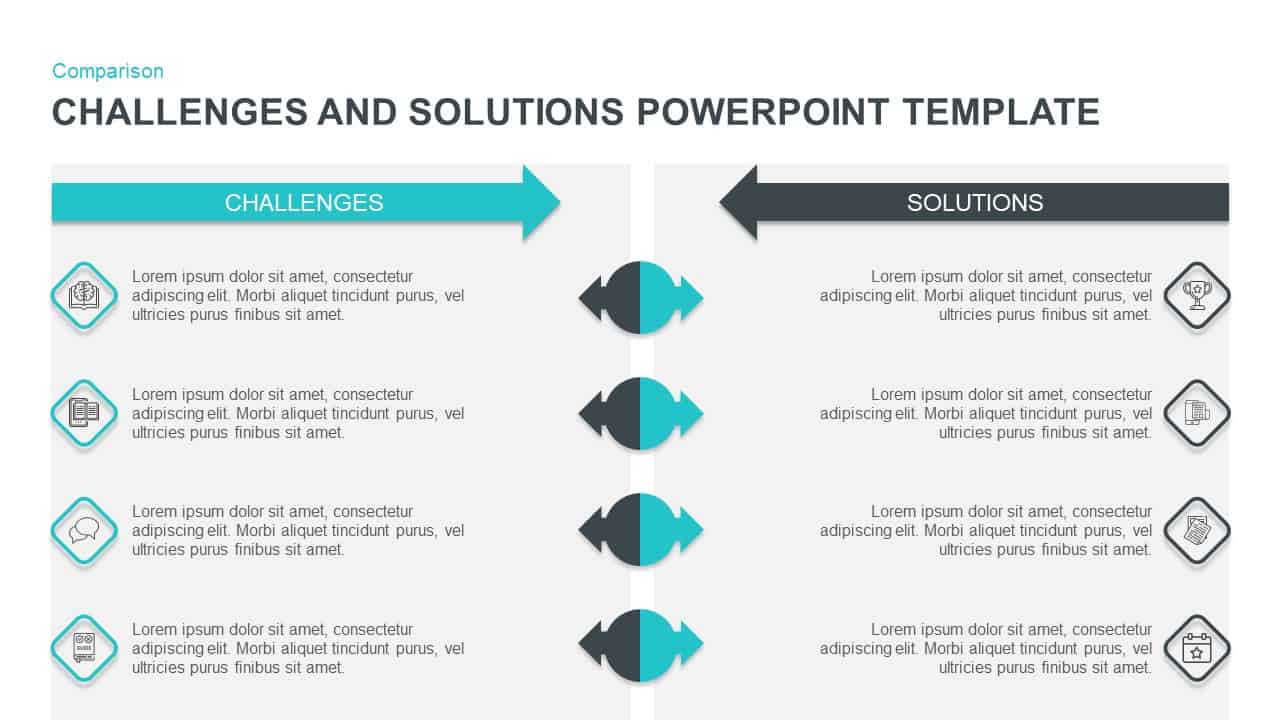
Challenges vs Solutions Comparison Template for PowerPoint & Google Slides
Comparison
Two-Column Comparison Infographic Slide Template for PowerPoint & Google Slides
Comparison
Seller Portals Comparison Infographic Template for PowerPoint & Google Slides
Process
Fact and Figures Comparison Slide Template for PowerPoint & Google Slides
Business Report

BMI Category Comparison Chart Template for PowerPoint & Google Slides
Comparison
Isometric 3D Block Comparison Diagram Template for PowerPoint & Google Slides
Comparison
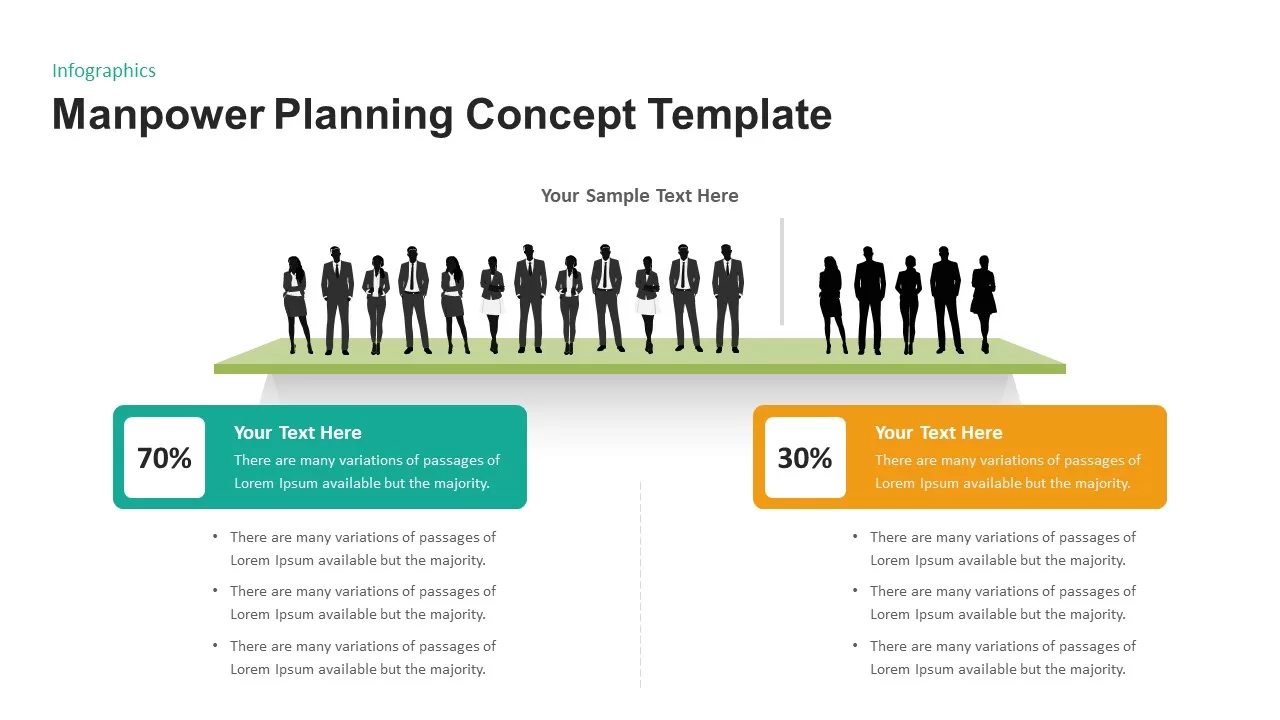
Manpower Planning Concept Comparison Template for PowerPoint & Google Slides
Comparison Chart
Circular Product Comparison Chart Template for PowerPoint & Google Slides
Comparison Chart
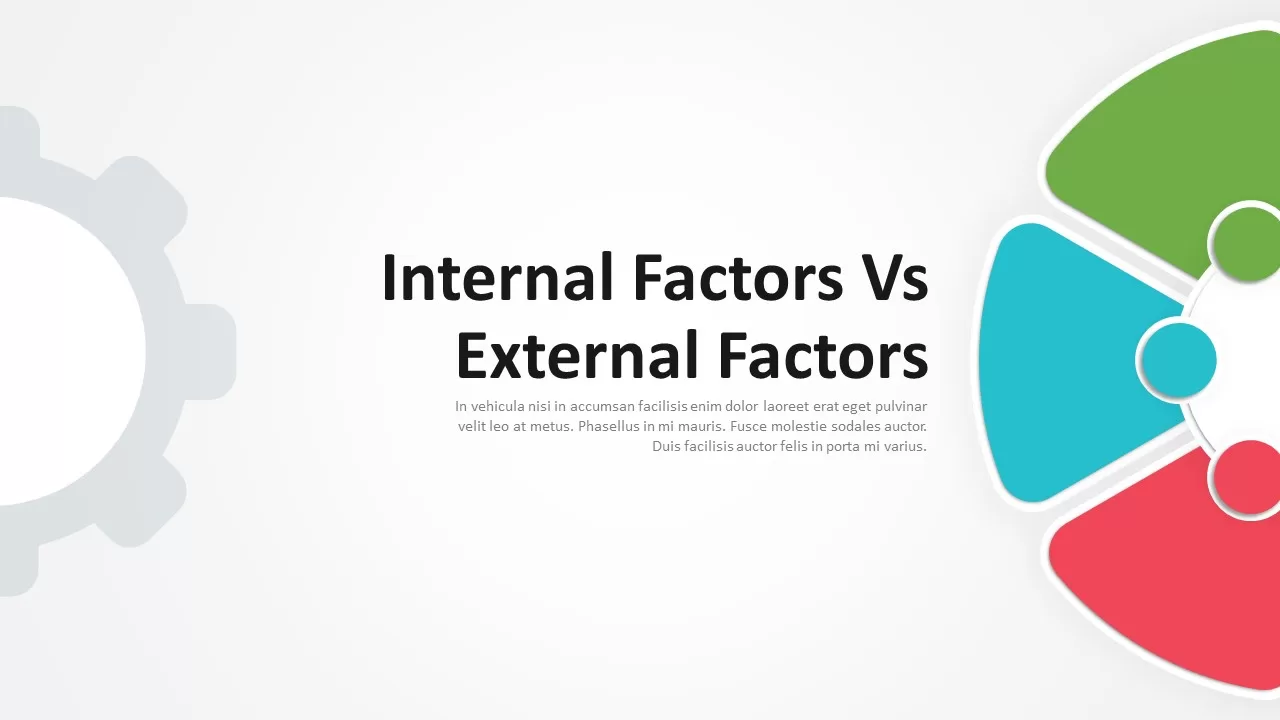
Internal vs External Factors Comparison Template for PowerPoint & Google Slides
Comparison
RAG Status Infographic Comparison Template for PowerPoint & Google Slides
Project
Yin Yang Comparison template for PowerPoint & Google Slides
Business
Comparison Infographic Overview template for PowerPoint & Google Slides
Business
Pugh Matrix Decision Comparison Chart Template for PowerPoint & Google Slides
Comparison Chart
Business Silhouettes Comparison Slide Template for PowerPoint & Google Slides
HR
Current vs Future State Comparison Slide Template for PowerPoint & Google Slides
Comparison Chart
Current vs Future State Comparison Template for PowerPoint & Google Slides
Comparison Chart
Before and After Comparison Infographic Template for PowerPoint & Google Slides
Comparison
Free
Before and After Comparison Slide Template for PowerPoint & Google Slides
Comparison
Challenges & Opportunities Comparison Template for PowerPoint & Google Slides
Opportunities Challenges
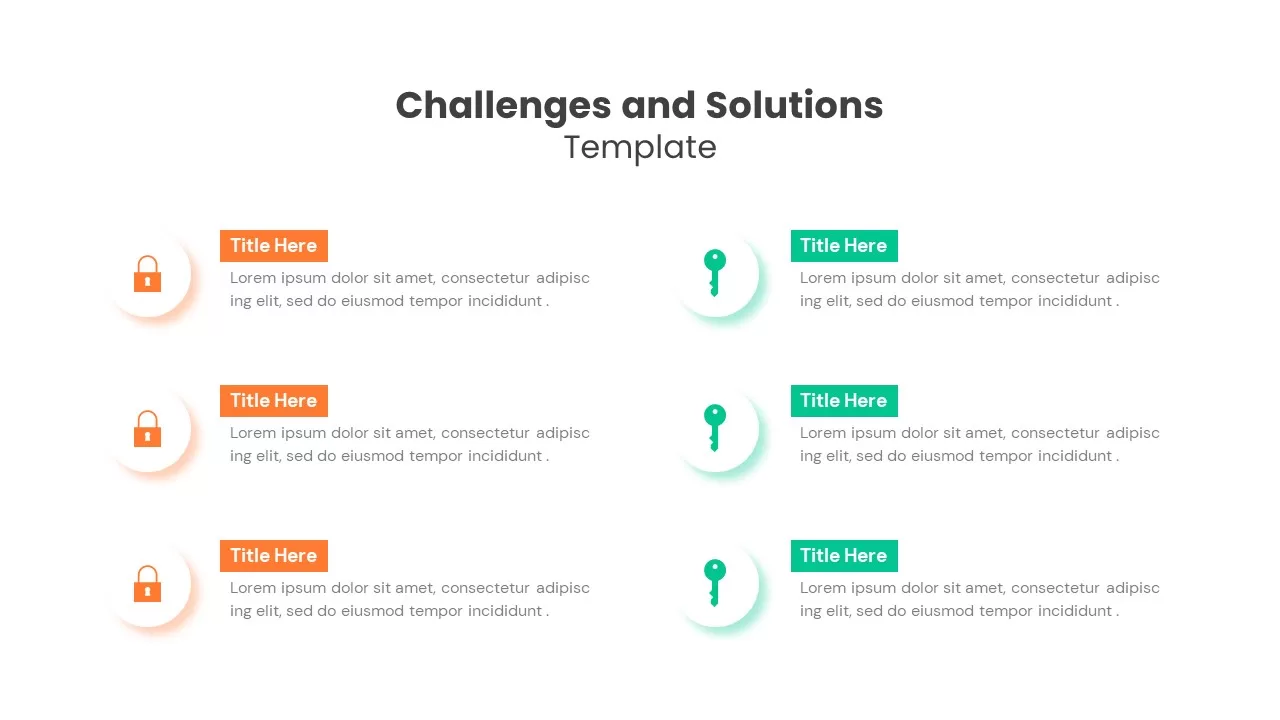
Challenges and Solutions Comparison Template for PowerPoint & Google Slides
Opportunities Challenges
Opportunities Hub-and-Spoke Comparison Diagram Template for PowerPoint & Google Slides
Opportunities Challenges
Modern Before and After Comparison Template for PowerPoint & Google Slides
Infographics
Benchmarking Metrics Comparison Slide Template for PowerPoint & Google Slides
Pie/Donut
Dynamic Benchmarking Comparison Chart Template for PowerPoint & Google Slides
Comparison Chart
Challenges & Solutions Comparison Template for PowerPoint & Google Slides
Opportunities Challenges
Adam’s Equity Theory Scale Comparison Template for PowerPoint & Google Slides
Comparison
Risk Heatmap Comparison Template for PowerPoint & Google Slides
Maps
Heatmap Comparison Template for PowerPoint & Google Slides
Maps
Casino Poker Chips Comparison Slide Template for PowerPoint & Google Slides
Comparison
Vendor Comparison Analysis template for PowerPoint & Google Slides
Comparison Chart
Vendor Comparison Matrix with High-Level Requirements template for PowerPoint & Google Slides
Comparison Chart
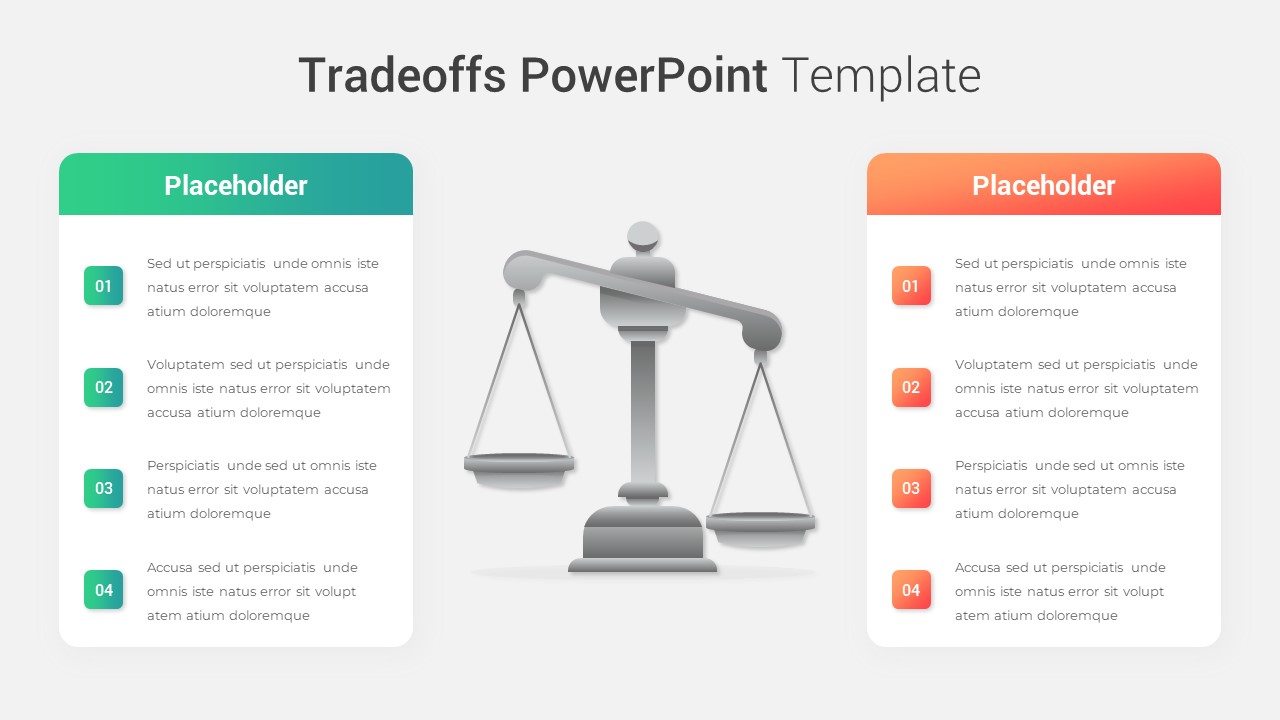
Modern Tradeoffs Comparison Slide Template for PowerPoint & Google Slides
Comparison
Popular Social Media Comparison Grid Template for PowerPoint & Google Slides
Digital Marketing
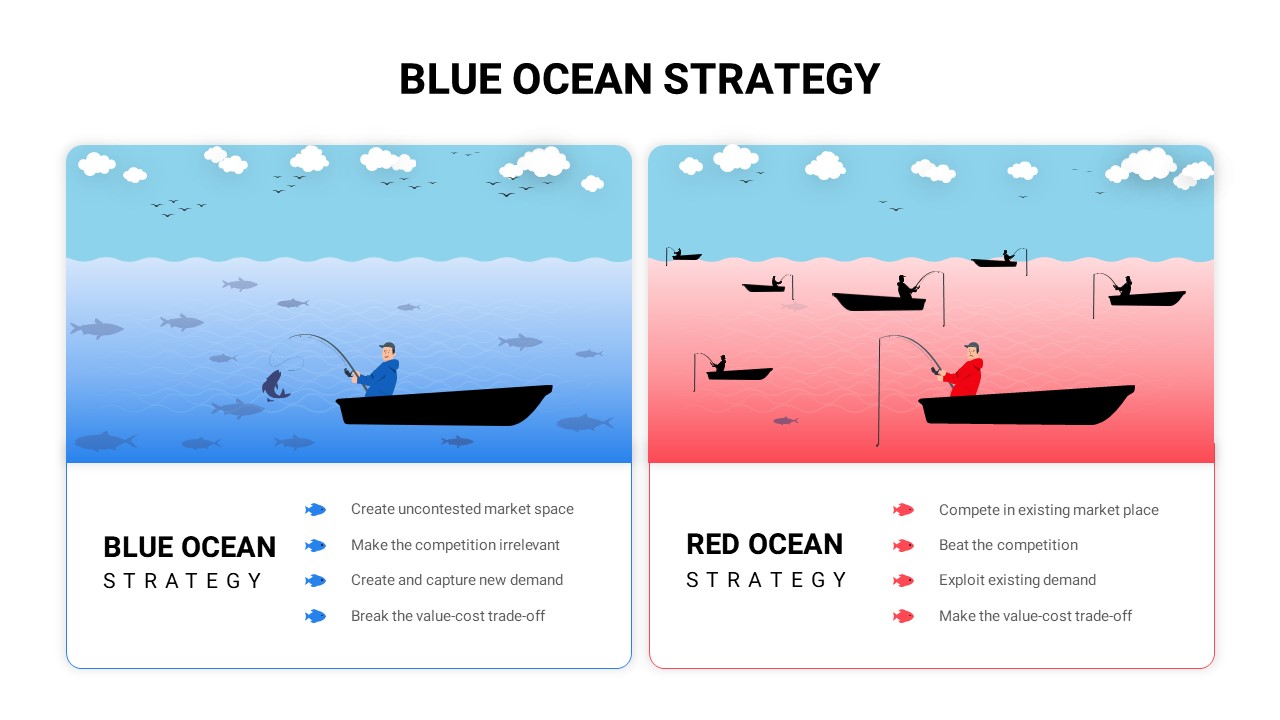
Blue vs Red Ocean Strategy Comparison Template for PowerPoint & Google Slides
Business Strategy
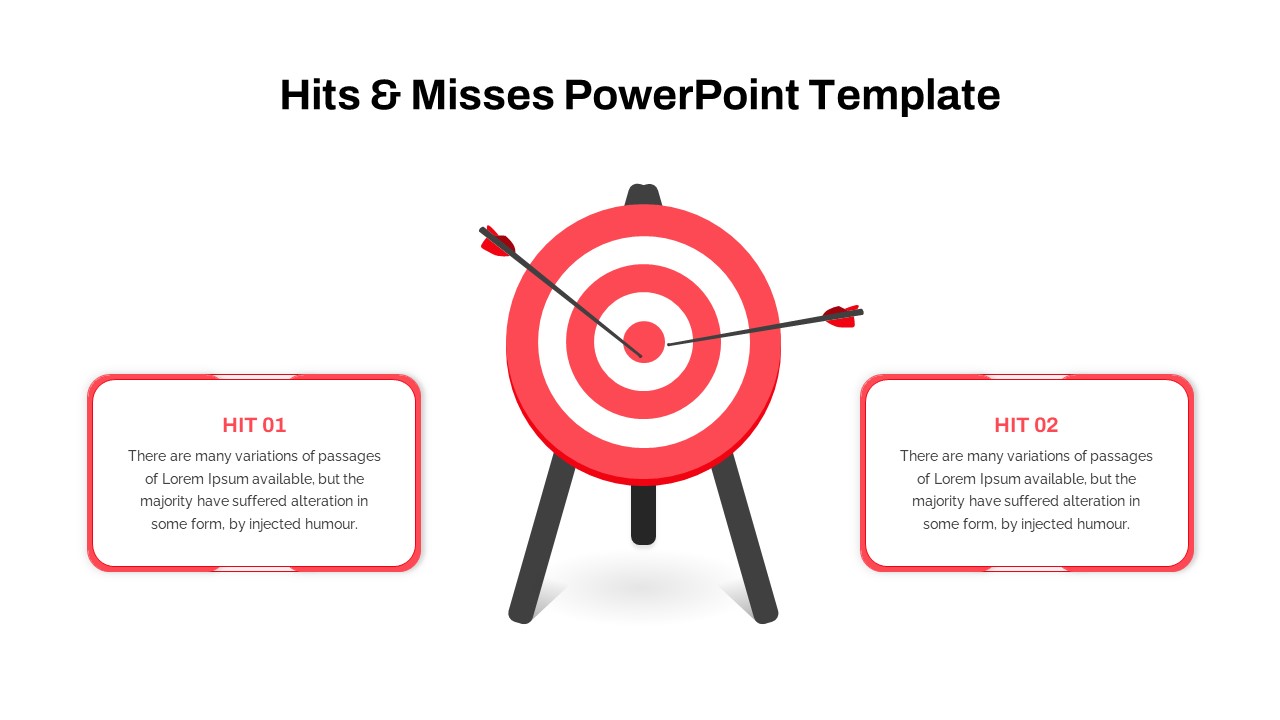
Hits and Misses Performance Comparison Template for PowerPoint & Google Slides
Comparison
People Demographic Comparison Chart Template for PowerPoint & Google Slides
Comparison
Surgery Infographics Comparison Template for PowerPoint & Google Slides
Health
Business Timeline Comparison Bar Chart Template for PowerPoint & Google Slides
Comparison Chart
Grouped Column Chart Comparison Template for PowerPoint & Google Slides
Bar/Column
Multiple Line Chart Comparison Template for PowerPoint & Google Slides
Comparison Chart
Mirror Bar Chart Comparison Template for PowerPoint & Google Slides
Bar/Column
Interactive Multi-Use Cost Comparison Template for PowerPoint & Google Slides
Comparison
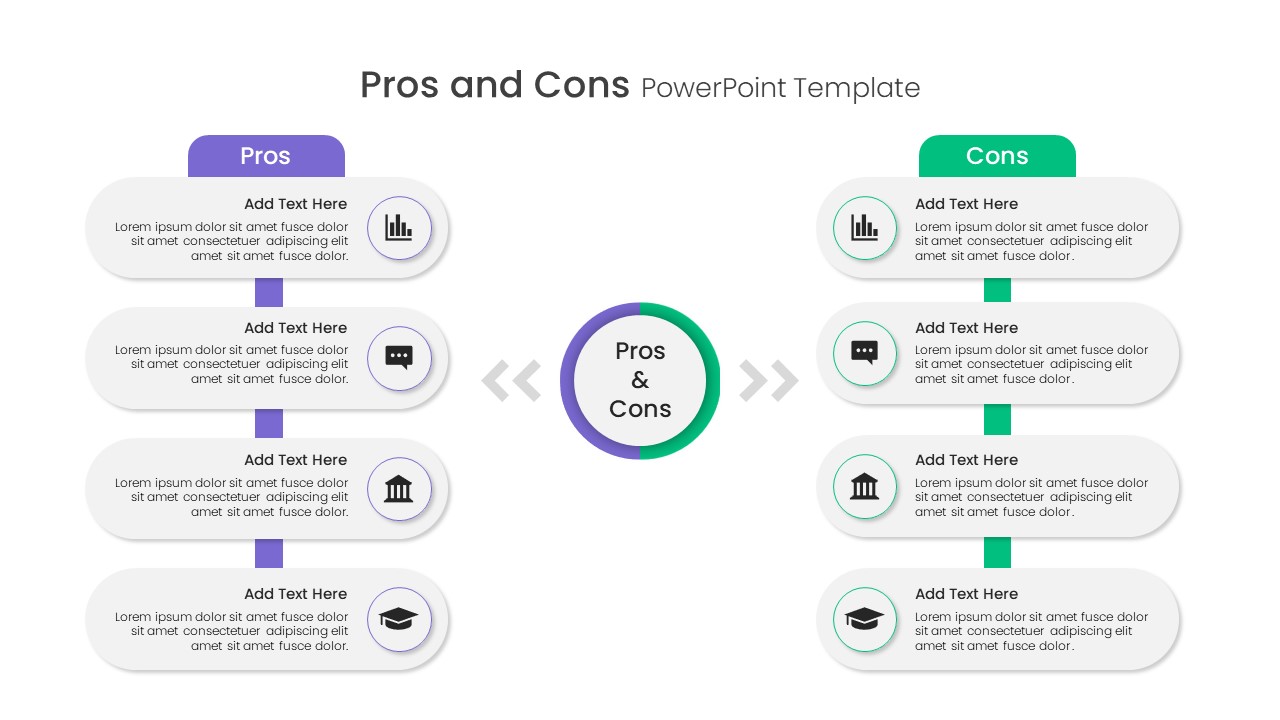
Free Pros and Cons Comparison Template for PowerPoint & Google Slides
Comparison
Free
Free Versatile Product Comparison Chart Template for PowerPoint & Google Slides
Charts
Free
AI vs. Human Intelligence Comparison Template for PowerPoint & Google Slides
Comparison
ESG Initiatives Comparison Chart Template for PowerPoint & Google Slides
Business
Economies of Scale Cost Curve Comparison Template for PowerPoint & Google Slides
Comparison Chart
Quarterly Revenue Comparison Bar Chart Template for PowerPoint & Google Slides
Bar/Column
Hits & Misses Comparison Infographic Template for PowerPoint & Google Slides
Pitch Deck
Project Comparison Timeline Roadmap Template for PowerPoint & Google Slides
Comparison
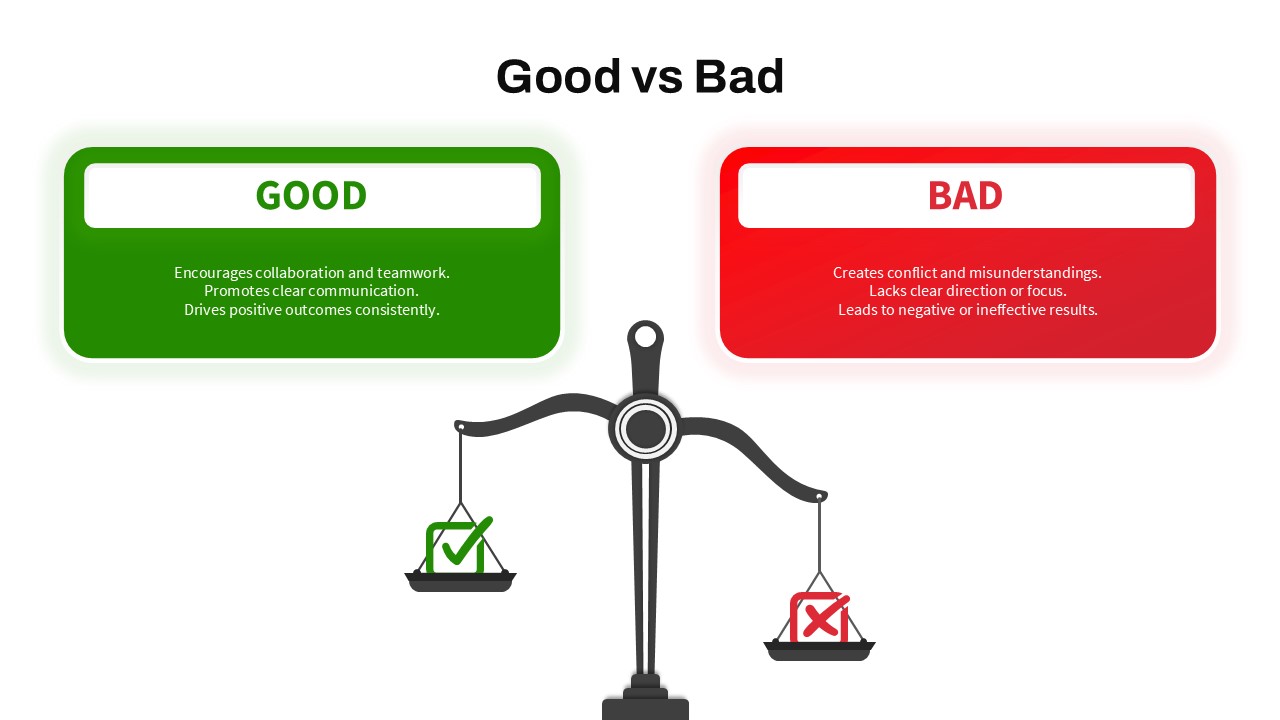
Good vs Bad Comparison with Scale Template for PowerPoint & Google Slides
Comparison
Risk Level Gauge Comparison Dashboard Template for PowerPoint & Google Slides
Comparison
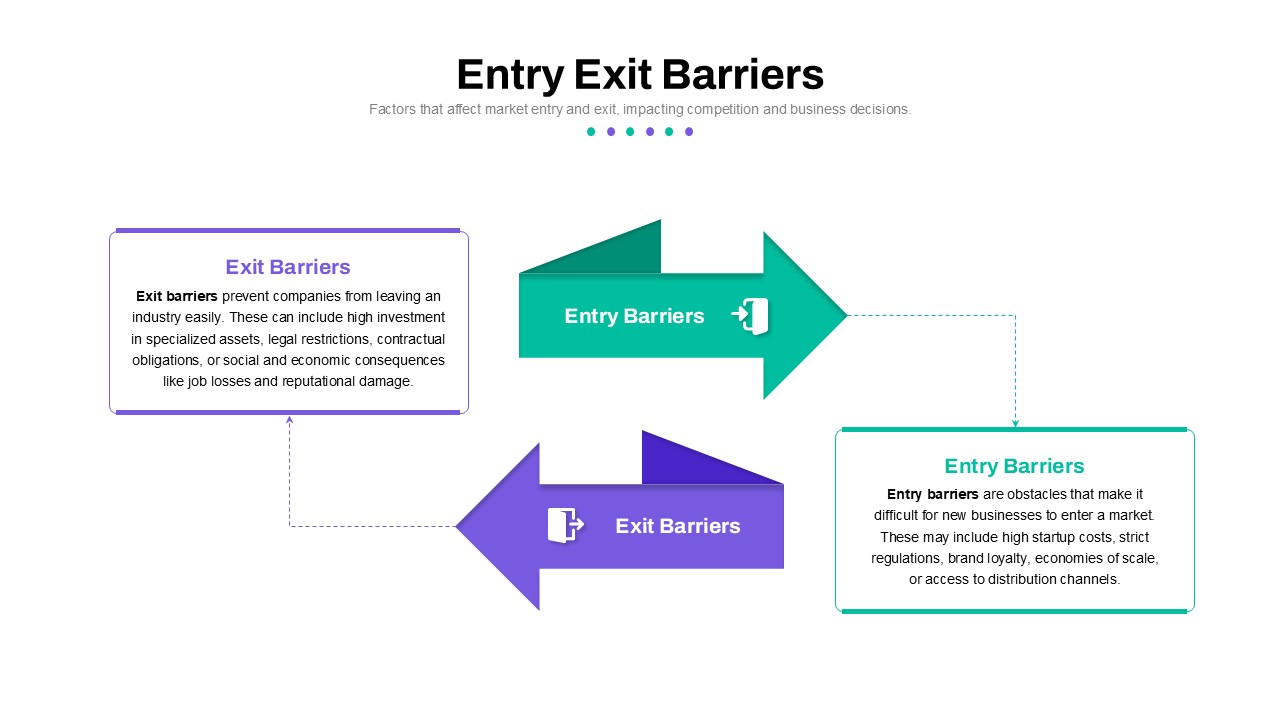
Entry and Exit Barriers Comparison Template for PowerPoint & Google Slides
Comparison
Competitor Comparison Chart Design Template for PowerPoint & Google Slides
Comparison
Two-Option Bar Chart Comparison Table Template for PowerPoint & Google Slides
Comparison
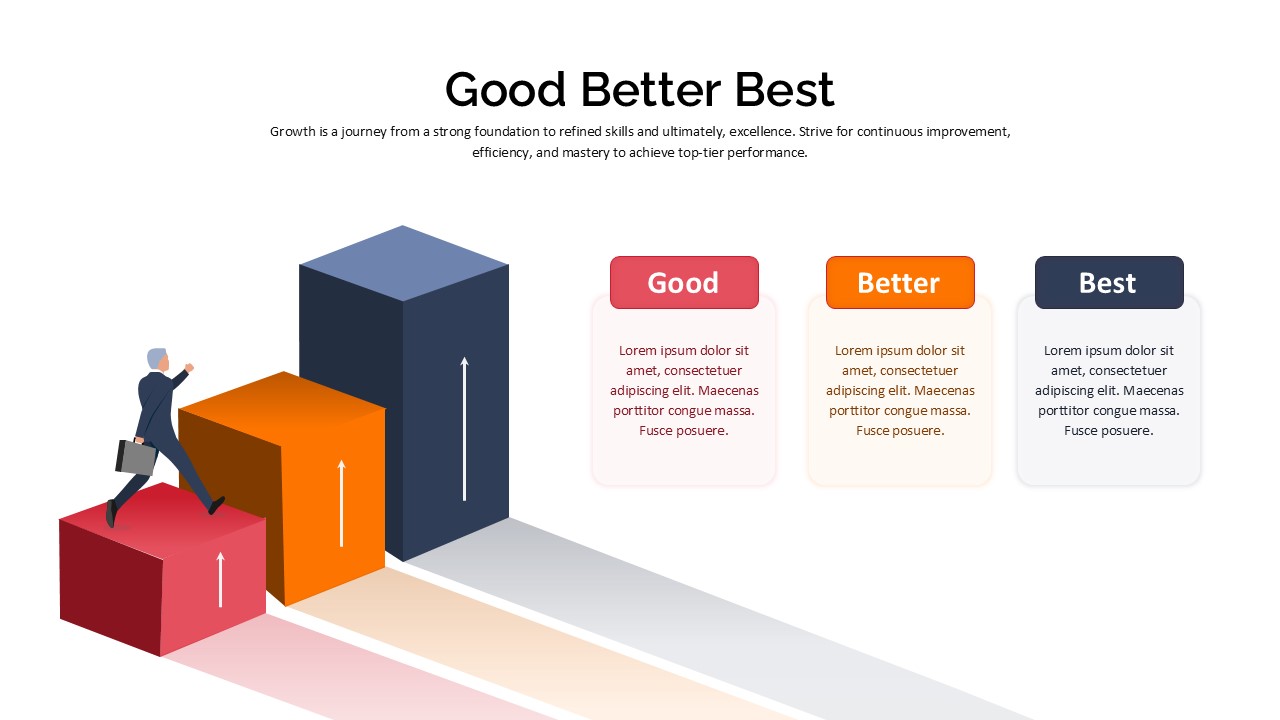
Good Better Best Comparison template for PowerPoint & Google Slides
Comparison
Cross Sell & Up Sell Strategy Comparison template for PowerPoint & Google Slides
Comparison
Product Feature Comparison Table Template for PowerPoint & Google Slides
Comparison Chart
Market Share Comparison Diagram Template for PowerPoint & Google Slides
Comparison Chart
Competitor Profile Matrix Comparison Template for PowerPoint & Google Slides
Comparison Chart
Two-Sided Coin Comparison Diagram Template for PowerPoint & Google Slides
Comparison
Sales Growth Comparison Chart & Table Template for PowerPoint & Google Slides
Bar/Column
Two-Box Analysis & Target Comparison Template for PowerPoint & Google Slides
Comparison
Two Section Comparison template for PowerPoint & Google Slides
Business Proposal
VUCA vs BANI Comparison Infographic Template for PowerPoint & Google Slides
Comparison
Category Analysis Comparison Infographic Template for PowerPoint & Google Slides
Comparison
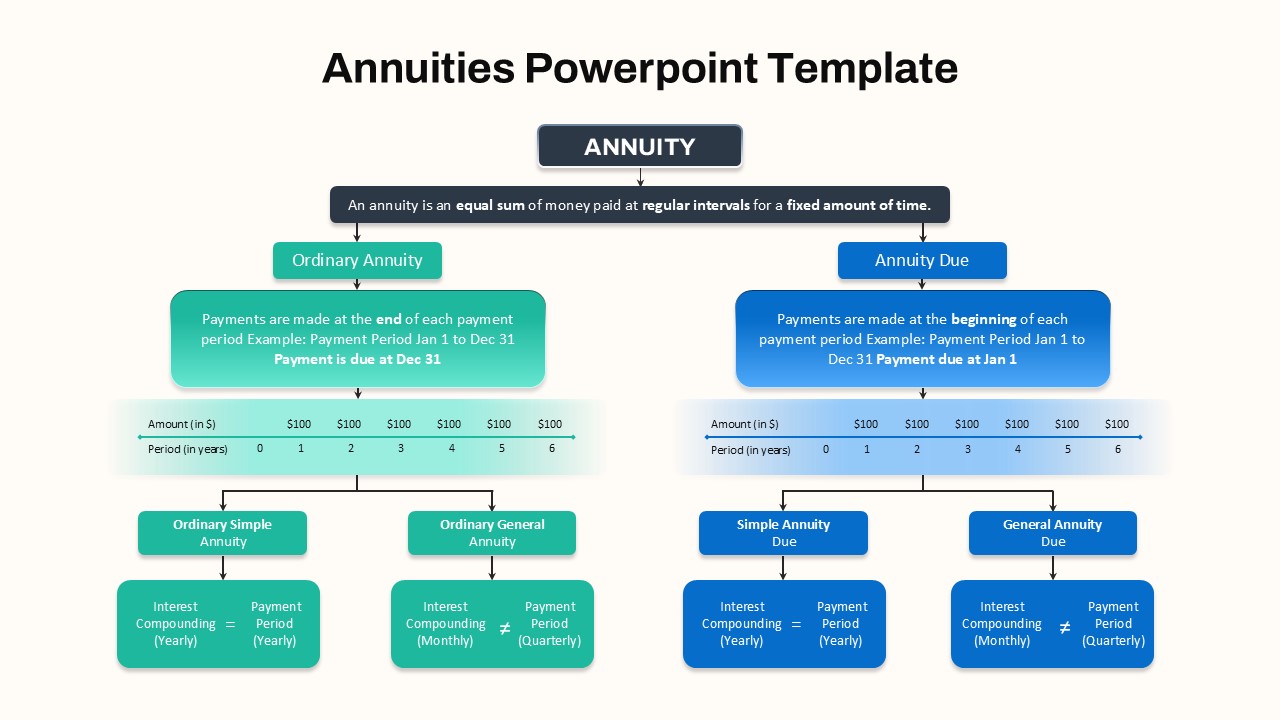
Hierarchical Annuity Comparison Flowchart Template for PowerPoint & Google Slides
Business Report
Feasibility Matrix Comparison Chart Template for PowerPoint & Google Slides
Comparison Chart
Funnel and Flywheel Thinking Comparison template for PowerPoint & Google Slides
Infographics
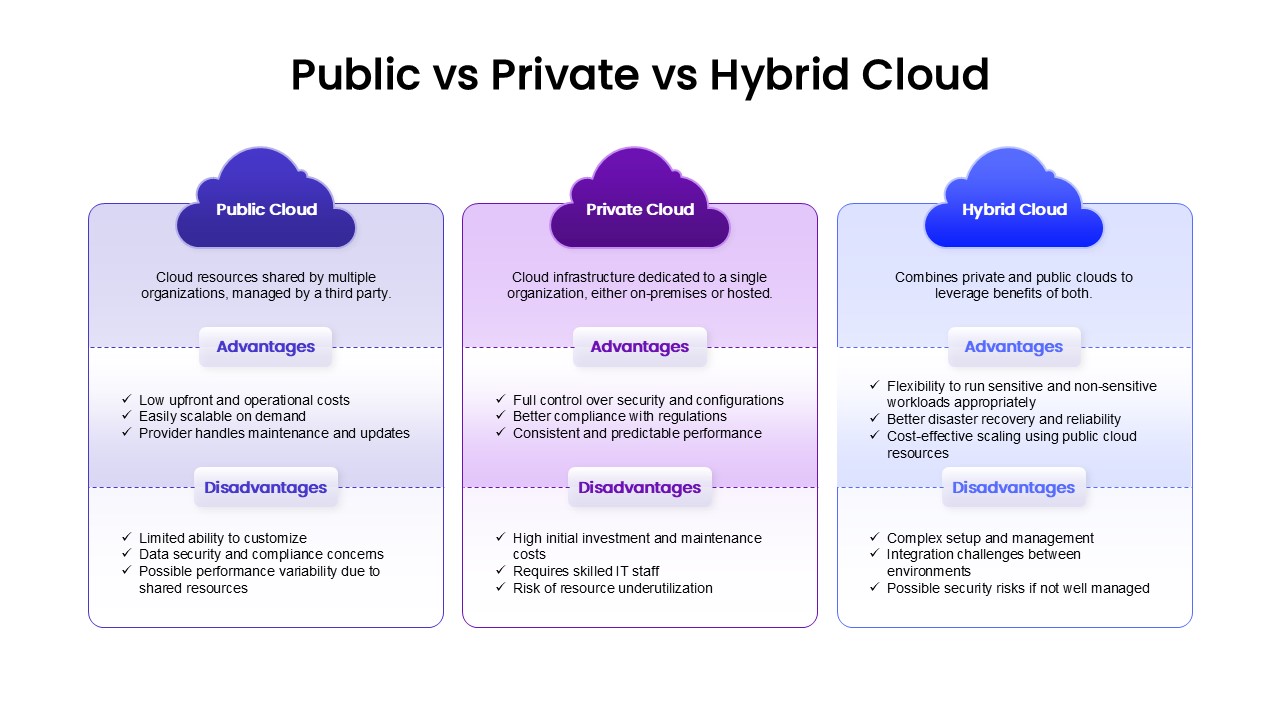
Public, Private & Hybrid Cloud Comparison Template for PowerPoint & Google Slides
Cloud Computing
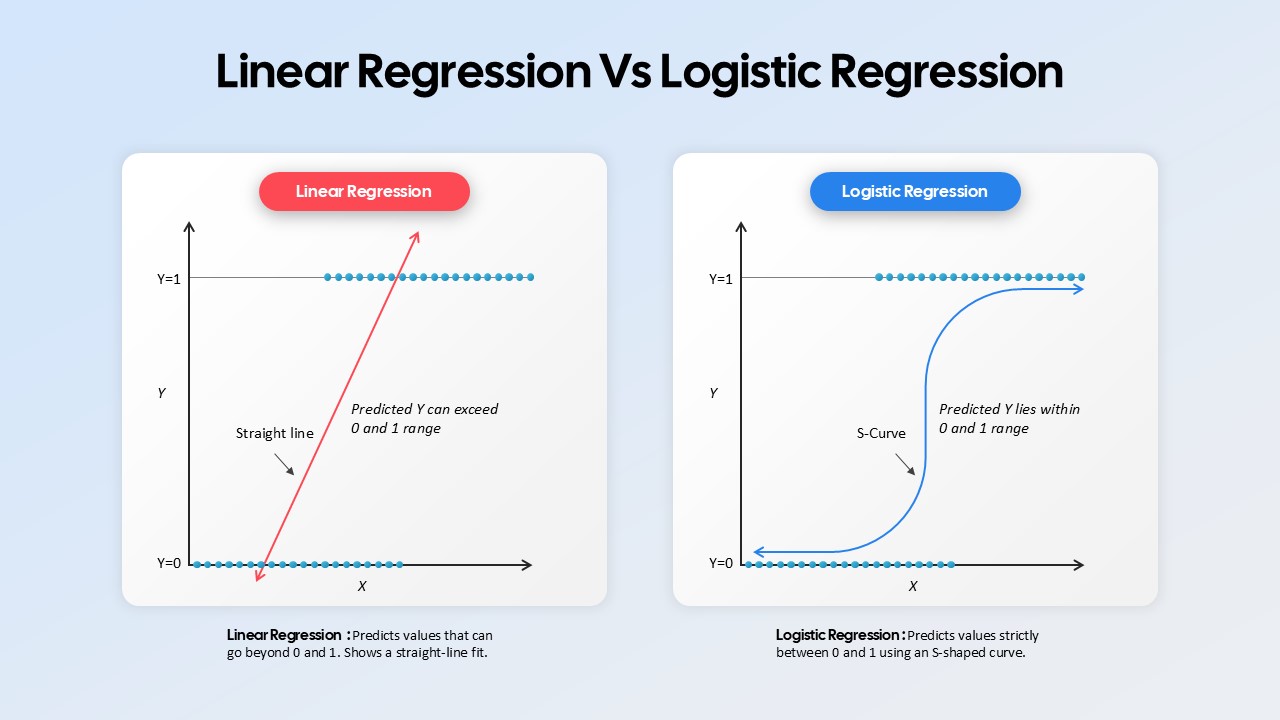
Linear Regression vs Logistic Regression Comparison template for PowerPoint & Google Slides
Comparison
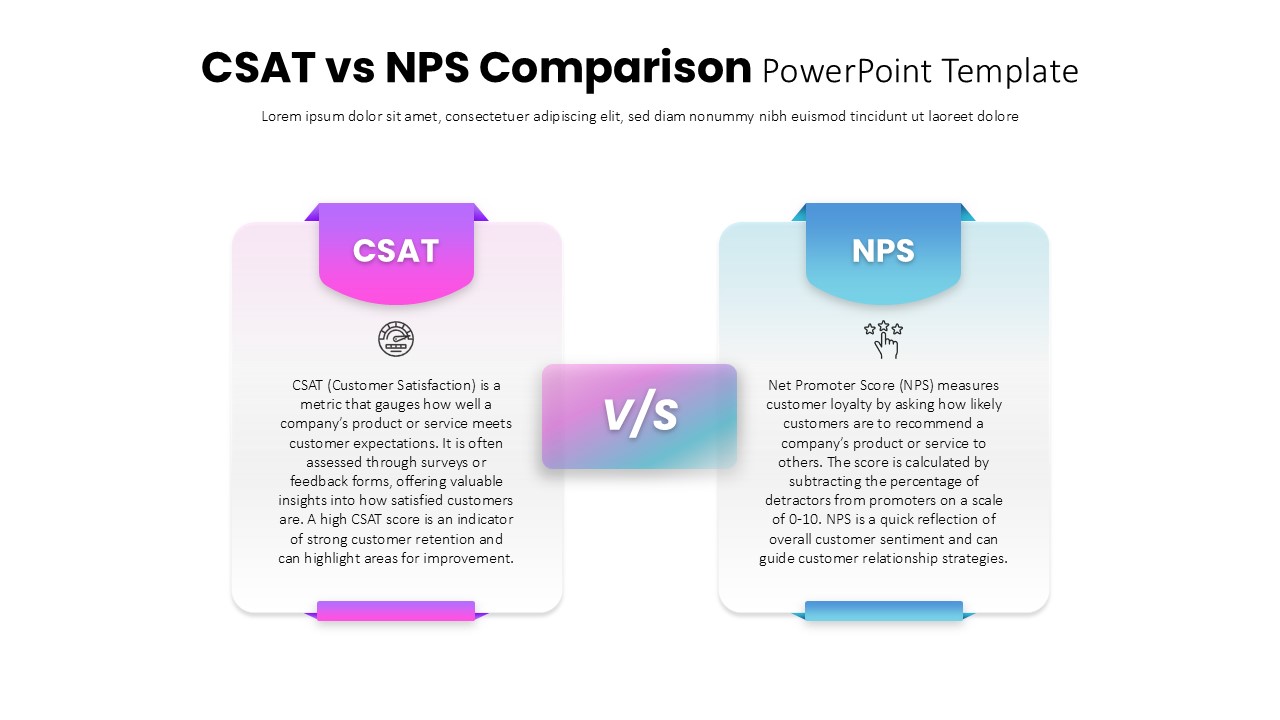
CSAT vs NPS Comparison template for PowerPoint & Google Slides
Business Strategy
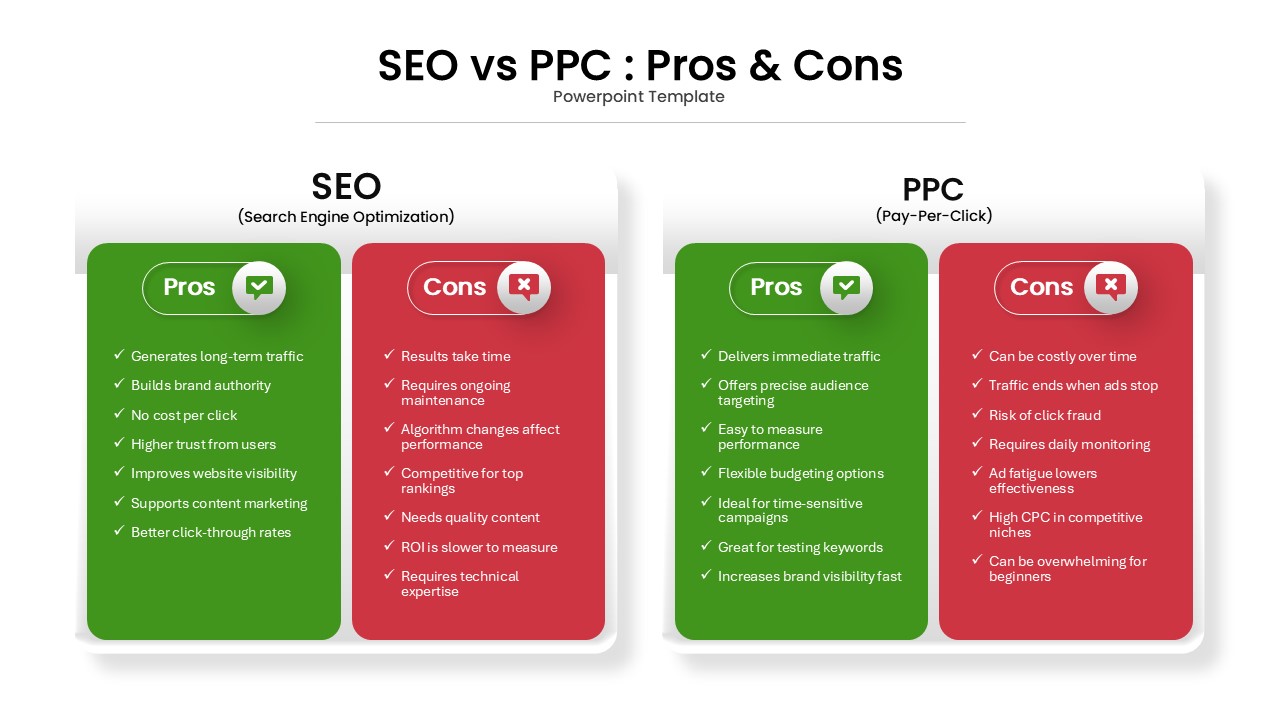
SEO vs PPC: Pros & Cons Comparison Template for PowerPoint & Google Slides
Comparison
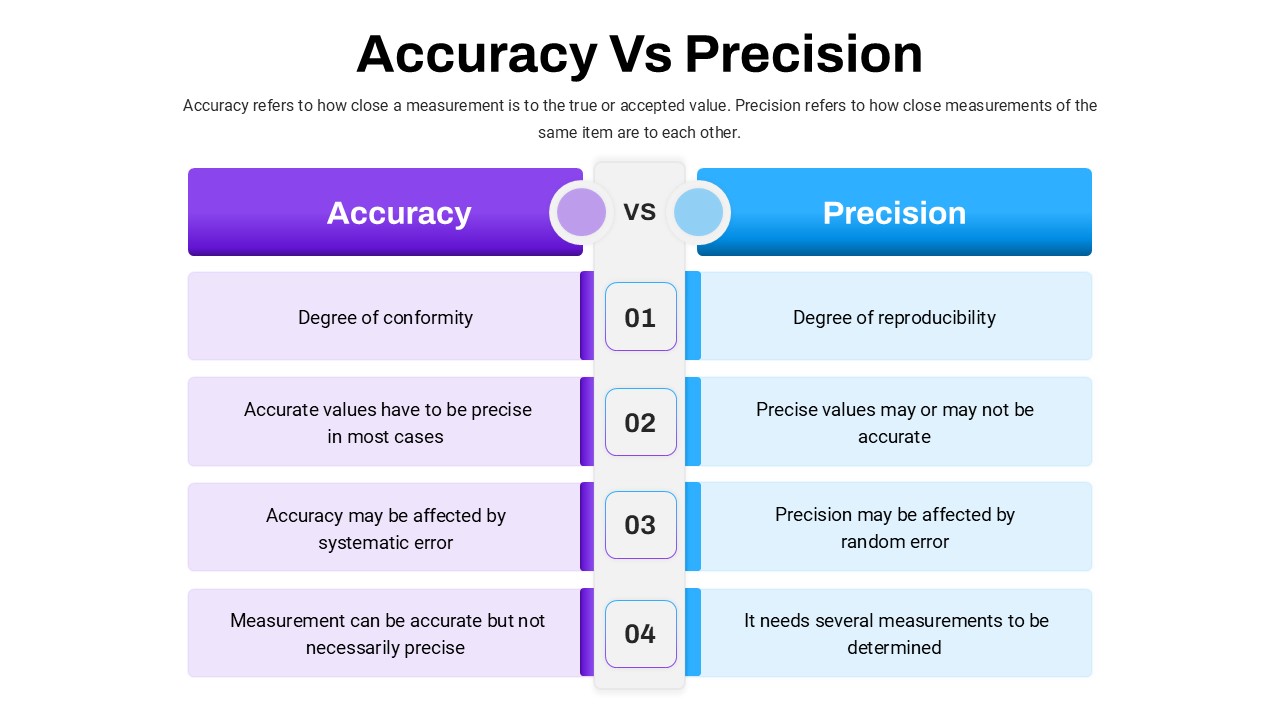
Accuracy Vs Precision Comparison Template for PowerPoint & Google Slides
Comparison Chart
Risk vs Reward Comparison Template for PowerPoint & Google Slides
Opportunities Challenges
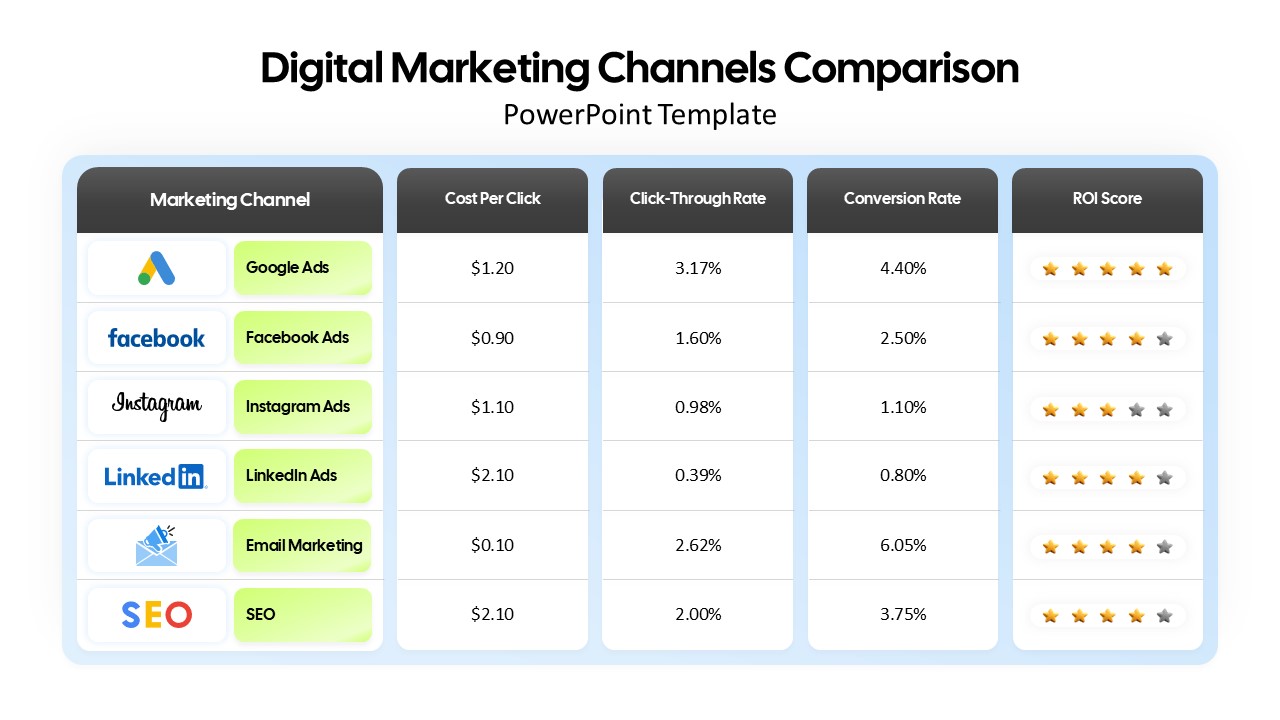
Digital Marketing Channels Comparison template for PowerPoint & Google Slides
Business
Comparison Table Presentation Template for PowerPoint & Google Slides
Table
Colorful Comparison Table Presentation Template for PowerPoint & Google Slides
Table
Colorful Business Data Comparison Table Template for PowerPoint & Google Slides
Table
Five Column Comparison Table Layout Template for PowerPoint & Google Slides
Comparison
Quarterly Comparison Pie Chart Template for PowerPoint & Google Slides
Pie/Donut
Operating Channels Comparison Diagram Template for PowerPoint & Google Slides
Business Models
4 Set Venn Diagram Comparison Template for PowerPoint & Google Slides
Comparison
Blank Comparison Chart Template for PowerPoint & Google Slides
Comparison Chart