Bar and Column Chart Templates for PowerPoint and Google Slides
Present your data with clarity and impact using our Bar and Column Chart Templates for PowerPoint and Google Slides. These chart templates are perfect for comparing values, analyzing performance, showcasing survey results, or presenting trends over time. Whether you’re building a financial report, sales presentation, or academic lecture, bar and column charts help you break down complex numbers into easy-to-understand visuals.
Each template is fully editable and compatible with Microsoft PowerPoint (PPT) and Google Slides, giving you flexibility to adjust colors, labels, and data points for any industry or use case.
![]() Filter
Filter
Filter
-

Horizontal Bar Chart Slide with Icons Template for PowerPoint & Google Slides
Bar/Column
Premium
-

Data Analysis Bar Chart with Insights Template for PowerPoint & Google Slides
Bar/Column
Free
-

Quarterly Net Interest Income Growth Template for PowerPoint & Google Slides
Bar/Column
Premium
-

Quarterly Revenue Comparison Bar Chart Template for PowerPoint & Google Slides
Bar/Column
Premium
-

Banking Service & Finance Infographics Template for PowerPoint & Google Slides
Finance
Free
-

Free Infographic Statistics Dashboard Slide for PowerPoint & Google Slides
Bar/Column
Free
-

Freight Logistics Dashboard Infographic Template for PowerPoint & Google Slides
Comparison Chart
Premium
-

Clustered Bar Chart Comparison Template for PowerPoint & Google Slides
Bar/Column
Premium
-

Employee Satisfaction Survey Dashboard Template for PowerPoint & Google Slides
Employee Performance
Premium
-

Annual Recurring Revenue Metrics Template for PowerPoint & Google Slides
Bar/Column
Premium
-

Stacked Bar Chart for PowerPoint & Google Slides
Bar/Column
Premium
-
Free Metro UI Dashboard Infographic Template for PowerPoint & Google Slides
Business Report
Free
-
Website Performance Monitoring Dashboard Template for PowerPoint & Google Slides
Business Report
Premium
-
KPI Dashboard template for PowerPoint & Google Slides
Business Report
Premium
-
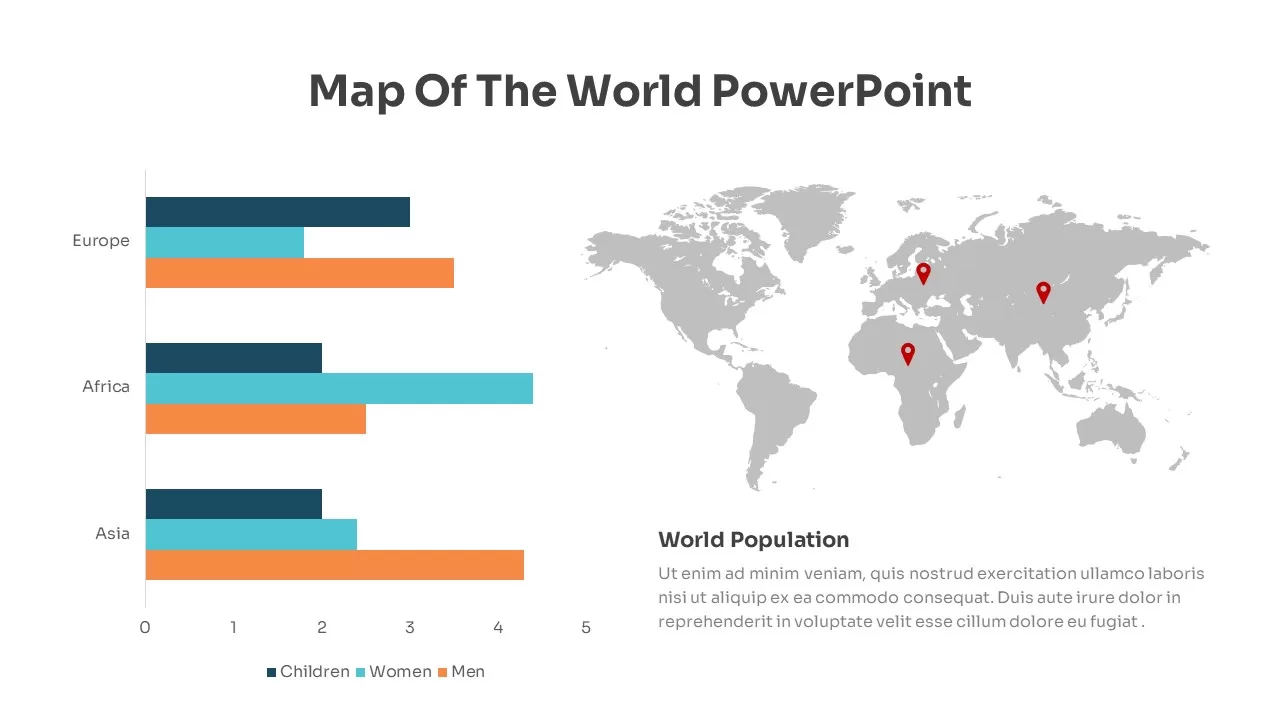
Global Population Demographics & Map Template for PowerPoint & Google Slides
Bar/Column
Premium
-

Clustered Column Chart Data Analysis Template for PowerPoint
Bar/Column
Premium
-

Radial Bar Chart Diagram for PowerPoint & Google Slides
Bar/Column
Premium
-

3D Column Chart with Data Table for PowerPoint & Google Slides
Bar/Column
Premium
-

Website Performance Dashboard template for PowerPoint & Google Slides
Charts
Premium
-
Business Dashboard Analytics & KPIs Template for PowerPoint & Google Slides
Bar/Column
Premium
-
Data Analytics Dashboard Design template for PowerPoint & Google Slides
Bar/Column
Premium
-

Cause and Effect Diagram Infographic Template for PowerPoint & Google Slides
Bar/Column
Premium
-
3D Cone Chart Data Visualization template for PowerPoint & Google Slides
Bar/Column
Premium
-
E-commerce Analytics Dashboard Template for PowerPoint & Google Slides
Bar/Column
Premium