Bar and Column Chart Templates for PowerPoint and Google Slides
Present your data with clarity and impact using our Bar and Column Chart Templates for PowerPoint and Google Slides. These chart templates are perfect for comparing values, analyzing performance, showcasing survey results, or presenting trends over time. Whether you’re building a financial report, sales presentation, or academic lecture, bar and column charts help you break down complex numbers into easy-to-understand visuals.
Each template is fully editable and compatible with Microsoft PowerPoint (PPT) and Google Slides, giving you flexibility to adjust colors, labels, and data points for any industry or use case.
![]() Filter
Filter
Filter
-

Quarterly Financial Summary Dashboard Template for PowerPoint & Google Slides
Business Report
-
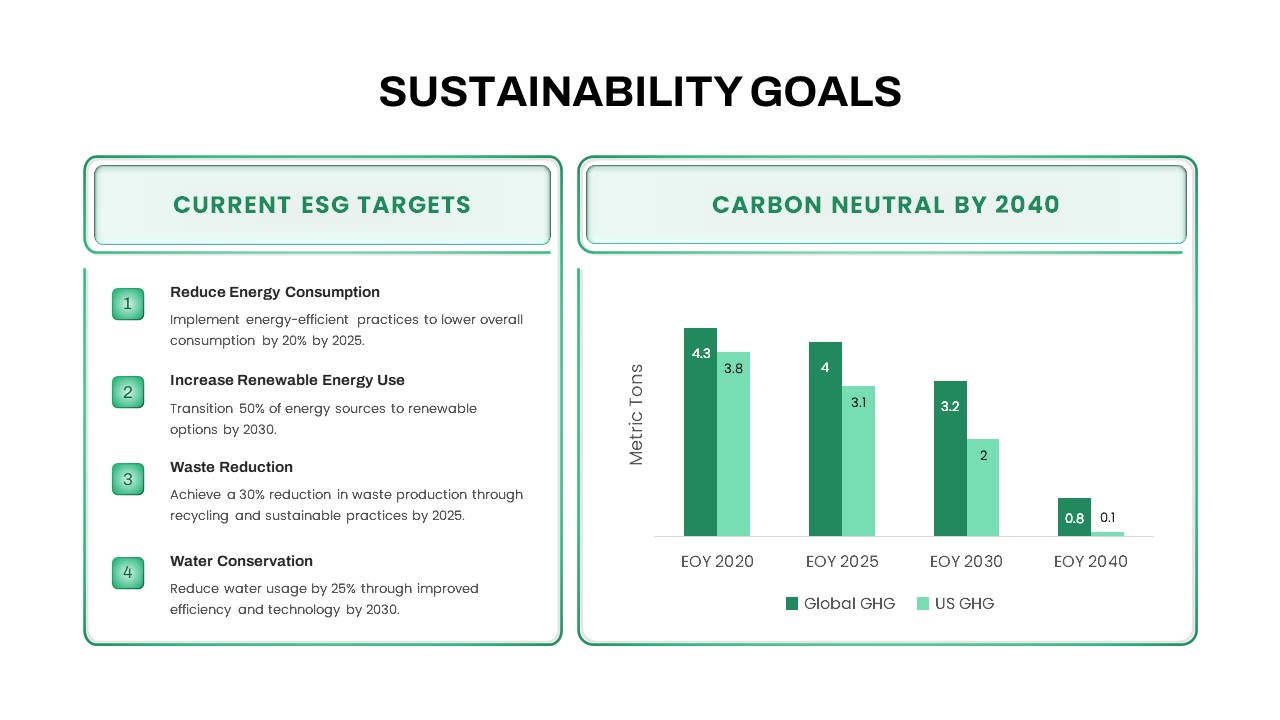
Sustainability Goals and Targets Chart Template for PowerPoint & Google Slides
Goals
-

Sales Growth Comparison Chart & Table Template for PowerPoint & Google Slides
Bar/Column
-

Comparison Donut Chart PowerPoint Template and Keynote
Pie/Donut
-
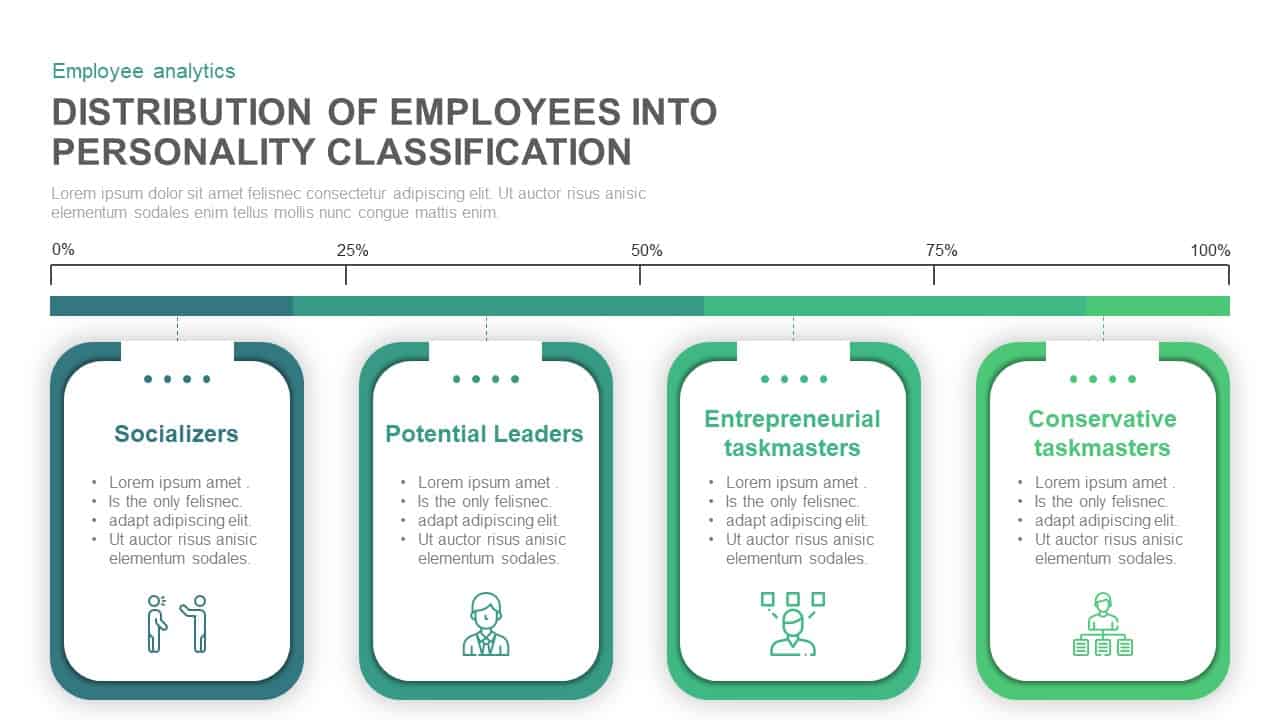
Employee Personality Distribution Chart Template for PowerPoint & Google Slides
Bar/Column
-

Distracting Factors at Work Bar Chart Template for PowerPoint & Google Slides
Bar/Column
-

Entertainment Industry Revenue Bar Chart Template for PowerPoint & Google Slides
Bar/Column
-

For and Against Vote Count Bar Chart Template for PowerPoint & Google Slides
Bar/Column
-

Immigration Data Dashboard Template for PowerPoint & Google Slides
Bar/Column
-

3D Cylinder Bar Chart Visualization Template for PowerPoint
Bar/Column
-

Radial Bar Chart Diagram for PowerPoint & Google Slides
Bar/Column
-

Website Performance Dashboard template for PowerPoint & Google Slides
Charts
-

3D Bar Graph Infographic Template for PowerPoint & Google Slides
Bar/Column
-
Improvement Growth Arrow Metaphor Template for PowerPoint & Google Slides
Bar/Column
-

Business Dashboard Analytics & KPIs Template for PowerPoint & Google Slides
Bar/Column
-
Data Analytics Dashboard Design template for PowerPoint & Google Slides
Bar/Column
-
Sales Bar Chart for PowerPoint & Google Slides
Bar/Column
-
Product Usage Analytics Dashboard Chart Template for PowerPoint & Google Slides
Bar/Column
-
Cause and Effect Diagram Infographic Template for PowerPoint & Google Slides
Bar/Column
-
Dynamic Data Dashboard Infographic Template for PowerPoint & Google Slides
Bar/Column
-
Colorful Radial Bar Chart Template for PowerPoint & Google Slides
Bar/Column
-

Monthly Reports Bar Chart template for PowerPoint & Google Slides
Bar/Column
-
3D Cone Chart Data Visualization template for PowerPoint & Google Slides
Bar/Column
-
Pencil Bar Chart Data Analysis Template for PowerPoint & Google Slides
Bar/Column
-
3D Cylinder Bar Chart Template for PowerPoint & Google Slides
Bar/Column
-
Creative Bar Chart template for PowerPoint & Google Slides
Charts
-
Year-over-Year Performance Comparison Template for PowerPoint & Google Slides
Comparison Chart
-

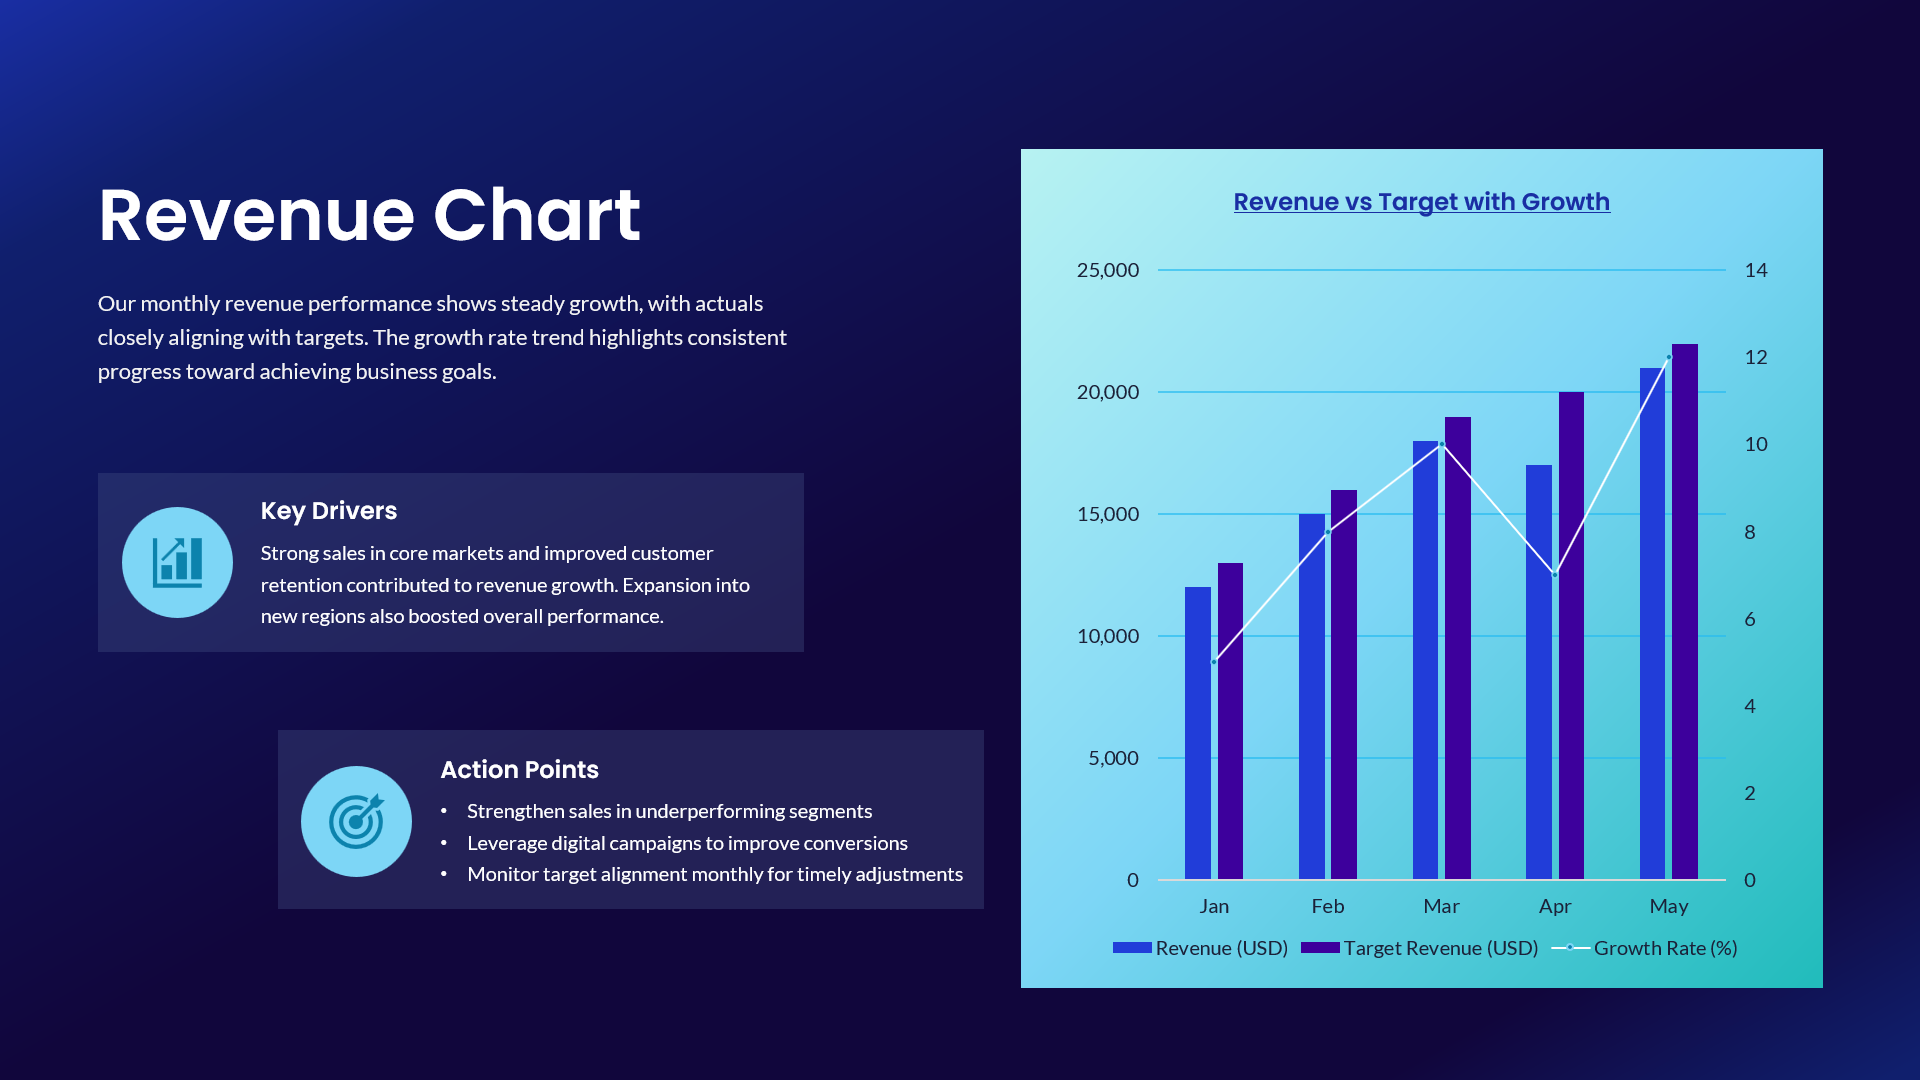
Revenue vs Target Growth Chart Template for PowerPoint & Google Slides
Revenue
-
Blank Bar Graph Template for PowerPoint & Google Slides
Bar/Column
-
USA Map with Bar Chart Template for PowerPoint & Google Slides
World Maps
-
Five Options Business Bar Graph for PowerPoint & Google Slides
Business Report
-
3D Pyramid Column Chart Infographic Template for PowerPoint & Google Slides
Bar/Column
-
Horizontal Bar Chart Slide with Icons Template for PowerPoint & Google Slides
Bar/Column
-
Data Analysis Bar Chart with Insights Template for PowerPoint & Google Slides
Bar/Column
Free
-
Budget Forecast Dashboard & Donut Charts Template for PowerPoint & Google Slides
Pie/Donut