Banking Financial Overview Dashboard Template for PowerPoint & Google Slides

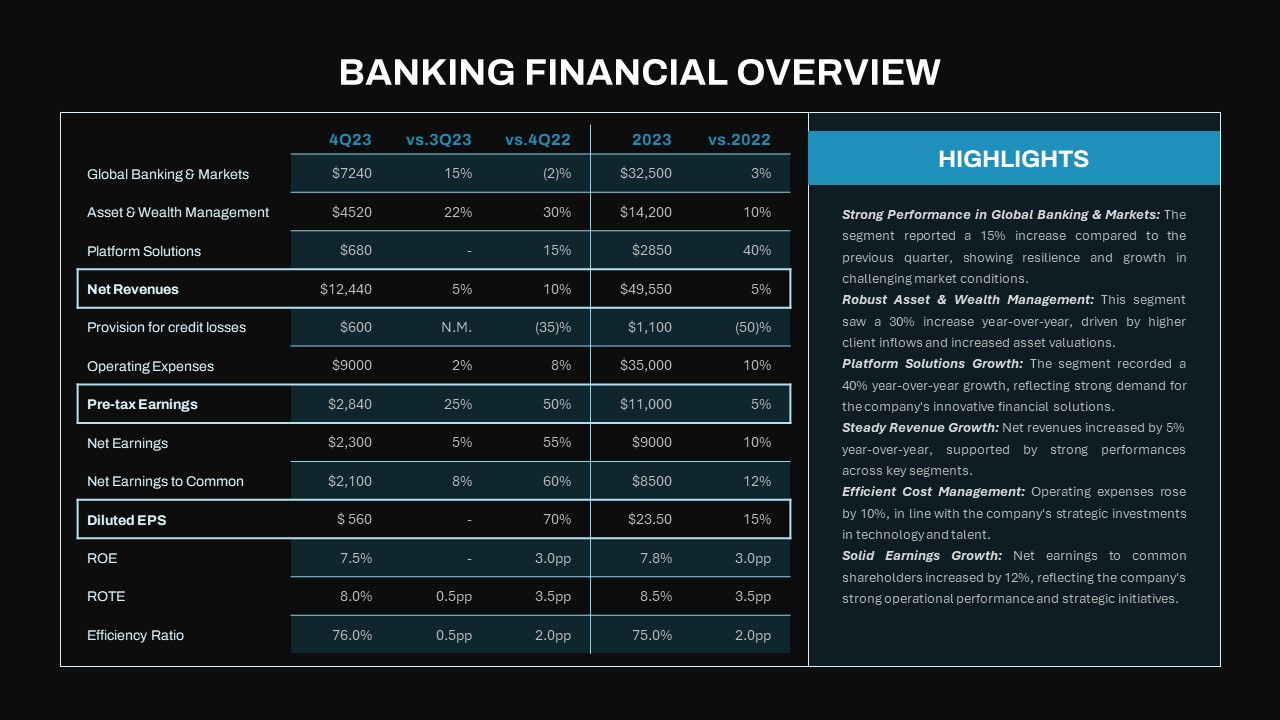

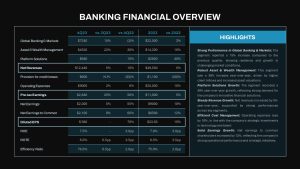
Leverage this Banking Financial Overview Dashboard template to present quarterly and annual performance metrics with clarity and impact. The slide features a clean, grid-aligned table highlighting revenue streams, expense figures, earnings, EPS, and key ratios—each column comparing 4Q23 vs. 3Q23, vs. 4Q22, full-year 2023 vs. 2022. A contrasting teal “Highlights” panel summarizes top takeaways, from segment growth rates to cost efficiencies, ensuring your audience instantly grasps critical insights. Fully editable in PowerPoint and Google Slides, this slide’s master layout supports rapid updates to numbers, text, and color accents without disrupting formatting.
Who is it for
Financial analysts, banking executives, CFOs, and investor relations teams will benefit from this slide when reporting quarterly results, board-level updates, or annual reviews. Consulting firms, finance trainers, and corporate presenters can use it to convey complex data succinctly.
Other Uses
Beyond banking, repurpose this dashboard for industry overviews, sales performance reviews, operational KPIs, or executive summaries across finance, insurance, or consulting presentations.
Login to download this file

Item ID
SB04307
Related Templates

Neo Banking Overview template for PowerPoint & Google Slides
Technology
Free Monthly Report PowerPoint Template for PowerPoint & Google Slides
Business Report
Free
Quarterly Financial Summary Dashboard Template for PowerPoint & Google Slides
Business Report

Money Metaphor Financial Overview Template for PowerPoint & Google Slides
Finance
Financial Snapshot & Metrics Overview Template for PowerPoint & Google Slides
Finance
Free Financial Accounting Overview Slide for PowerPoint & Google Slides
Accounting
Free
KPI Dashboard Overview template for PowerPoint & Google Slides
Finance
KPI Dashboard Data Overview Slide Template for PowerPoint & Google Slides
Bar/Column
Account Overview Dashboard template for PowerPoint & Google Slides
Business
Investment Banking template for PowerPoint & Google Slides
Finance
AI Banking Benefits Template for PowerPoint & Google Slides
Circular
Banking Service & Finance Infographics Template for PowerPoint & Google Slides
Finance
Free
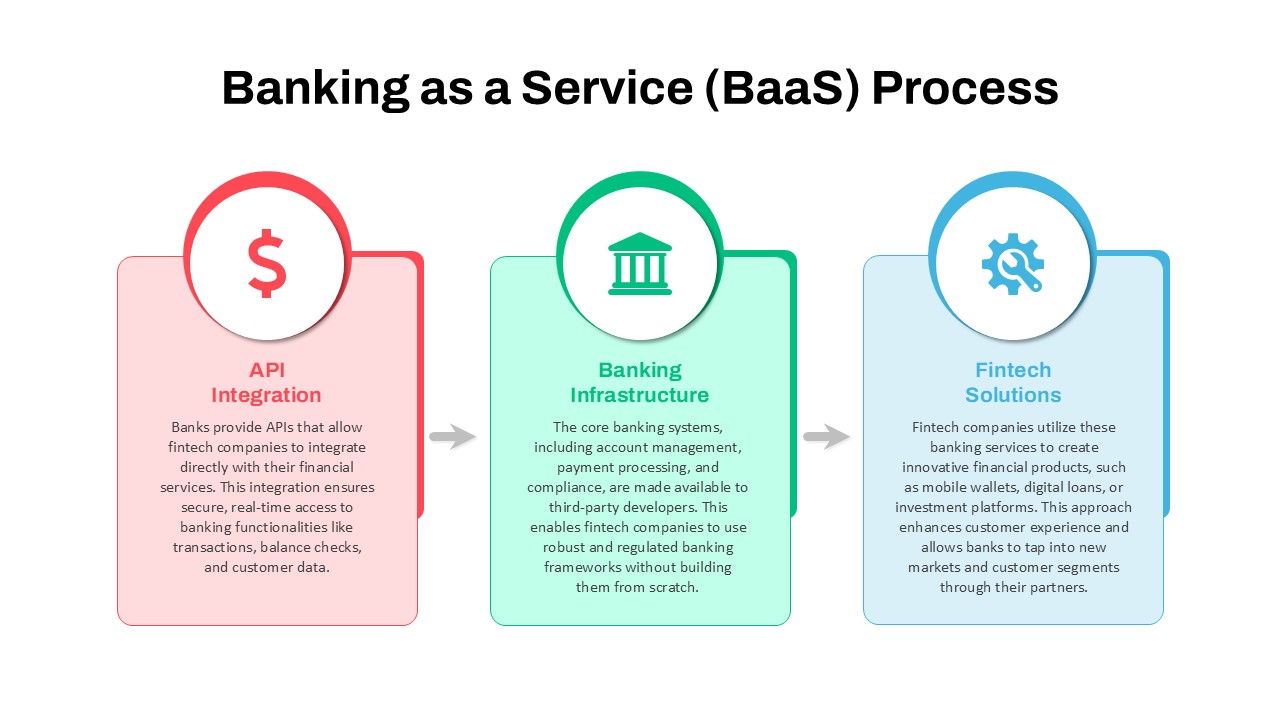
Banking as a Service (BaaS) Process Flow Template for PowerPoint & Google Slides
Process
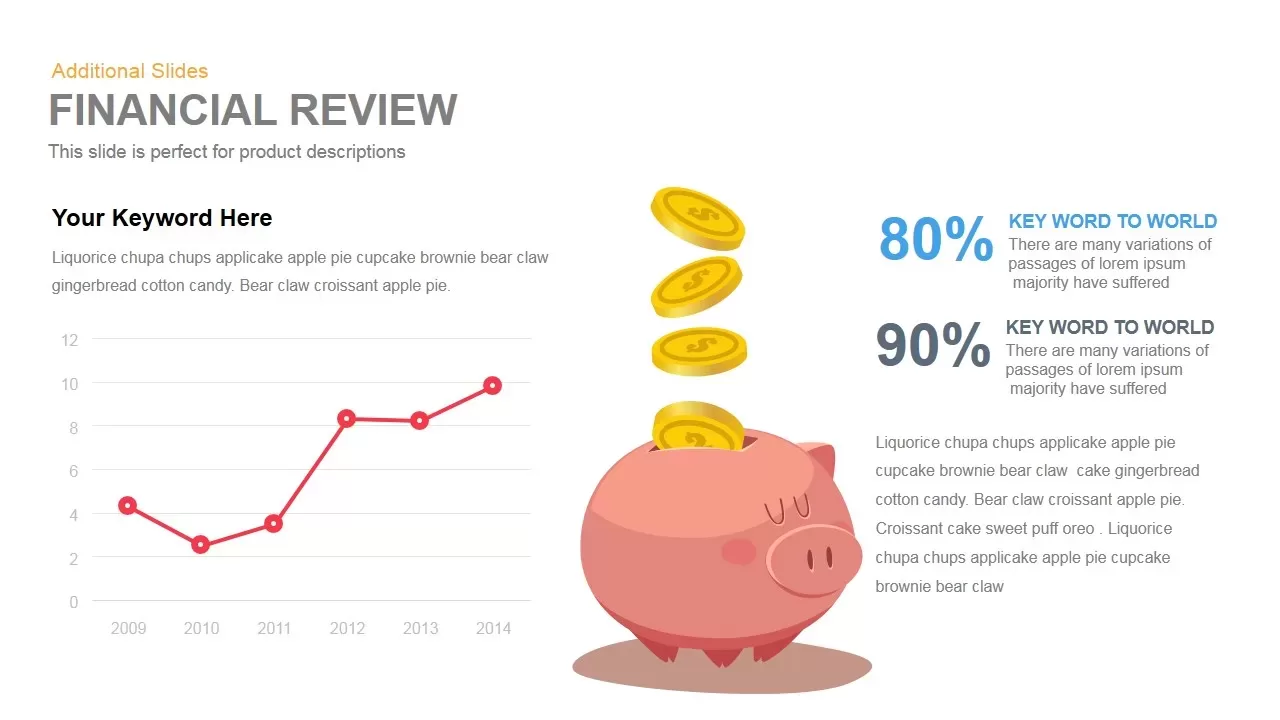
Financial Review template for PowerPoint & Google Slides
Finance
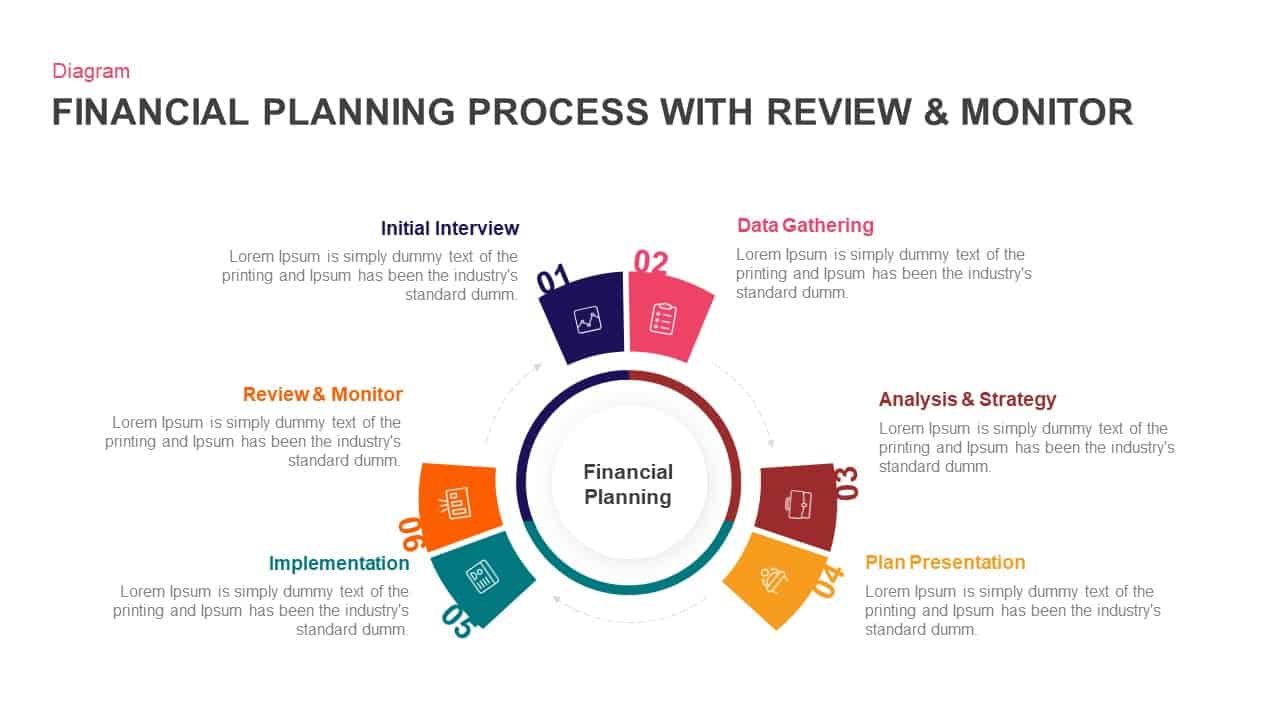
Financial Planning Circular Process Template for PowerPoint & Google Slides
Process
5-Stage Financial Growth Timeline Template for PowerPoint & Google Slides
Timeline
Financial Agreement Signing Flow Diagram Template for PowerPoint & Google Slides
Process
Financial Report Metaphor Illustration Template for PowerPoint & Google Slides
Finance
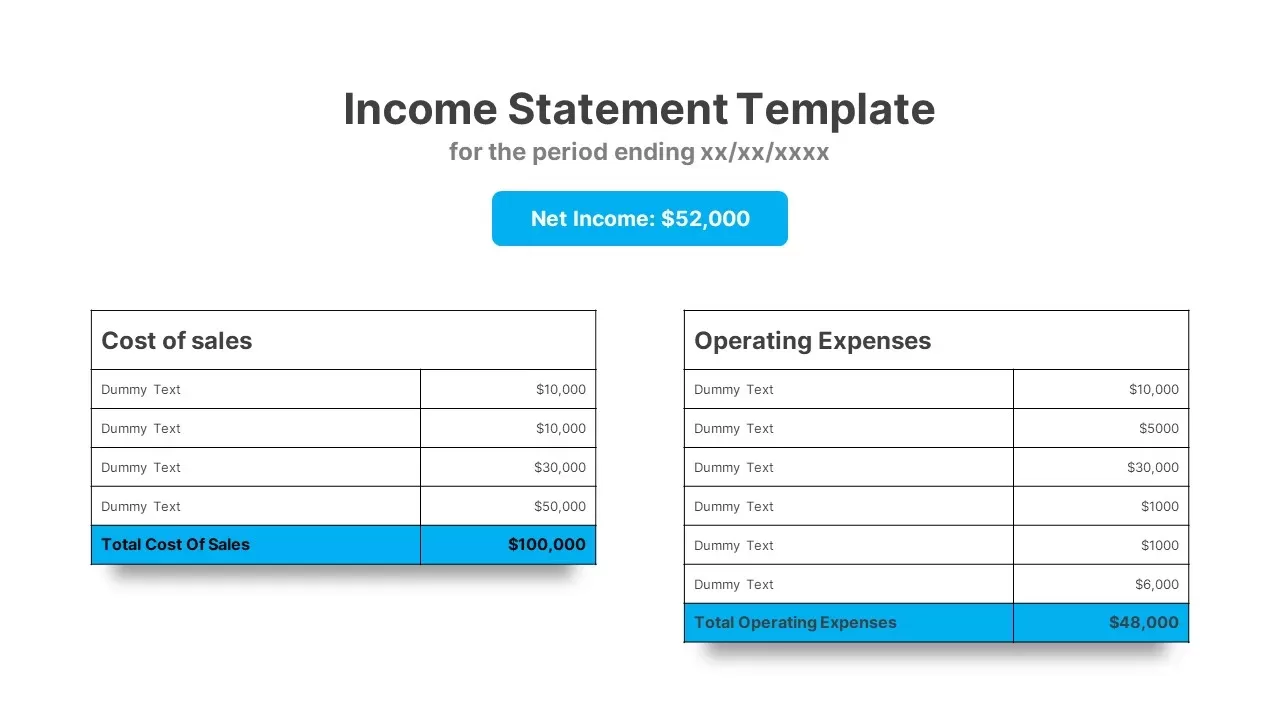
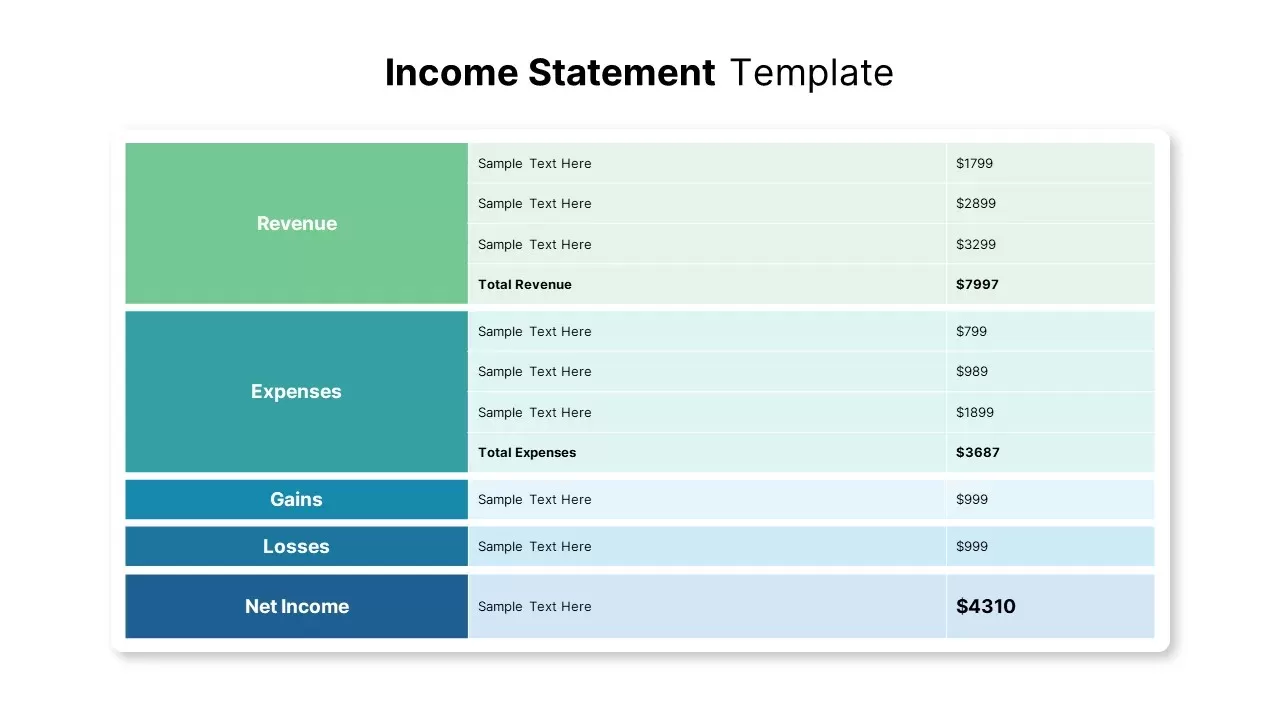
Income Statement Financial Reporting Template for PowerPoint & Google Slides
Finance
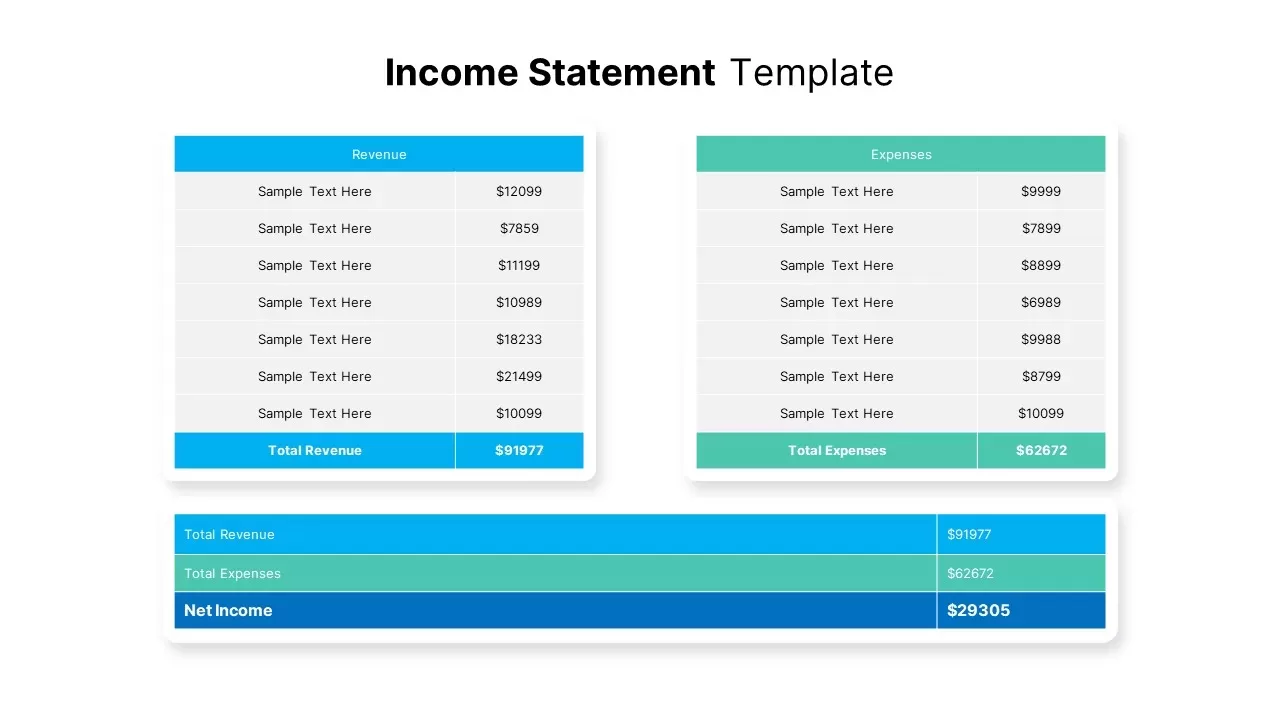
Income Statement Financial Summary Template for PowerPoint & Google Slides
Business Report
Income Statement Financial Report Template for PowerPoint & Google Slides
Business Report
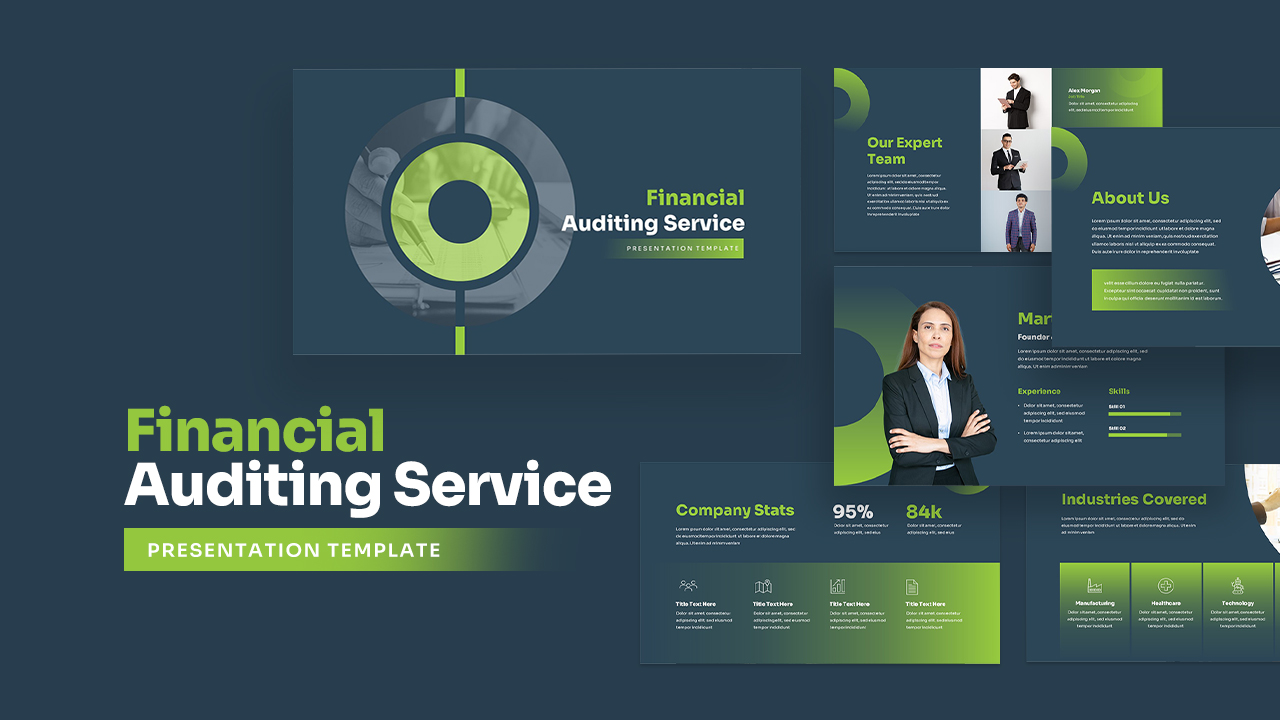
Corporate Financial Auditing Service Template for PowerPoint & Google Slides
Finance

Financial Advisory Service Pitch Deck Template for PowerPoint & Google Slides
Finance
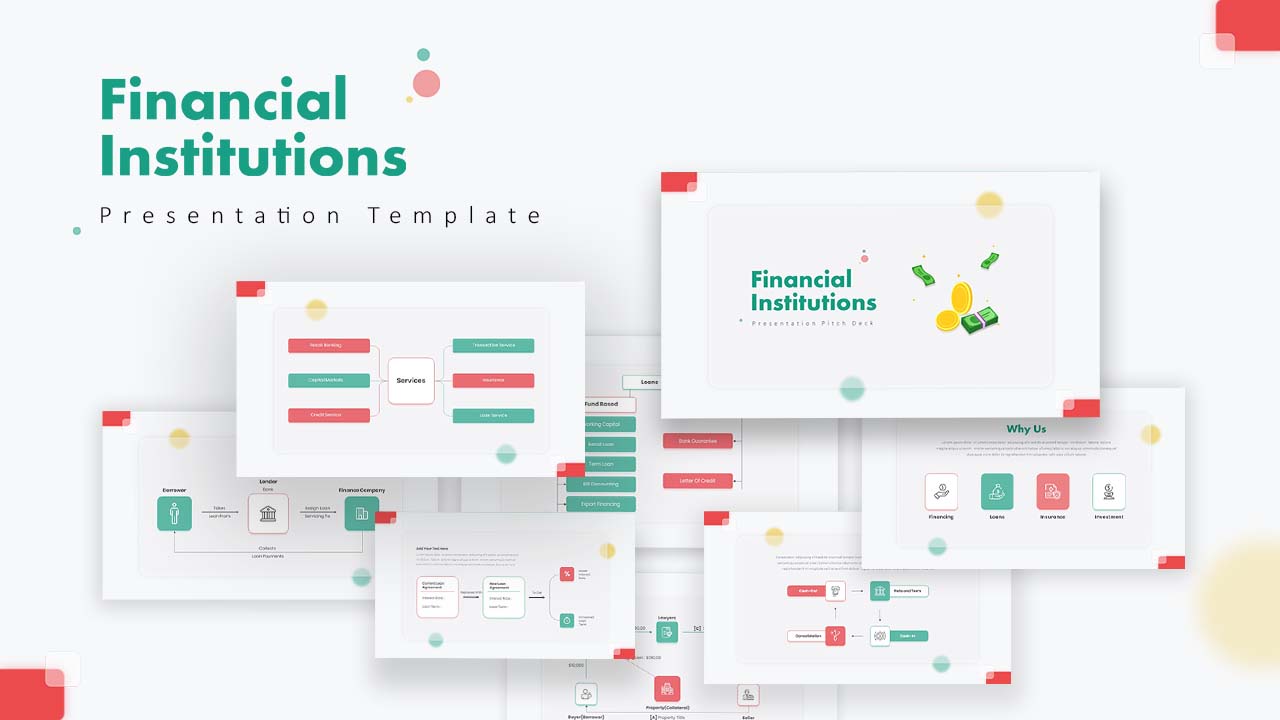
Financial Institutions Presentation Template for PowerPoint & Google Slides
Company Profile
Financial Consulting Company Profile Template for PowerPoint & Google Slides
Finance

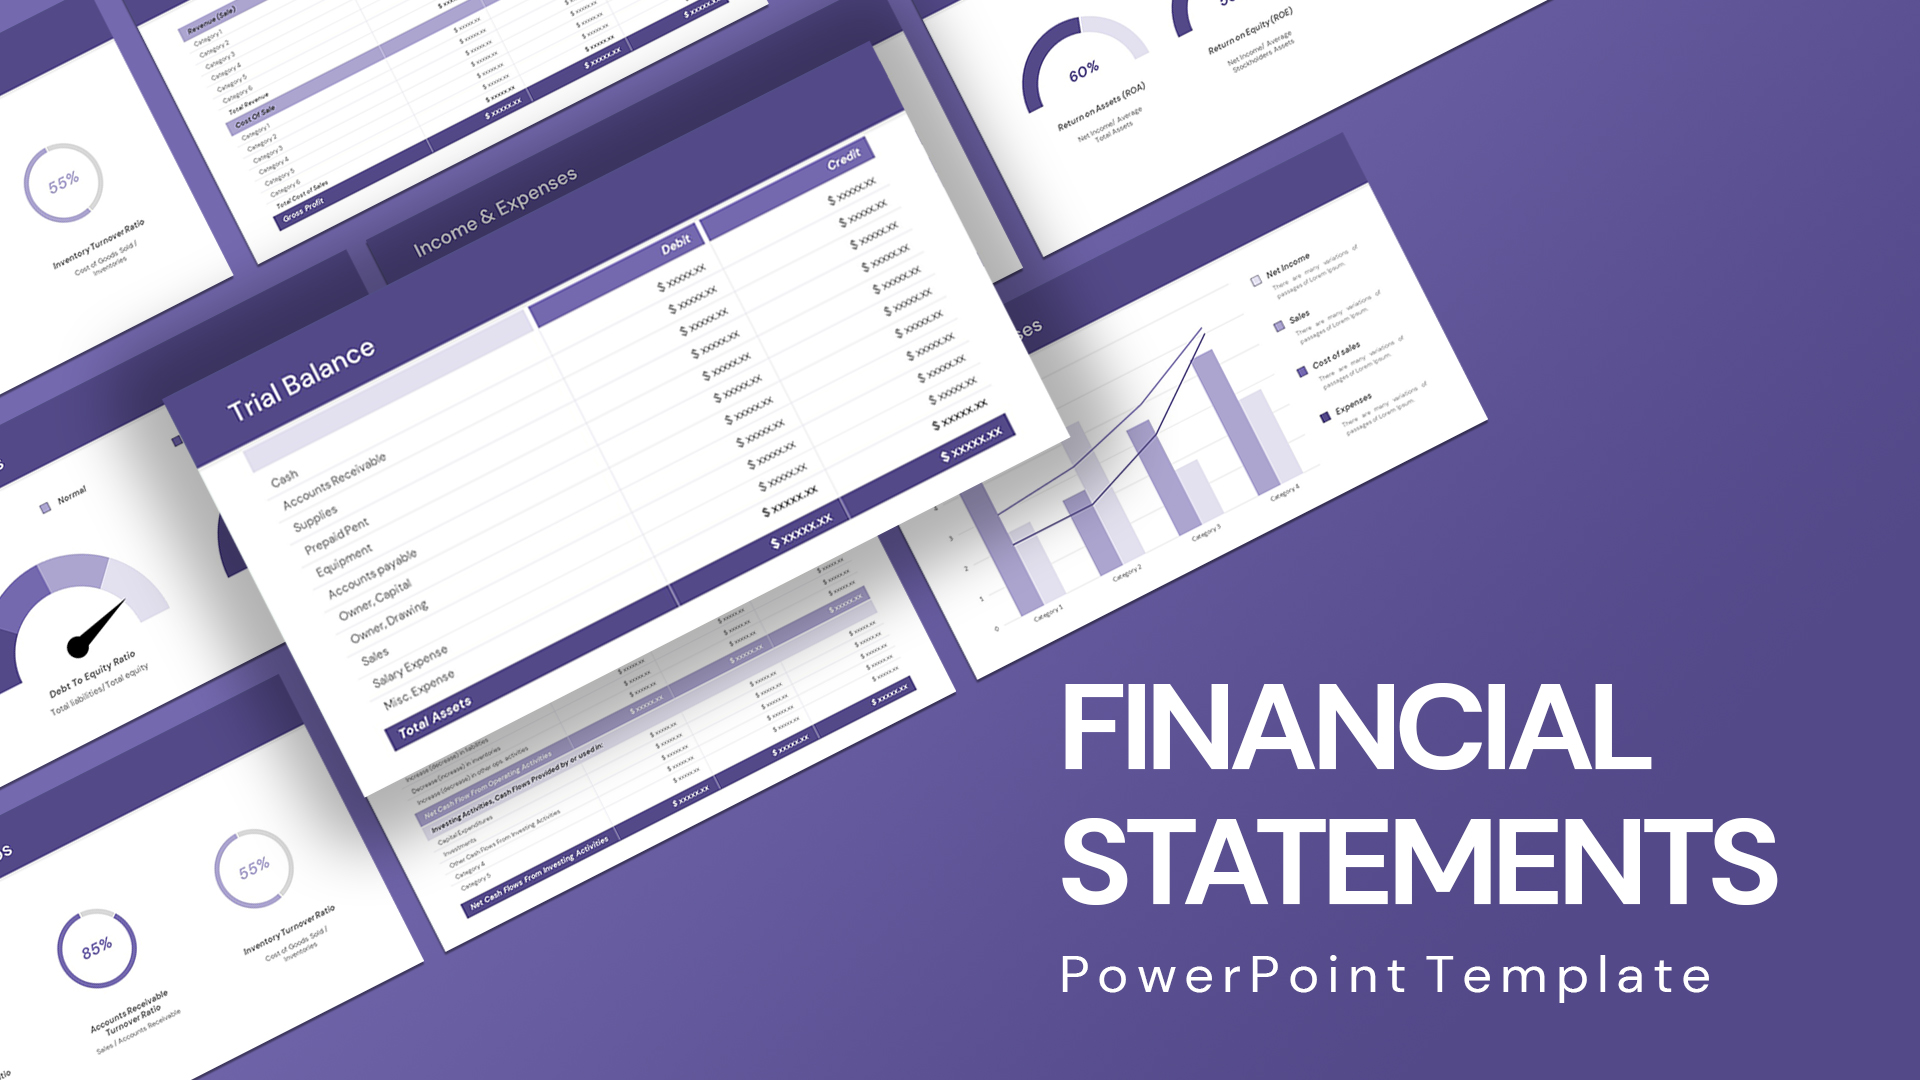
Comprehensive Financial Statements Template for PowerPoint & Google Slides
Finance
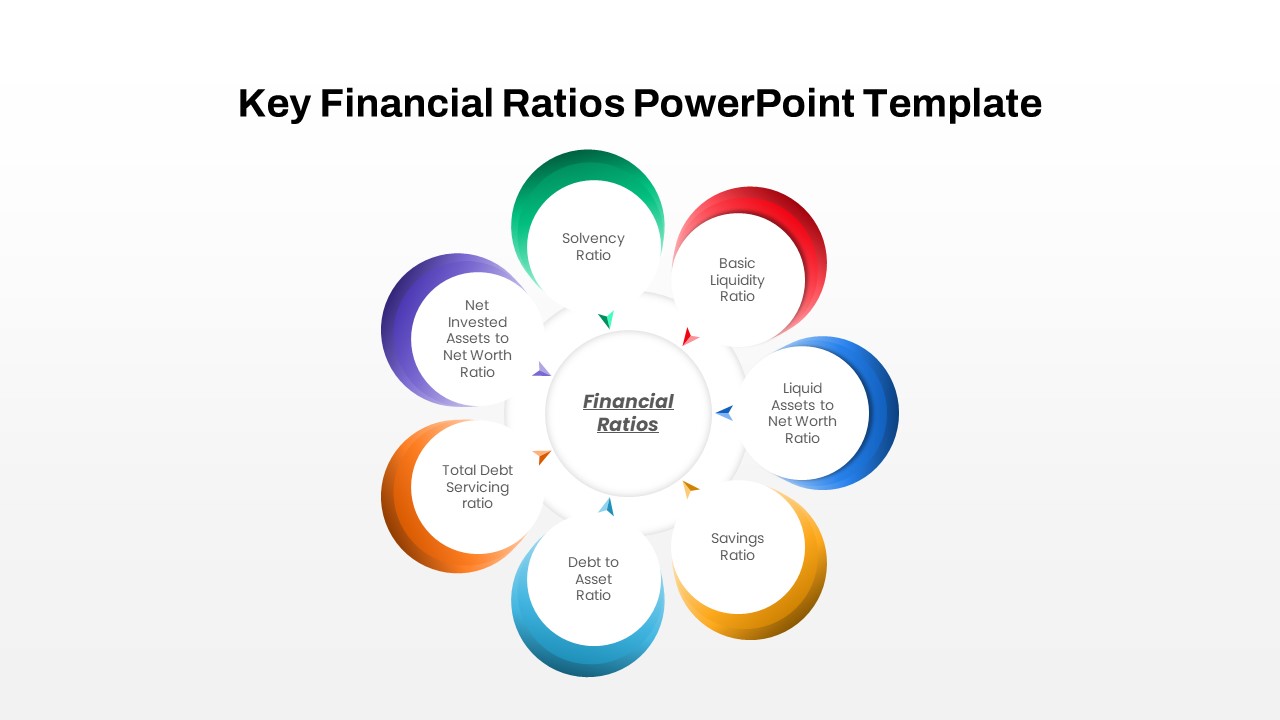
Circular Financial Ratios Infographic Template for PowerPoint & Google Slides
Finance
Sunk Costs Financial Concept Diagram Template for PowerPoint & Google Slides
Finance
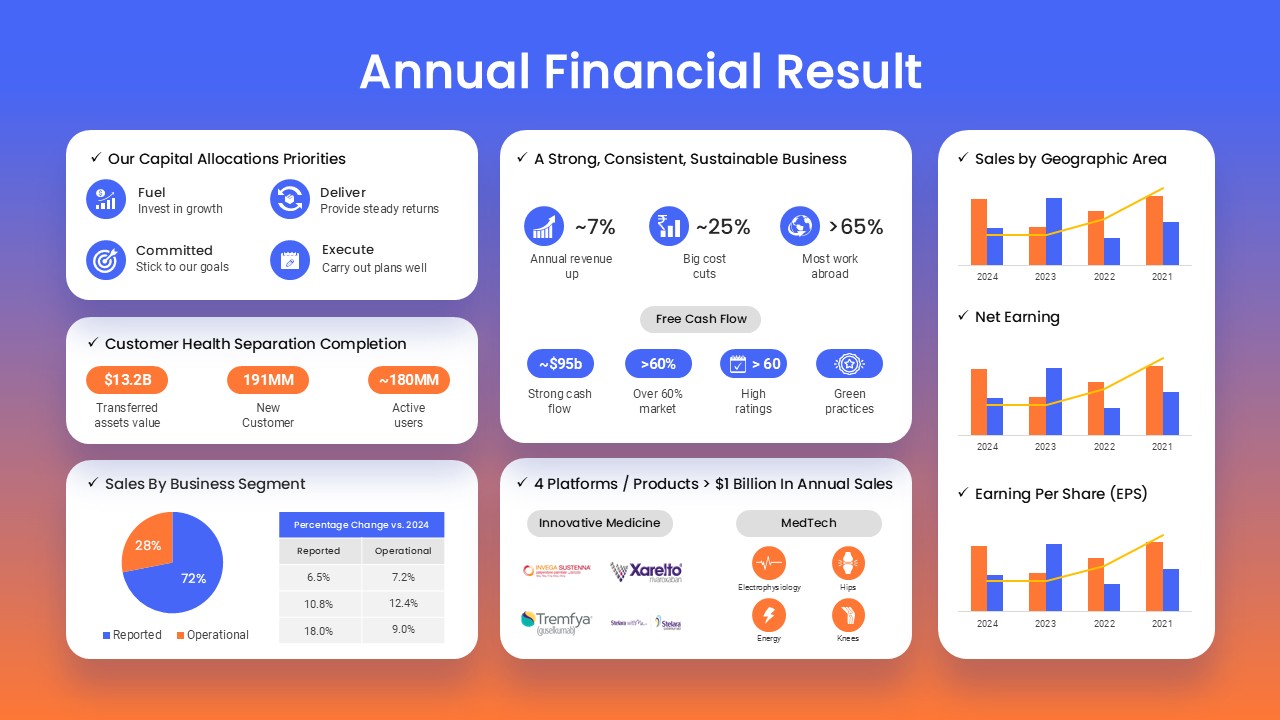
Annual Financial Results Slide Deck Template for PowerPoint & Google Slides
Finance
Dynamic Financial Analysis Line Chart Template for PowerPoint & Google Slides
Finance
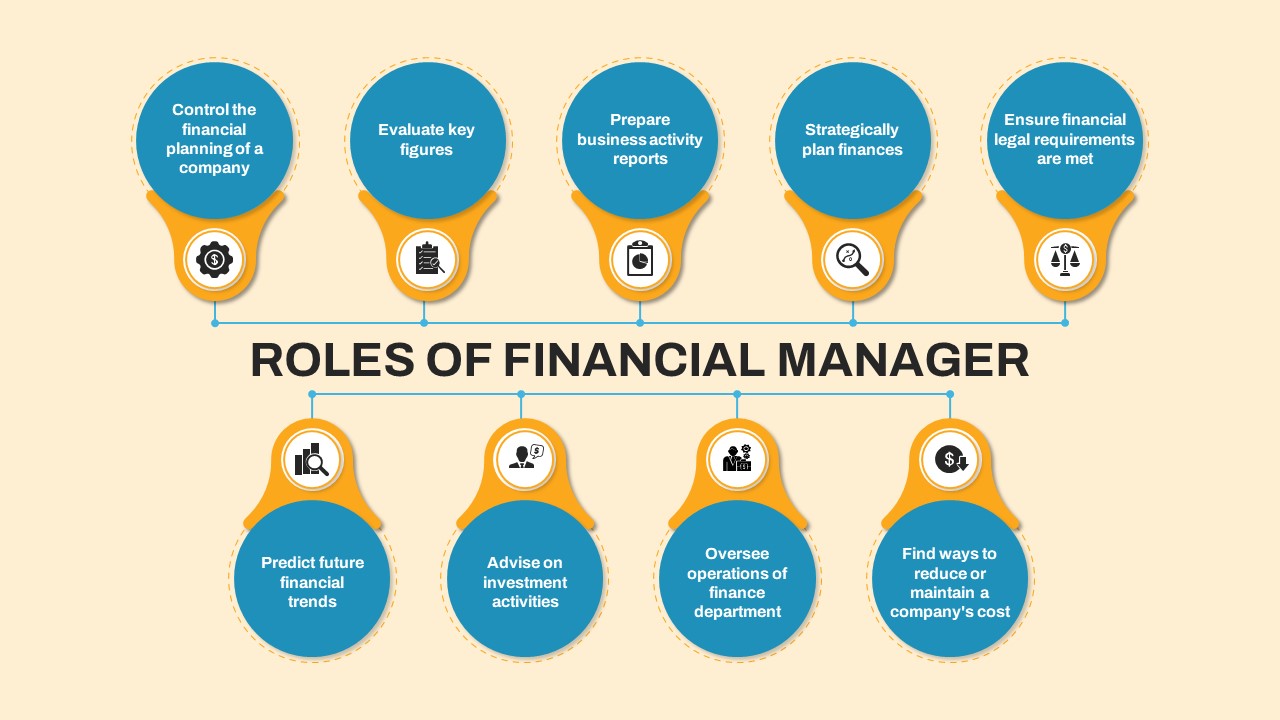
Financial Manager Roles Template for PowerPoint & Google Slides
Process
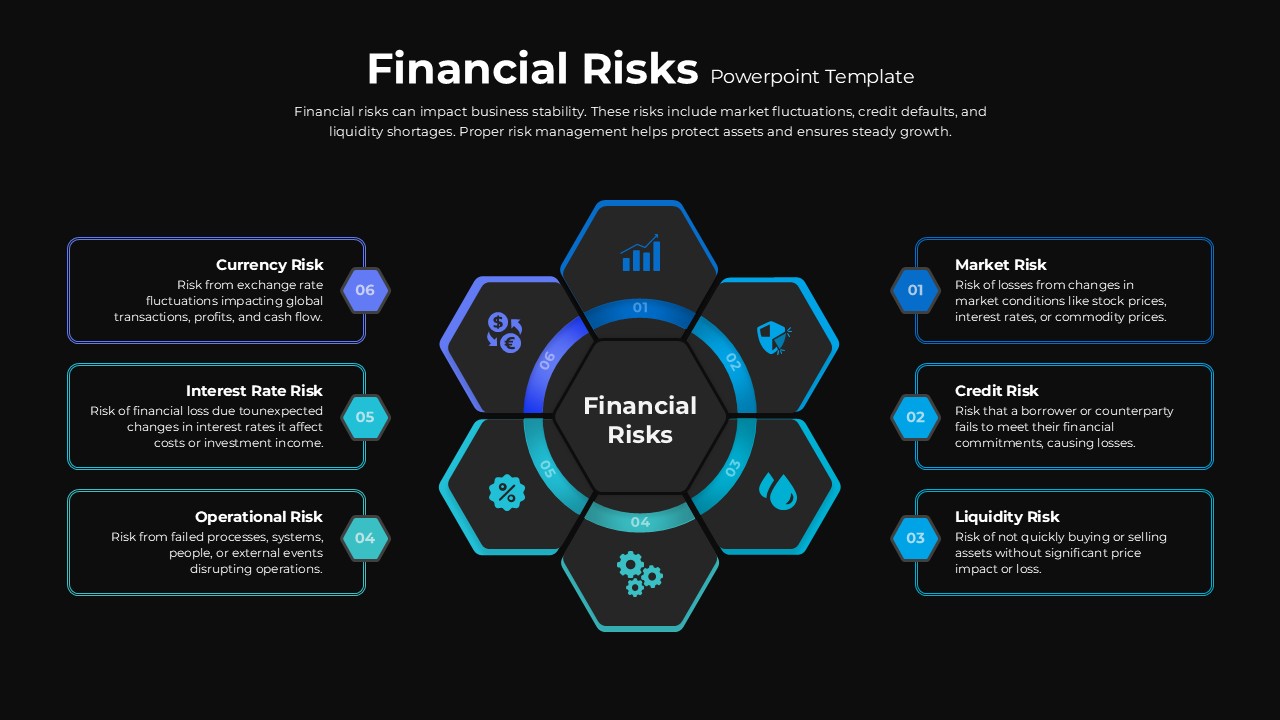
Financial Risks Hexagon Diagram Template for PowerPoint & Google Slides
Risk Management
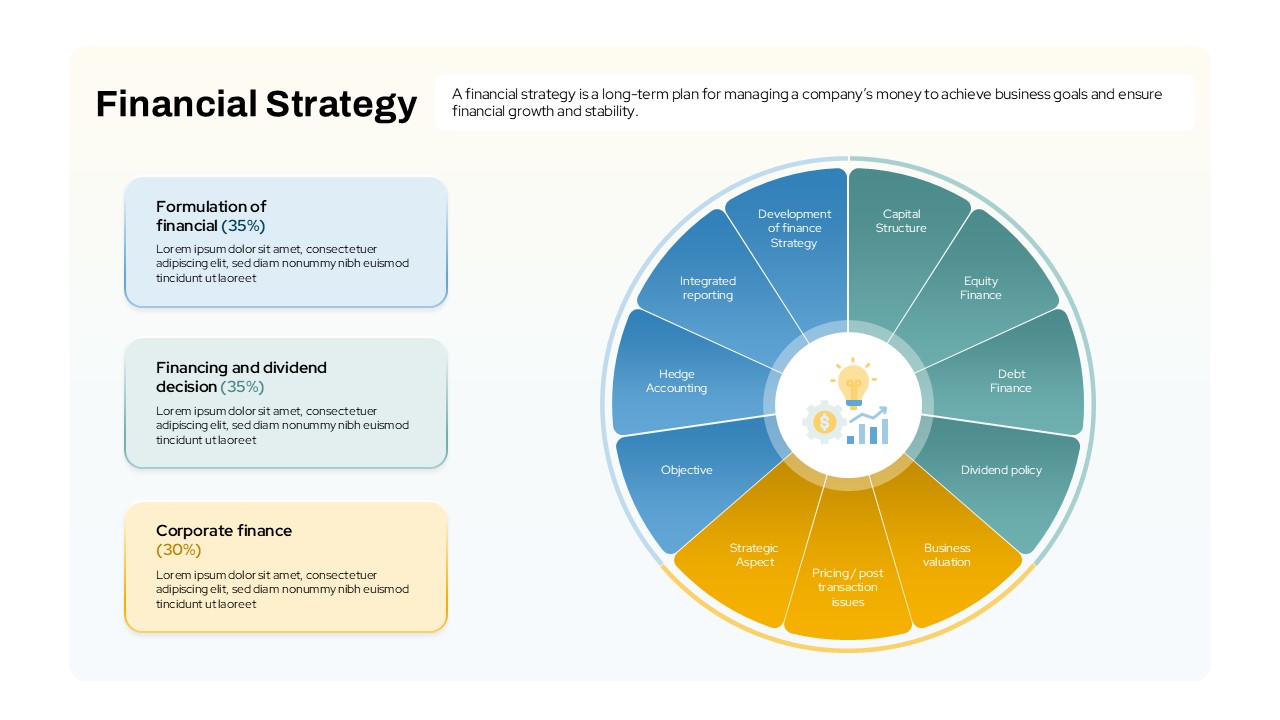
Financial Strategy template for PowerPoint & Google Slides
Business Strategy
Financial Gap Analysis Framework Template for PowerPoint & Google Slides
Finance
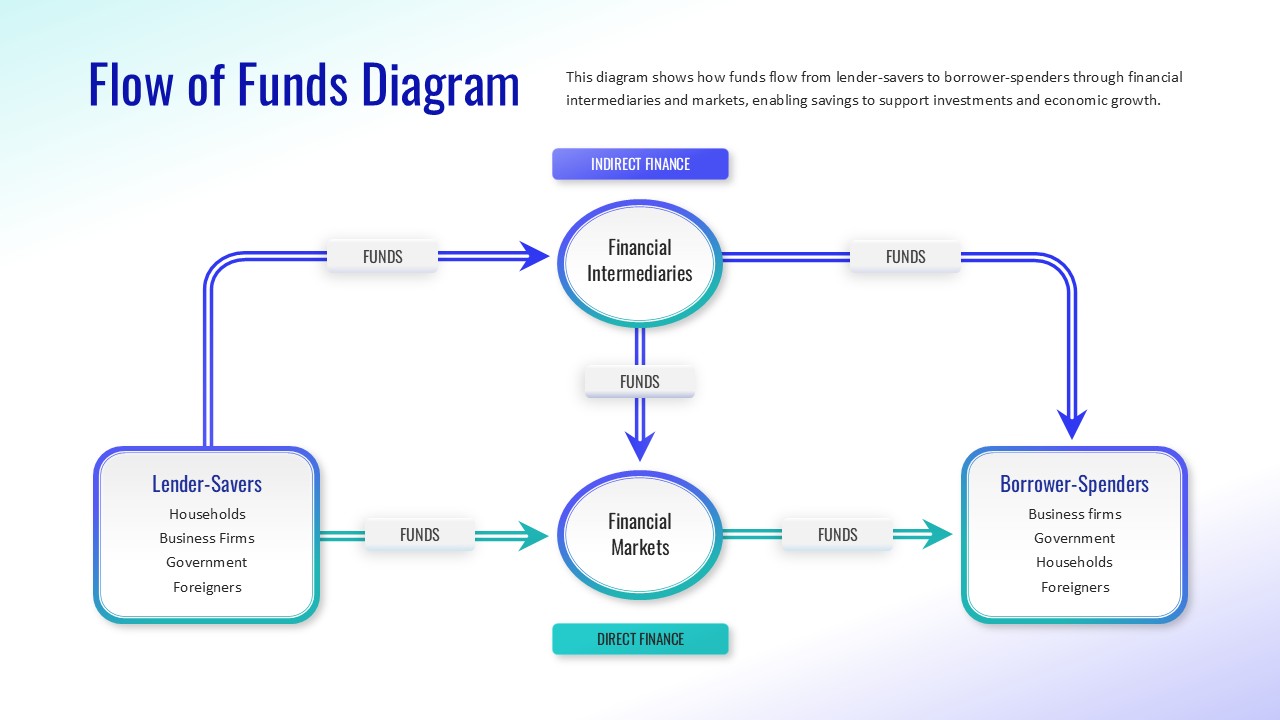
Flow of Funds Financial System Diagram Template for PowerPoint & Google Slides
Finance
Stacked Area Chart with Financial Highlights for PowerPoint & Google Slides
Finance
Free KPI Dashboard PowerPoint Template for PowerPoint & Google Slides
Charts
Free

Dynamic Data Dashboard Infographic Template for PowerPoint & Google Slides
Bar/Column
Product Usage Analytics Dashboard Chart Template for PowerPoint & Google Slides
Bar/Column
Data Analytics Dashboard Design template for PowerPoint & Google Slides
Bar/Column

Efficiency KPI Dashboard Metaphor Template for PowerPoint & Google Slides
Infographics
Business Dashboard Analytics & KPIs Template for PowerPoint & Google Slides
Bar/Column
Professional Team Efficiency Dashboard Template for PowerPoint & Google Slides
Business Report
Project Management Dashboard Template for PowerPoint & Google Slides
Project
Website Performance Dashboard template for PowerPoint & Google Slides
Charts
Employee Skill Analysis Dashboard Template for PowerPoint & Google Slides
Employee Performance
Sales Growth Dashboard: KPI Gauge & Line Template for PowerPoint & Google Slides
Revenue
Social Media Performance Dashboard Template for PowerPoint & Google Slides
Bar/Column
Net Promoter Score Dashboard Template for PowerPoint & Google Slides
Customer Experience
Modern Project Status Report Dashboard Template for PowerPoint & Google Slides
Project Status
Performance KPI Dashboard Slide Template for PowerPoint & Google Slides
Business Report
Bull and Bear Stock Market Dashboard Template for PowerPoint & Google Slides
Infographics
KPI Dashboard template for PowerPoint & Google Slides
Business Report
Professional Nurse Infographic Dashboard Template for PowerPoint & Google Slides
Nursing
Interactive Benchmarking Gauge Dashboard Template for PowerPoint & Google Slides
Pie/Donut
Heat Map Risk Matrix Dashboard Template for PowerPoint & Google Slides
Comparison Chart
Colorful Project Status Dashboard Template for PowerPoint & Google Slides
Project Status
Weekly Update Schedule Dashboard Template for PowerPoint & Google Slides
Agenda
Project Status Dashboard Template for PowerPoint & Google Slides
Project Status
Weekly Status Report Dashboard Template for PowerPoint & Google Slides
HR
Free Metro UI Dashboard Infographic Template for PowerPoint & Google Slides
Business Report
Free
Website Performance Monitoring Dashboard Template for PowerPoint & Google Slides
Business Report
One Pager Annual Report Dashboard Template for PowerPoint & Google Slides
Business Report
Social Media Analytics Dashboard Template for PowerPoint & Google Slides
Digital Marketing
Social Media Statistics 2023 Dashboard Template for PowerPoint & Google Slides
Comparison
Mastodon Metrics Infographic Dashboard Template for PowerPoint & Google Slides
Business Report
Soccer Match Stats Dashboard Slide Template for PowerPoint & Google Slides
Graphics
Employee Satisfaction Survey Dashboard Template for PowerPoint & Google Slides
Employee Performance
Customer Satisfaction KPI Dashboard Template for PowerPoint & Google Slides
Customer Experience
Weekly Project Status Dashboard Template for PowerPoint & Google Slides
Project Status
Freight Logistics Dashboard Infographic Template for PowerPoint & Google Slides
Comparison Chart
Free Quarterly Business Review Dashboard Template for PowerPoint & Google Slides
Business
Free
Cost Cutting Savings Dashboard Template for PowerPoint & Google Slides
Pie/Donut
Macroeconomic Indicators Dashboard Template for PowerPoint & Google Slides
PEST
Michigan County Map with KPI Dashboard Template for PowerPoint & Google Slides
World Maps
Quarterly Business Review Dashboard Template for PowerPoint & Google Slides
Pitch Deck
Monthly Business Review Dashboard Deck Template for PowerPoint & Google Slides
Business Report
DevOps KPI Dashboard Performance Metrics Template for PowerPoint & Google Slides
Software Development
Purchasing KPI Metrics Dashboard Template for PowerPoint & Google Slides
Business Report
Procurement KPI Dashboard & Metrics Template for PowerPoint & Google Slides
Business Report
Project Progress Dashboard Pie Charts Template for PowerPoint & Google Slides
Project
HR Report Dashboard Template for PowerPoint & Google Slides
Employee Performance
Budget Forecast Dashboard & Donut Charts Template for PowerPoint & Google Slides
Pie/Donut
Inventory Management Dashboard Template for PowerPoint & Google Slides
Process
Digital Marketing KPIs Dashboard Dark Template for PowerPoint & Google Slides
Business Report
Employee Performance Metrics Dashboard Template for PowerPoint & Google Slides
Employee Performance
Turnover Analysis Dashboard Template for PowerPoint & Google Slides
Employee Performance
Project Tracking Dashboard Table Template for PowerPoint & Google Slides
Project Status
Action Items Management Dashboard Table Template for PowerPoint & Google Slides
Project Status
Customer Interview Insights Dashboard Template for PowerPoint & Google Slides
Customer Experience
Project Status Update Dashboard Table Template for PowerPoint & Google Slides
Project Status
Cohort Analysis Retention Dashboard Template for PowerPoint & Google Slides
Comparison Chart
Project Status Dashboard Template for PowerPoint & Google Slides
Project Status
Dashboard Project Status Template for PowerPoint & Google Slides
Project Status
Task Completion Rate Dashboard Template for PowerPoint & Google Slides
Business
Project Status Dashboard with RAG Legend Template for PowerPoint & Google Slides
Project Status
End of Year Review Dashboard Template for PowerPoint & Google Slides
Business Report
Construction Project Dashboard Template for PowerPoint & Google Slides
Project
Employee Headcount Dashboard Report Template for PowerPoint & Google Slides
Employee Performance
4DX Scoreboard KPI Gauge Dashboard Template for PowerPoint & Google Slides
Business Strategy