Attribution Modeling Flow Chart Template for PowerPoint & Google Slides

Description
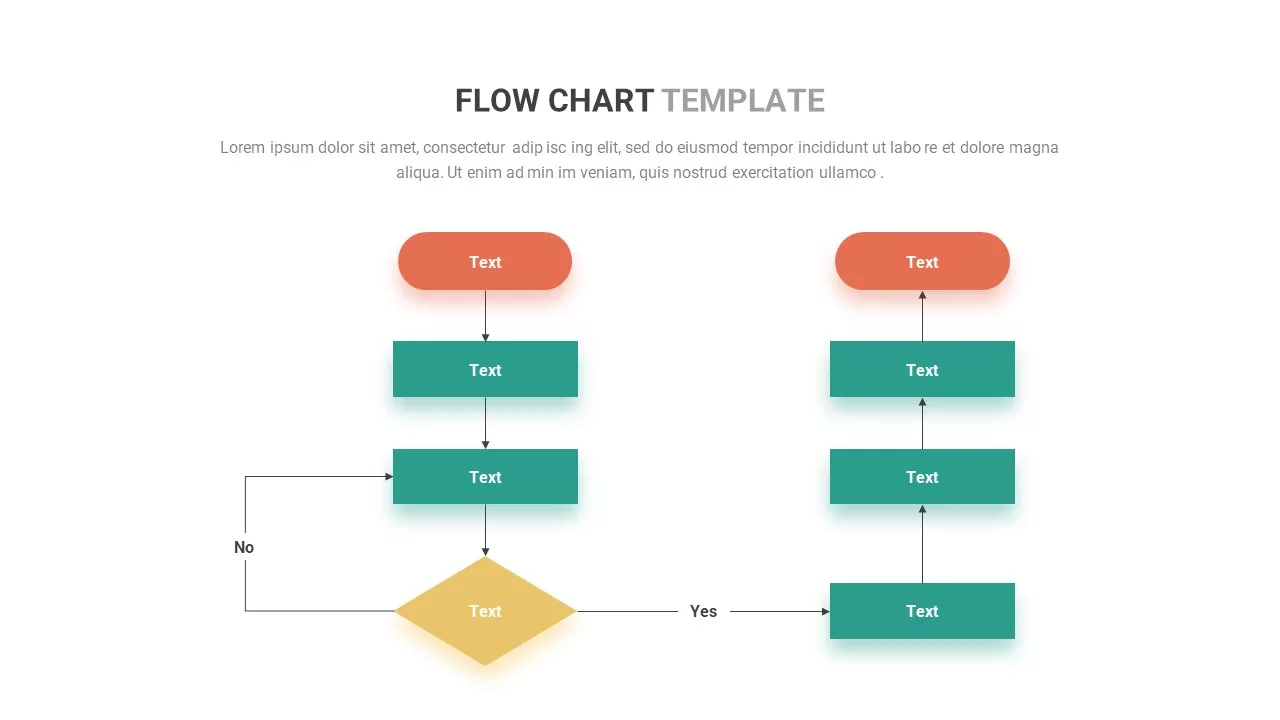
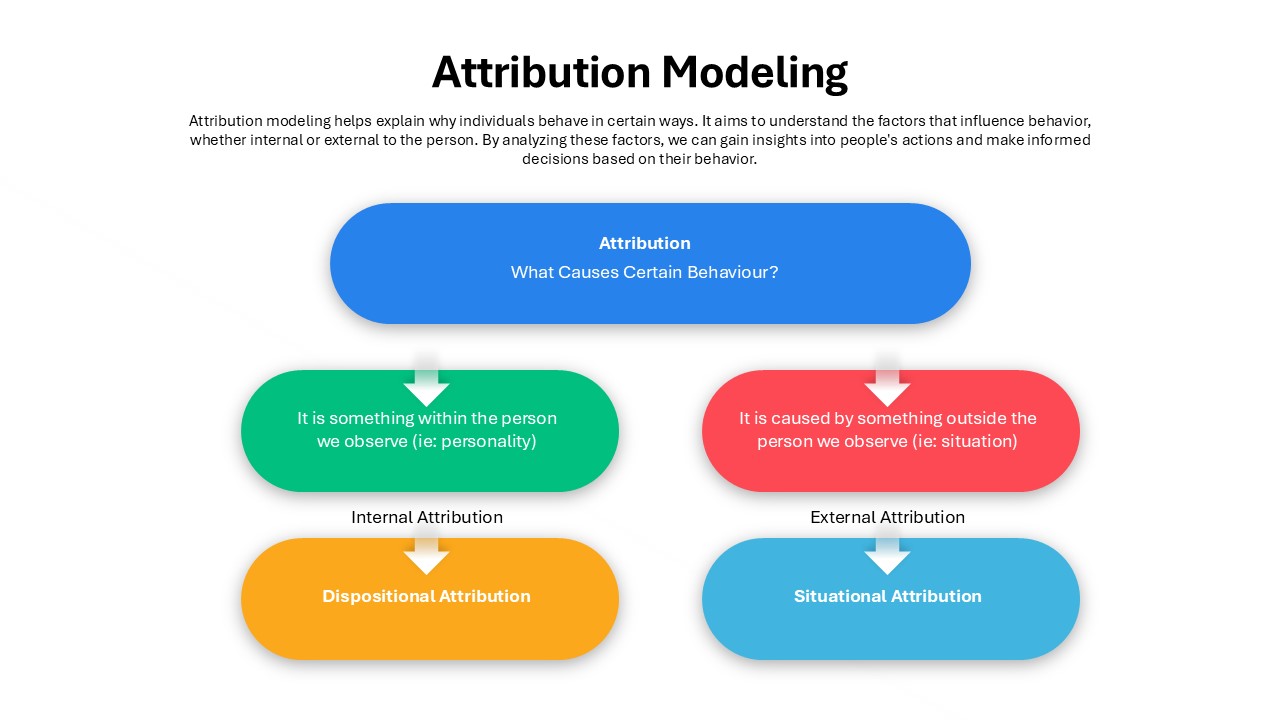
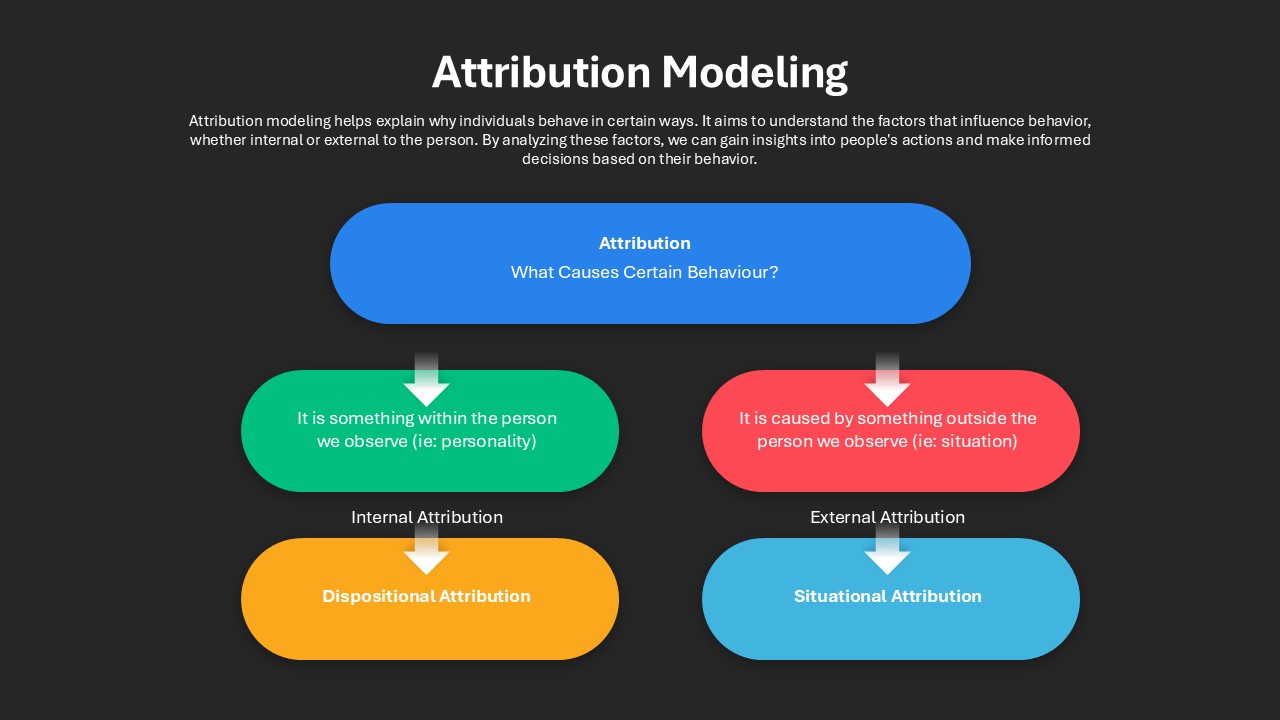
Leverage this clean, color-coded flow chart slide to map attribution modeling concepts with clarity and precision. A bold blue header pill introduces the core question “What Causes Certain Behaviour?”, followed by dual branches that separate internal (green) and external (red) factors. Each branch culminates in outcome pills—dispositional (yellow) and situational (light blue)—connected by crisp white arrows on a minimalist white background. Subtle drop shadows and rounded containers enhance depth, while sans-serif typography maintains legibility. The subtitle space above offers room for contextual definitions or research insights.
Designed for seamless editing in PowerPoint and Google Slides, this template leverages master layouts and scalable vector shapes for effortless customization. Replace text placeholders, adjust pill colors, and swap icons to align with your brand identity. The modular structure supports adding, removing, or reordering branches without compromising alignment. Built-in animation presets enable staged reveals of each concept tier, and shape outlines can highlight critical segments for emphasis.
Ideal for marketing analysts, UX researchers, psychology educators, and business strategists dissecting behavior drivers, this slide clarifies complex theories in a single view. Use it in academic lectures to explain attribution theory, in consulting proposals to map customer decision factors, or in team workshops to foster data-driven discussions. The intuitive branch structure also aids in campaign attribution analyses, user journey breakdowns, and performance reporting, making it a versatile asset across industries and project types.
Optimized for both light and dark themes, the design ensures high contrast and accessibility across devices. High-resolution graphics guarantee crisp rendering on projectors and screens, while cloud-based collaboration features support real-time editing and version control for remote teams.
Who is it for
Marketing analysts, UX researchers, psychology educators, and business strategists will benefit from this slide when illustrating attribution theory, customer decision factors, or behavioral analysis in presentations and workshops.
Other Uses
Beyond attribution modeling, repurpose this slide for customer journey breakdowns, campaign performance attribution analyses, UX research reports, behavioral psychology training sessions, root-cause mapping, and performance metric comparisons.
Login to download this file

Item ID
SB05321
Related Templates

Attribution Models Comparison Diagram Template for PowerPoint & Google Slides
Comparison
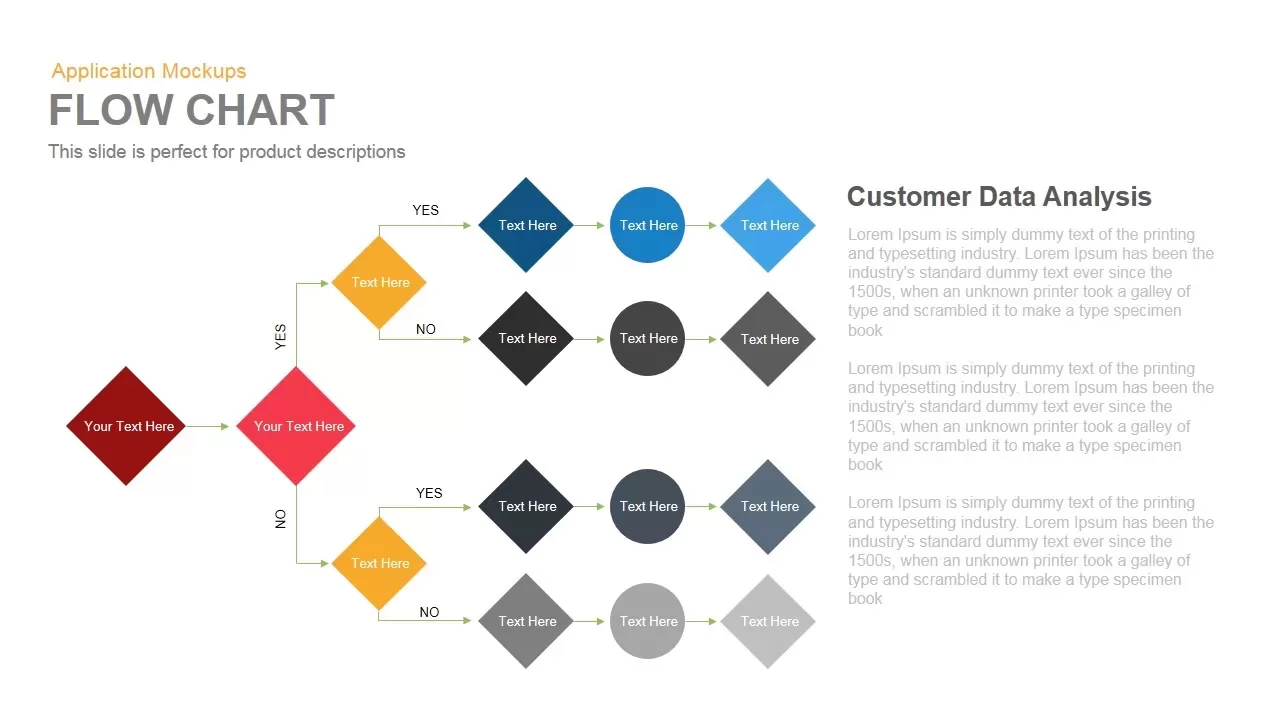
Flow Chart template for PowerPoint & Google Slides
Flow Charts
Vertical Split Flow Chart Diagram Template for PowerPoint & Google Slides
Flow Charts
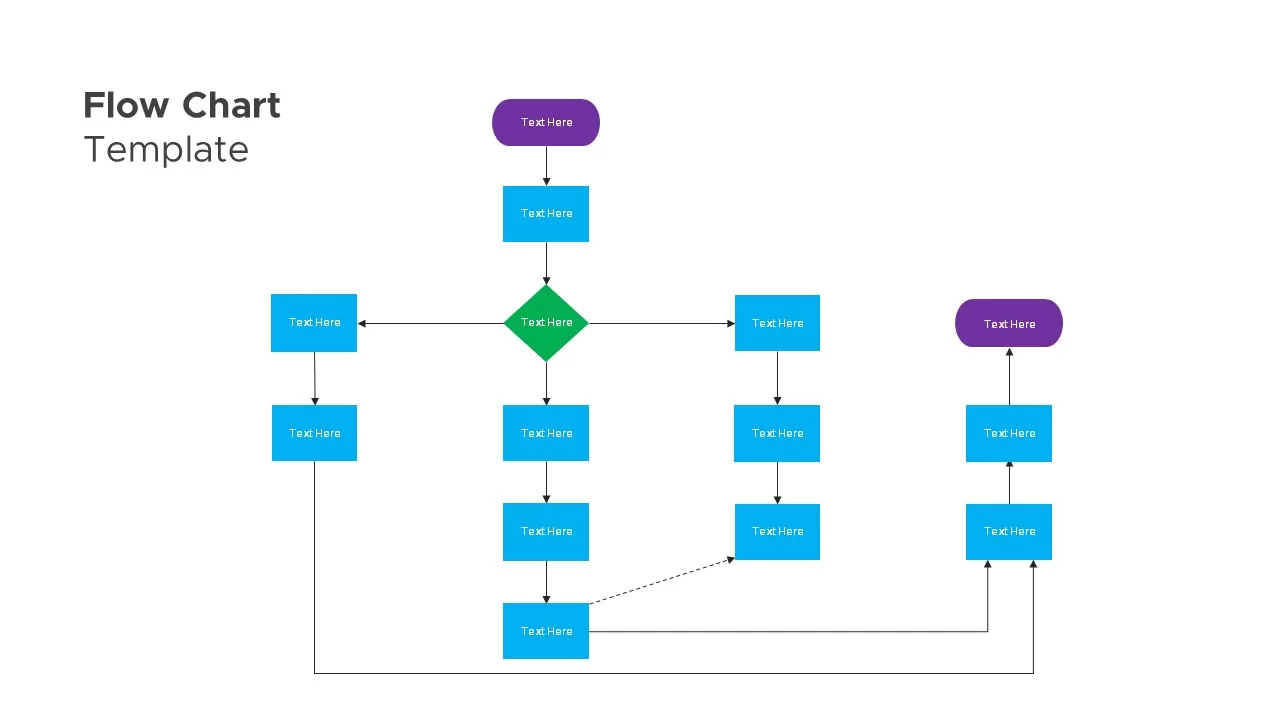
Flow Chart Diagram Template for PowerPoint & Google Slides
Flow Charts
Flow Chart Diagram template for PowerPoint & Google Slides
Flow Charts
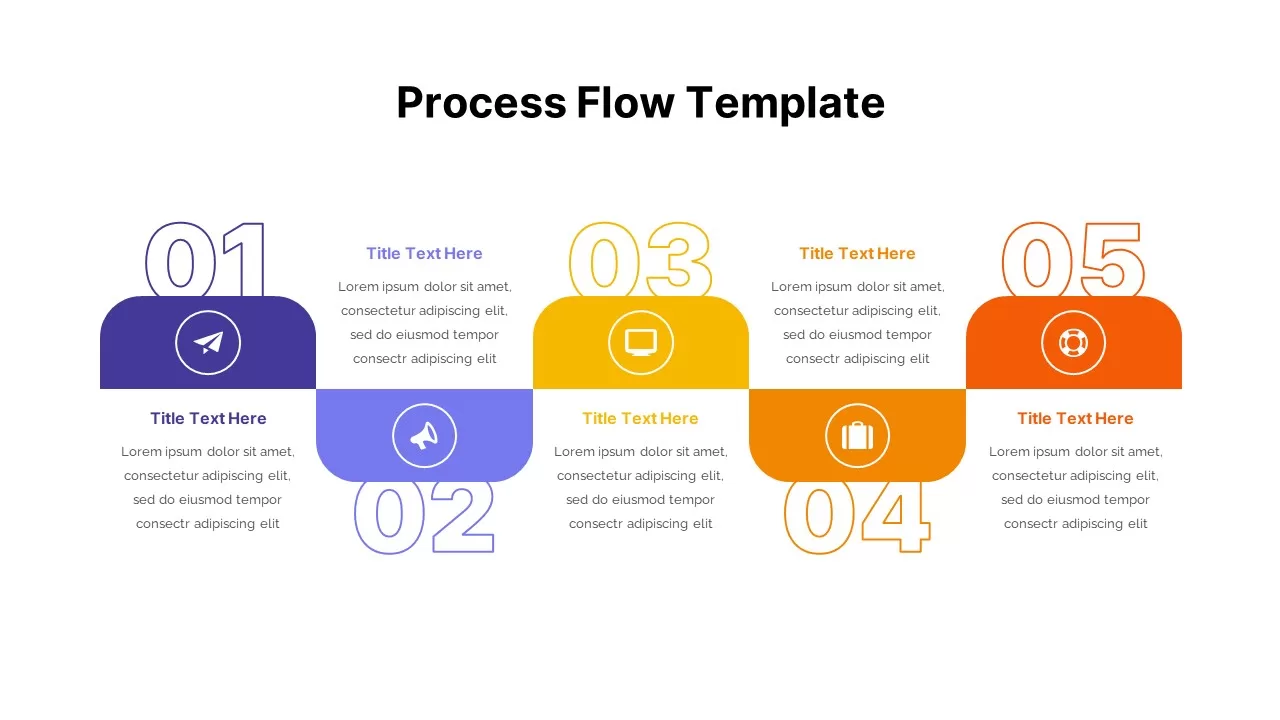
Flow Chart Template for PowerPoint & Google Slides
Flow Charts
Flow Chart Template for PowerPoint & Google Slides
Flow Charts
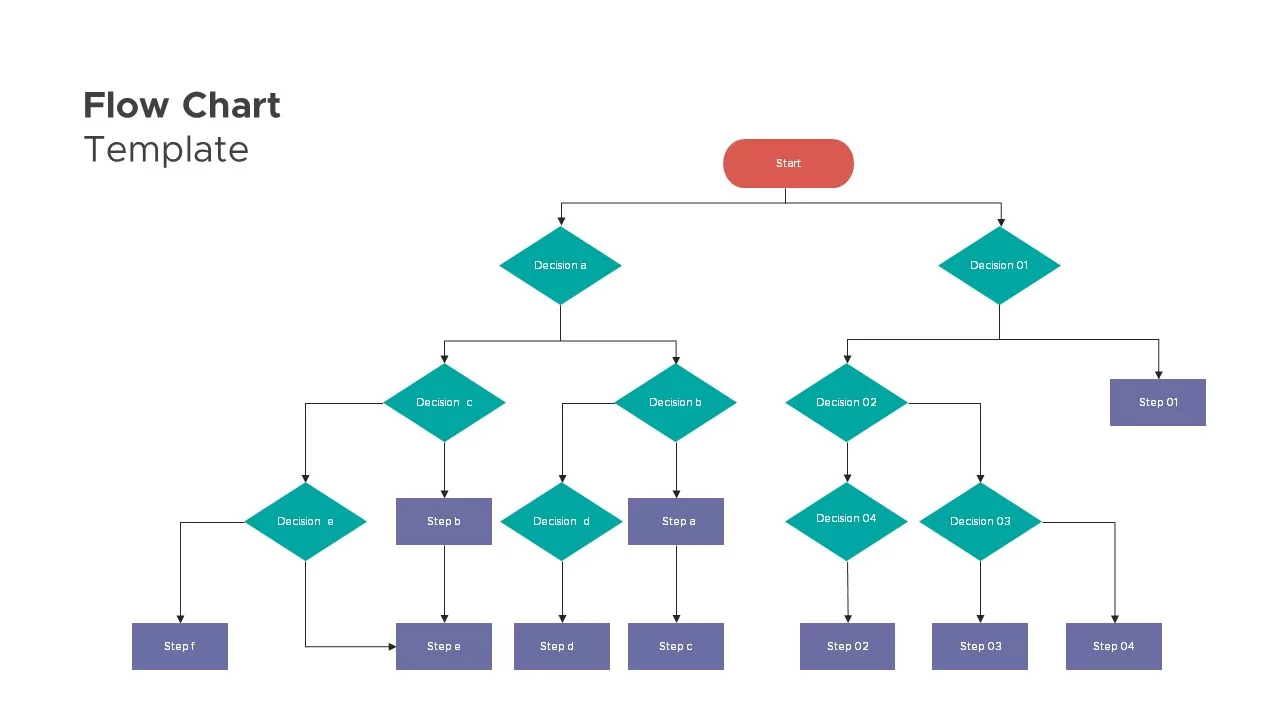
Flow Chart Decision Tree Template for PowerPoint & Google Slides
Flow Charts
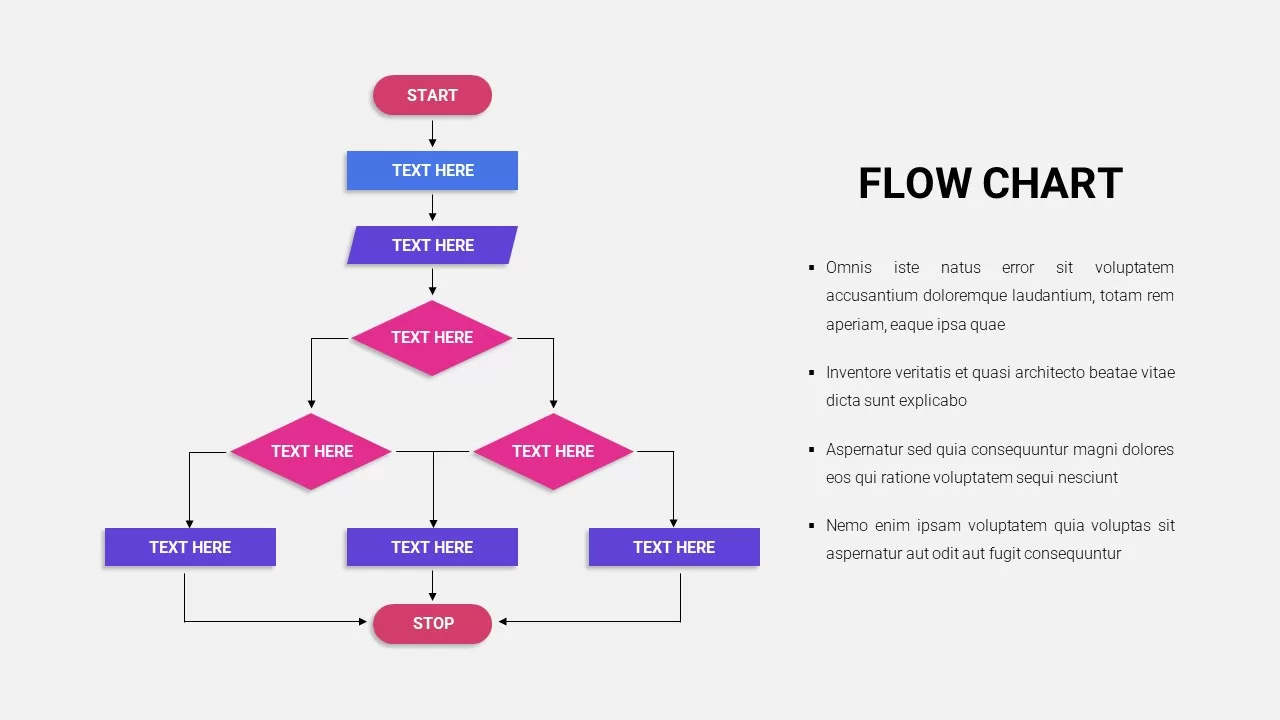
Flow Chart Template for PowerPoint & Google Slides
Flow Charts
Flow Chart template for PowerPoint & Google Slides
Flow Charts
Flow Chart template for PowerPoint & Google Slides
Flow Charts
Free Circular Multi-Step Flow Chart Diagram Template for PowerPoint & Google Slides
Flow Charts
Free
Comprehensive Hiring Process Flow Chart Template for PowerPoint & Google Slides
Flow Charts
Cross Functional Swimlane Flow Chart Template for PowerPoint & Google Slides
Flow Charts
Wastewater Treatment Process Flow Chart Template for PowerPoint & Google Slides
Flow Charts
Animated Process Flow Chart Template for PowerPoint & Google Slides
Infographics
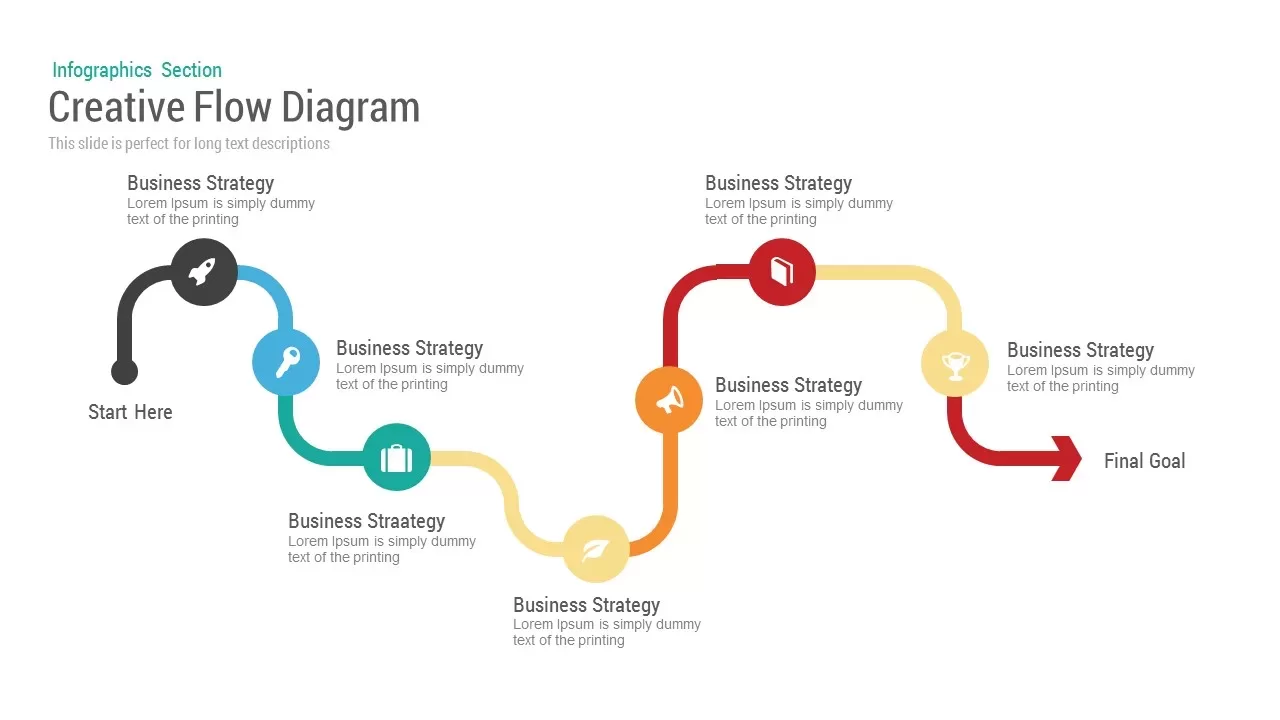
Creative flow diagram template for PowerPoint & Google Slides
Process
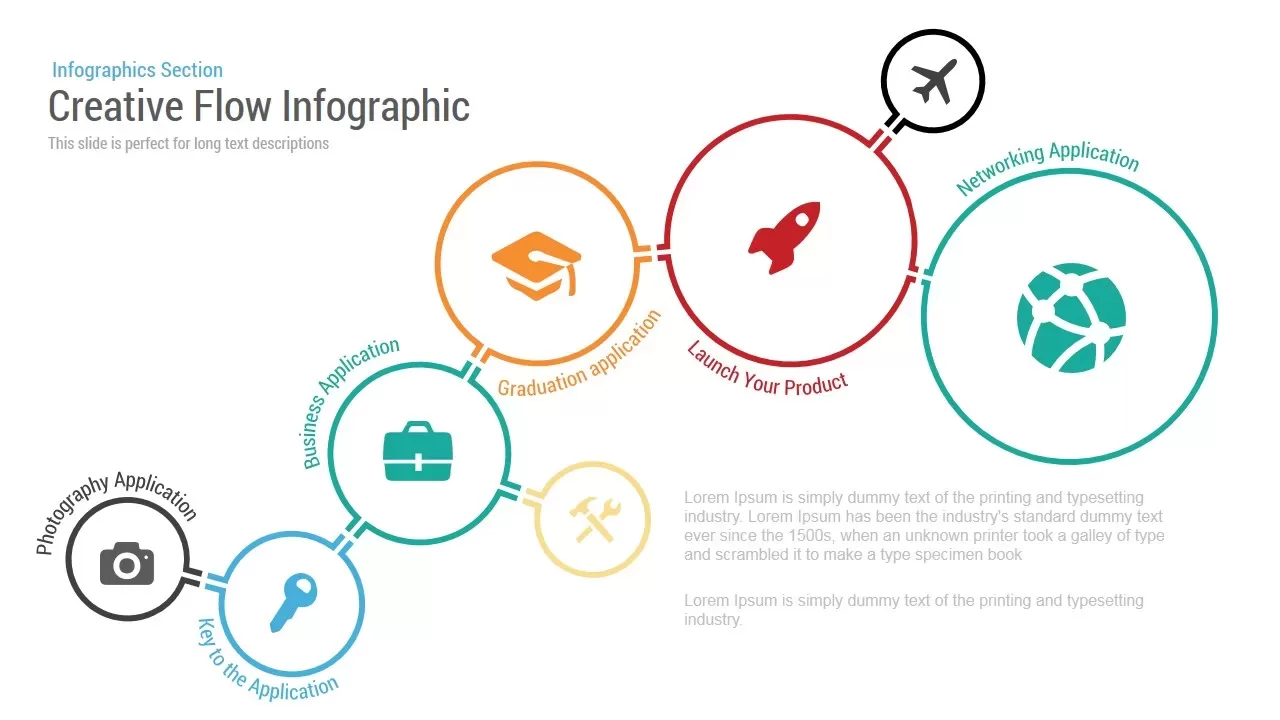
Creative Flow Infographic template for PowerPoint & Google Slides
Process
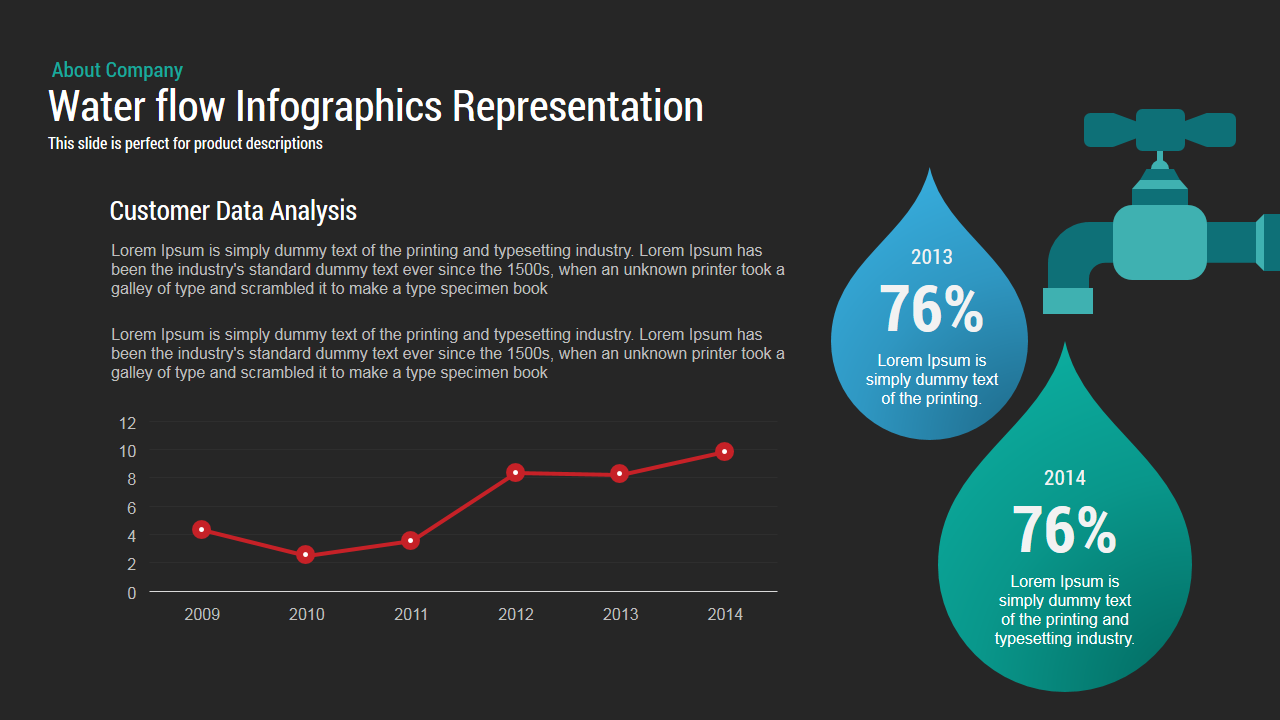
Water Flow template for PowerPoint & Google Slides
Infographics
Circular Flow Diagram Template for PowerPoint & Google Slides
Infographics
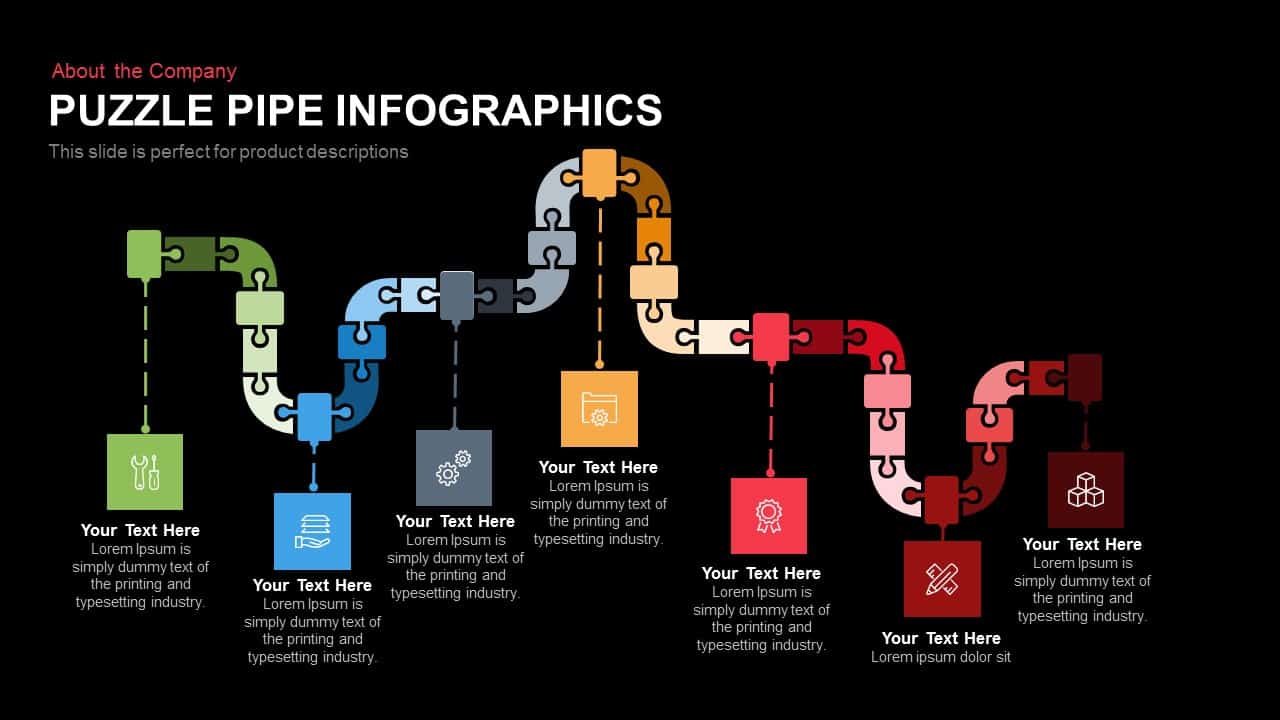
Puzzle Pipe Infographics Process Flow Template for PowerPoint & Google Slides
Process
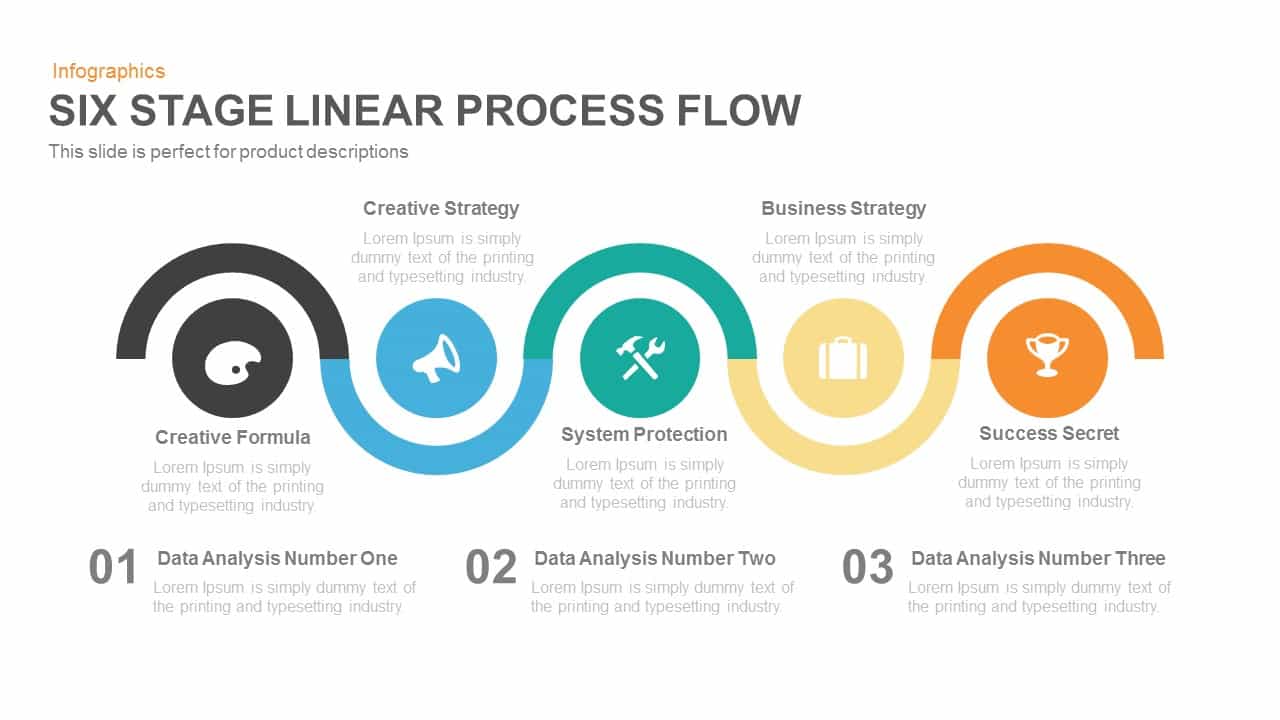
Six Hexagon Stages Process Flow Diagram Template for PowerPoint & Google Slides
Process
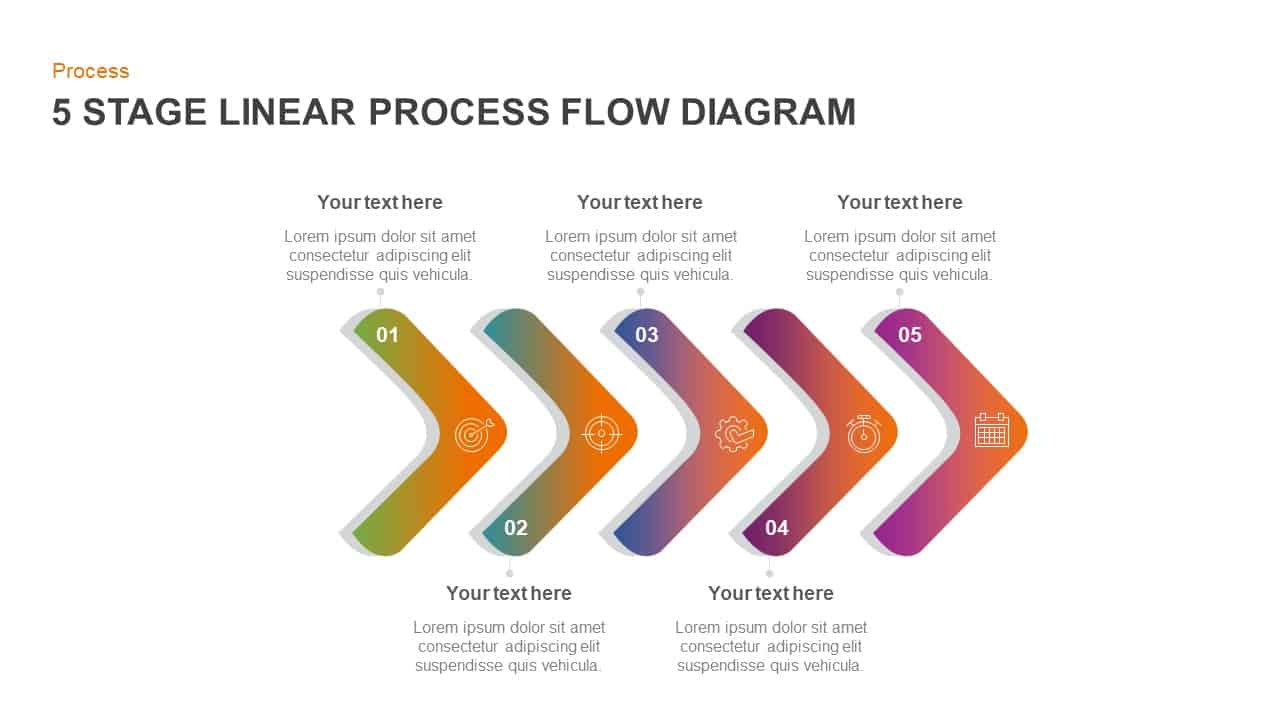
Five Stage Linear Process Flow Template for PowerPoint & Google Slides
Process
5-Stage Arrow Infographics Process Flow Template for PowerPoint & Google Slides
Arrow
Process Flow Diagram template for PowerPoint & Google Slides
Infographics
Six-Stage Zig-Zag Process Flow Diagram Template for PowerPoint & Google Slides
Process
Vertical Business Process Flow Diagram Template for PowerPoint & Google Slides
Process
Six-Sided Shutter Diagram Process Flow Template for PowerPoint & Google Slides
Process
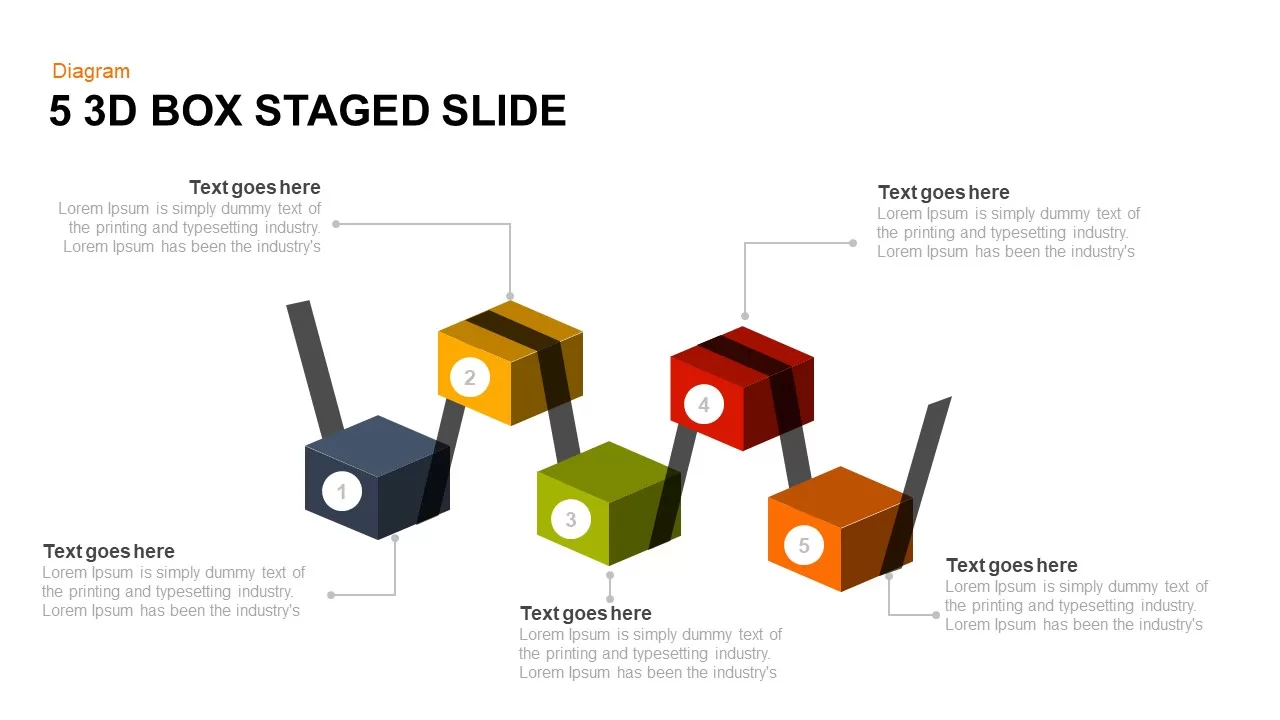
Five-Stage 3D Box Flow Diagram Template for PowerPoint & Google Slides
Process

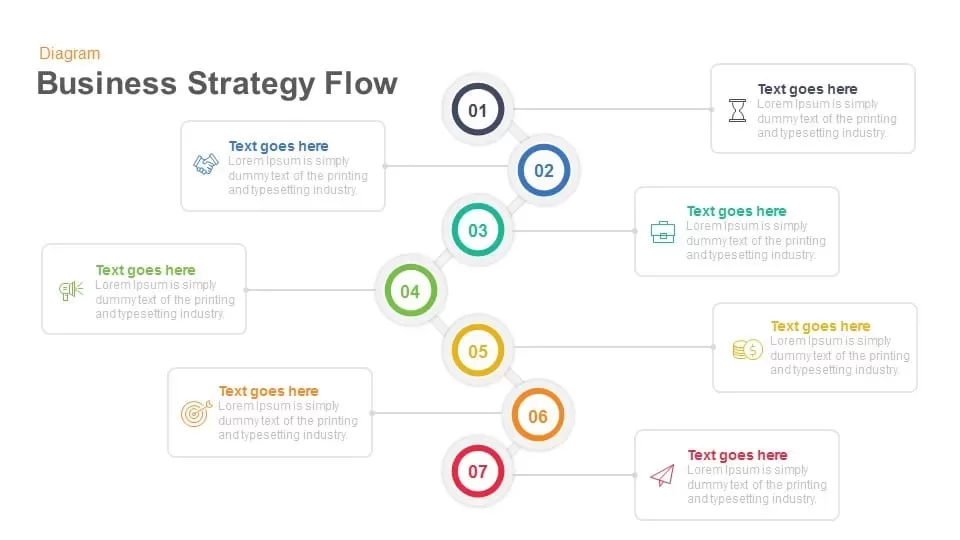
Business Strategy Flow template for PowerPoint & Google Slides
Process
10 Stages Business Flow Process Diagram template for PowerPoint & Google Slides
Business
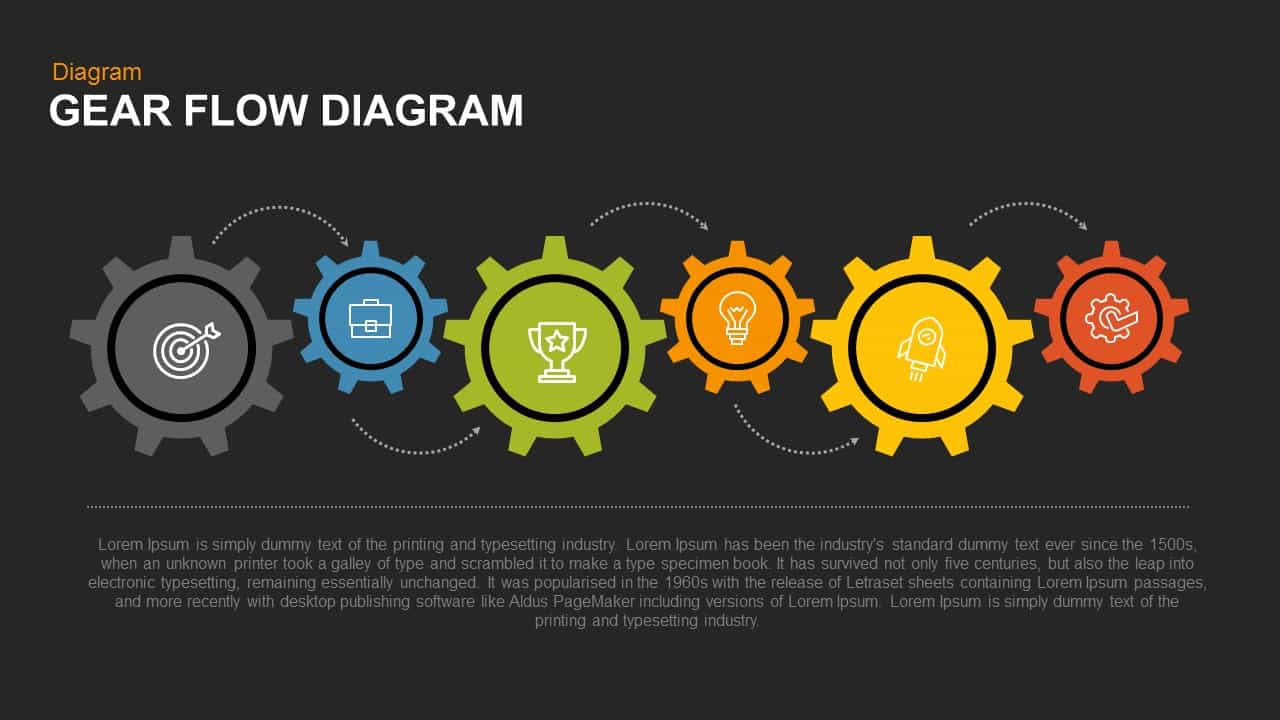
Gear Flow Diagram template for PowerPoint & Google Slides
Process

Eight-Stage Radial Process Flow Diagram Template for PowerPoint & Google Slides
Process
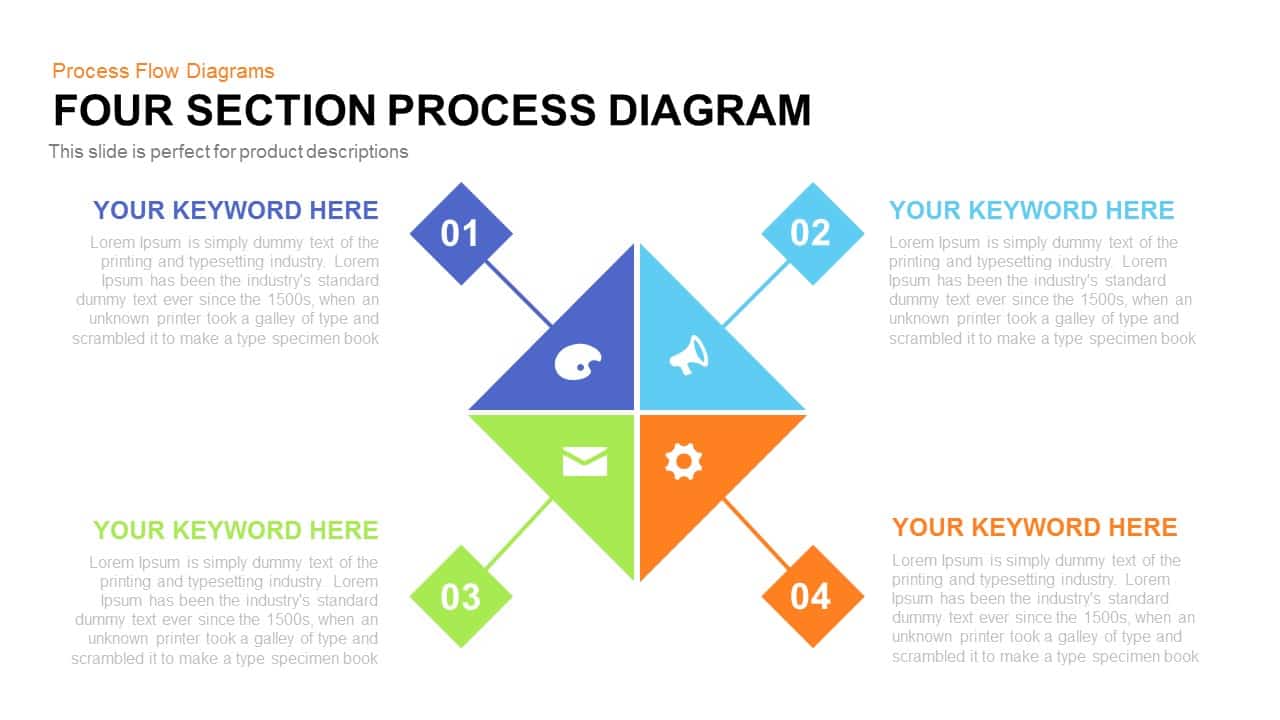
Four-Plus Process Flow Diagram Template for PowerPoint & Google Slides
Process
Four-Stage Circular Process Flow Template for PowerPoint & Google Slides
Process
4 Step Revenue Growth Flow Diagram Template for PowerPoint & Google Slides
Process
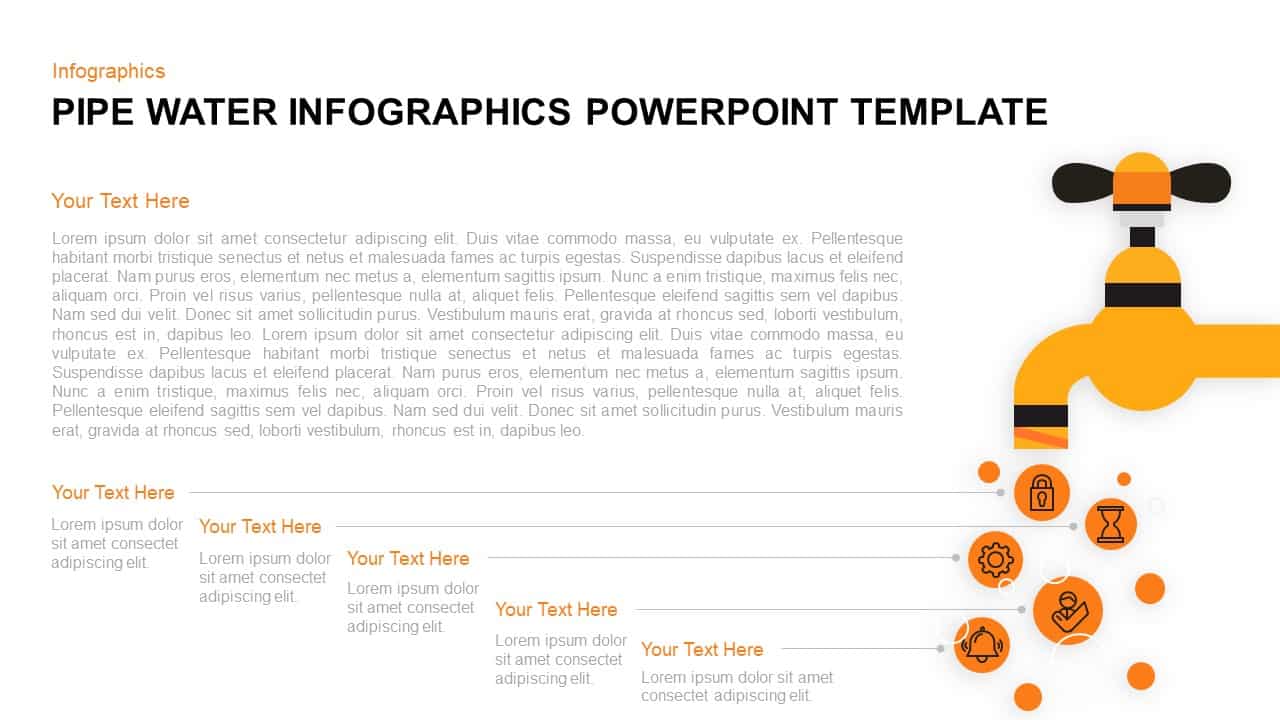
Pipe Water Infographics Flow Diagram Template for PowerPoint & Google Slides
Process
Five-Step Hexagonal Process Flow Template for PowerPoint & Google Slides
Process
Gradient Chevron Five-Stage Process Flow Template for PowerPoint & Google Slides
Arrow
Six-Step Hexagon Process Flow Diagram Template for PowerPoint & Google Slides
Process
Five-Stage Circular Flow Diagram Template for PowerPoint & Google Slides
Circular
3D Seven-Stage Process Flow Diagram Template for PowerPoint & Google Slides
Process
Four-Stage Linear Process Flow Diagram Template for PowerPoint & Google Slides
Process
Four-Stage Circular Flow Diagram Template for PowerPoint & Google Slides
Circular
5 Stage Linear Process Flow Diagram Template for PowerPoint & Google Slides
Process
Five-Stage Process Flow Diagram Template for PowerPoint & Google Slides
Process
4 Stage Linear Process Flow Diagram Template for PowerPoint & Google Slides
Process
4 Stage Linear Process Flow Diagram Template for PowerPoint & Google Slides
Process
6-Step Business Process Flow Diagram Template for PowerPoint & Google Slides
Process
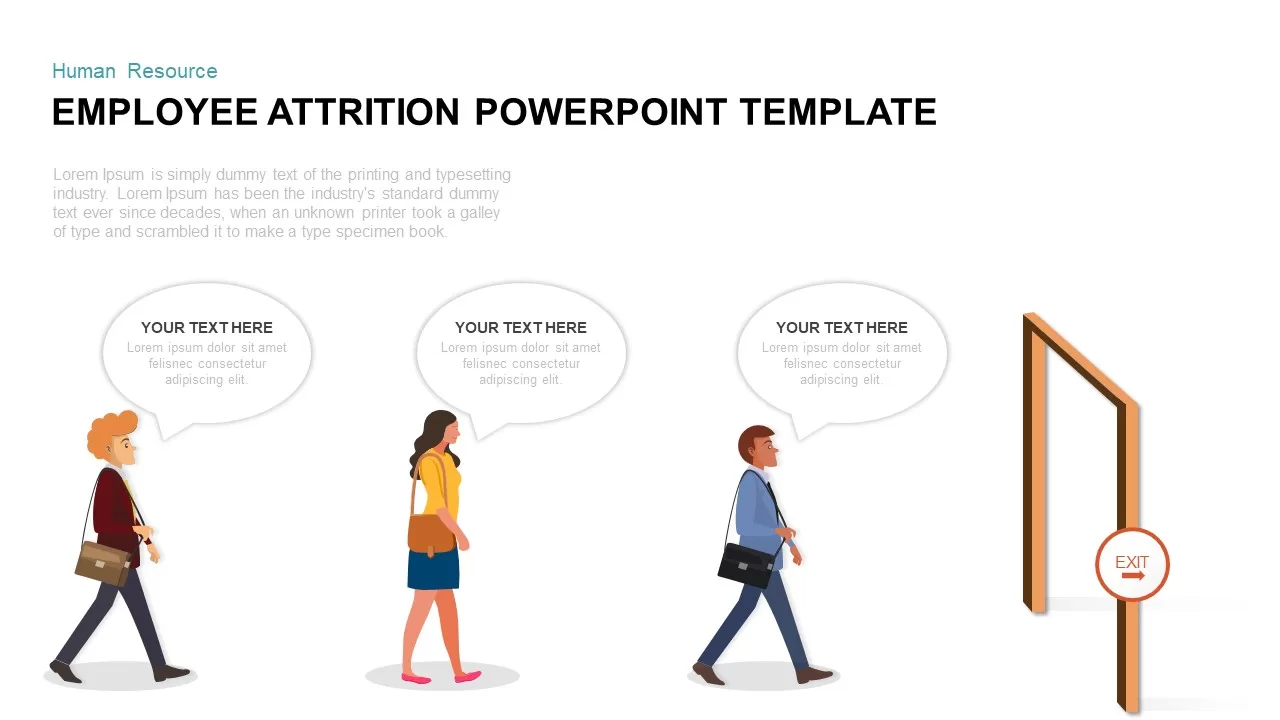
Employee Attrition Flow Template for PowerPoint & Google Slides
Recruitment
Six-Stage Circular Flow Diagram Template for PowerPoint & Google Slides
Circular
Financial Agreement Signing Flow Diagram Template for PowerPoint & Google Slides
Process
Business Process Management Flow Diagram Template for PowerPoint & Google Slides
Process
Colorful 8-Stage Droplet Process Flow Diagram Template for PowerPoint & Google Slides
Process
5-Step Circular Gradient Process Flow Template for PowerPoint & Google Slides
Process

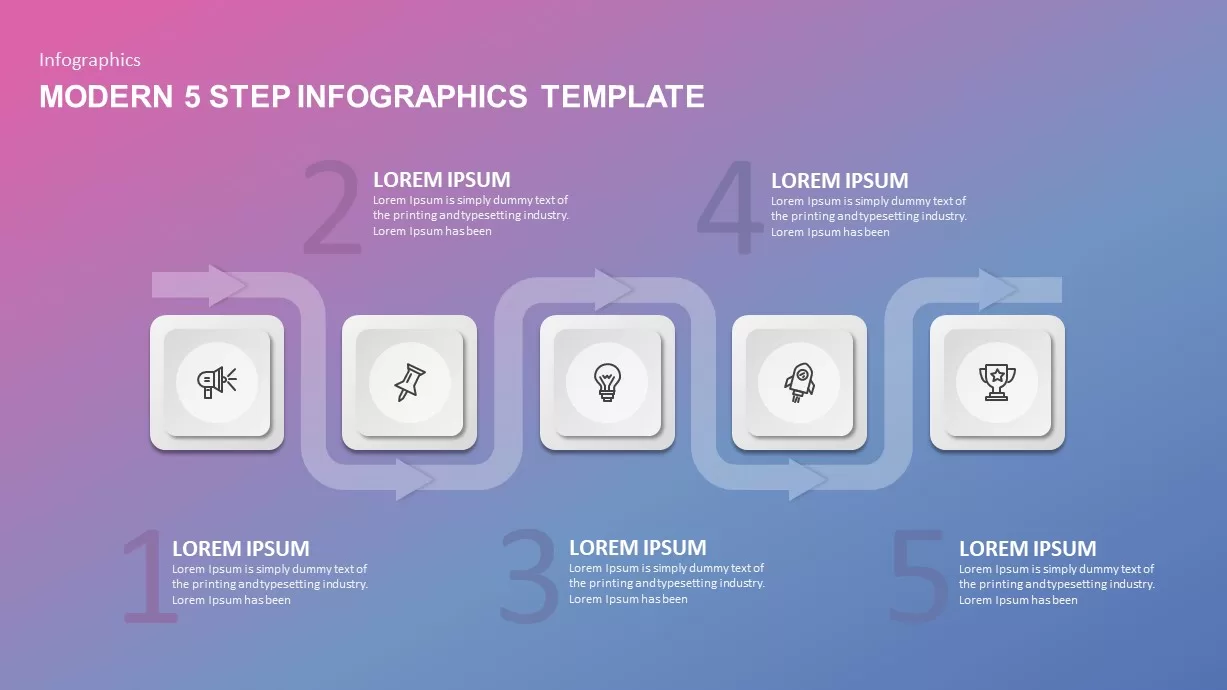
Modern 5-Step Flow Infographics Template for PowerPoint & Google Slides
Process
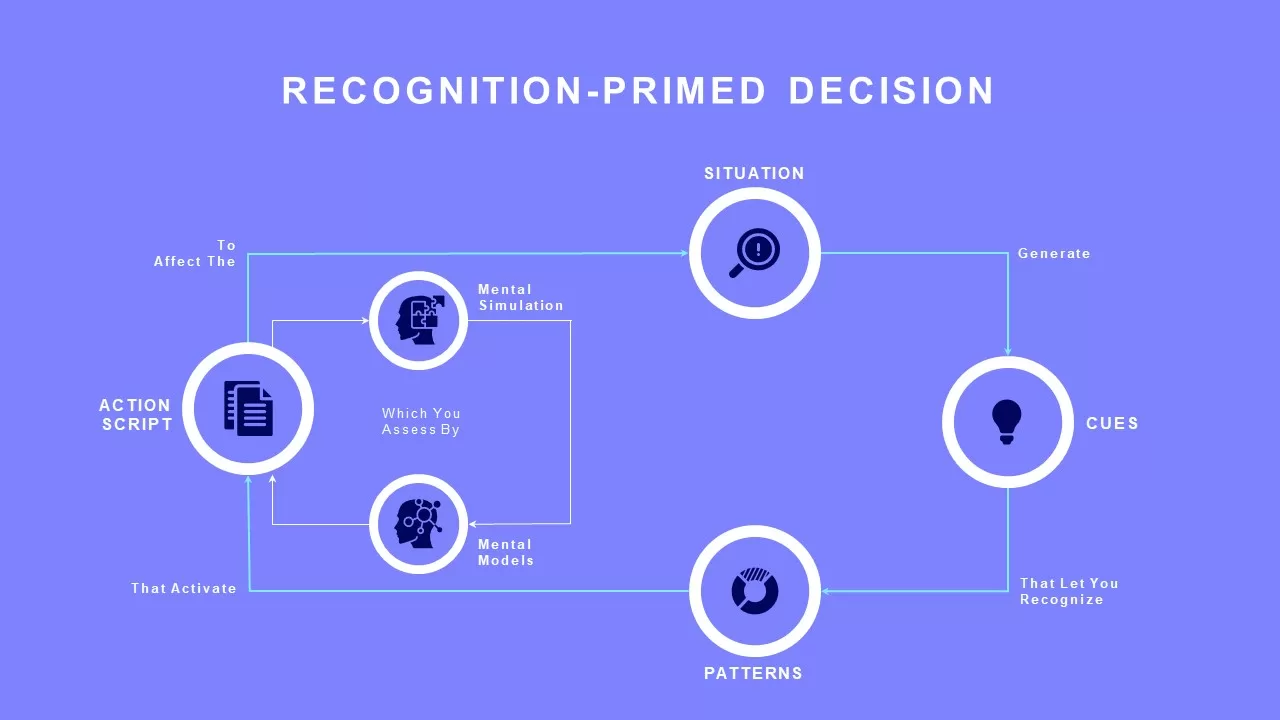
Recognition-Primed Decision Process Flow Template for PowerPoint & Google Slides
Flow Charts
Free Colorful Process Flow Infographics Template for PowerPoint & Google Slides
Process
Free
Process Flow Steps template for PowerPoint & Google Slides
Business Plan
Process Flow Template for PowerPoint & Google Slides
Process
4 stage Process Flow template for PowerPoint & Google Slides
Process
5 Stage Process Flow Overview template for PowerPoint & Google Slides
Process
Curved Arrow Process Flow Infographic Template for PowerPoint & Google Slides
Process
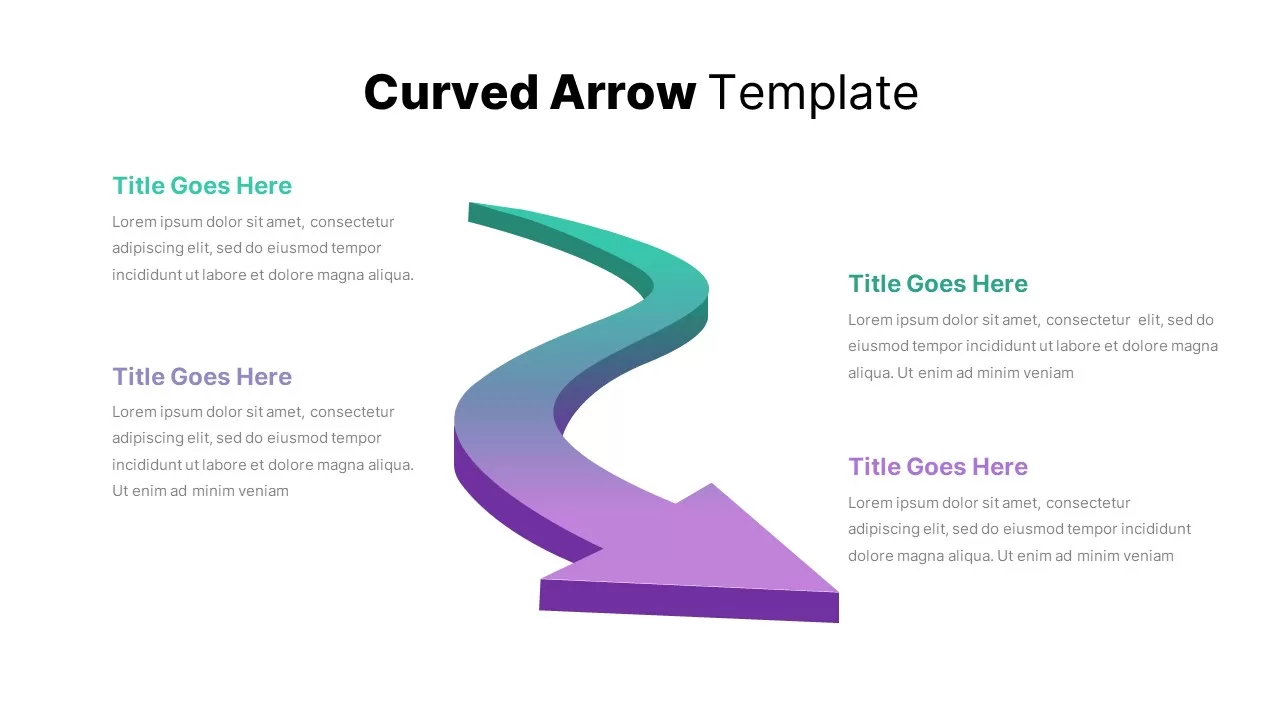
Curved Arrow Process Flow Diagram Template for PowerPoint & Google Slides
Process
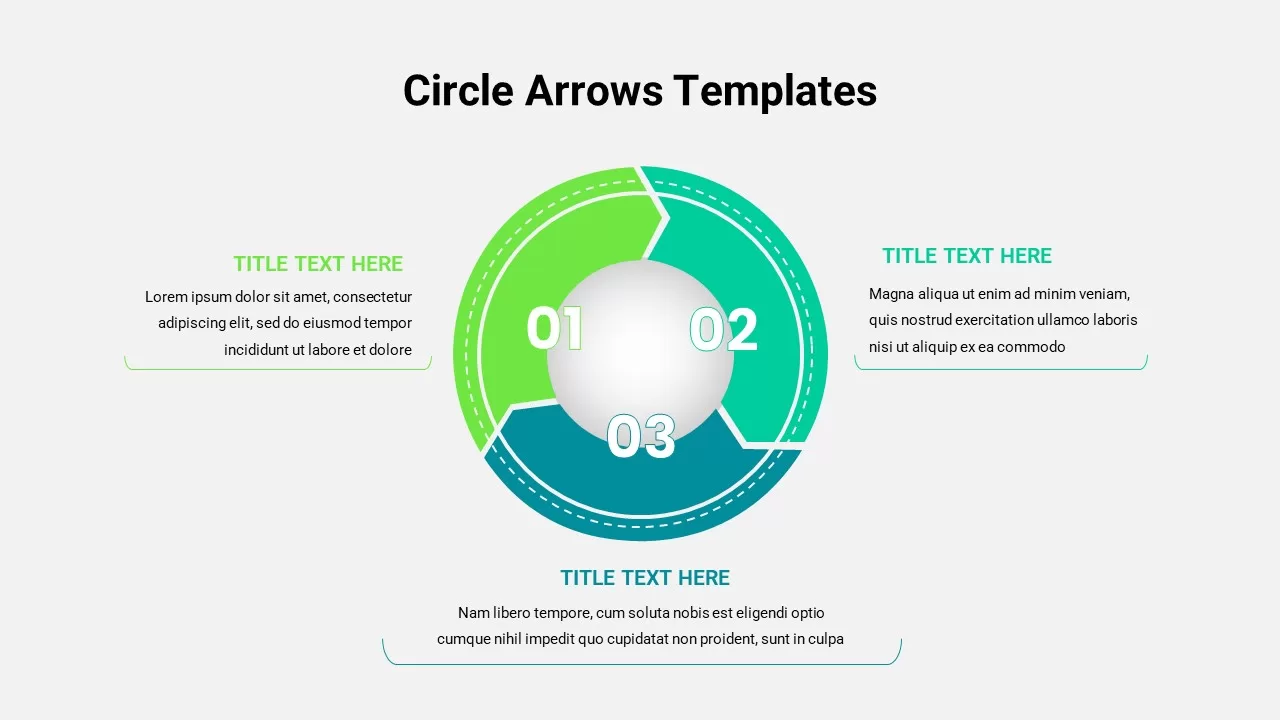
Circle Arrows Process Flow template for PowerPoint & Google Slides
Process
Curved Arrow Flow Diagram template for PowerPoint & Google Slides
Business
Curved Arrow Flow Template for PowerPoint & Google Slides
Process
Three-Step Wavy Arrow Flow Template for PowerPoint & Google Slides
Process
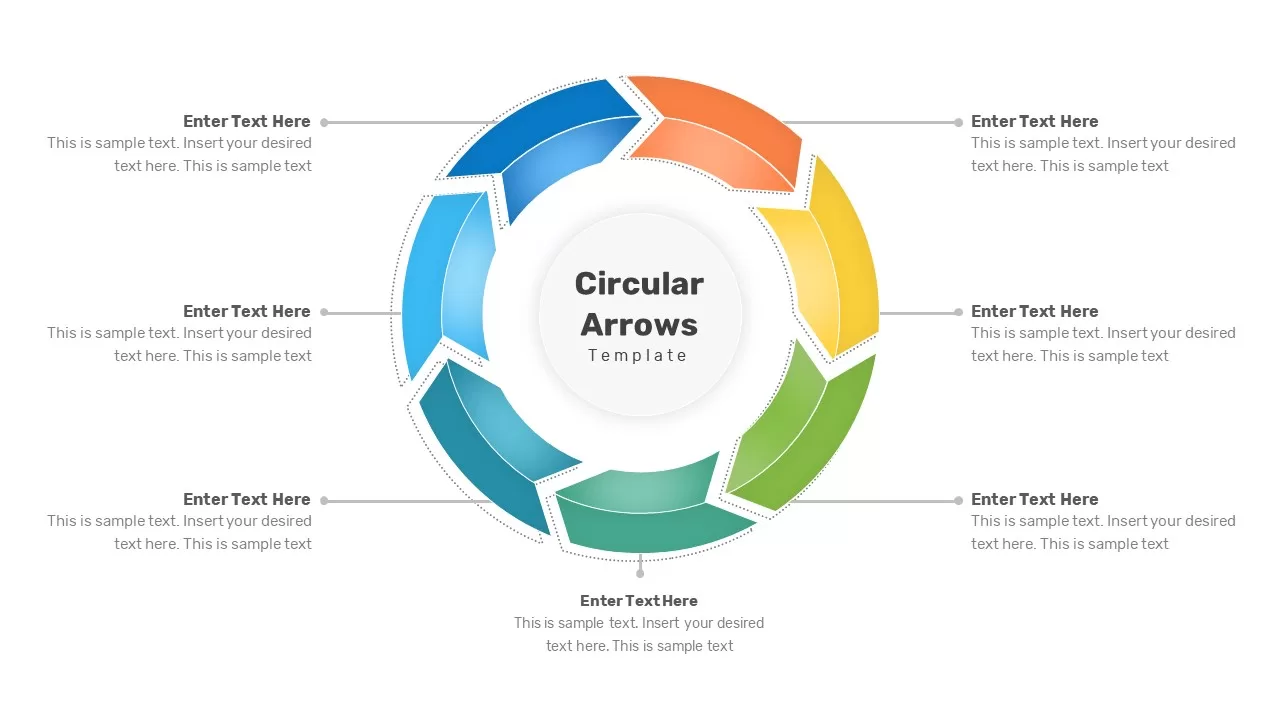
Circular Arrows Process Flow template for PowerPoint & Google Slides
Process
Circular Arrows Process Flow template for PowerPoint & Google Slides
Process
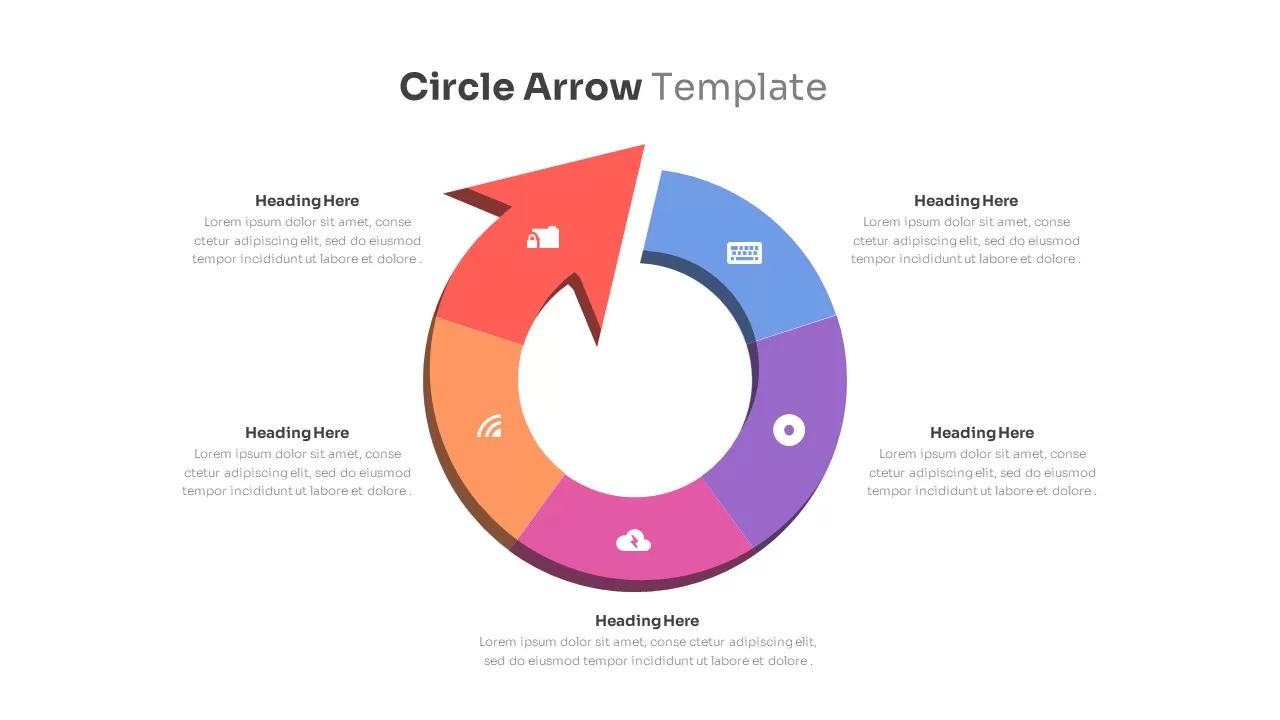
Circle Arrow Process Flow template for PowerPoint & Google Slides
Process
Animated Accordion Process Flow Template for PowerPoint & Google Slides
Process
Hexagonal Process Flow Template for PowerPoint & Google Slides
Process
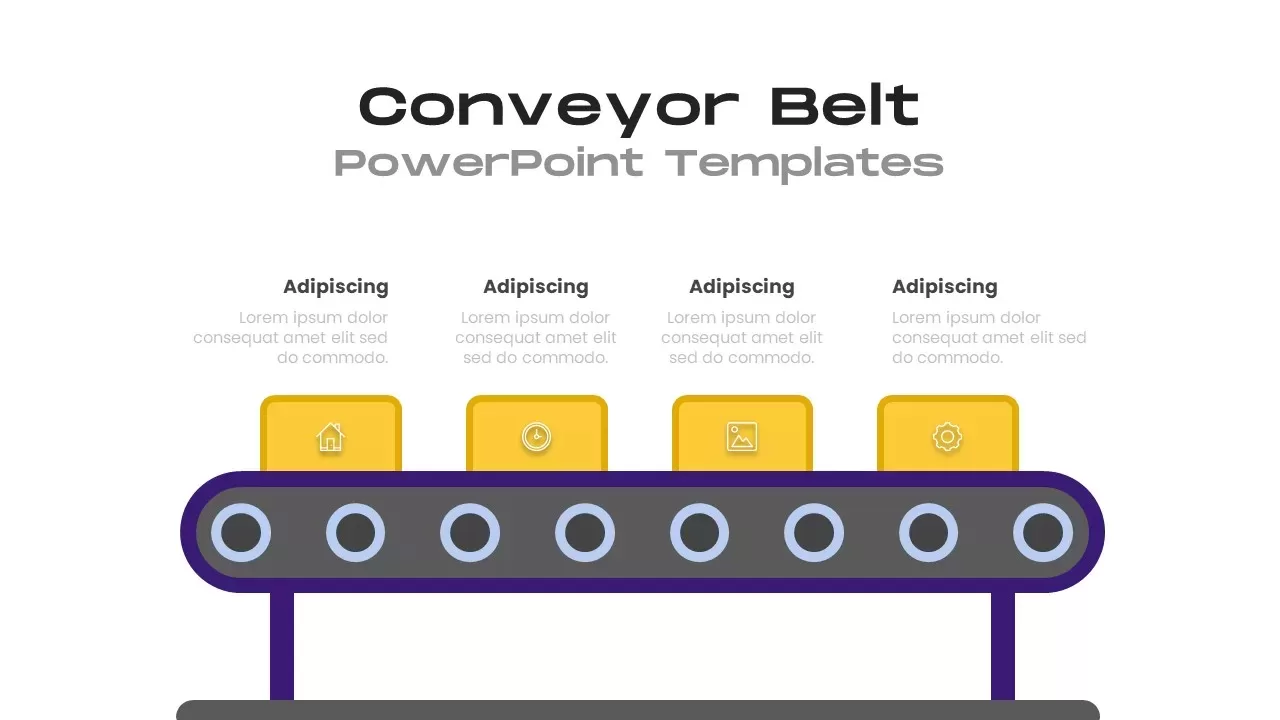
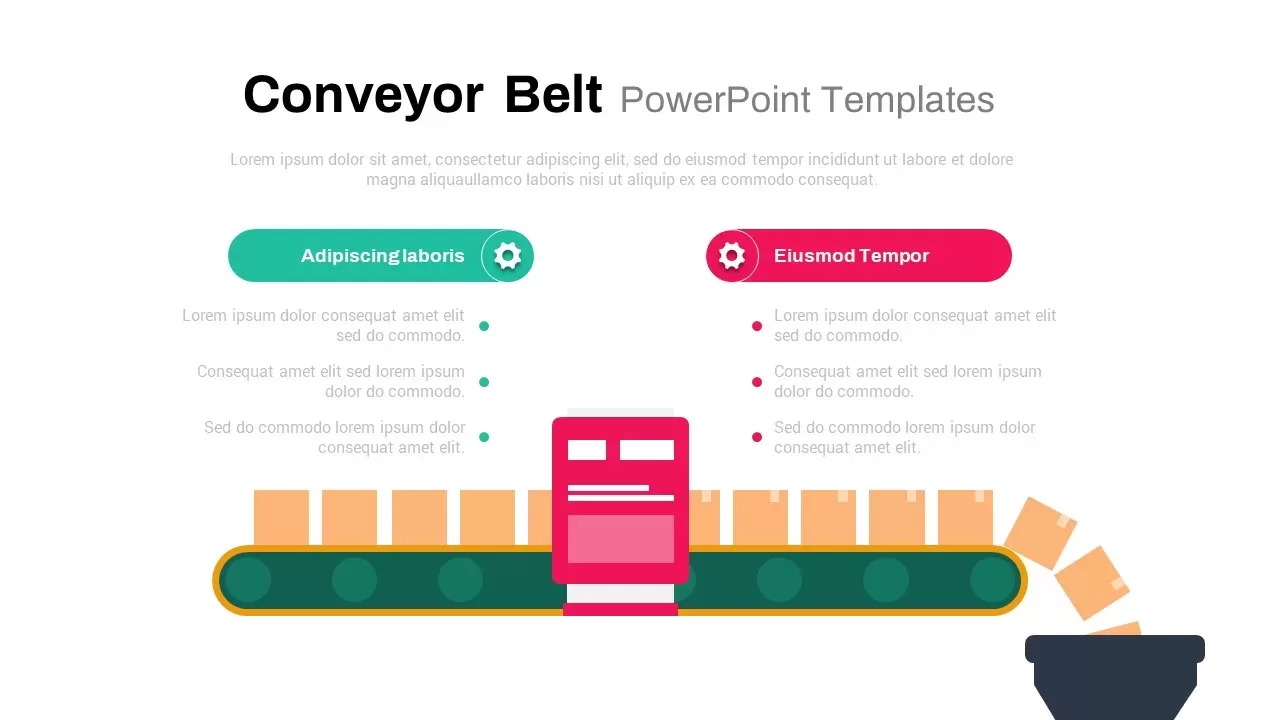
Conveyor Belt Sequential Process Flow Template for PowerPoint & Google Slides
Process
Dynamic Conveyor Belt Process Flow Template for PowerPoint & Google Slides
Process
3D Conveyor Belt Process Flow Diagram Template for PowerPoint & Google Slides
Process
E-Waste Management Process Flow Diagram Template for PowerPoint & Google Slides
Process
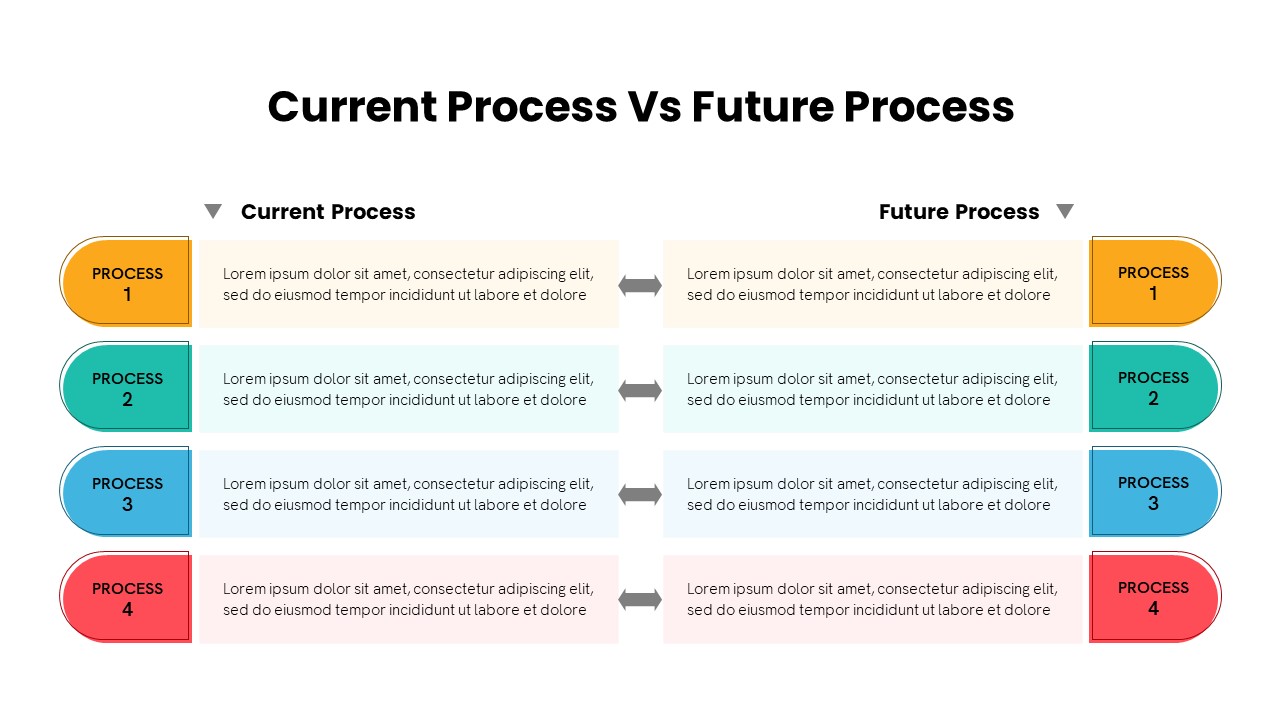
Current vs Future Process Flow Template for PowerPoint & Google Slides
Comparison

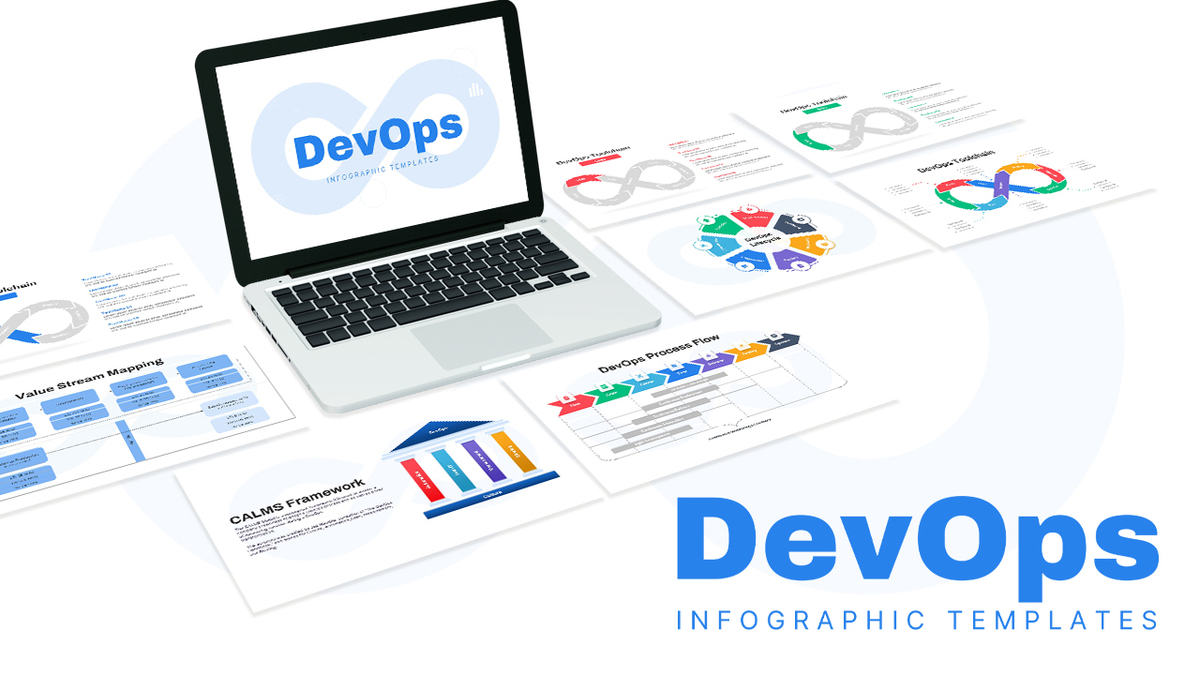
DevOps Infographics & Process Flow Template for PowerPoint & Google Slides
Information Technology
Comprehensive Process Flow Diagram Template for PowerPoint & Google Slides
Process
Animated Gears Process Flow Diagram Template for PowerPoint & Google Slides
Process
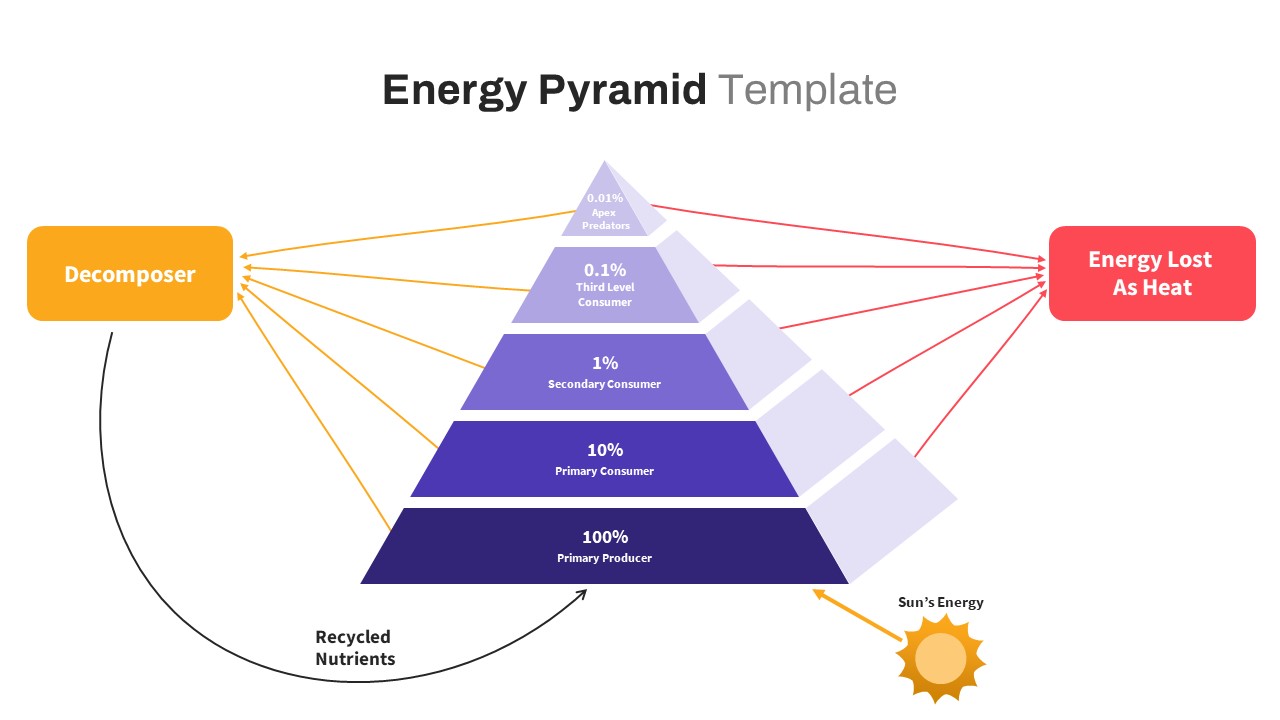
Free Ecological Energy Flow Pyramid Template for PowerPoint & Google Slides
Pyramid
Free
Advanced Data Flow Diagram Pack Template for PowerPoint & Google Slides
Flow Charts
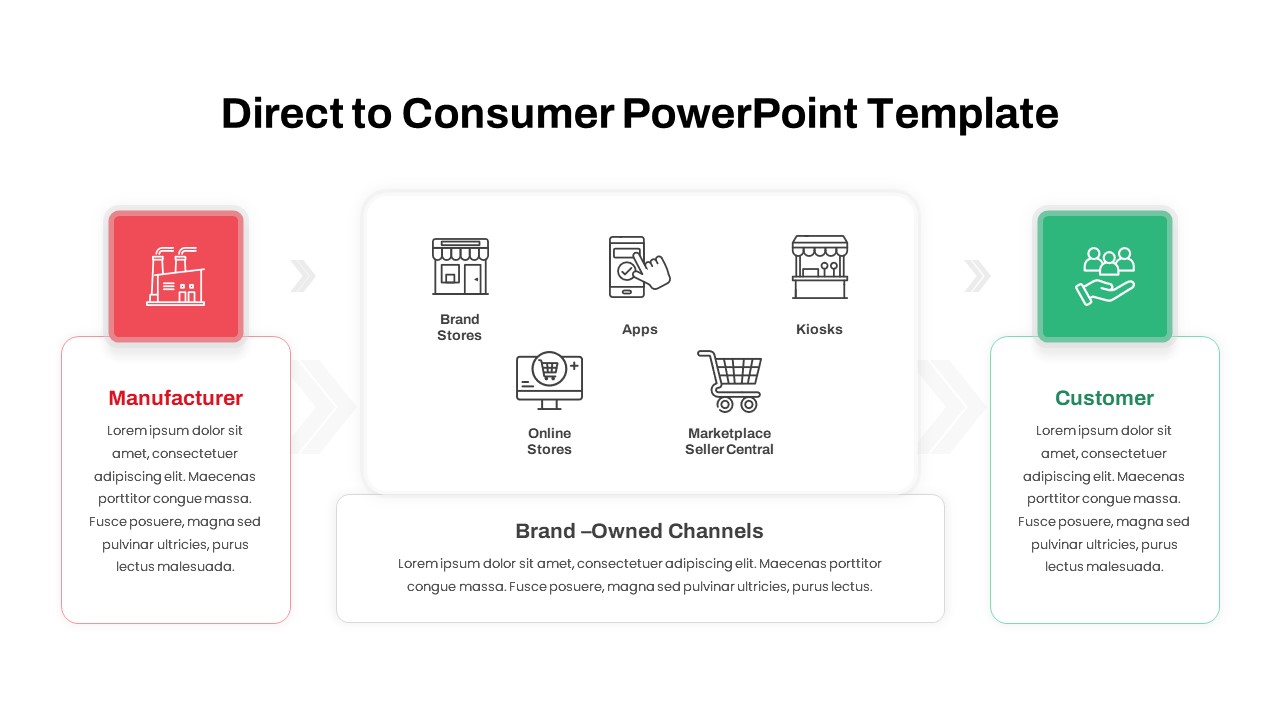
Direct to Consumer Brand Channels Flow Template for PowerPoint & Google Slides
Business Models
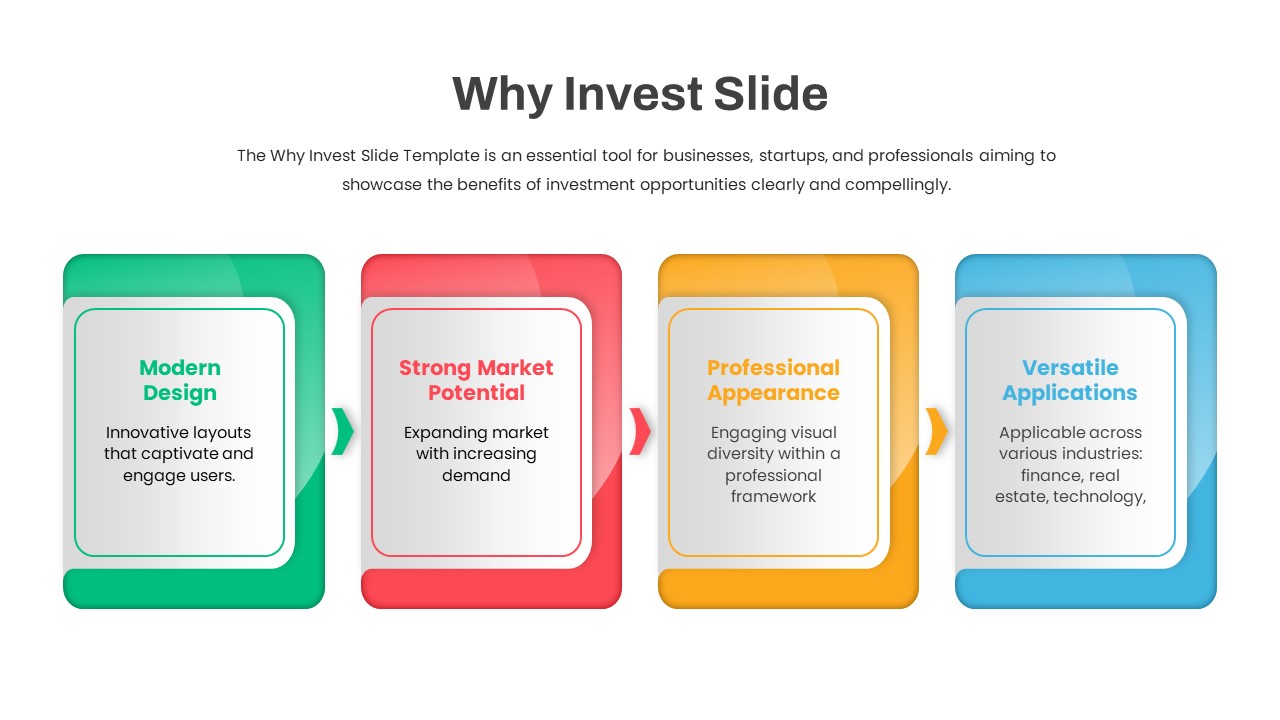
Why Invest Slide Four-Step Benefits Flow Template for PowerPoint & Google Slides
Business Plan
Chevron Process Flow Sequence Slide Template for PowerPoint & Google Slides
Arrow
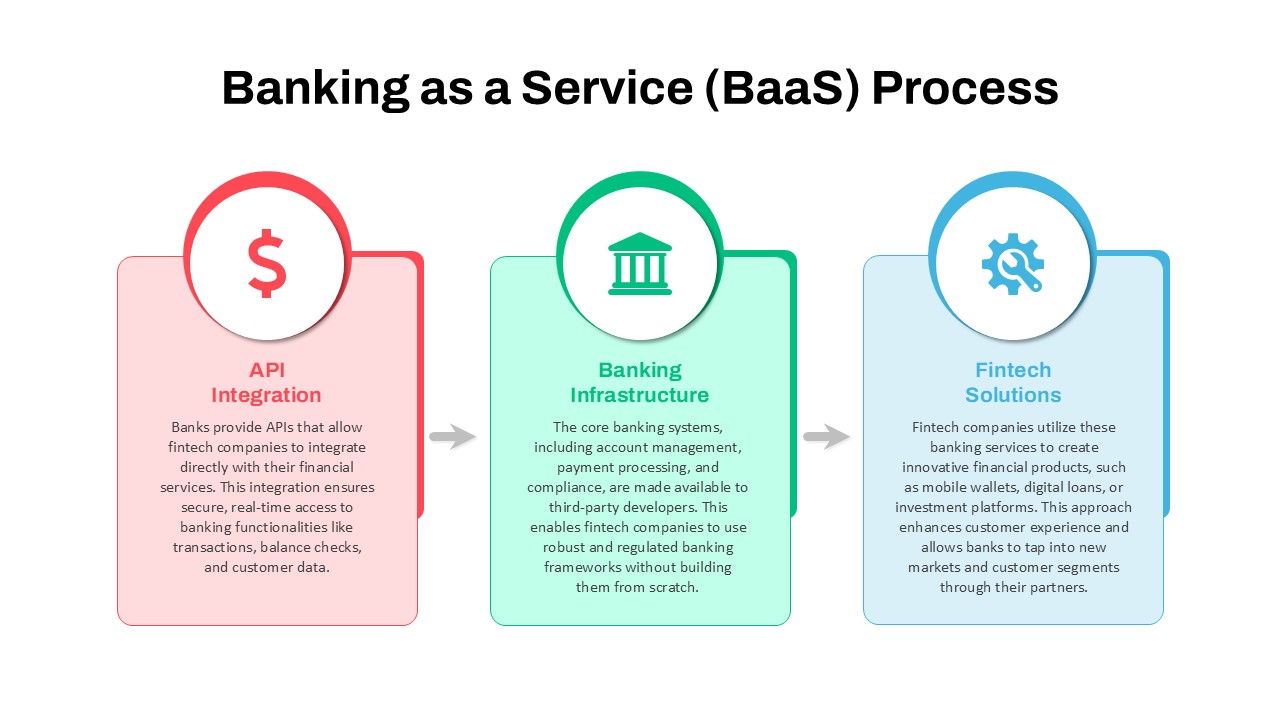
Banking as a Service (BaaS) Process Flow Template for PowerPoint & Google Slides
Process
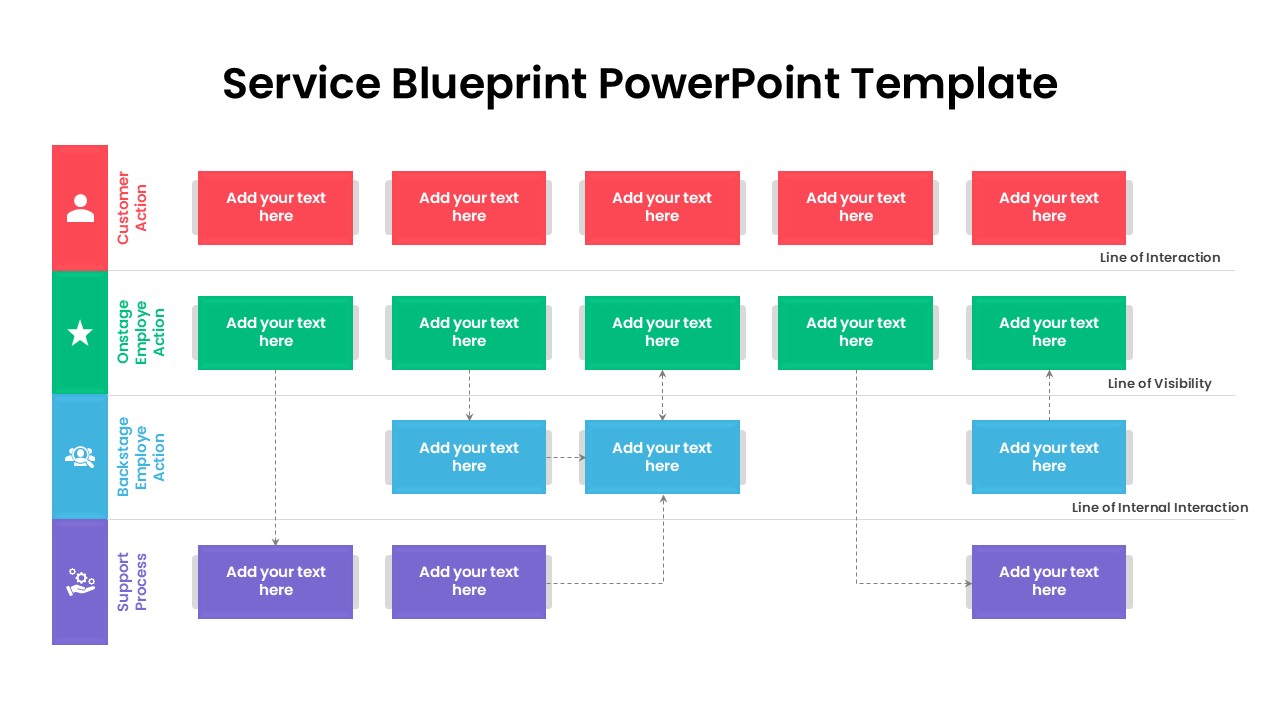
Service Blueprint Process Flow Template for PowerPoint & Google Slides
Process
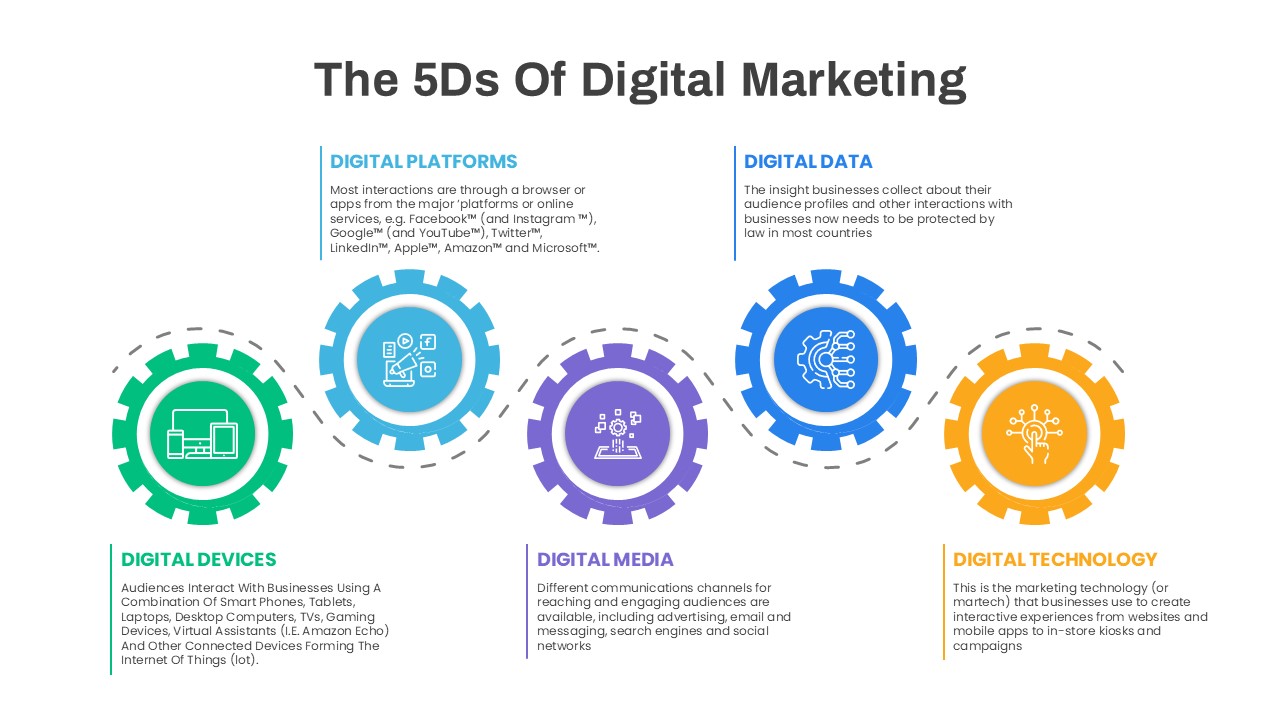
5D Digital Marketing Flow Diagram Template for PowerPoint & Google Slides
Digital Marketing
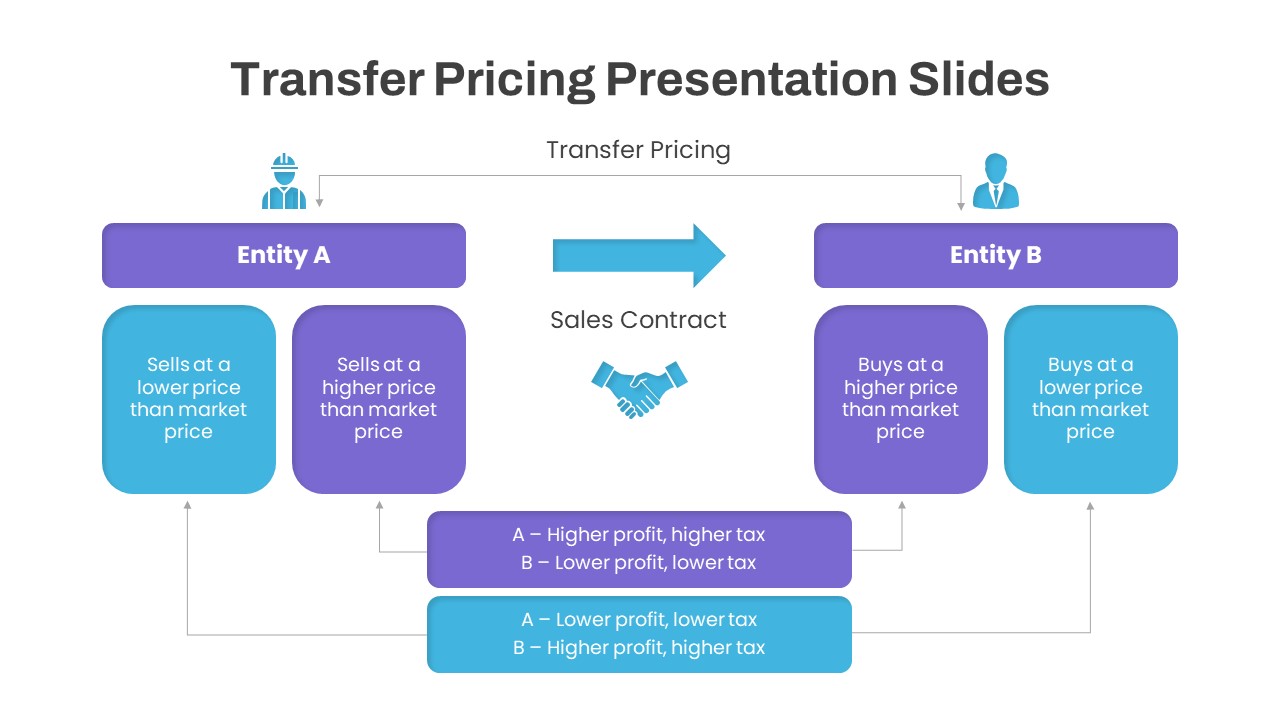
Dynamic Transfer Pricing Flow Diagram Template for PowerPoint & Google Slides
Finance
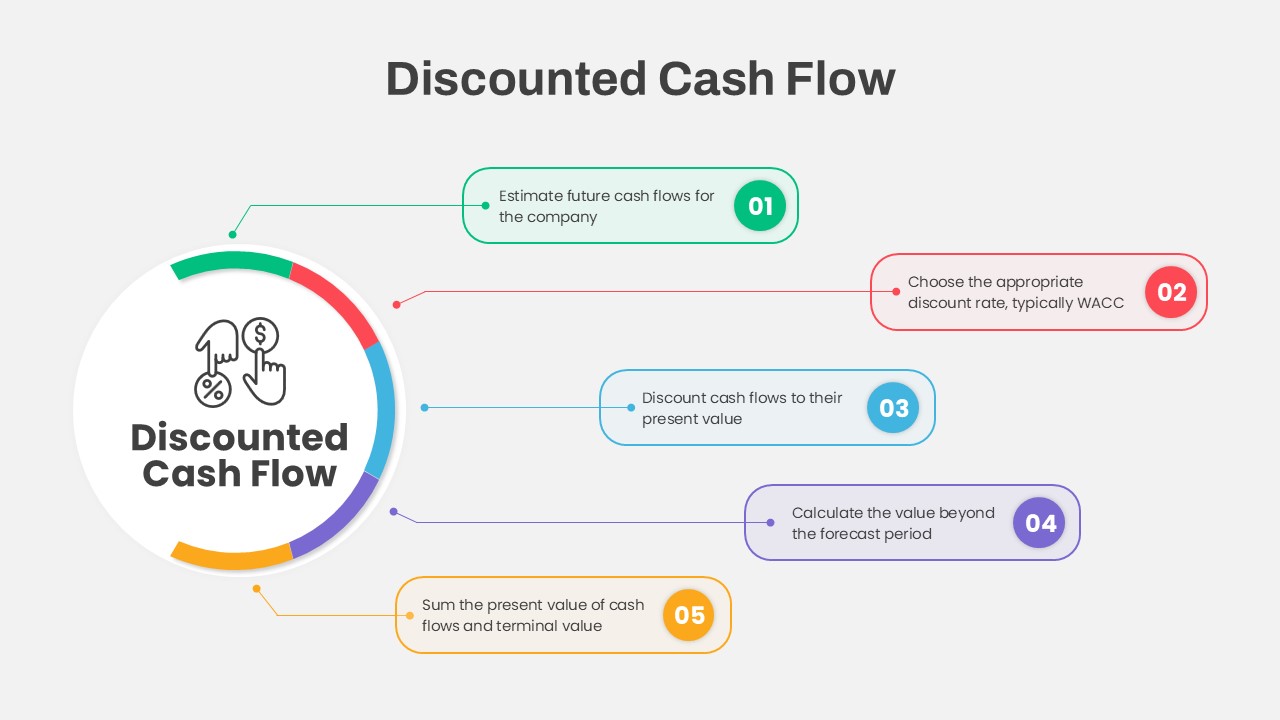
Discounted Cash Flow Five-Step Process Template for PowerPoint & Google Slides
Process
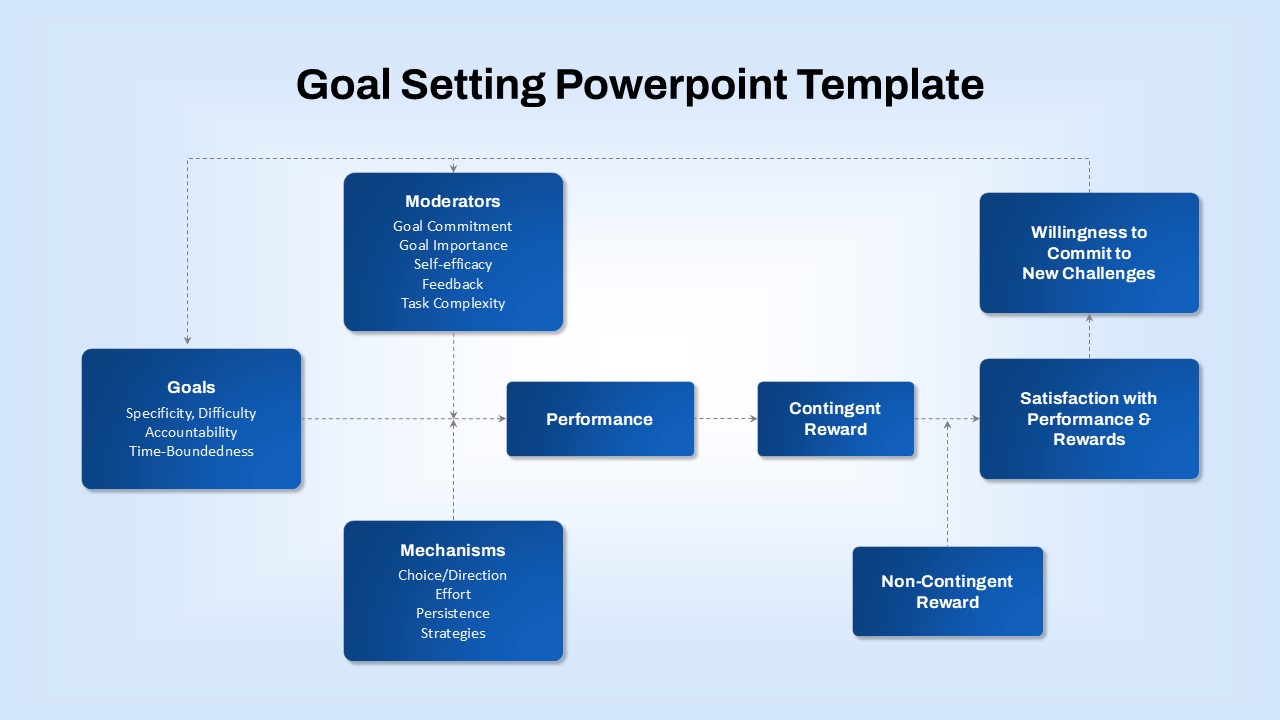
Goal-Setting Process Flow Diagram Template for PowerPoint & Google Slides
Goals
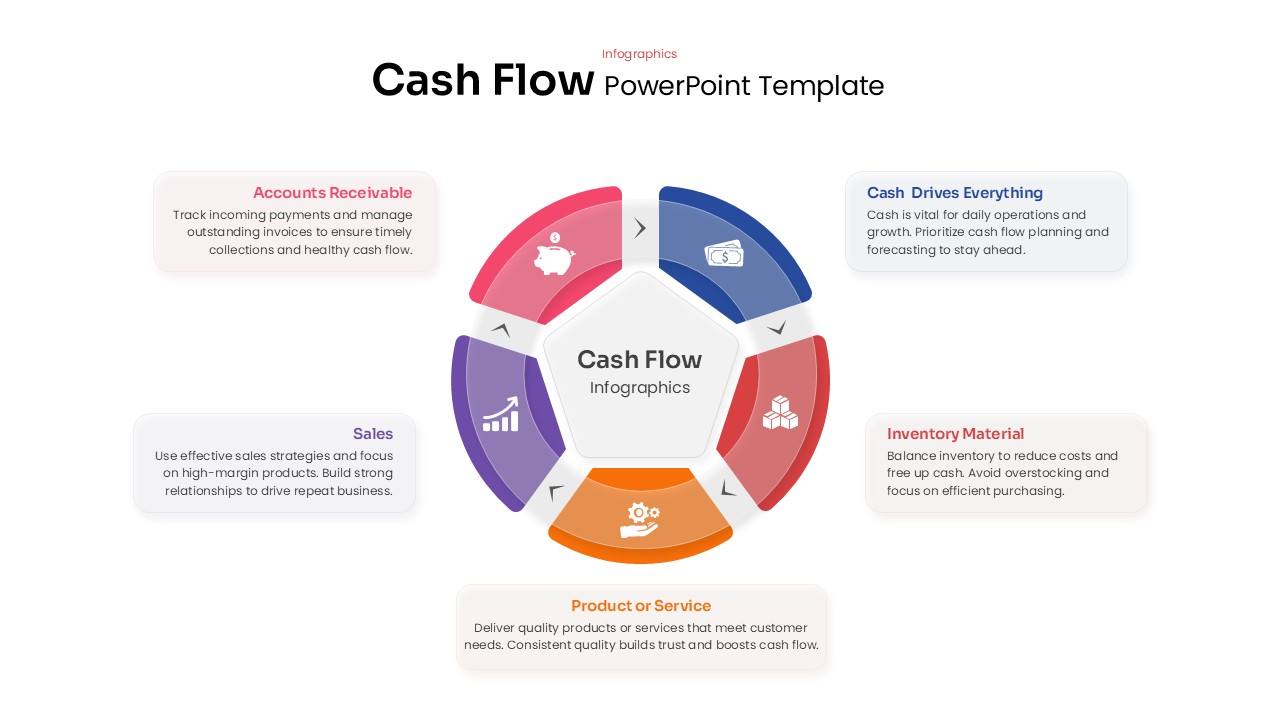
Cash Flow Infographics template for PowerPoint & Google Slides
Business
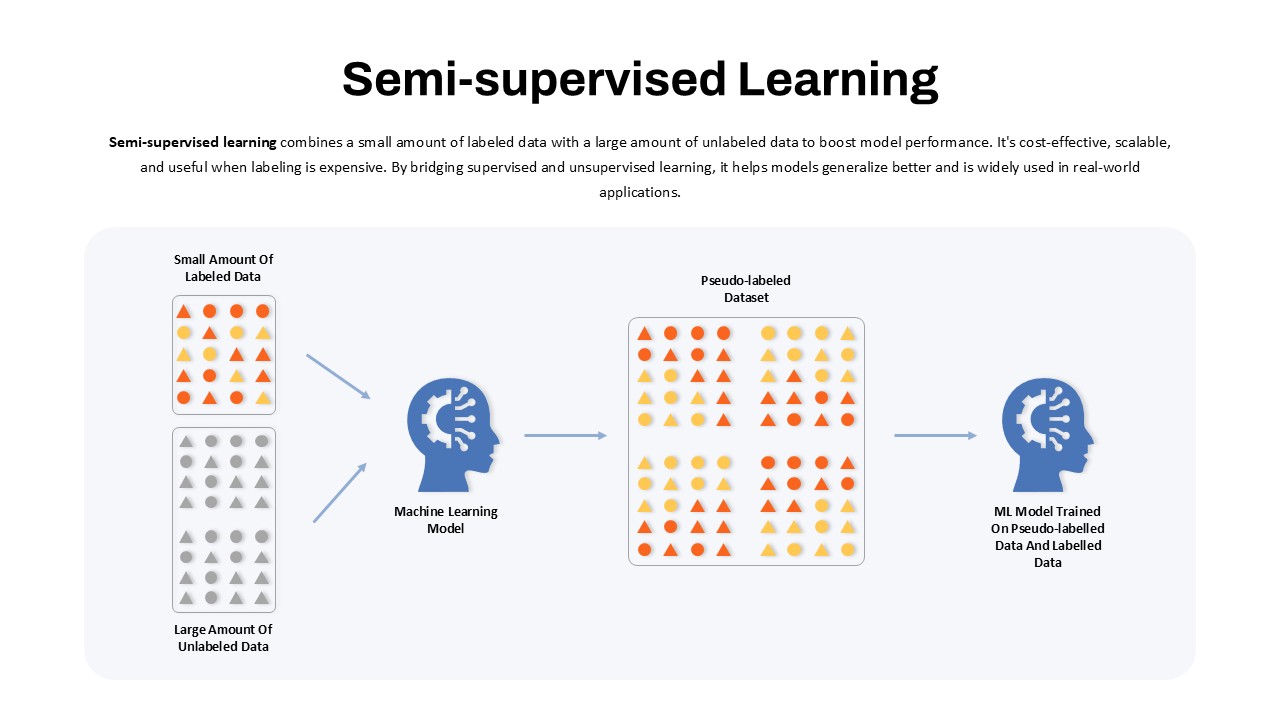
Semi-Supervised Learning Flow Diagram Template for PowerPoint & Google Slides
Machine Learning
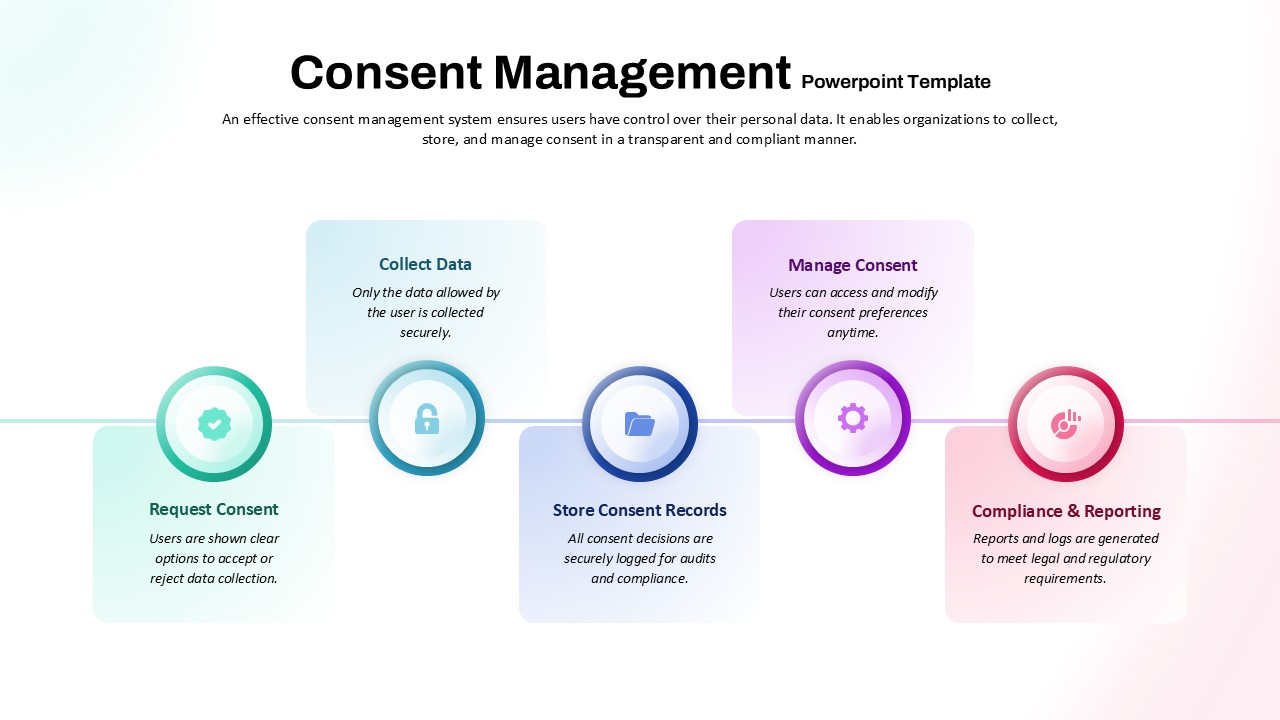
Consent Management System Process Flow Template for PowerPoint & Google Slides
Process
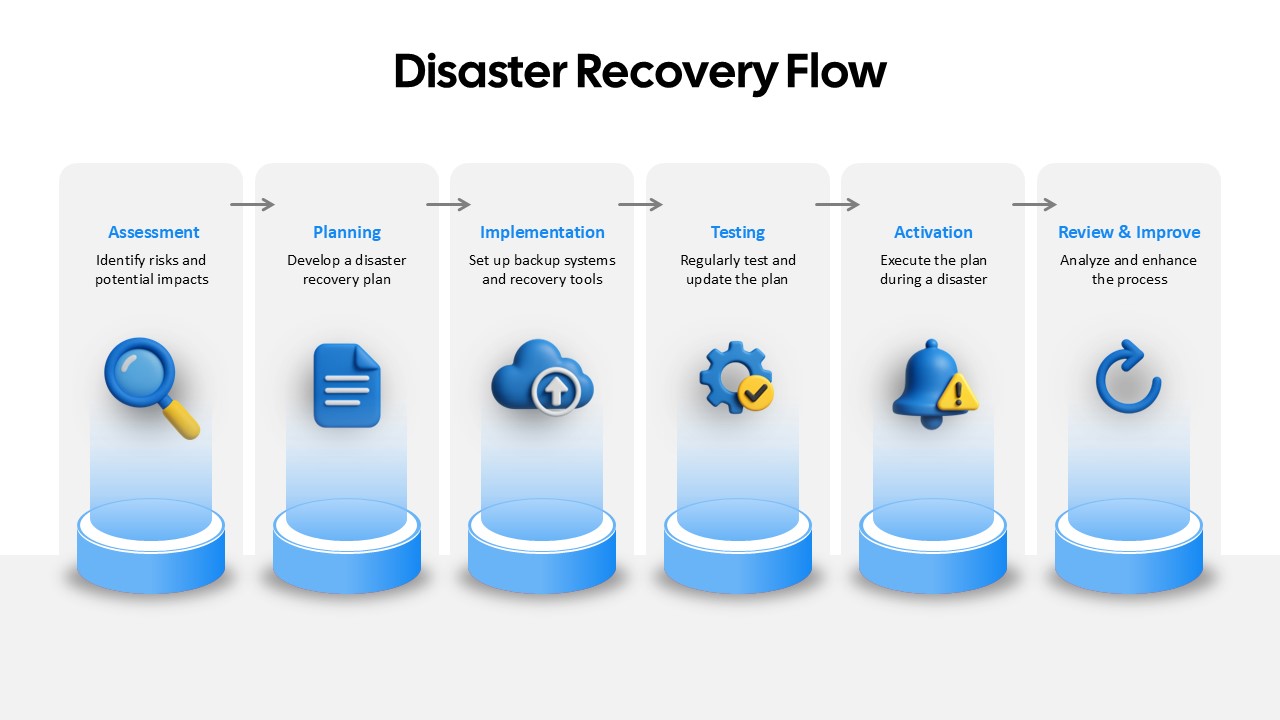
Disaster Recovery Flow Diagram Template for PowerPoint & Google Slides
Process
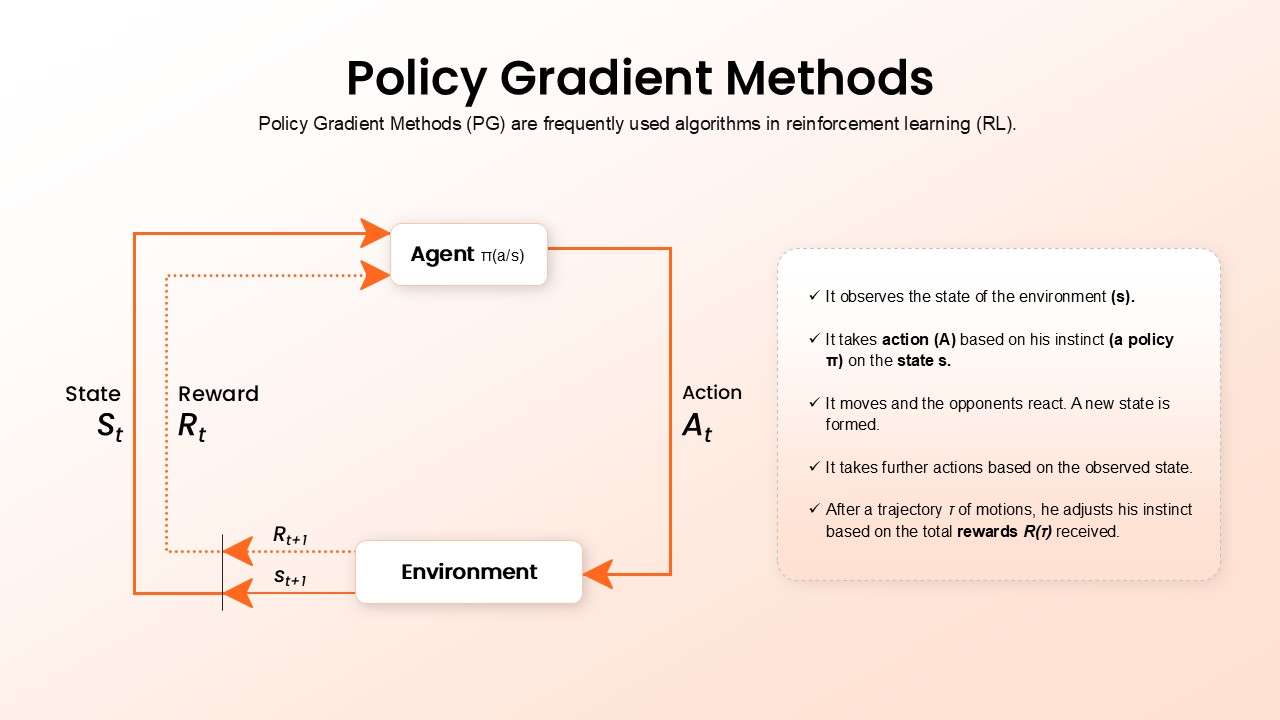
Policy Gradient Methods Flow Diagram Template for PowerPoint & Google Slides
AI
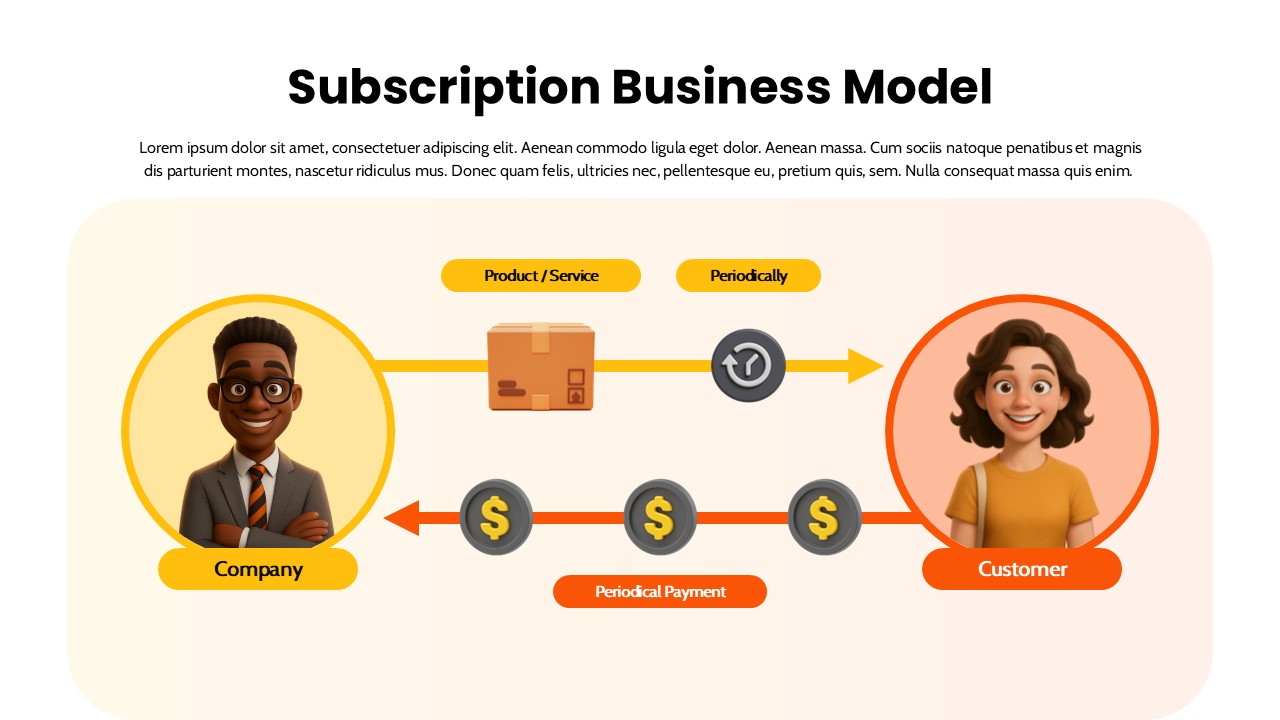
Subscription Business Model Flow Diagram Template for PowerPoint & Google Slides
Business Models
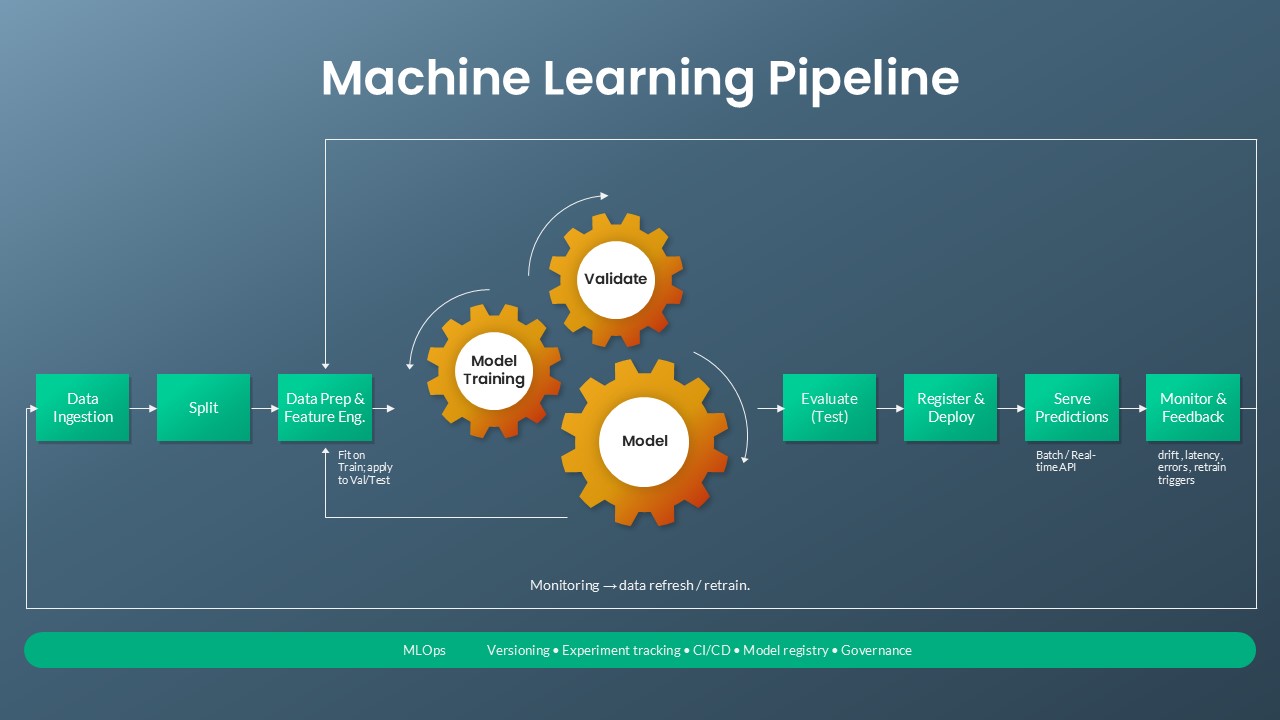
Machine Learning Pipeline & MLOps Flow Template for PowerPoint & Google Slides
Machine Learning
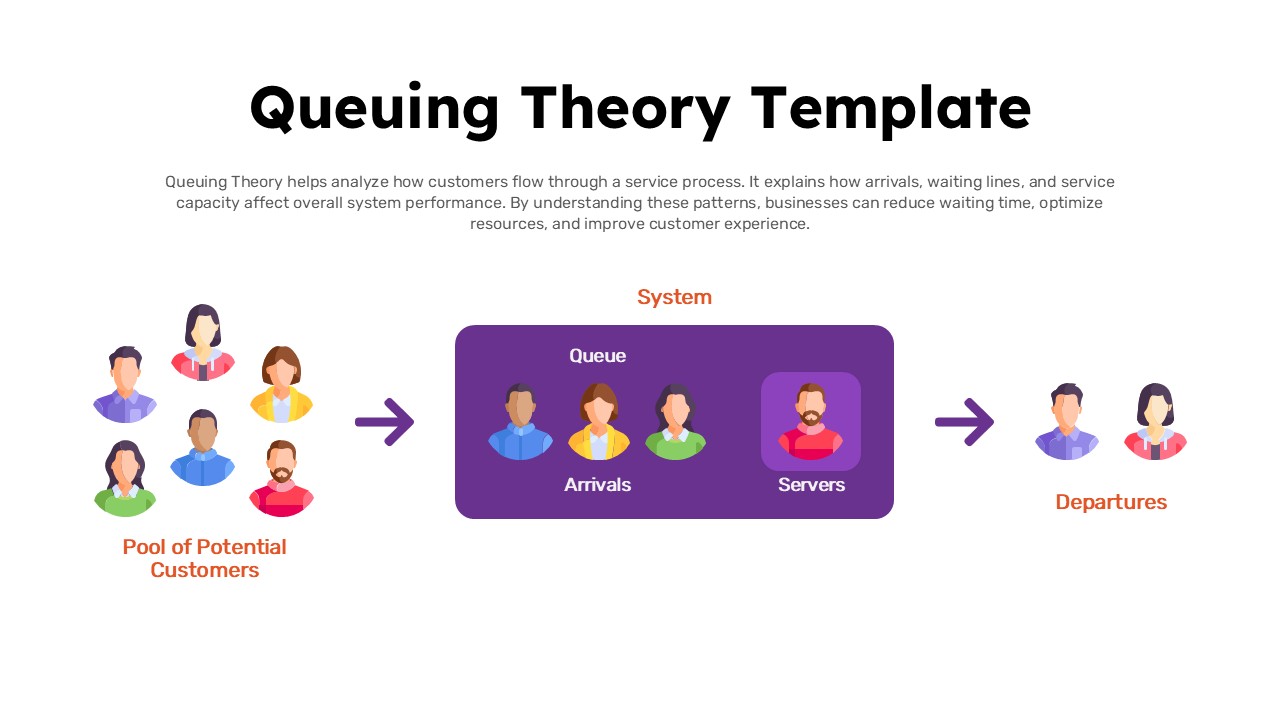
Queuing Theory System Flow Diagram Template for PowerPoint & Google Slides
Process