Annual Recurring Revenue Metrics Template for PowerPoint & Google Slides

Description
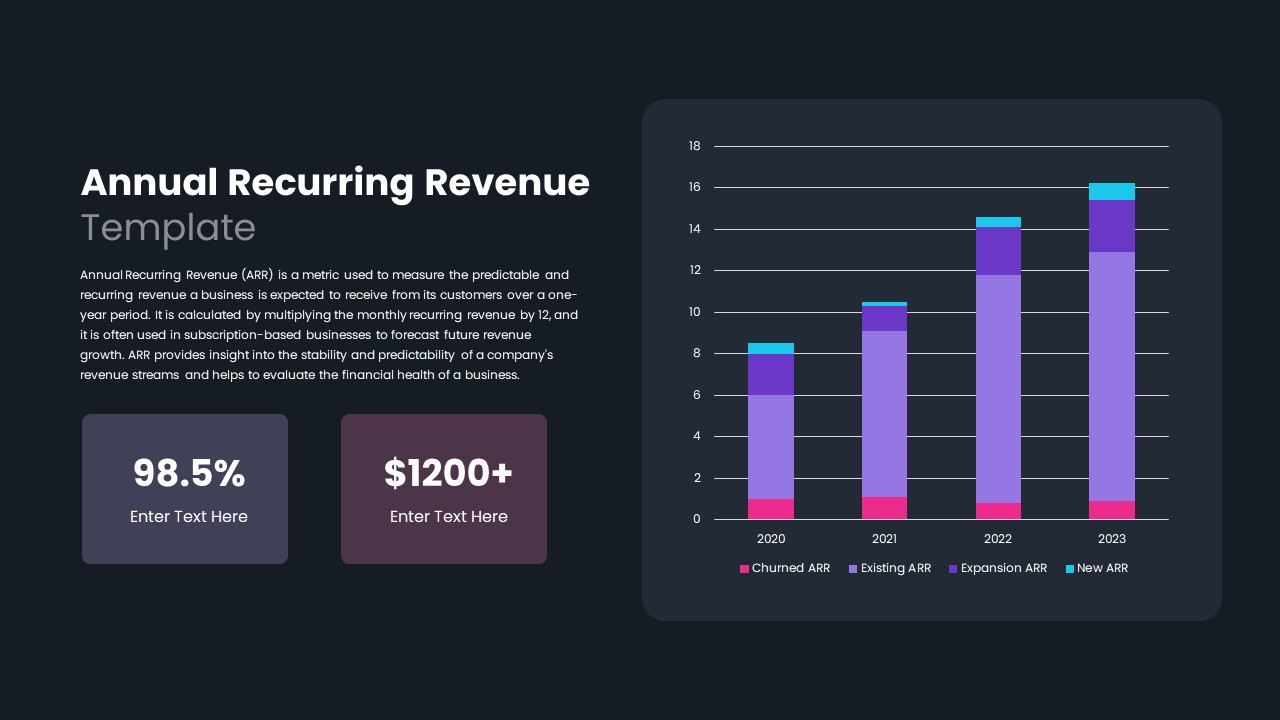
This annual recurring revenue slide template combines a clear title area and contextual paragraph on the left with an eye-capturing stacked bar chart on the right. The balanced two-column composition guides viewers from explanatory text into quantitative insights seamlessly. A bold heading introduces the ARR concept, followed by a concise definition of ARR’s calculation and importance for subscription-based business forecasting.
Directly beneath the descriptive block, two colored metric cards emphasize key performance indicators (KPIs). Each card uses pastel background shades—lavender for retention rates and pink for average revenue per user—to highlight critical figures alongside space for custom captions. Distinct typography hierarchy ensures numbers stand out, while supportive text placeholders allow instant modification of metric titles.
Occupying the right half of the slide, the stacked bar chart displays churned, existing, expansion, and new ARR segments across four annual intervals (2020–2023). Each segment features a unique accent color, and a clean legend at the bottom clarifies segment categories. Gridlines and axis labels maintain readability, while a subtle shadow-rounded container lends a modern aesthetic. Presenters can easily swap data values, adjust colors, or update legends through editable chart elements.
Built on PowerPoint and Google Slides master layouts, every element is vector-based and fully customizable. Seamless placeholder replacement, font adjustments, and color palette swaps keep branding consistent. Use this template for boardroom reports, investor updates, or financial planning sessions where clear, data-driven storytelling is essential.
The slide supports both narrative and data-centric presentations. Animatable elements and layered groupings enable smooth transitions and dynamic charts. Whether for internal stakeholders or external investors, you can deliver compelling financial overviews with confidence.
Who is it for
Financial analysts, subscription business managers, and SaaS executives responsible for forecasting, investor relations, and performance reporting. Ideal for revenue operations teams, CFO presentations, and boardroom quarterly reviews.
Other Uses
Also suited for subscription business audits, customer success metrics breakdowns, retention analysis workshops, or annual financial retrospectives. Customize the chart for sales pipeline reports or multi-year performance dashboards.
Login to download this file

Item ID
SB03350
Related Templates

Monthly Recurring Revenue KPI Bar Chart Template for PowerPoint & Google Slides
Bar/Column
iPad App Mockup with Progress Metrics Template for PowerPoint & Google Slides
Bar/Column
Asia Map with KPI Metrics and Legend Template for PowerPoint & Google Slides
World Maps
Bubble Head Metrics Infographic Template for PowerPoint & Google Slides
Circular
Circle Segment Sales Metrics Infographic Template for PowerPoint & Google Slides
Circular
Social Media Metrics template for PowerPoint & Google Slides
Comparison Chart
Mobile Usage Metrics template for PowerPoint & Google Slides
Comparison Chart

Scale Metaphor Metrics Comparison Template for PowerPoint & Google Slides
Charts
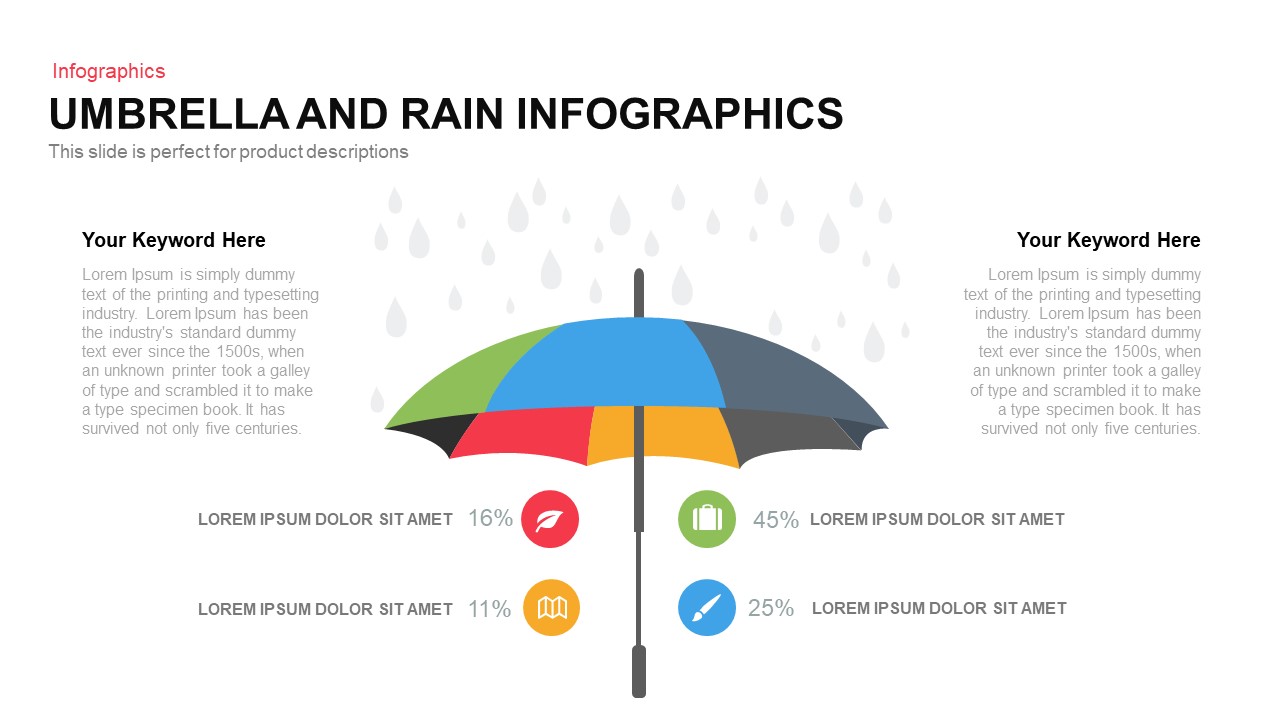
Umbrella and Rain Infographic Metrics Template for PowerPoint & Google Slides
Comparison
Comprehensive Recruitment Metrics Report Template for PowerPoint & Google Slides
Recruitment
Colorful Block Infographic Metrics Slide Template for PowerPoint & Google Slides
Infographics
Benchmarking Metrics Comparison Slide Template for PowerPoint & Google Slides
Pie/Donut
Project Status Dashboard with Metrics Template for PowerPoint & Google Slides
Project Status
Circular Image Gallery & KPI Metrics Template for PowerPoint & Google Slides
Pie/Donut
Statistics & Global Metrics Infographic Template for PowerPoint & Google Slides
Bar/Column
Agriculture Infographics Slide with Progress Rings & Metrics Template for PowerPoint & Google Slides
Pie/Donut
Social Media Analysis Metrics Slide Deck Template for PowerPoint & Google Slides
Digital Marketing
LinkedIn Metrics Infographic Slide Template for PowerPoint & Google Slides
Digital Marketing
Facebook Social Metrics Infographic Template for PowerPoint & Google Slides
Graphics
Instagram Infographic Metrics Slide Template for PowerPoint & Google Slides
Marketing
Mastodon Metrics Infographic Dashboard Template for PowerPoint & Google Slides
Business Report
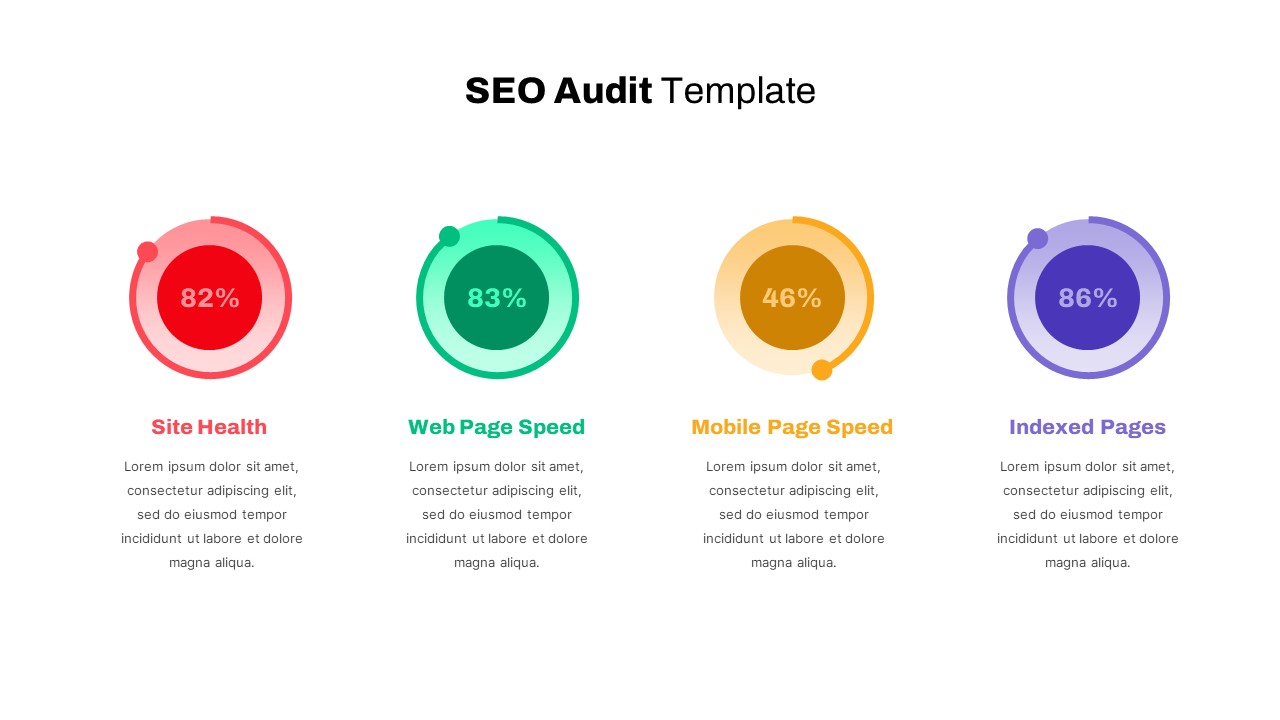
Detailed SEO Audit Metrics Overview Template for PowerPoint & Google Slides
Circular
Free Editable U.S. Map with Regional Metrics Template for PowerPoint & Google Slides
World Maps
Free
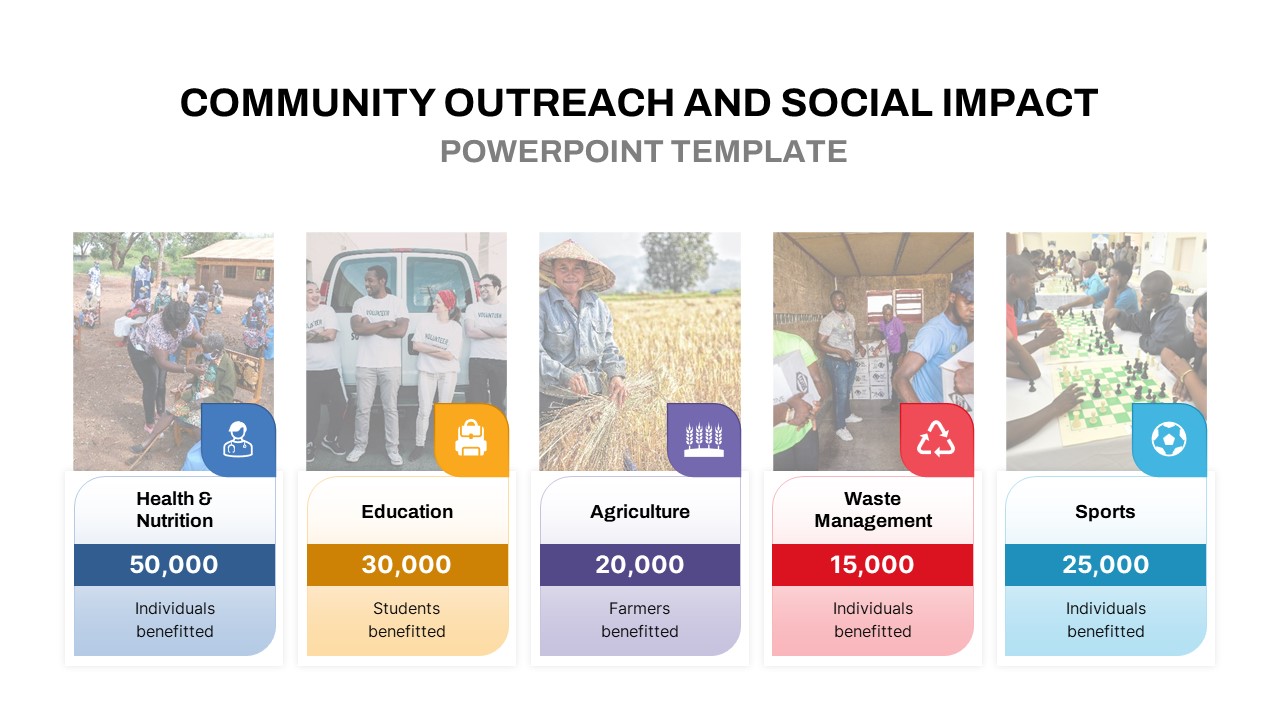
Community Outreach Impact Metrics Template for PowerPoint & Google Slides
Accomplishment
DevOps KPI Dashboard Performance Metrics Template for PowerPoint & Google Slides
Software Development
Purchasing KPI Metrics Dashboard Template for PowerPoint & Google Slides
Business Report
Financial Snapshot & Metrics Overview Template for PowerPoint & Google Slides
Finance
Procurement KPI Dashboard & Metrics Template for PowerPoint & Google Slides
Business Report
Market Validation Metrics Overview Template for PowerPoint & Google Slides
Business
Employee Performance Metrics Dashboard Template for PowerPoint & Google Slides
Employee Performance
Pirate Metrics AARRR Funnel Framework Template for PowerPoint & Google Slides
Funnel
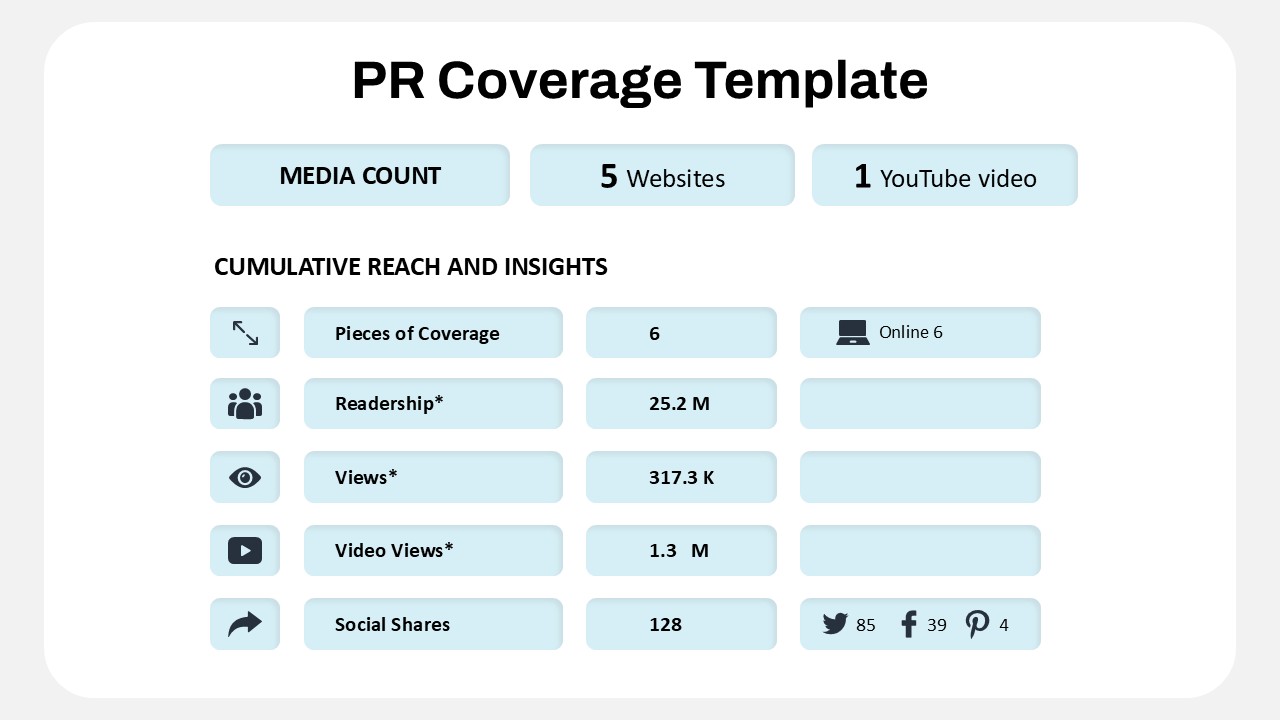
Public Relations Coverage Metrics Template for PowerPoint & Google Slides
Business Report
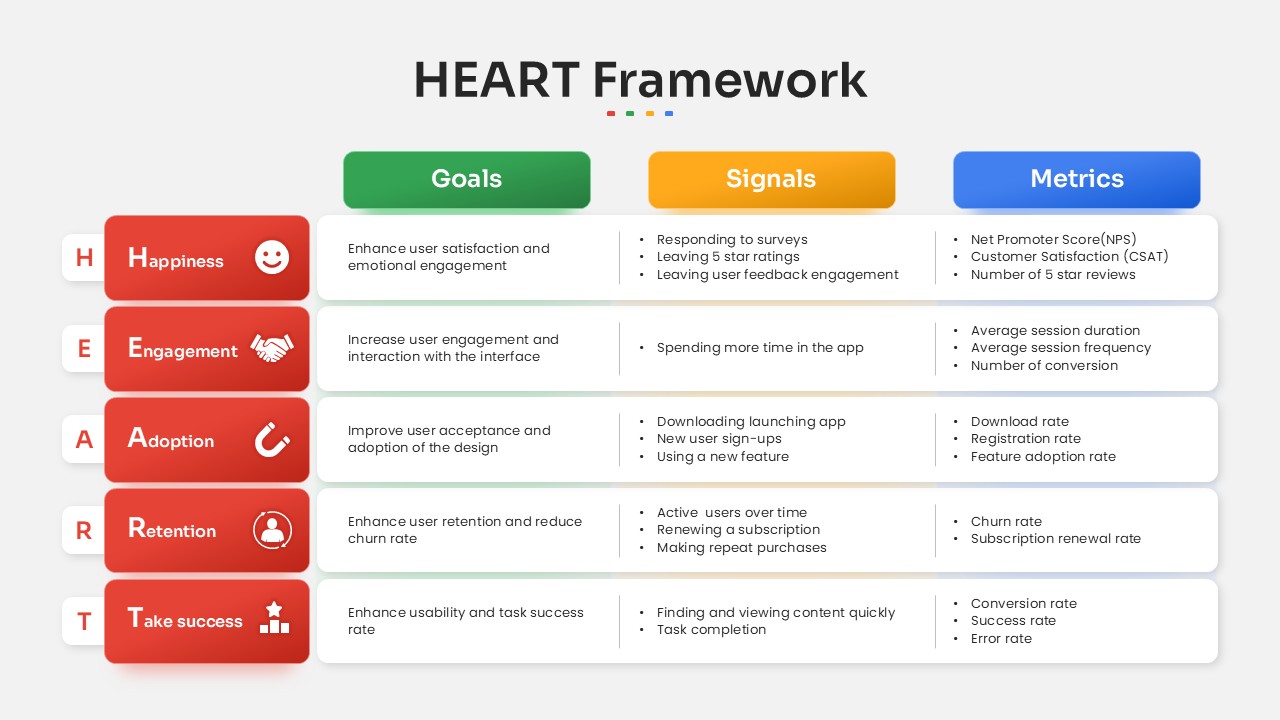
HEART Framework Goals, Signals & Metrics Template for PowerPoint & Google Slides
Process

Application Revenue Line Chart KPI Template for PowerPoint & Google Slides
Revenue
4 Step Revenue Growth Flow Diagram Template for PowerPoint & Google Slides
Process
Entertainment Industry Revenue Bar Chart Template for PowerPoint & Google Slides
Bar/Column
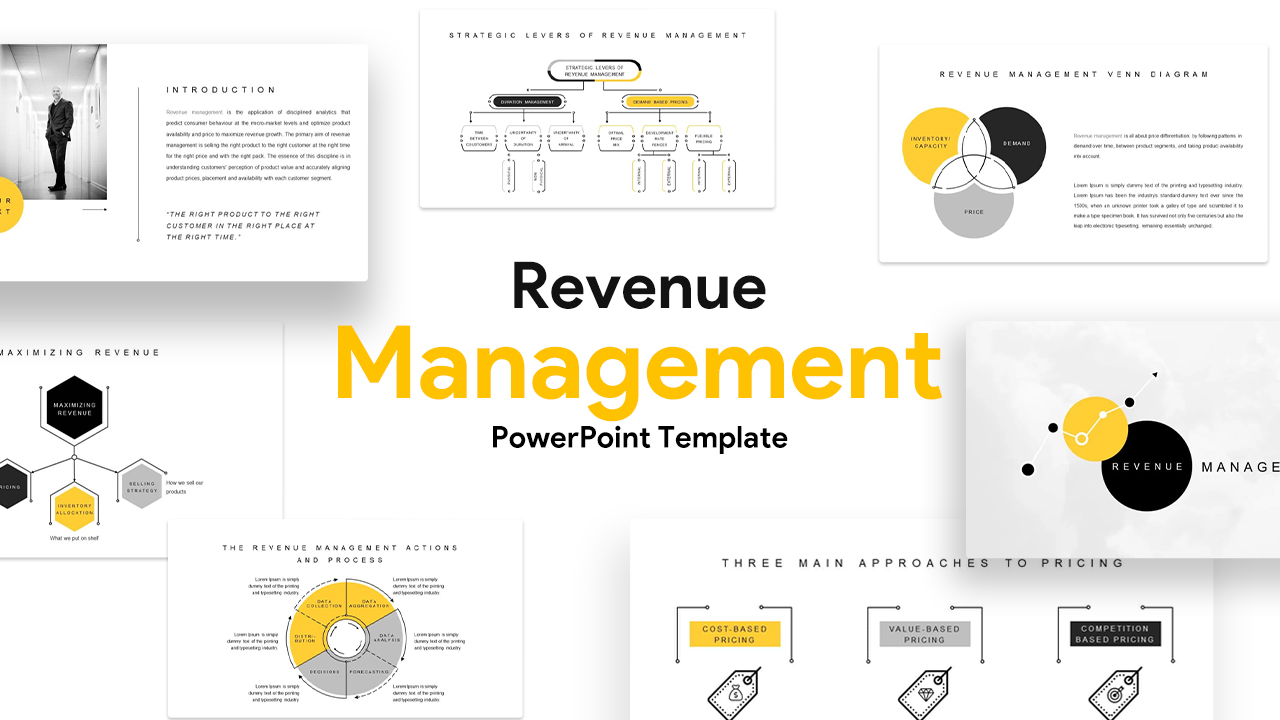
Revenue Management Business Strategy Template for PowerPoint & Google Slides
Revenue
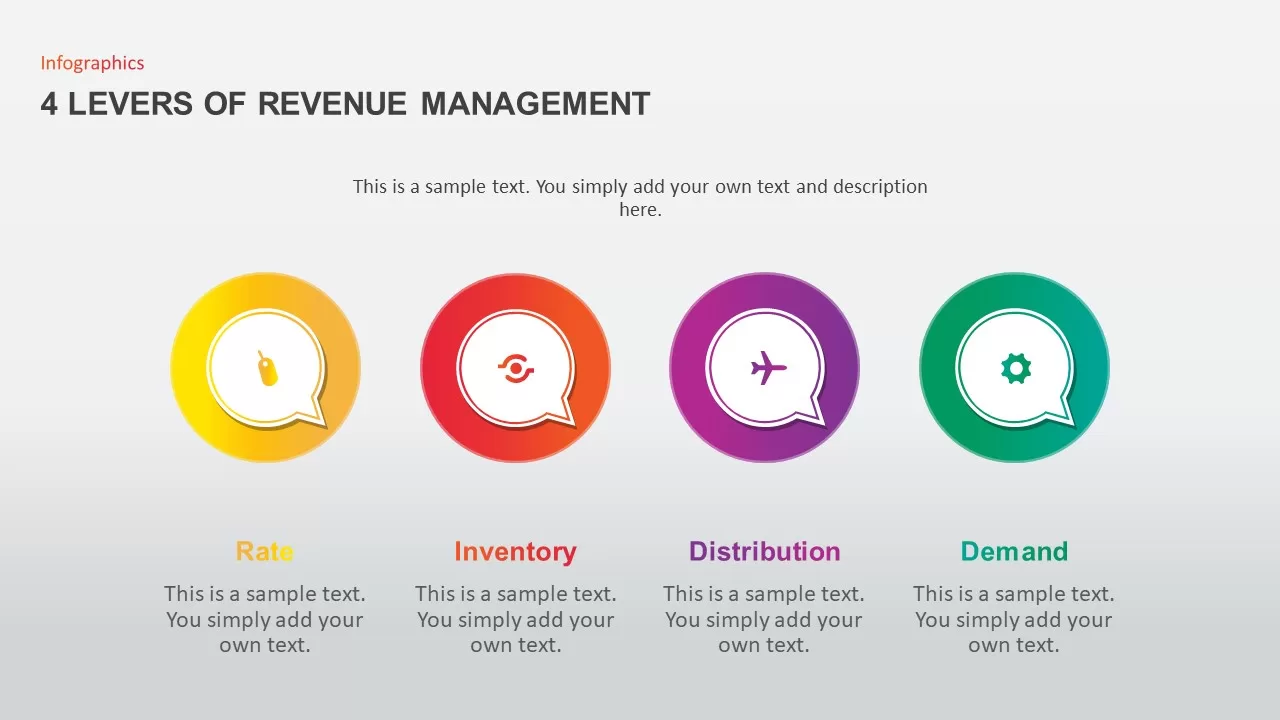
4 Levers of Revenue Management Infographic Template for PowerPoint & Google Slides
Infographics
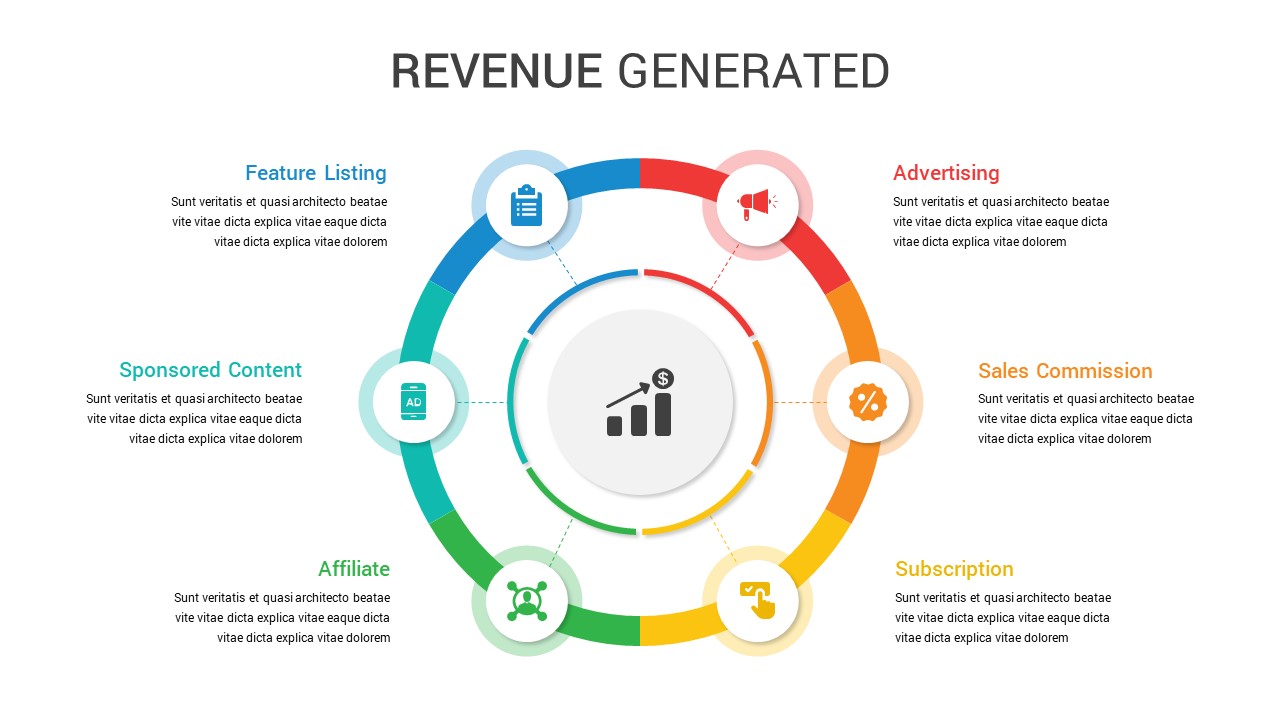
Circular Revenue Generation Diagram Template for PowerPoint & Google Slides
Revenue
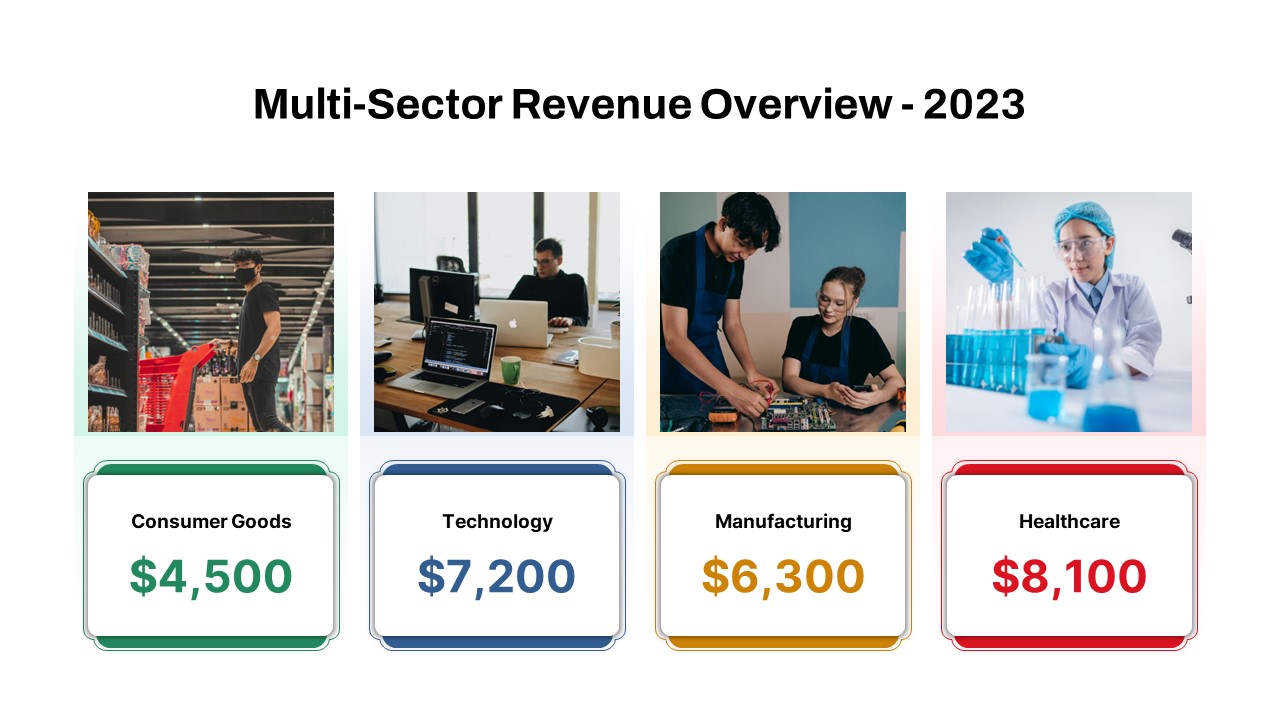
Multi-Sector Revenue Breakdown Cards Template for PowerPoint & Google Slides
Comparison
Quarterly Revenue Comparison Bar Chart Template for PowerPoint & Google Slides
Bar/Column
Regional Revenue Comparison Overview Template for PowerPoint & Google Slides
Comparison
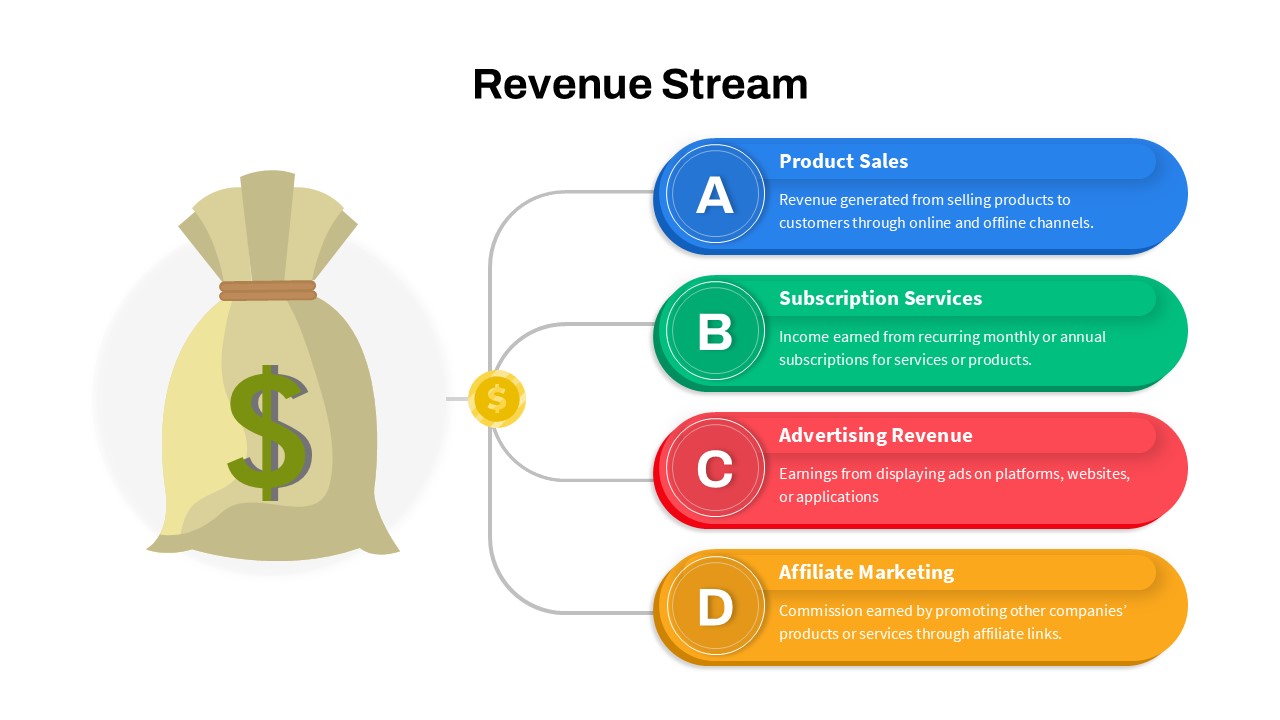
Revenue Streams: Four Channels Diagram Template for PowerPoint & Google Slides
Business Models
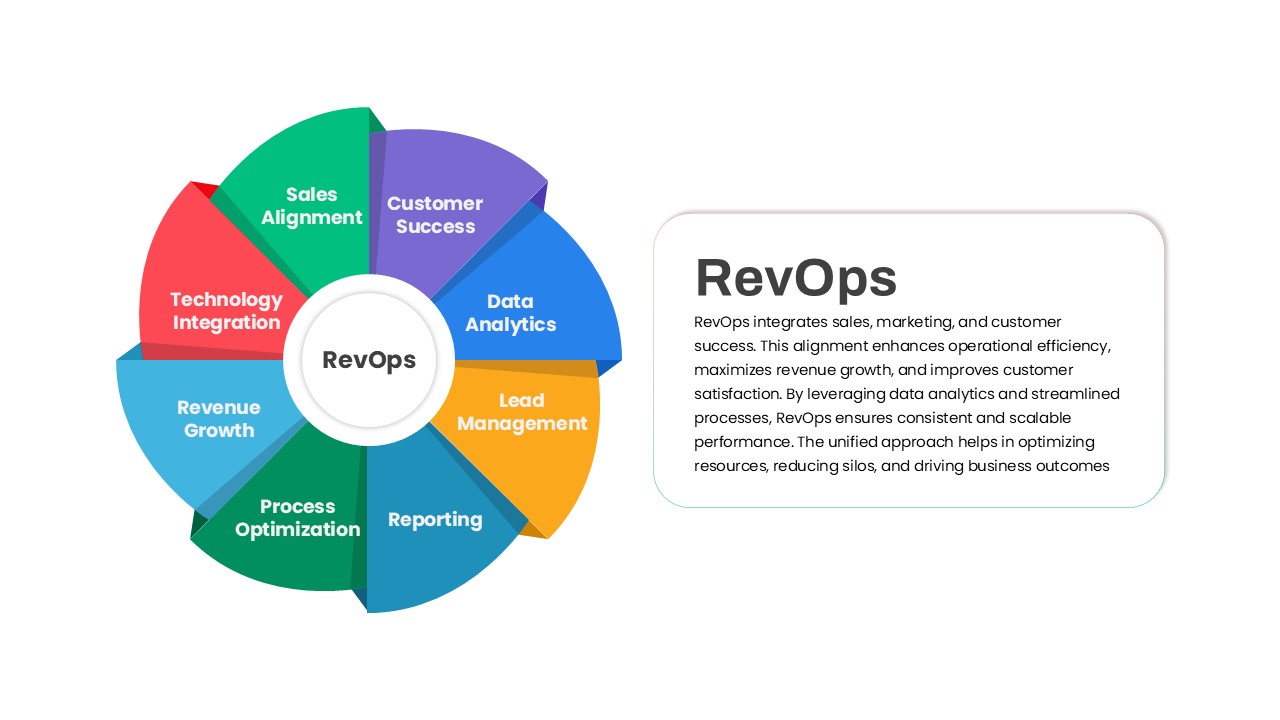
RevOps Revenue Operations Diagram Template for PowerPoint & Google Slides
Revenue
Six Revenue Stream Model Infographic Template for PowerPoint & Google Slides
Circular
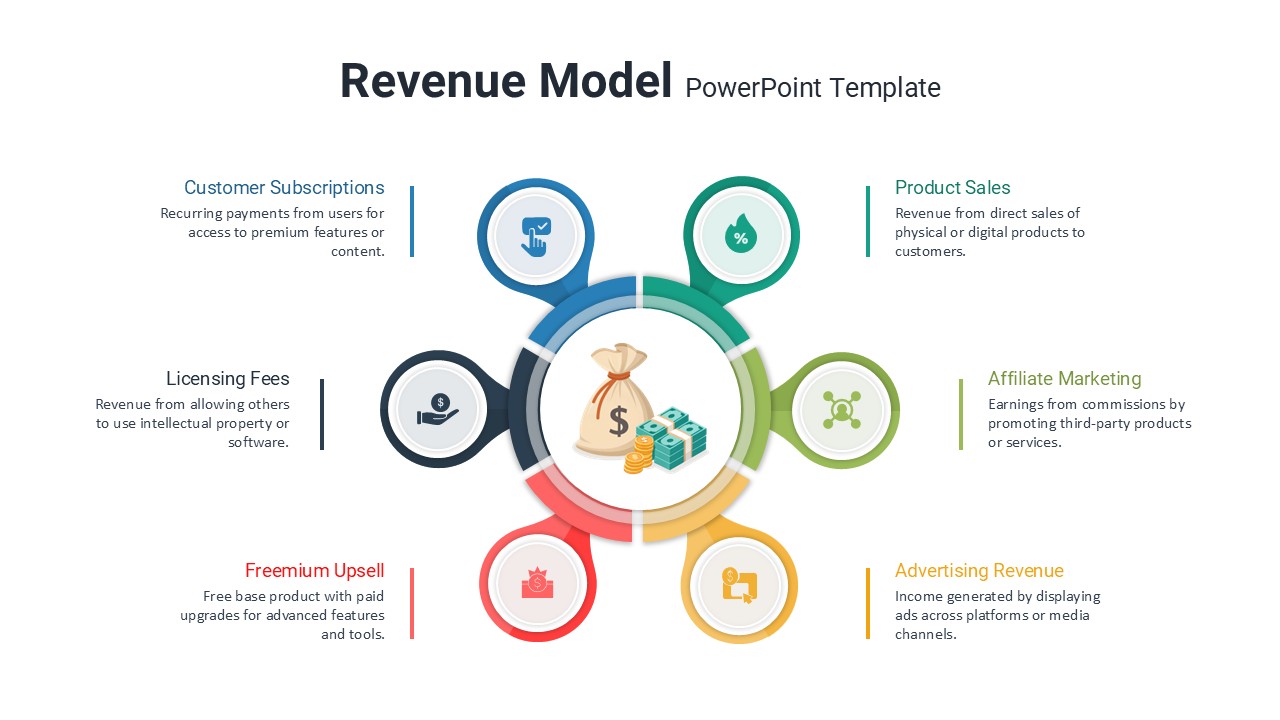
Revenue Model PowerPoint Template
Finance
Annual Creative Hexagon Timeline Diagram Template for PowerPoint & Google Slides
Timeline
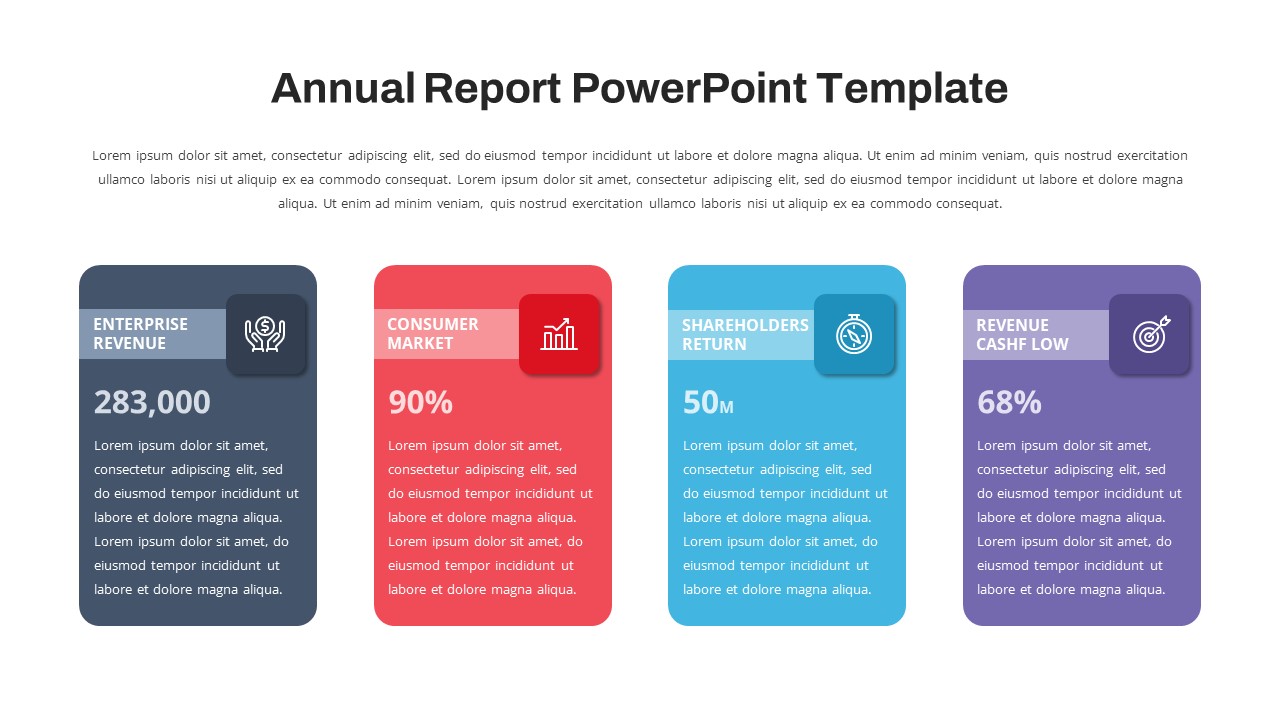
Annual Report Template for PowerPoint & Google Slides
Company Profile
Elegant 2023 Annual Calendar Overview Template for PowerPoint & Google Slides
Timeline
Gradient Annual Plan & Strategy Deck Template for PowerPoint & Google Slides
Decks
Annual Report Overview Template for PowerPoint & Google Slides
Decks
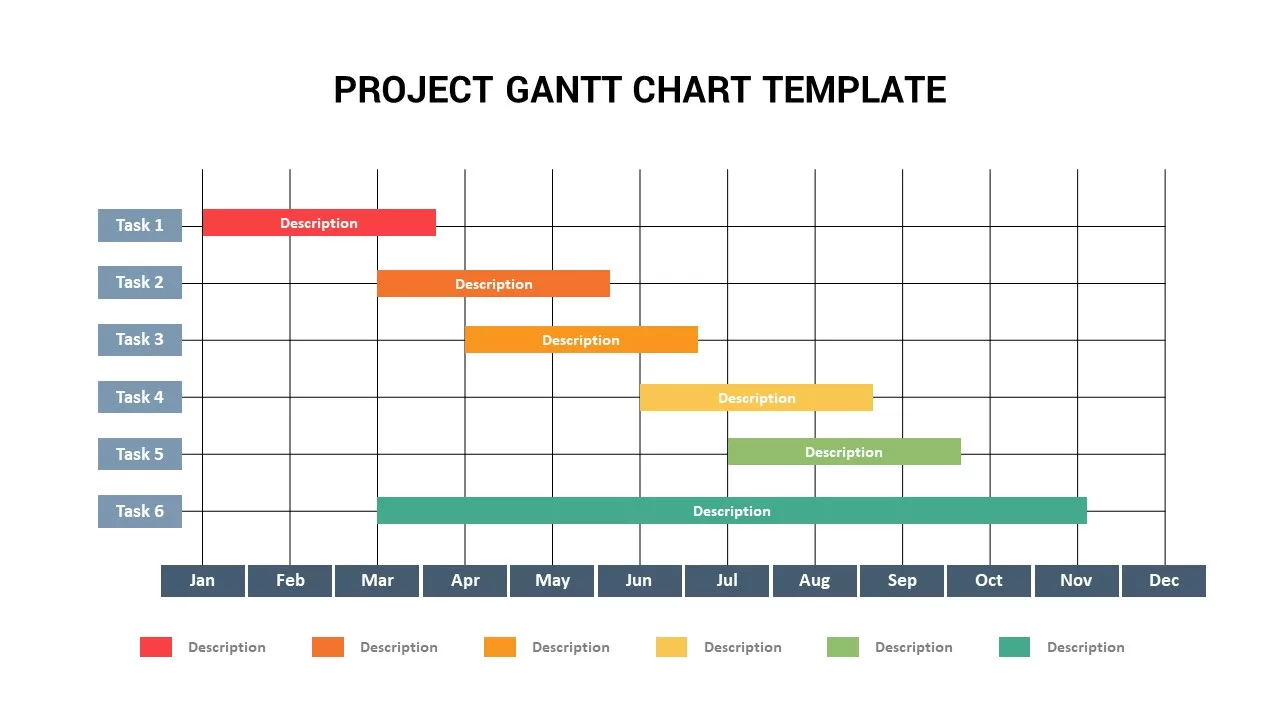
Annual Project Gantt Chart Timeline Template for PowerPoint & Google Slides
Gantt Chart
One Pager Annual Report Dashboard Template for PowerPoint & Google Slides
Business Report
Annual Growth Trend Analysis Chart template for PowerPoint & Google Slides
Business Report
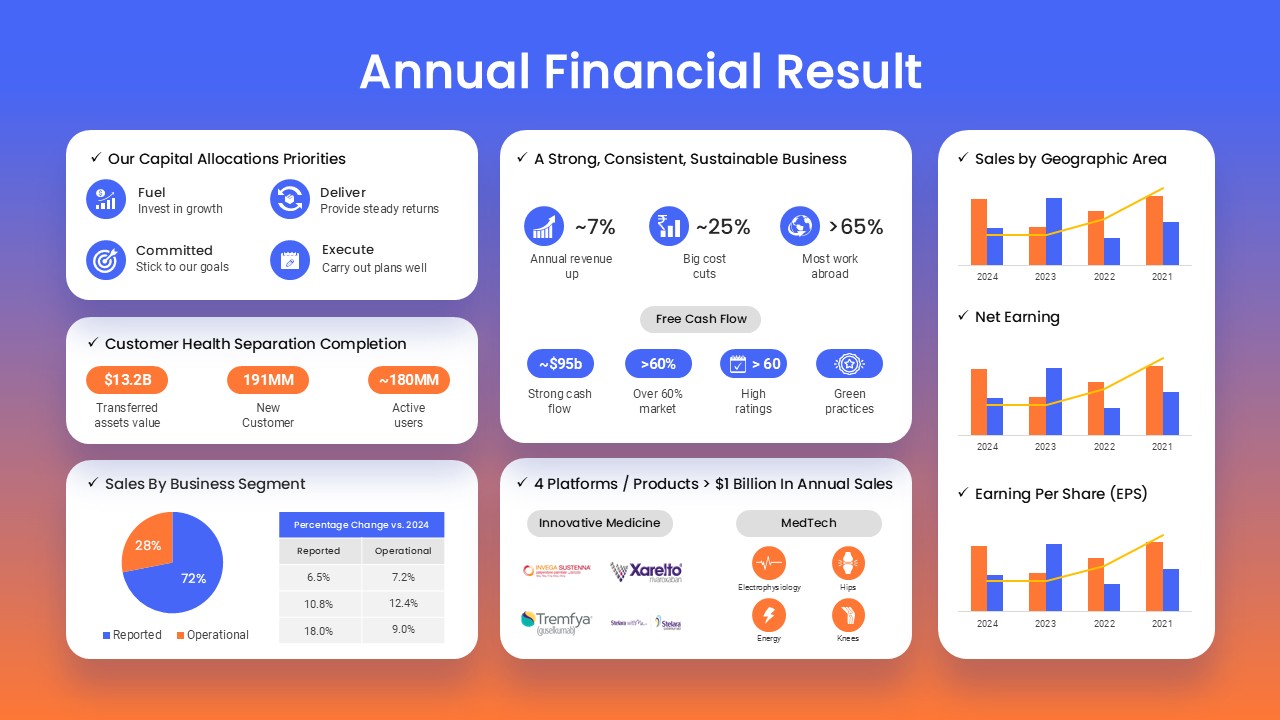
Annual Financial Results Slide Deck Template for PowerPoint & Google Slides
Finance
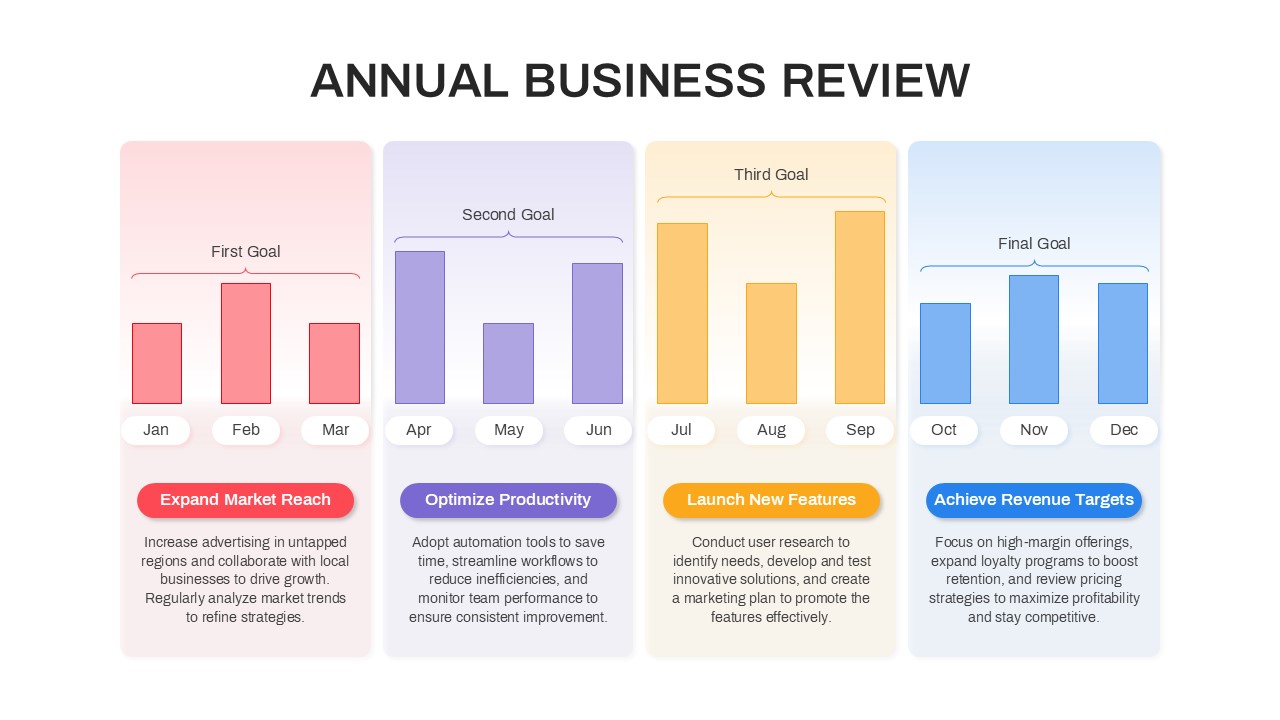
Annual Business Review Timeline Template for PowerPoint & Google Slides
Timeline
Colorful Annual Gantt Chart Project Planner Template for PowerPoint & Google Slides
Gantt Chart
Colorful Annual Gantt Chart Timeline Template for PowerPoint & Google Slides
Gantt Chart
Free Annual Business Report Slide for PowerPoint & Google Slides
Finance
Free
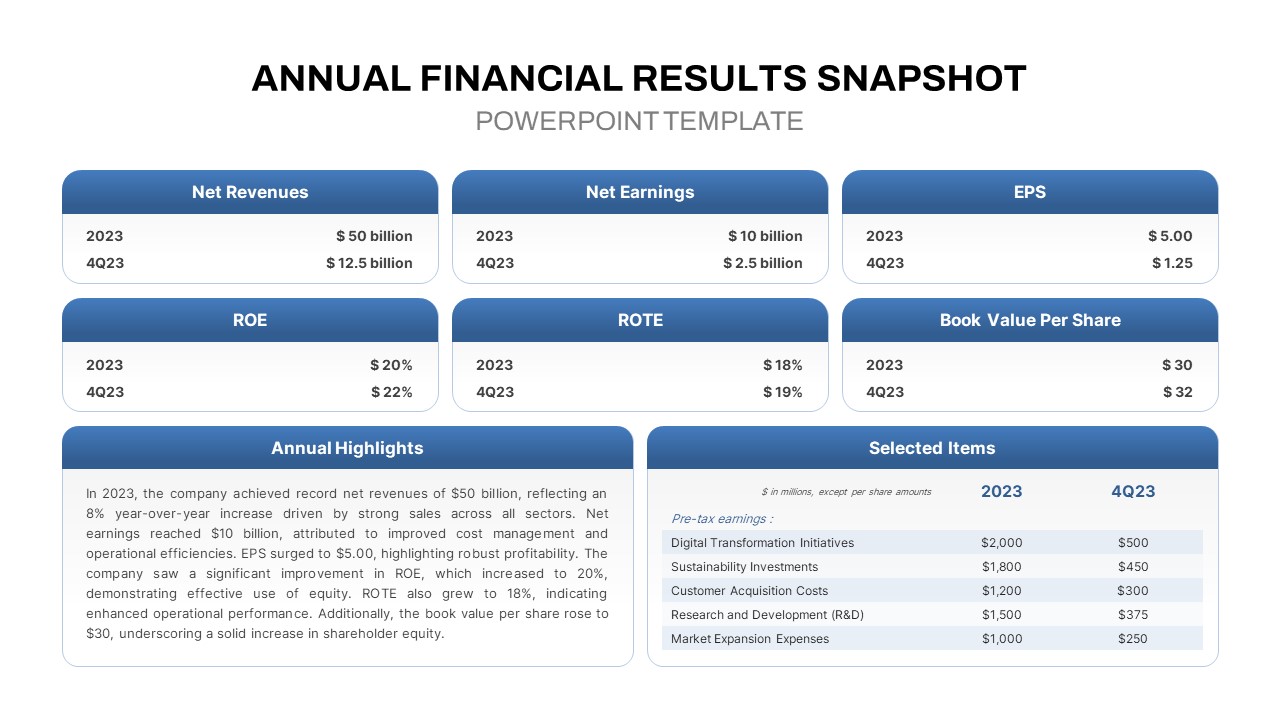
Annual Financial Results Snapshot Template for PowerPoint & Google Slide
Finance