Activity Ratios Formula Table Slide Template for PowerPoint & Google Slides
Description
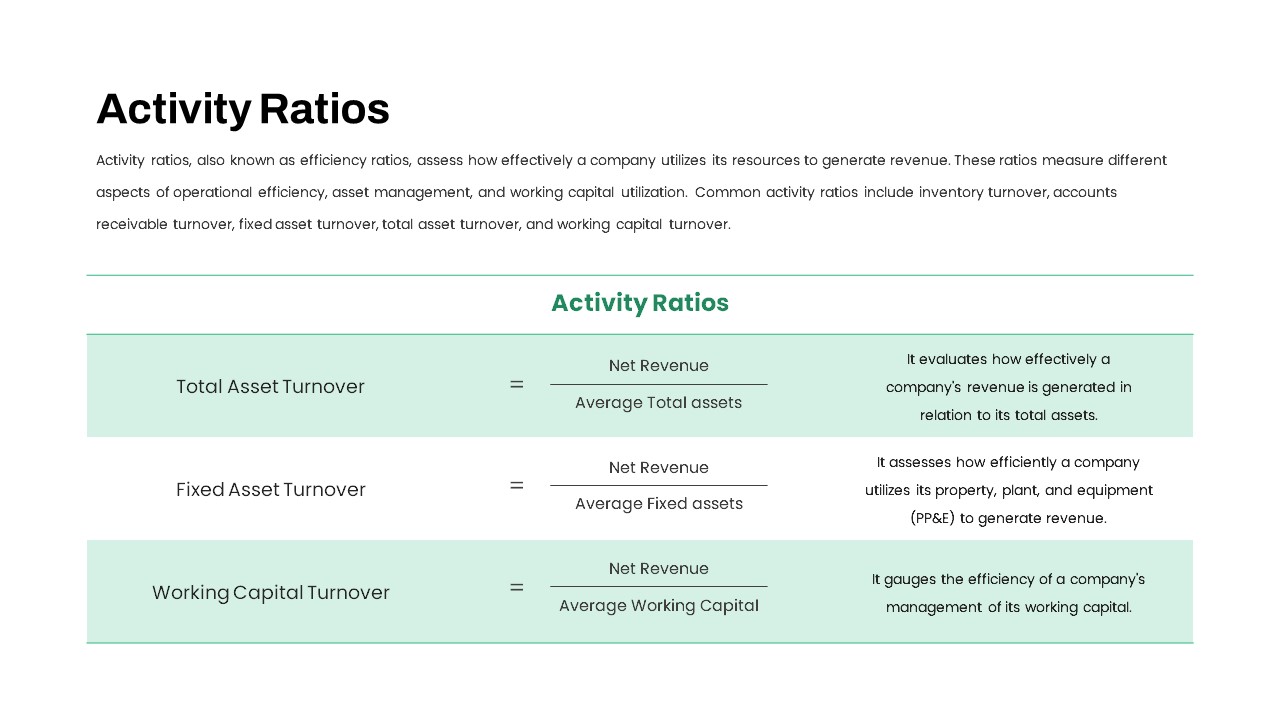
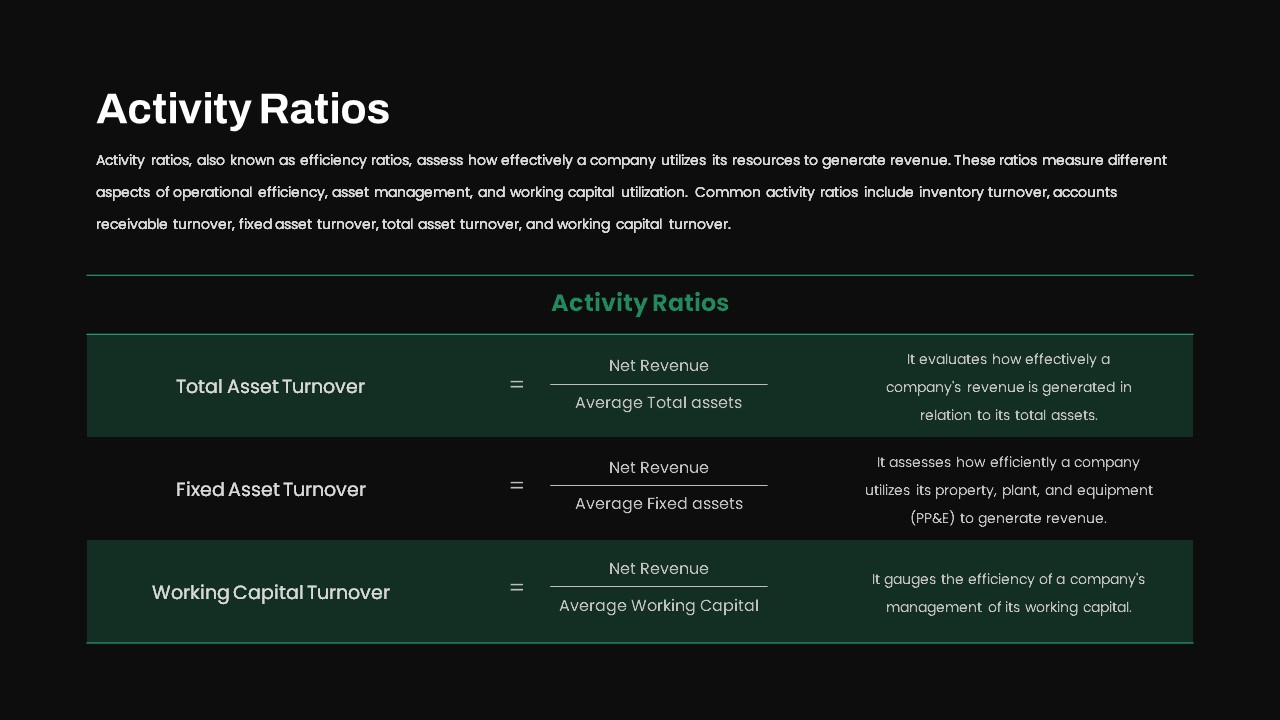
This Activity Ratios slide presents three essential efficiency metrics—Total Asset Turnover, Fixed Asset Turnover, and Working Capital Turnover—in a clean, tabular layout with formula notation and concise explanations. Each row pairs the ratio name with its mathematical definition (Net Revenue over Average Assets), followed by a brief interpretation in a dedicated column. Subtle green shading highlights each metric block, while a slim divider and ample white space ensure readability and visual balance. The bold “Activity Ratios” heading anchors the slide at the top, complementing the minimalist typography and consistent line weights.
Built for rapid customization, this template leverages PowerPoint and Google Slides master layouts to maintain uniform fonts, colors, and spacing across all slides. Easily swap the green accent tone for your brand palette, adjust text placeholders, or reorder rows to include additional ratios. Vector-based formula bars and divider lines can be recolored or resized without loss of clarity, and the slide’s modular structure allows you to duplicate, hide, or expand metric blocks as needed. Use built-in guides to align elements precisely, and edit the ratio descriptions with a single click.
Optimized for seamless compatibility, this slide preserves exact positioning and formatting whether you’re presenting on desktop, projector, or mobile devices. Collaborate in real time with version history and commenting features, or export to PDF with embedded fonts intact. Ideal for financial reviews, management meetings, or academic lectures, this asset transforms complex accounting concepts into a digestible visual framework. Enhance your narrative flow by pairing this slide with graphical dashboards or trend charts, and maintain a professional, cohesive look throughout your deck.
Who is it for
Financial analysts, CFOs, accountants, and business consultants will benefit from this slide when reviewing operational efficiency, asset management, or working capital performance. Corporate trainers and MBA instructors can use it to teach key performance indicators in lectures or workshops.
Other Uses
Repurpose this layout to present liquidity ratios, profitability metrics, or debt ratios. Adapt the table to compare quarterly KPIs, forecast models, or regional performance indicators. Use the same structure for process steps, audit checklists, or project milestone summaries.
Login to download this file

Item ID
SB04188
Related Templates

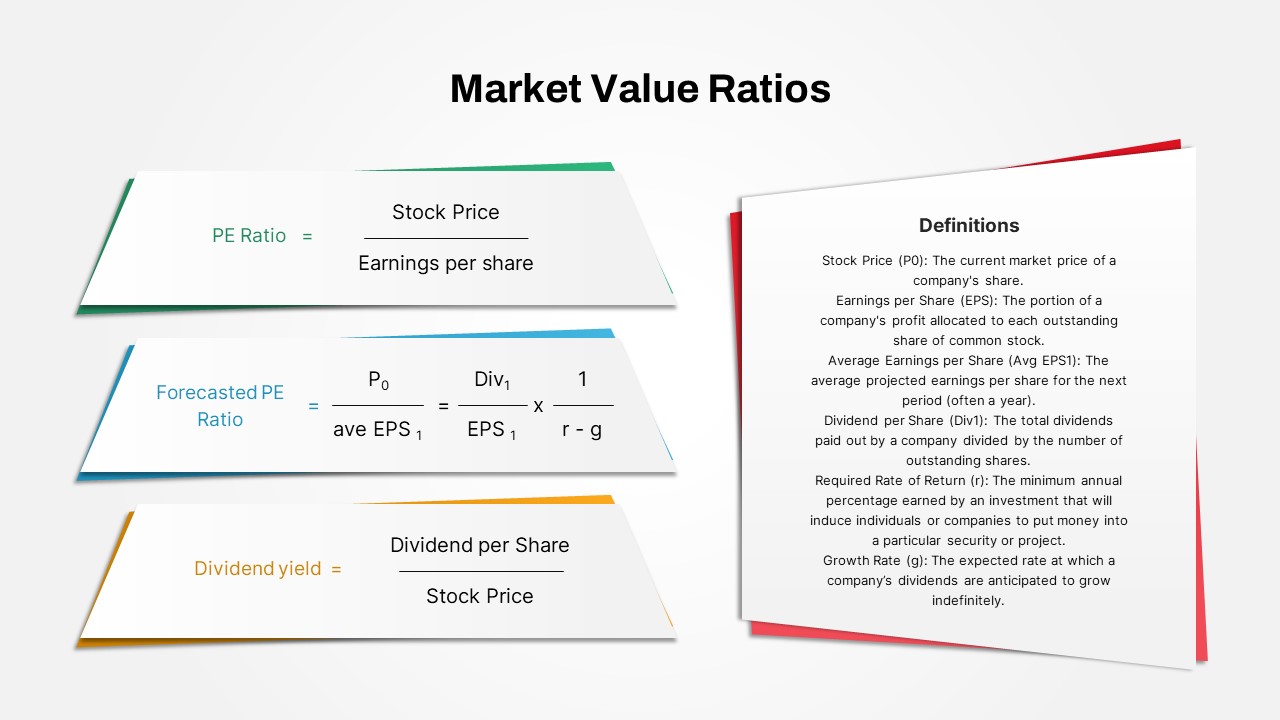
Market Value Ratios Formula Overview Template for PowerPoint & Google Slides
Business Report
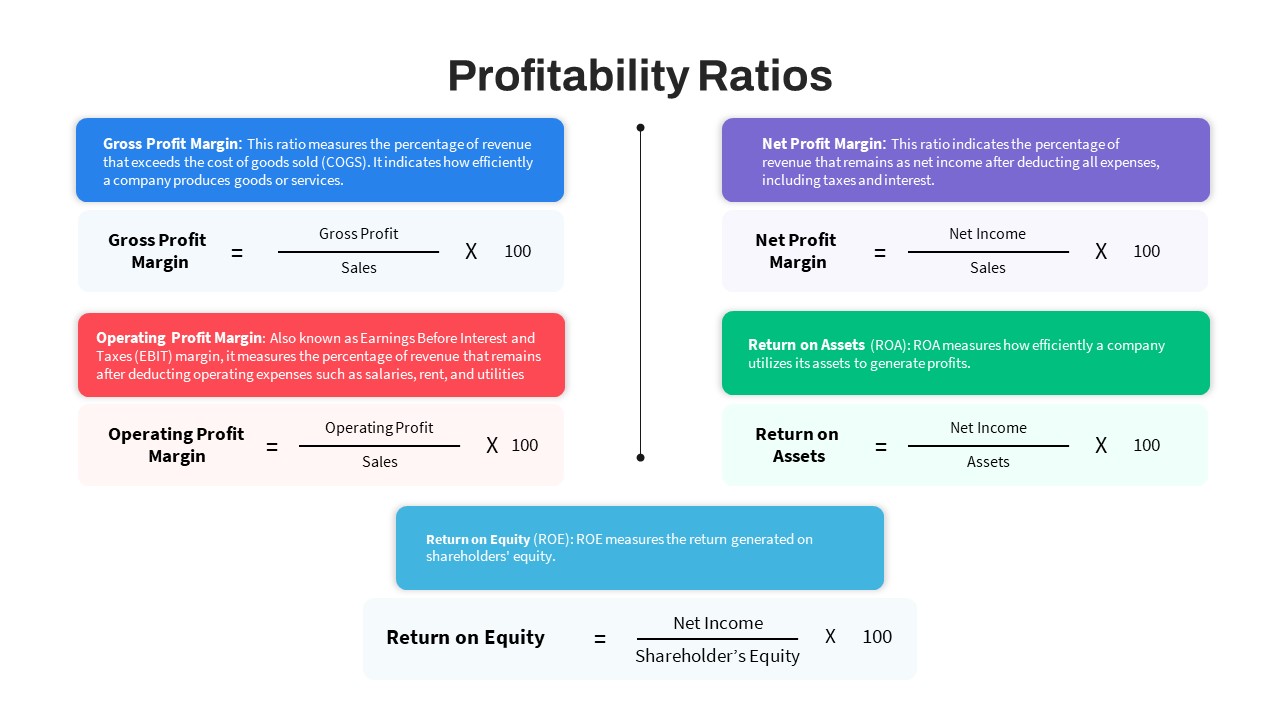
Profitability Ratios Formula Overview Template for PowerPoint & Google Slides
Revenue
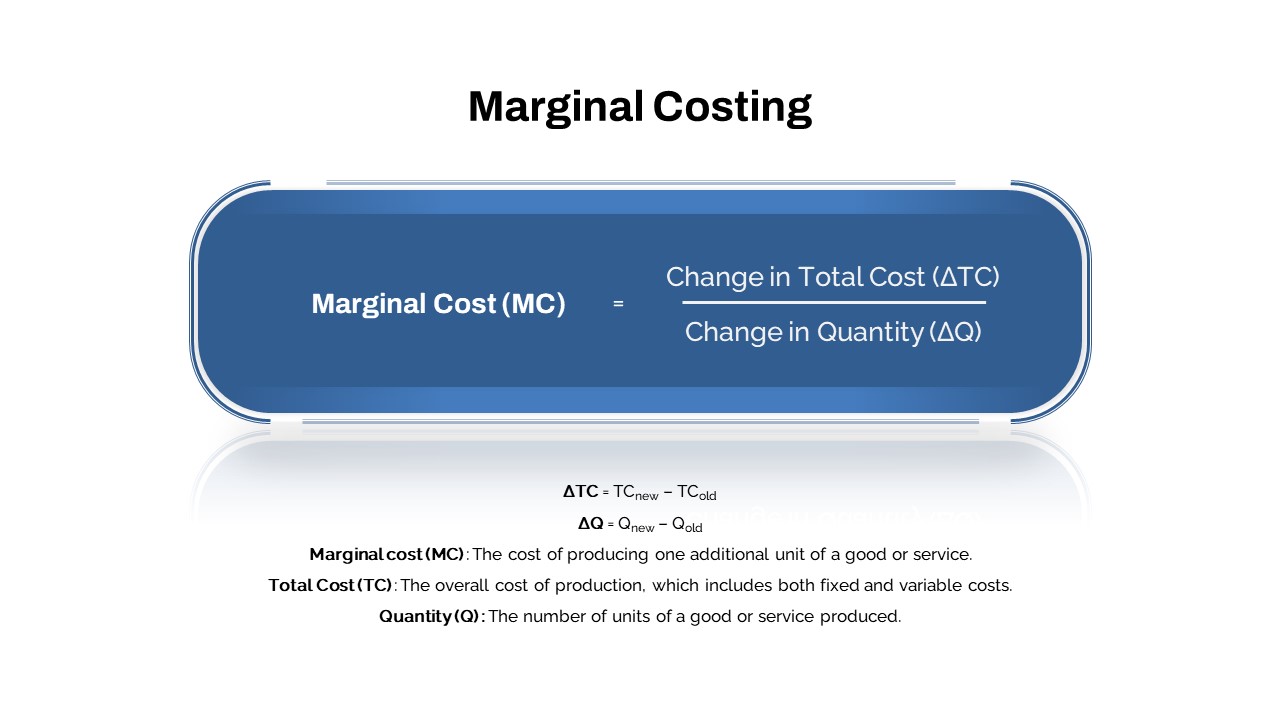
Comprehensive Marginal Costing Formula Template for PowerPoint & Google Slides
Process
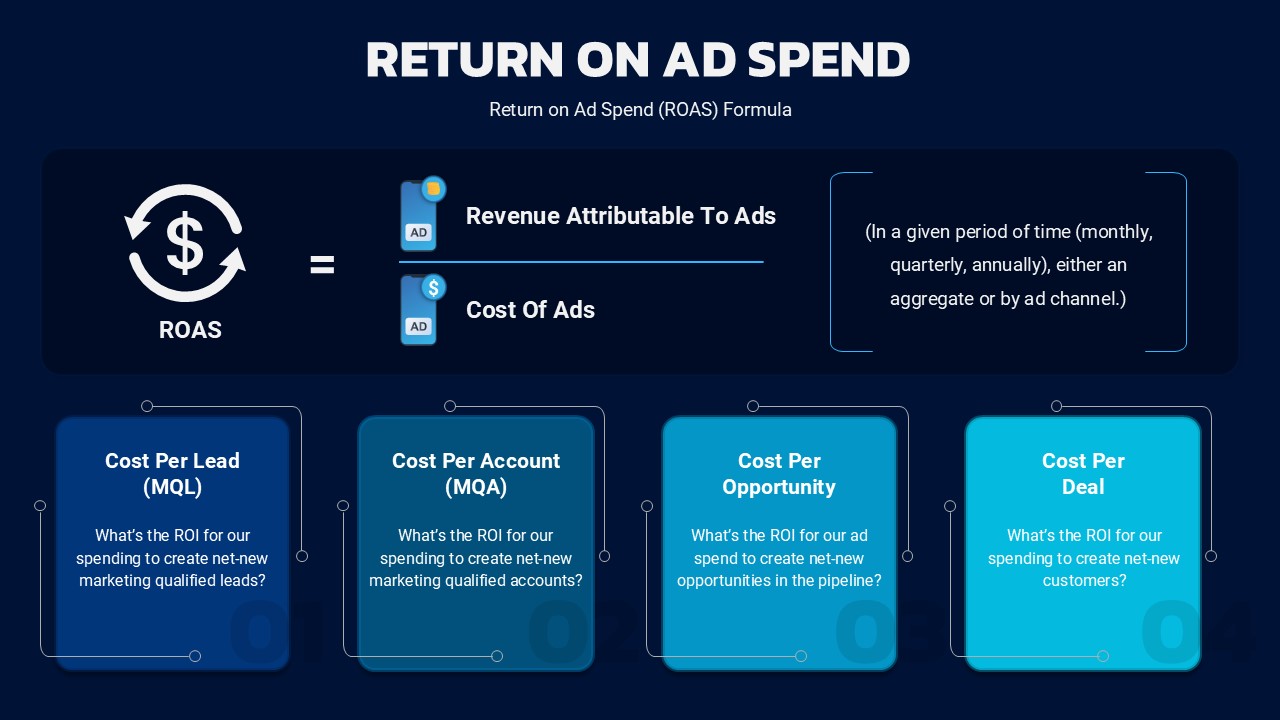
Return on Ad Spend Formula for PowerPoint & Google Slides
Business Strategy

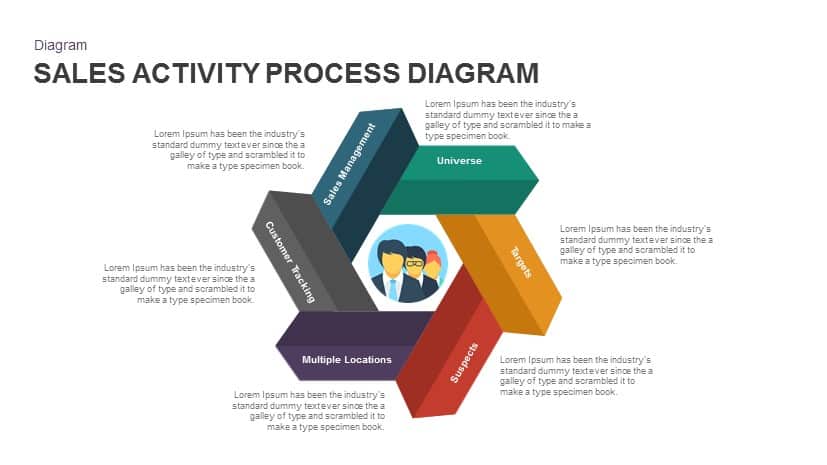
Sales Activity Hexagon Process Diagram Template for PowerPoint & Google Slides
Process
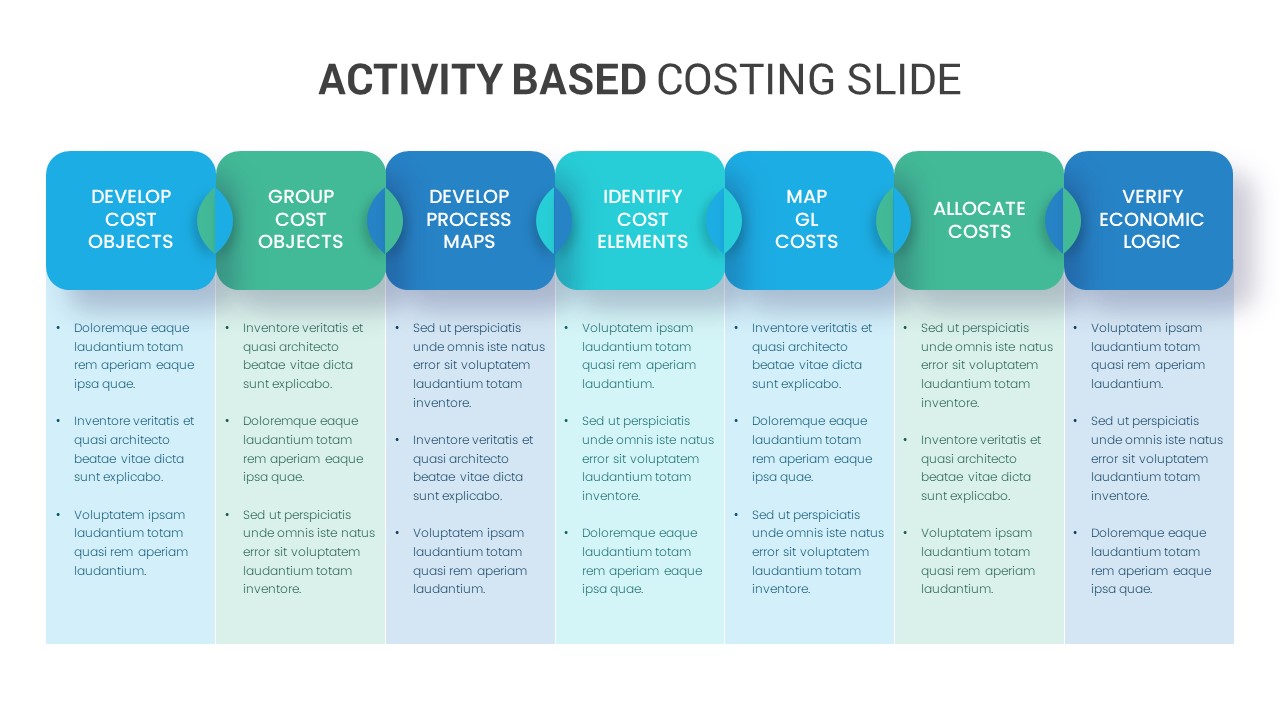
Activity Based Costing Process Diagram Template for PowerPoint & Google Slides
Process
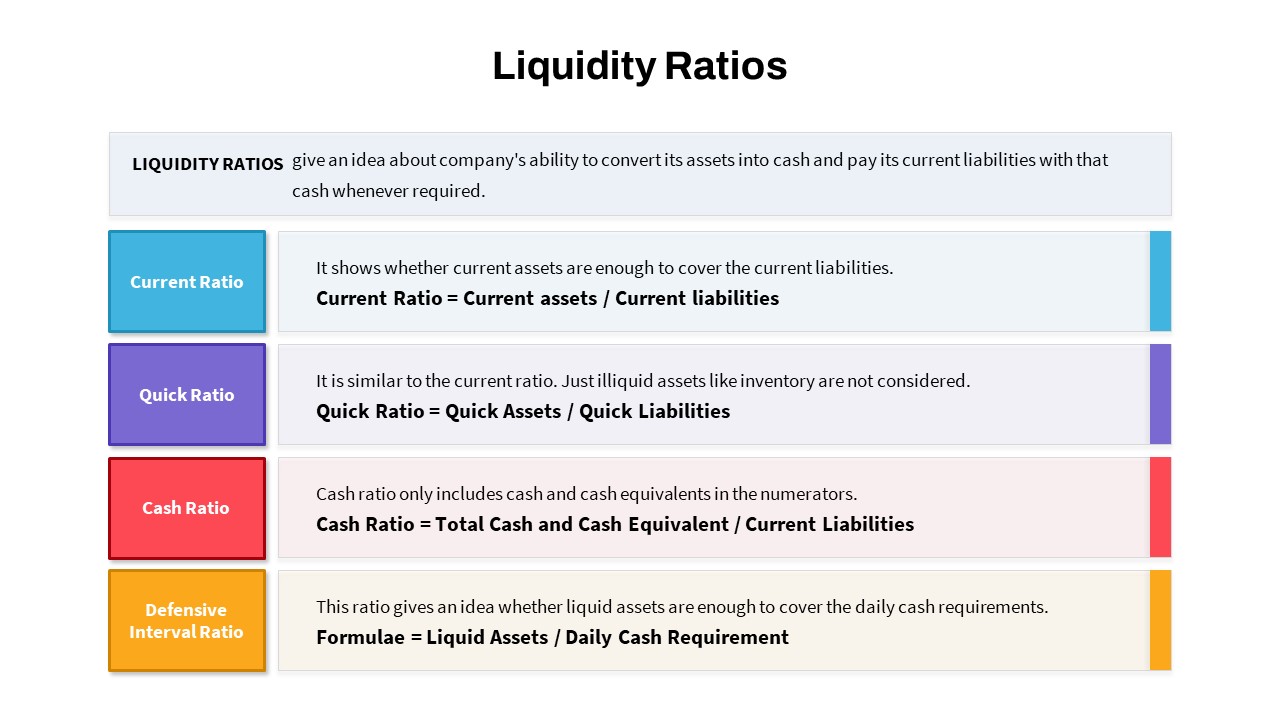
Liquidity Ratios Infographic Slide Template for PowerPoint & Google Slides
Finance
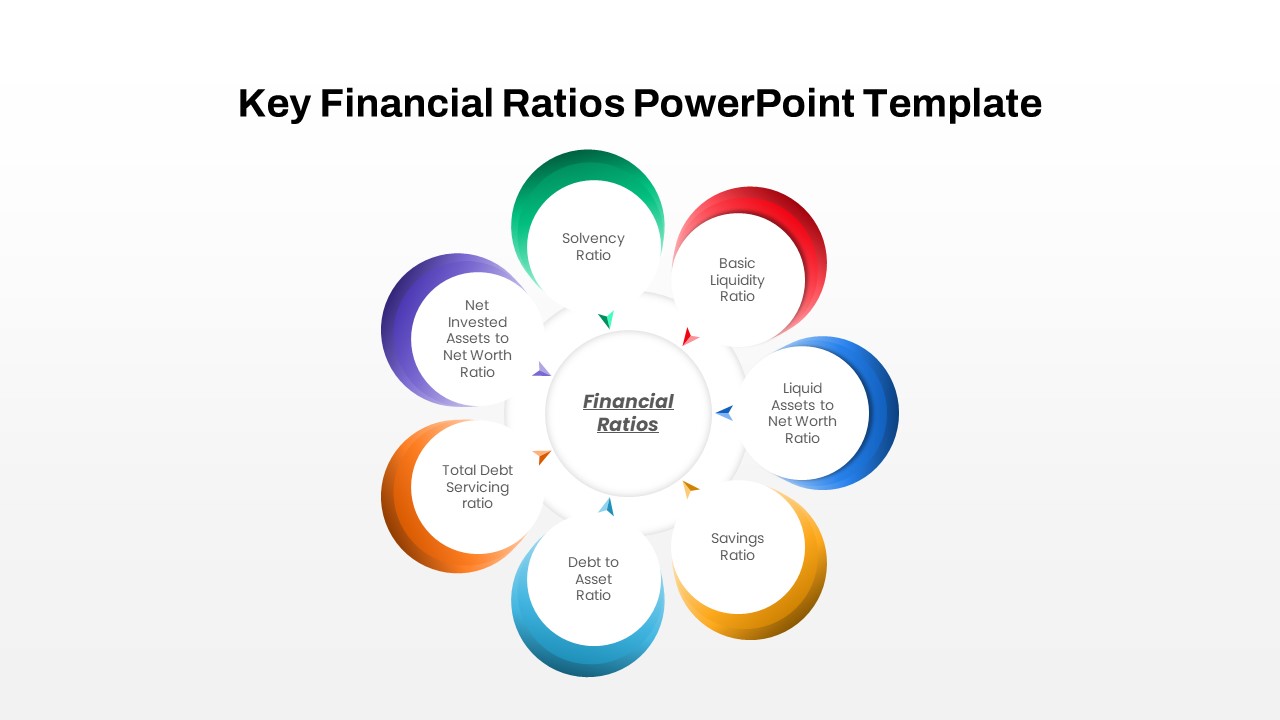
Circular Financial Ratios Infographic Template for PowerPoint & Google Slides
Finance
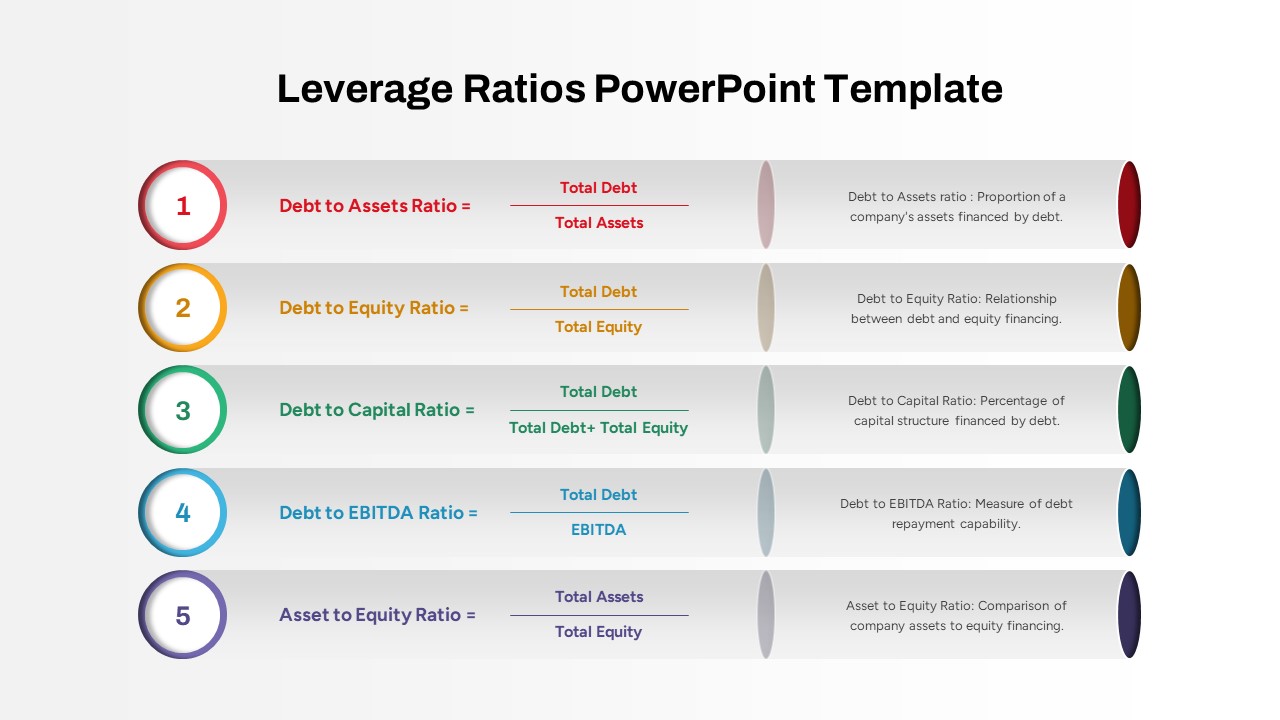
Five Key Leverage Ratios Overview Template for PowerPoint & Google Slides
Finance
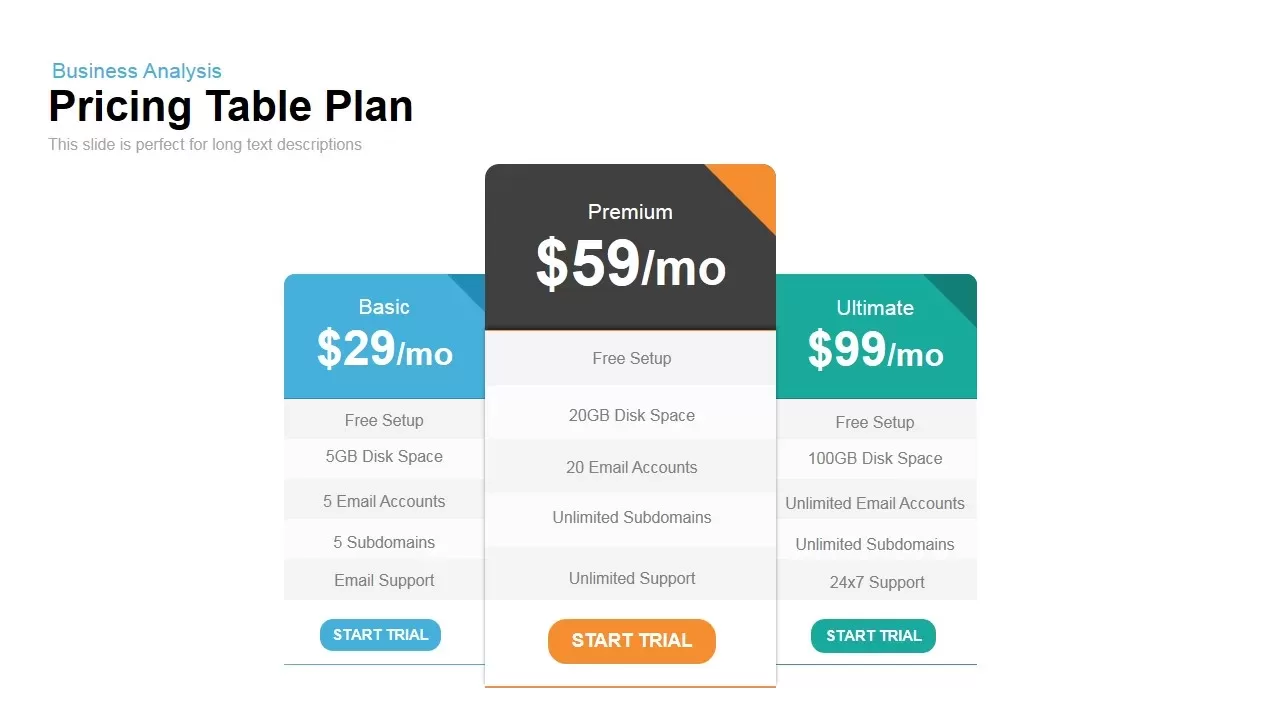
Three-Tier Pricing Table Slide Template for PowerPoint & Google Slides
Comparison
Clean Three-Four Column Table Slide Template for PowerPoint & Google Slides
Business Report
Table of Contents Infographic Slide template for PowerPoint & Google Slides
Agenda
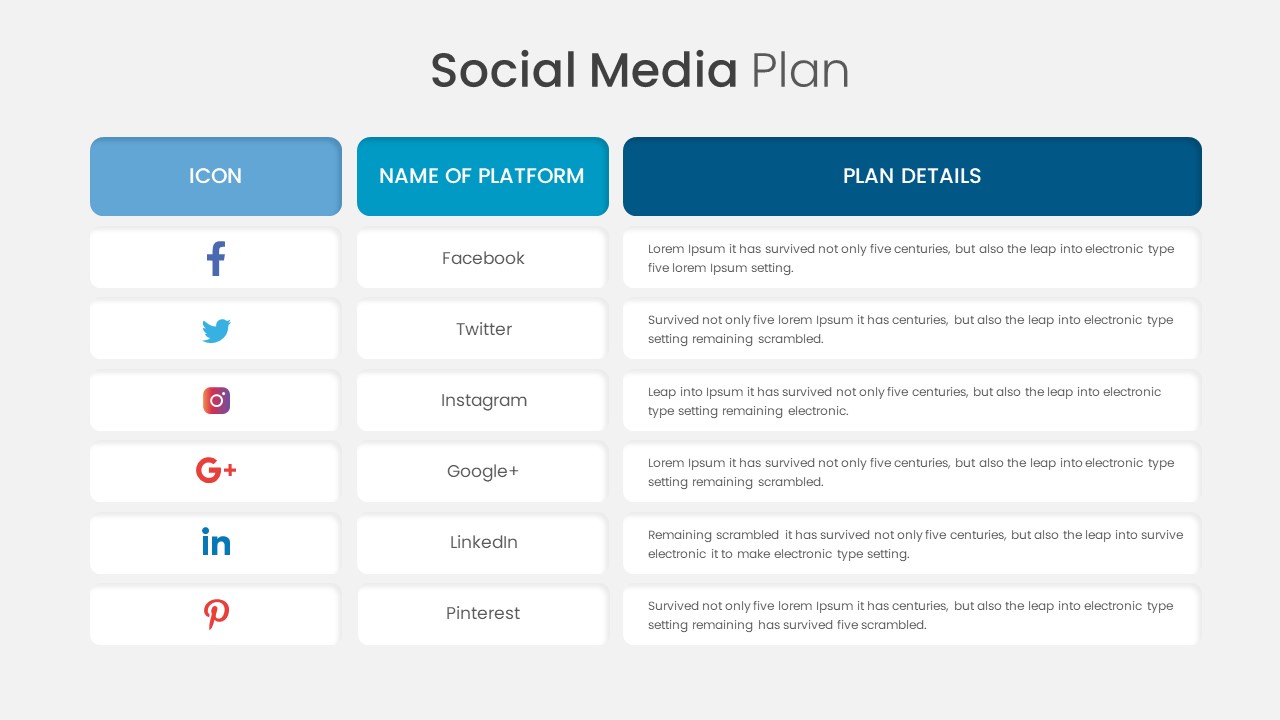
Social Media Plan Table Slide Deck Template for PowerPoint & Google Slides
Process
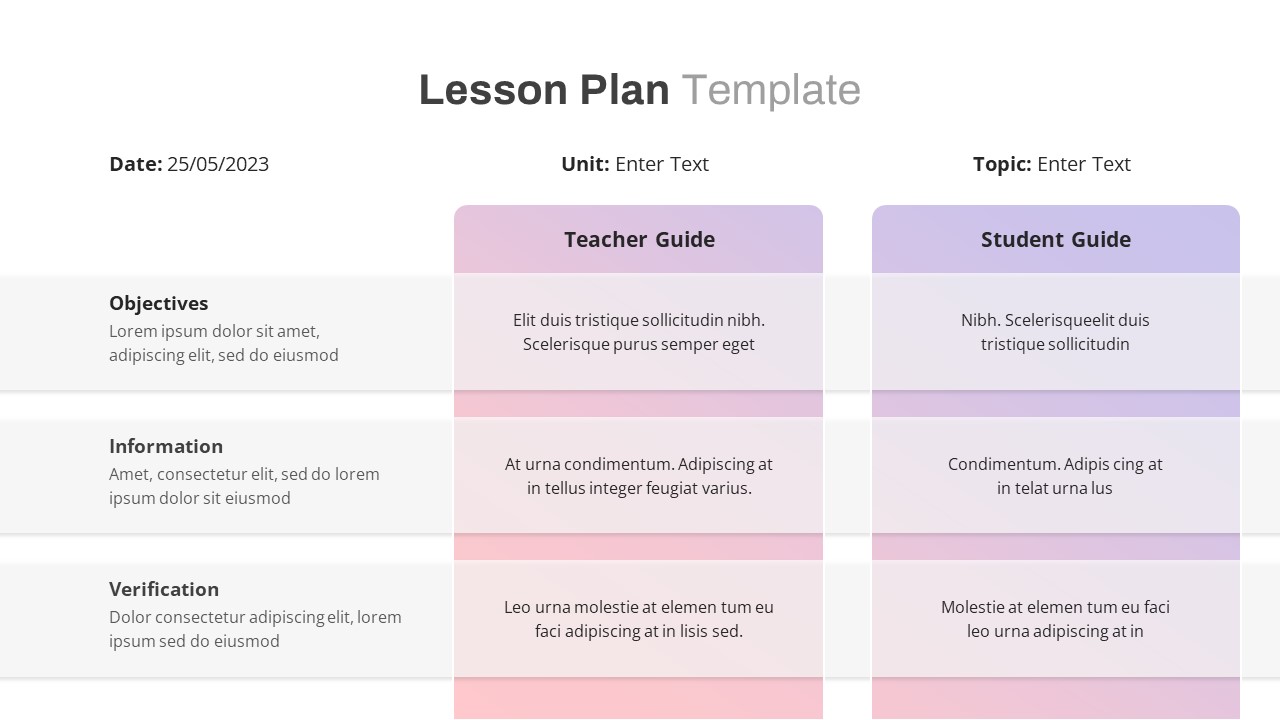
Free Lesson Plan Table Slide Template for PowerPoint & Google Slides
Agenda
Free
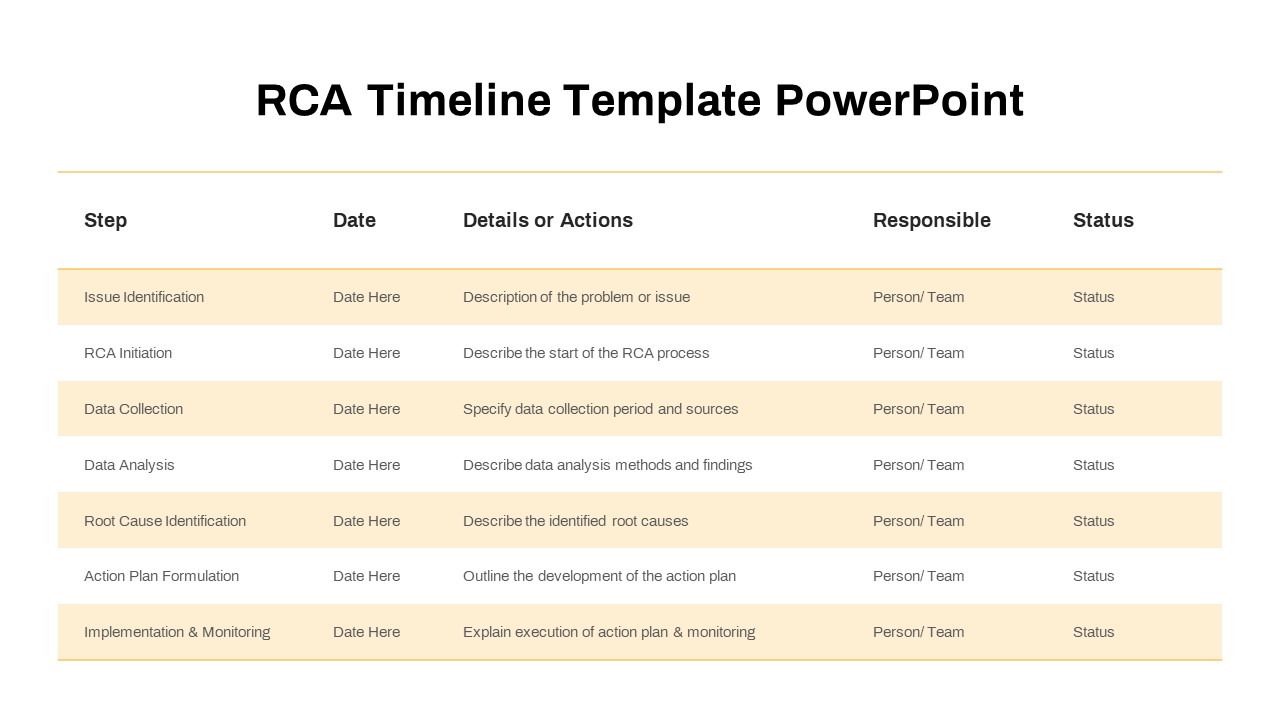
RCA Process Timeline Table Slide Template for PowerPoint & Google Slides
Timeline
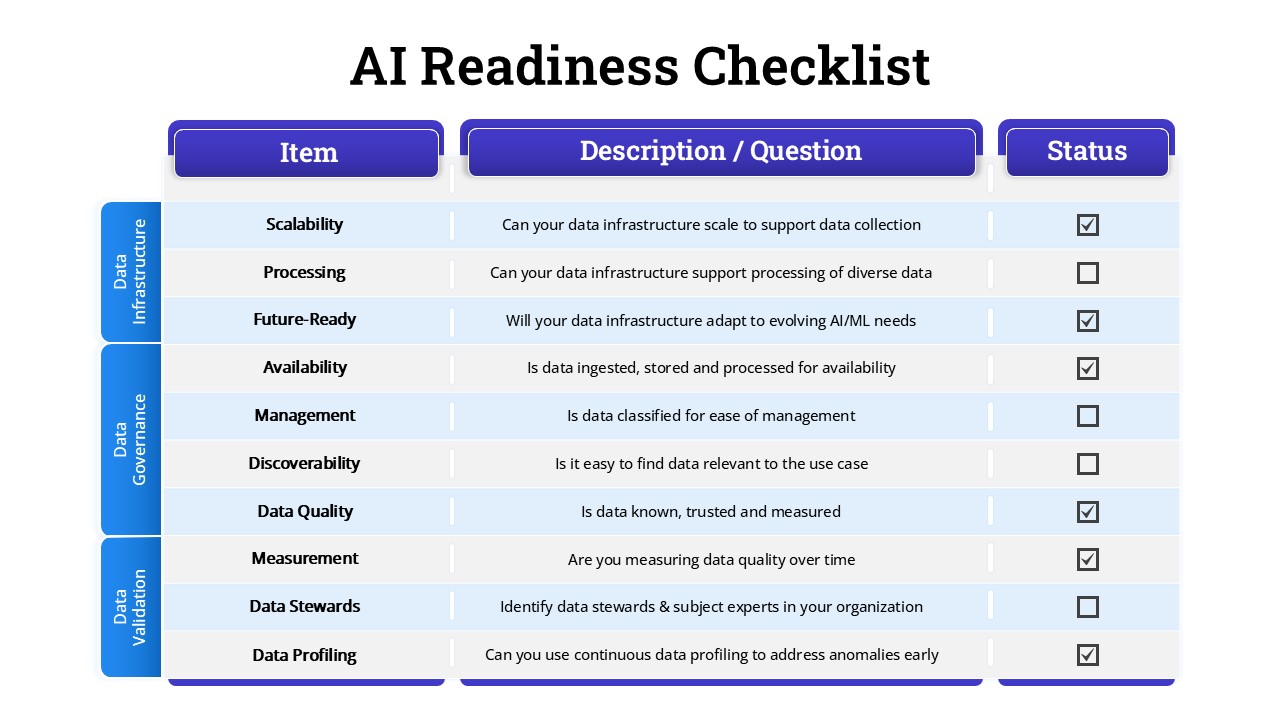
AI Readiness Checklist Table Slide Template for PowerPoint & Google Slides
Process
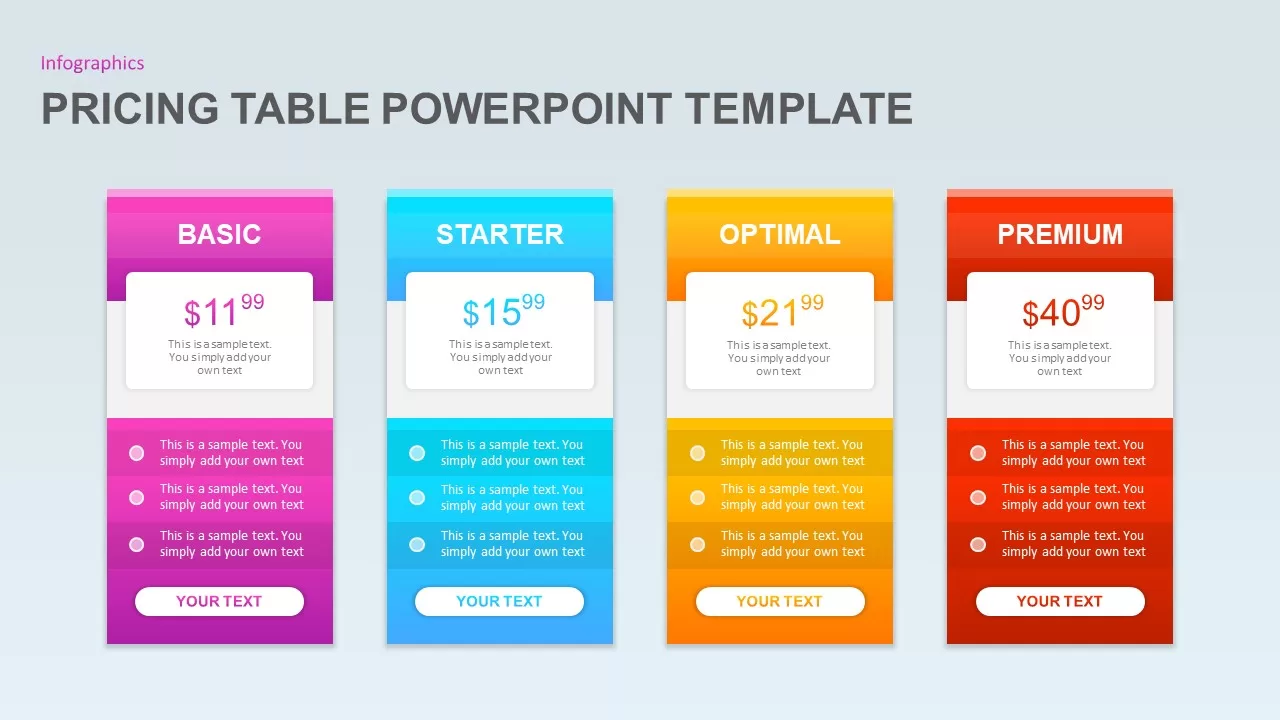
Pricing Table PowerPoint Template for PowerPoint & Google Slides
Infographics
Simple Comparison Table Template for PowerPoint & Google Slides
Comparison
Four-Tier Pricing Comparison Table Template for PowerPoint & Google Slides
Comparison
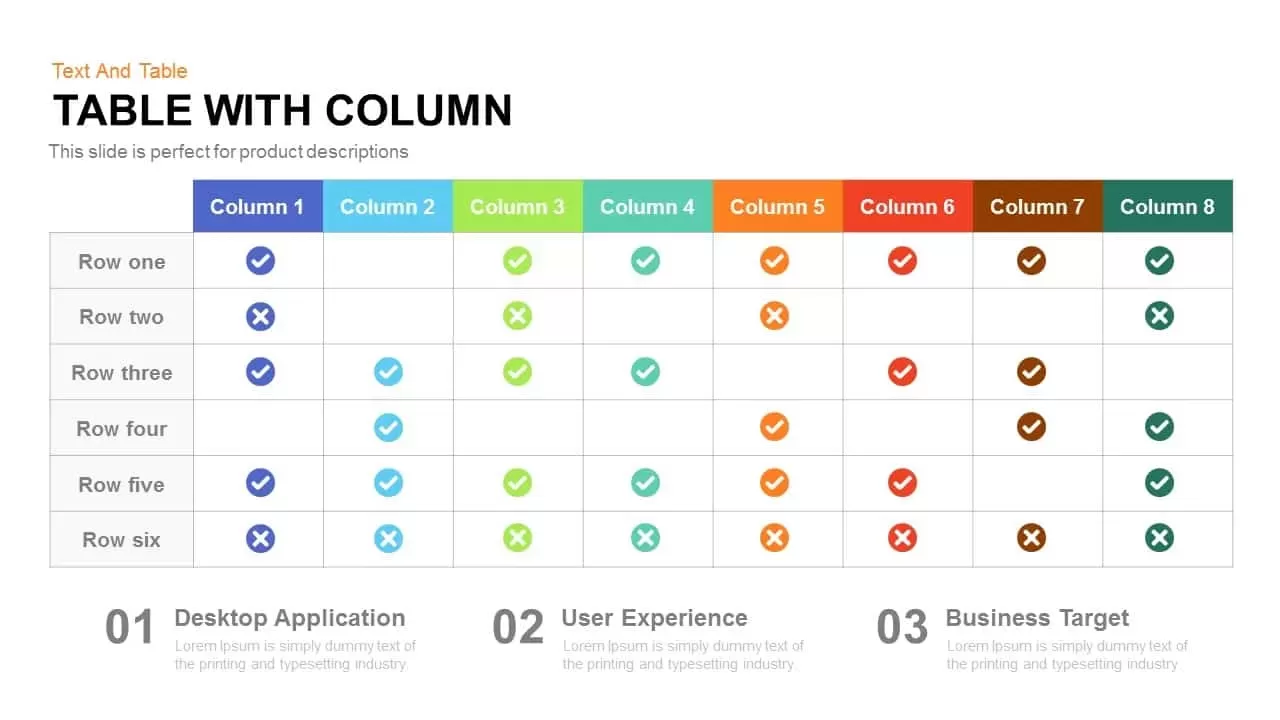
Table with Columns template for PowerPoint & Google Slides
Comparison Chart
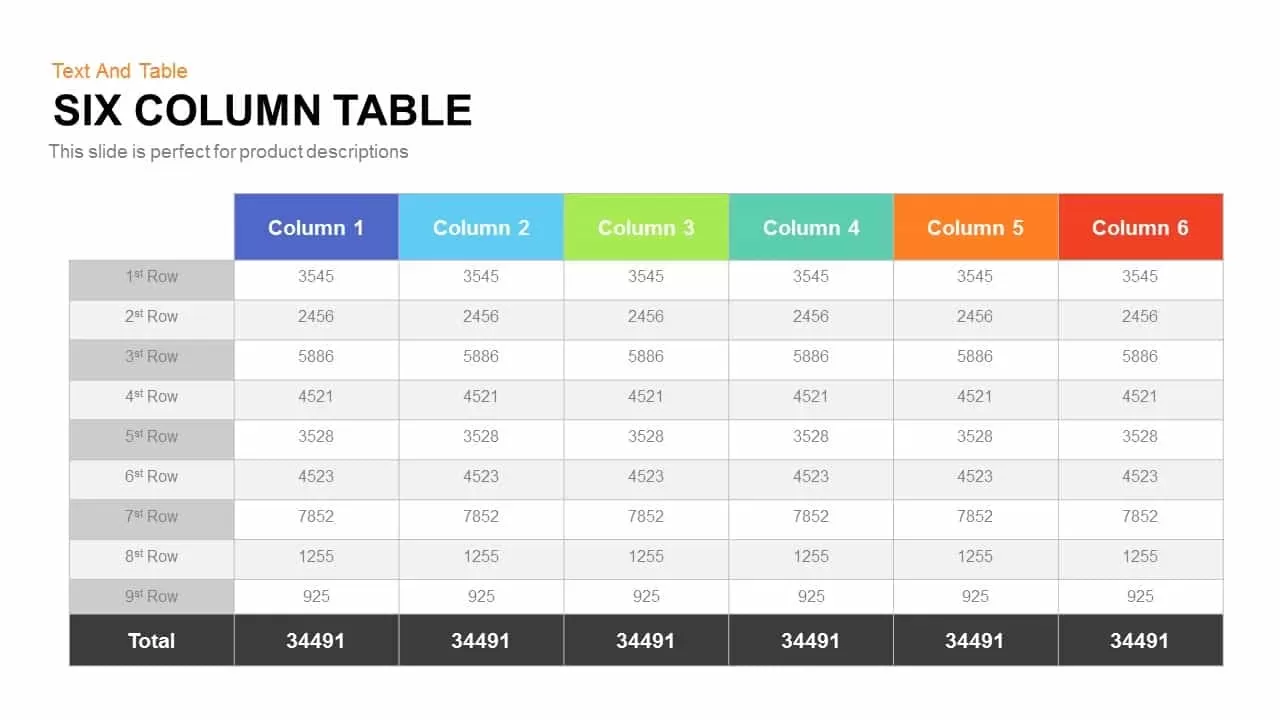
Six Column Table template for PowerPoint & Google Slides
Table
Four-Plan Pricing Table Comparison Template for PowerPoint & Google Slides
Comparison

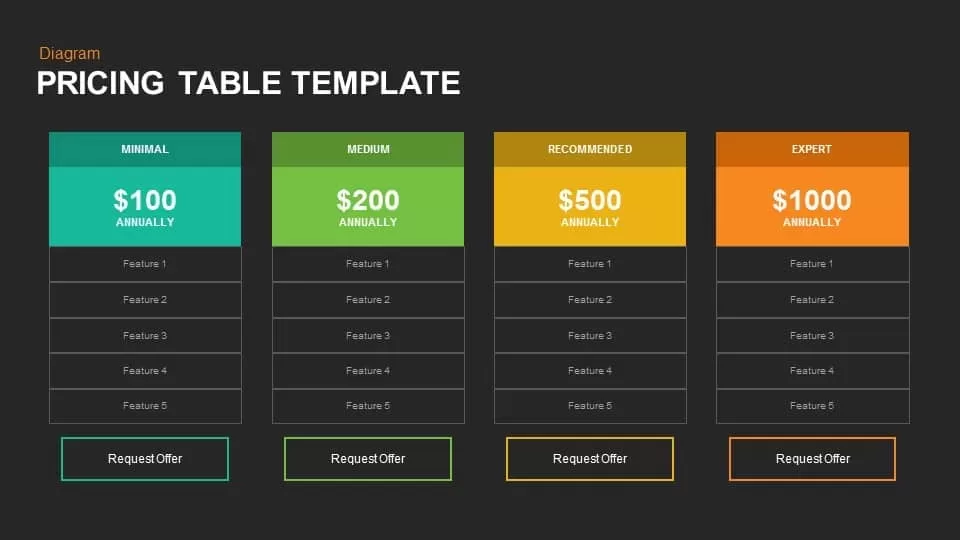
Pricing Table Template for PowerPoint & Google Slides
Business Proposal
Dynamic Multicolor Comparison Table Template for PowerPoint & Google Slides
Comparison
Puzzle-Style SWOT Analysis Table Diagram Template for PowerPoint & Google Slides
SWOT

Comparison Pricing Table Infographic Template for PowerPoint & Google Slides
Comparison Chart
PESTLE Analysis Table Layout Diagram Template for PowerPoint & Google Slides
PEST
Five-Option Text Boxes Table Comparison Template for PowerPoint & Google Slides
Business Report
Four-Stage Business Planning Table Template for PowerPoint & Google Slides
Business Plan
30 60 90 Day Plan Matrix Table Template for PowerPoint & Google Slides
Timeline
30-60-90 Business Plan Table Template for PowerPoint & Google Slides
Timeline
Table of Contents Presentation template for PowerPoint & Google Slides
Agenda
Six-Step Color-Coded Table of Contents Template for PowerPoint & Google Slides
Agenda
Six-Step Table of Contents Infographic Template for PowerPoint & Google Slides
Agenda
Eight-Step Colorful Table of Contents Template for PowerPoint & Google Slides
Infographics
Four-Section Table of Contents Template for PowerPoint & Google Slides
Agenda
Four-Part Table of Contents Infographic Template for PowerPoint & Google Slides
Agenda
Five-Step Table of Contents Presentation Template for PowerPoint & Google Slides
Agenda
Four-Step Numbered Table of Contents Template for PowerPoint & Google Slides
Agenda
Four-Step Table of Contents Presentation Template for PowerPoint & Google Slides
Agenda
Chevron Table of Contents Presentation Template for PowerPoint & Google Slides
Agenda
Four-Step Agenda Table of Contents Template for PowerPoint & Google Slides
Agenda
Modern Four-Step Table of Contents Template for PowerPoint & Google Slides
Agenda
Four-Step Strategic Table of Contents Template for PowerPoint & Google Slides
Agenda
Table of Contents Infographics template for PowerPoint & Google Slides
Company Profile
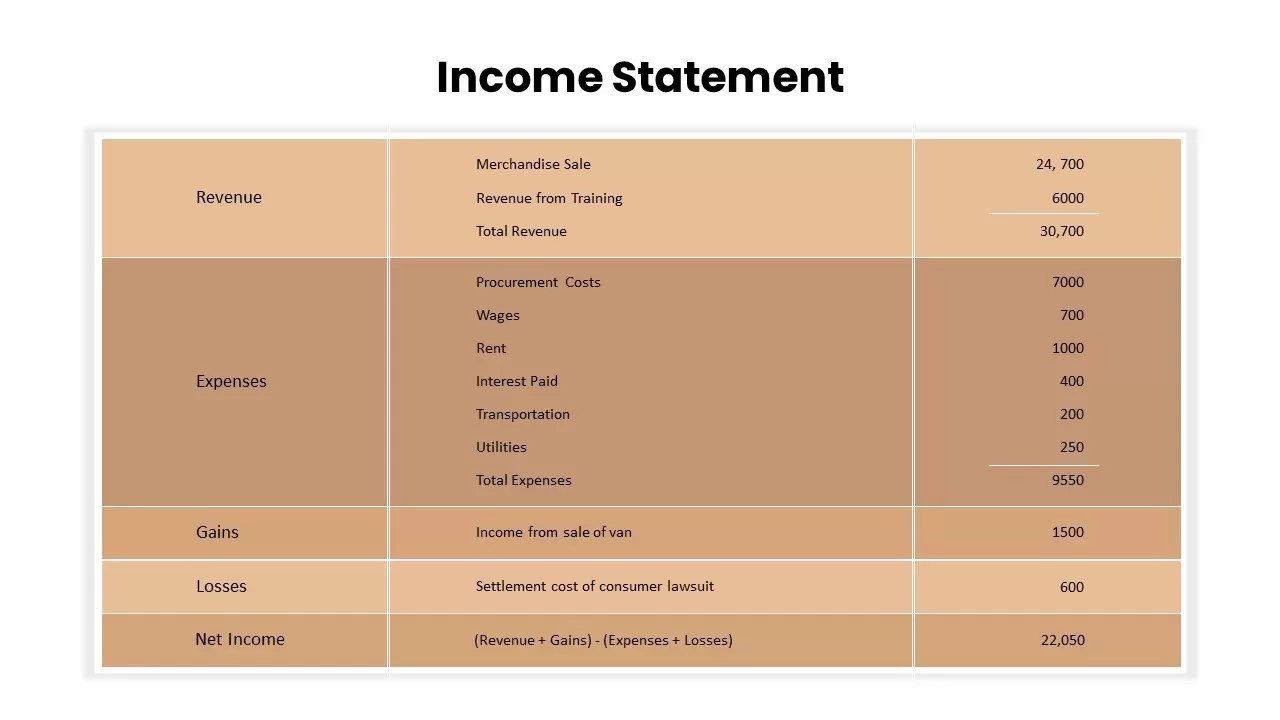
Income Statement Overview Table Template for PowerPoint & Google Slides
Finance
Project Status Dashboard Table Template for PowerPoint & Google Slides
Project Status
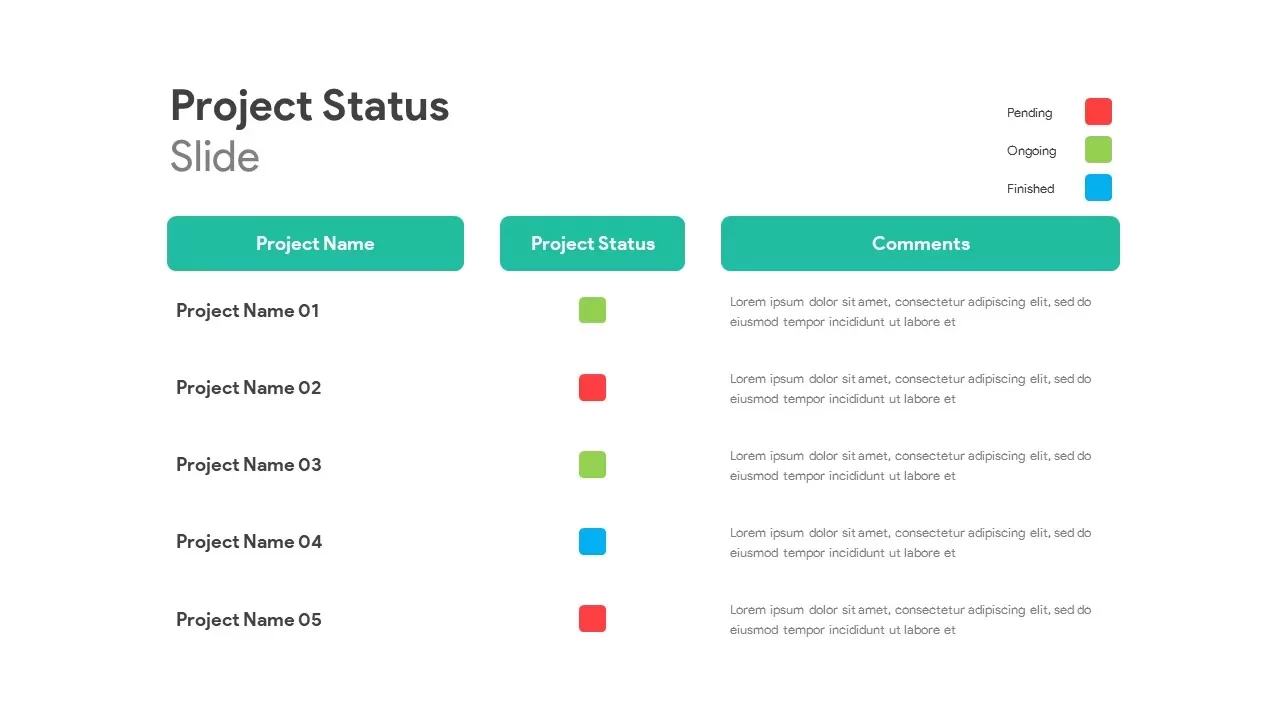
Project Status Table Template for PowerPoint & Google Slides
Project Status
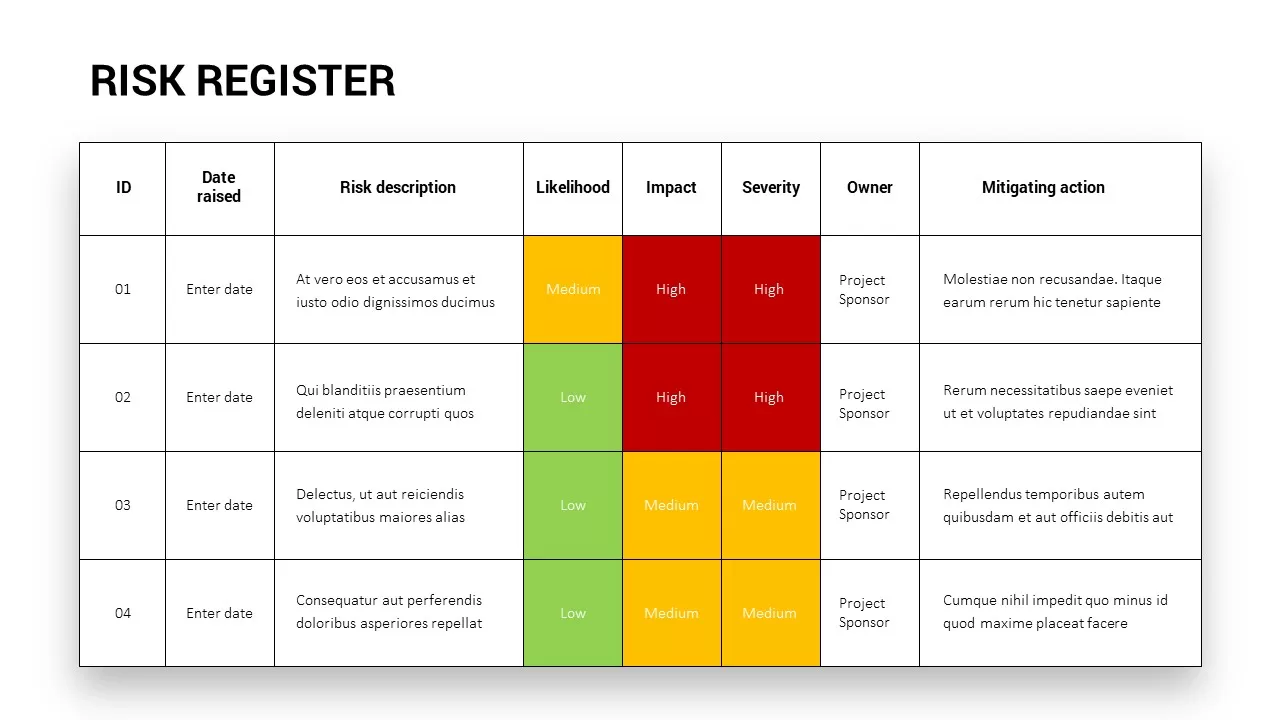
Comprehensive Risk Register Table Template for PowerPoint & Google Slides
Risk Management
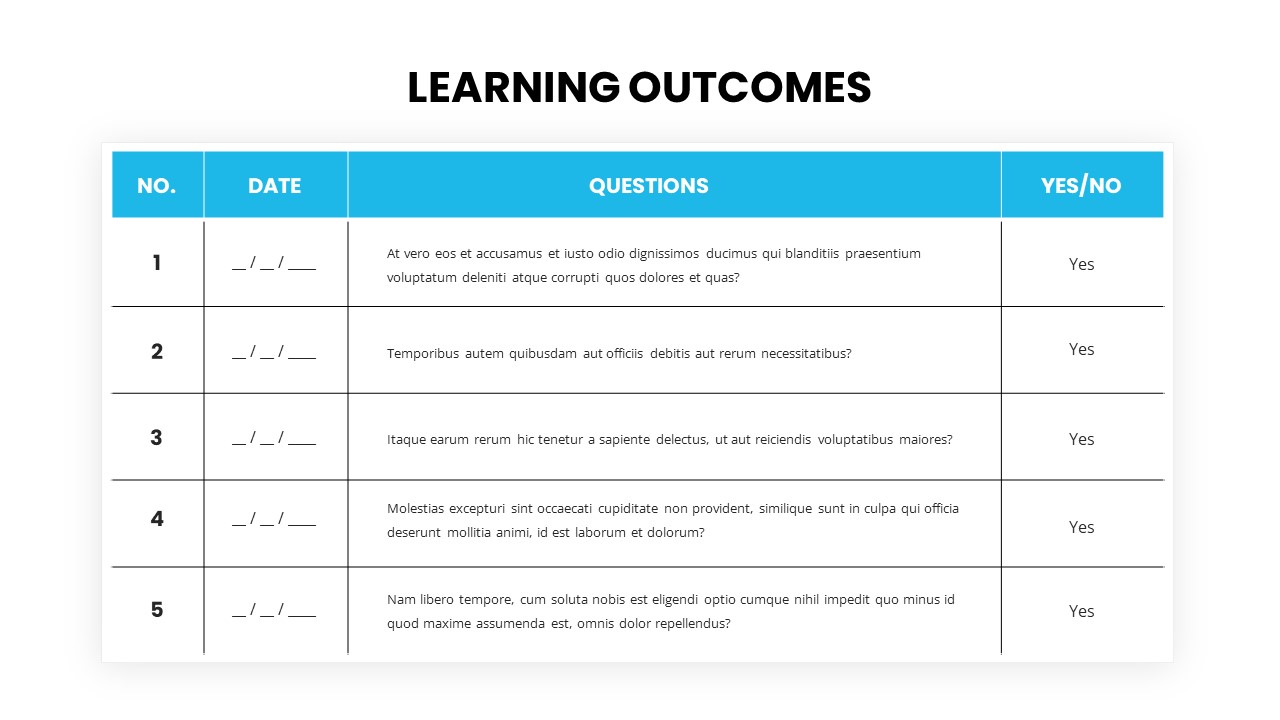
Learning Outcomes table template for PowerPoint & Google Slides
Charts
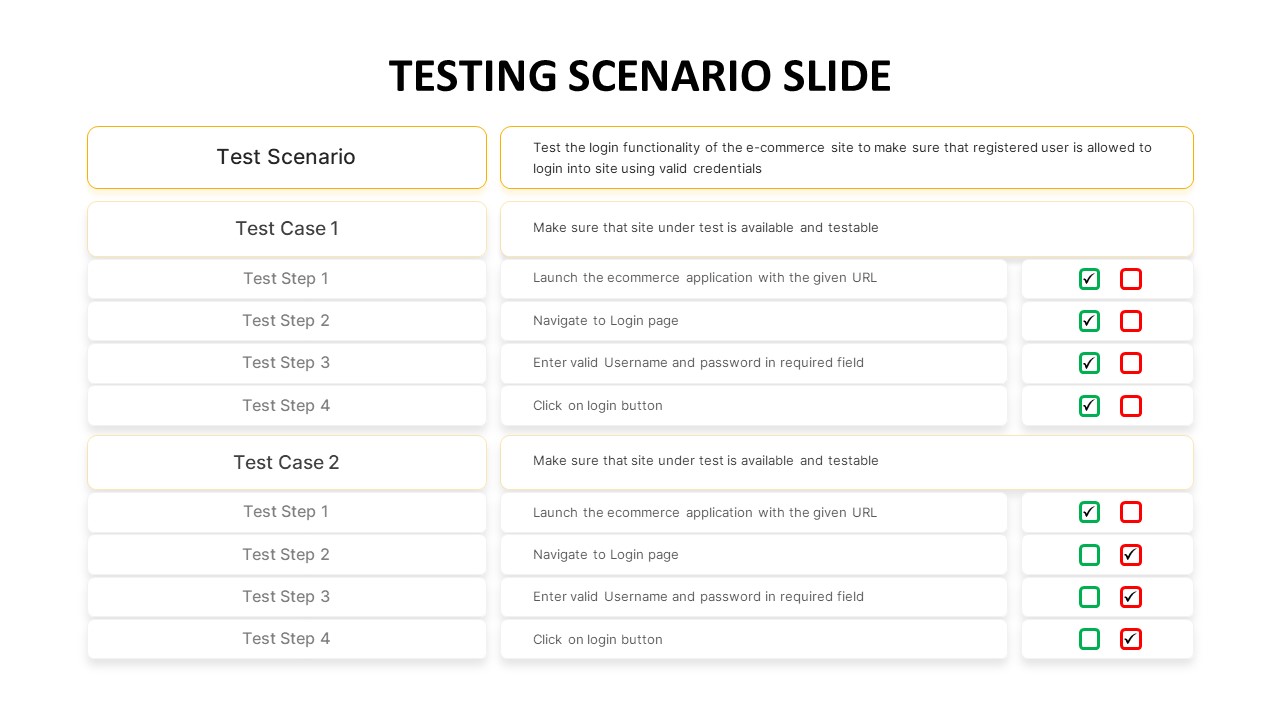
Testing Scenario Table Template for PowerPoint & Google Slides
Business Requirements
Comprehensive Resource Planning Table Template for PowerPoint & Google Slides
Project
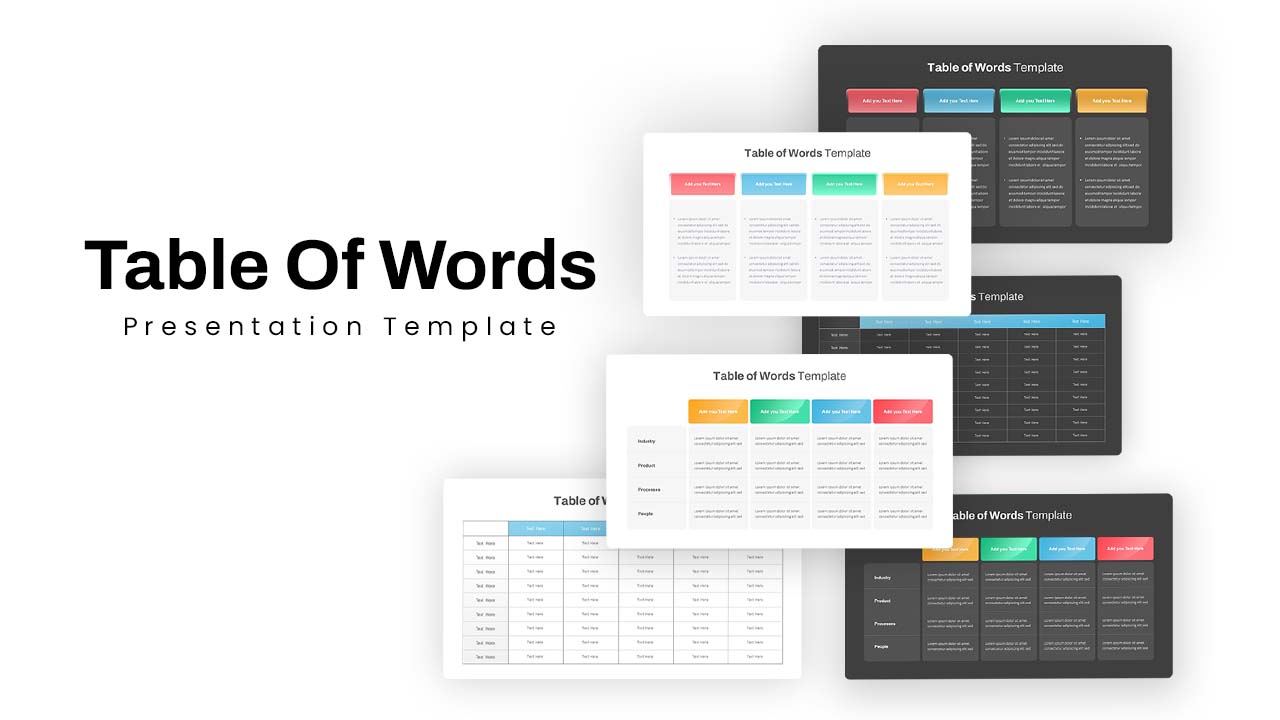
Versatile Table of Words Layout Template for PowerPoint & Google Slides
Table
Free Minimal Multi-Color Table of Contents Template for PowerPoint & Google Slides
Agenda
Free
Free Versatile Table Collection Template for PowerPoint & Google Slides
Pitch Deck
Free
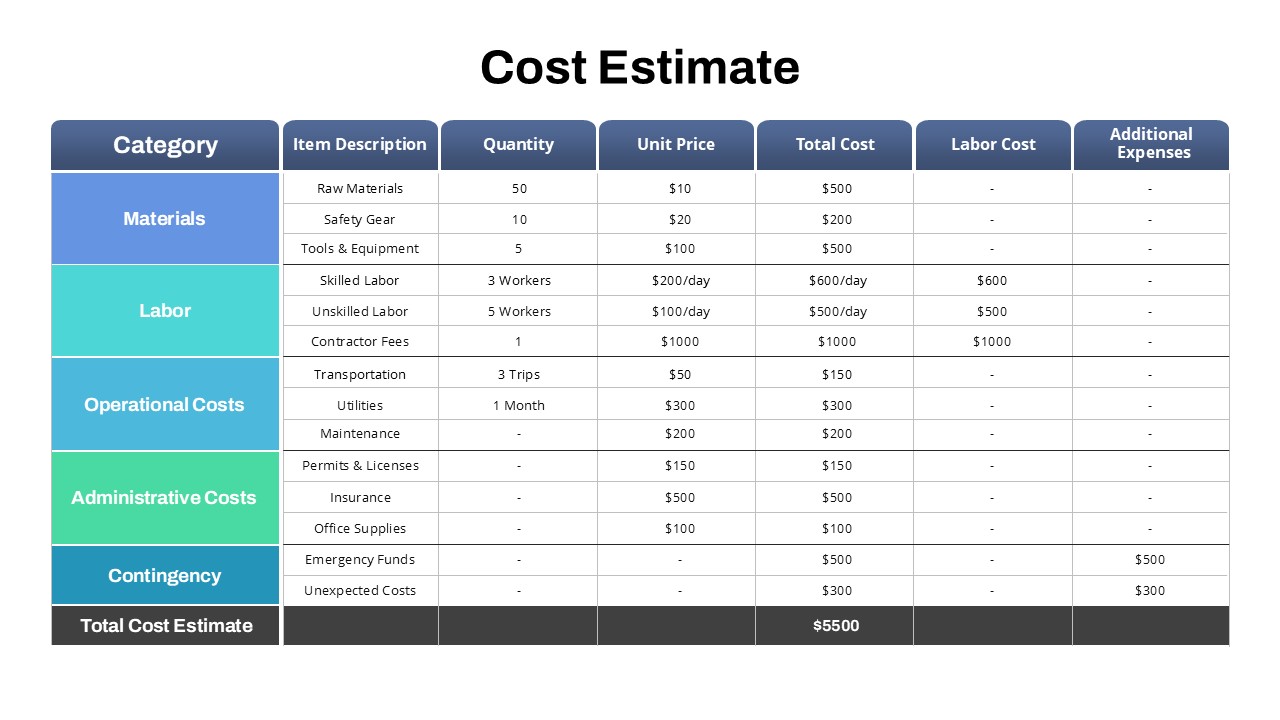
Project Detailed Cost Estimate Table Template for PowerPoint & Google Slides
Project
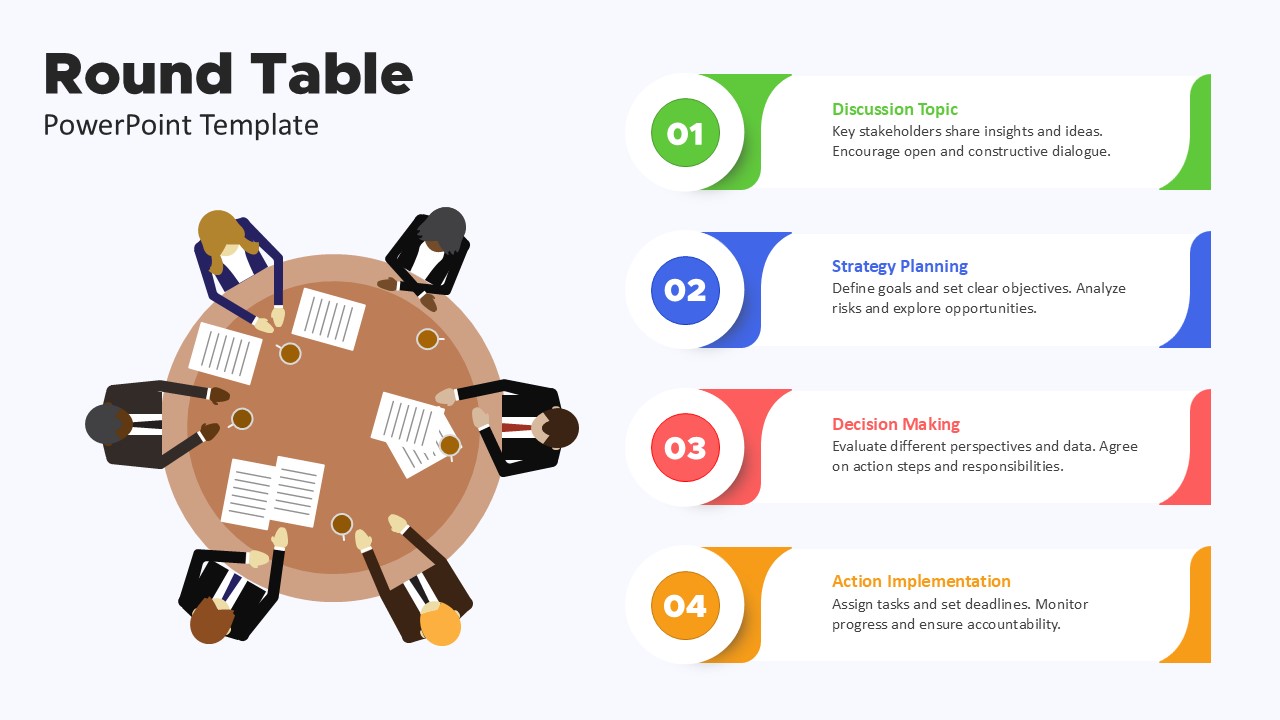
Title: Round Table Meeting Discussion Process Template for PowerPoint & Google Slides
Process
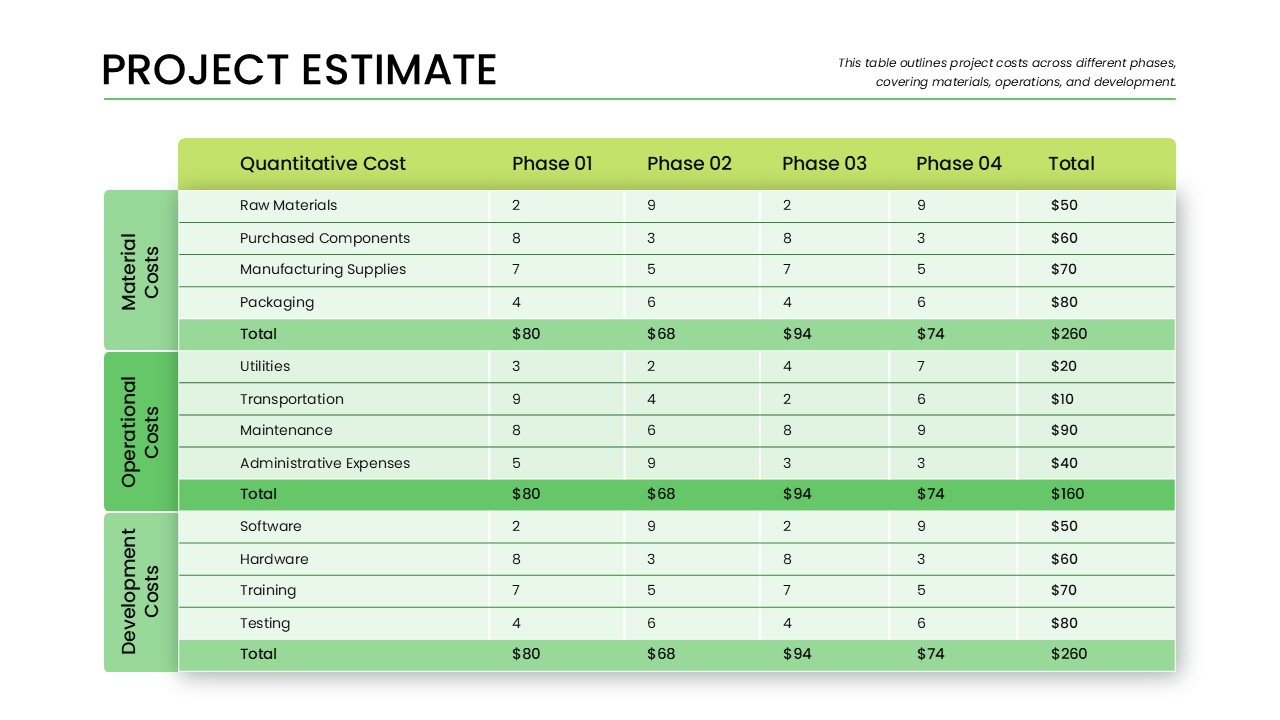
Phase-Wise Project Estimate Table Template for PowerPoint & Google Slides
Business Report
Professional Table of Organization Chart Template for PowerPoint & Google Slides
Org Chart
Two-Option Bar Chart Comparison Table Template for PowerPoint & Google Slides
Comparison
Progression Track Milestone Table Template for PowerPoint & Google Slides
Project Status
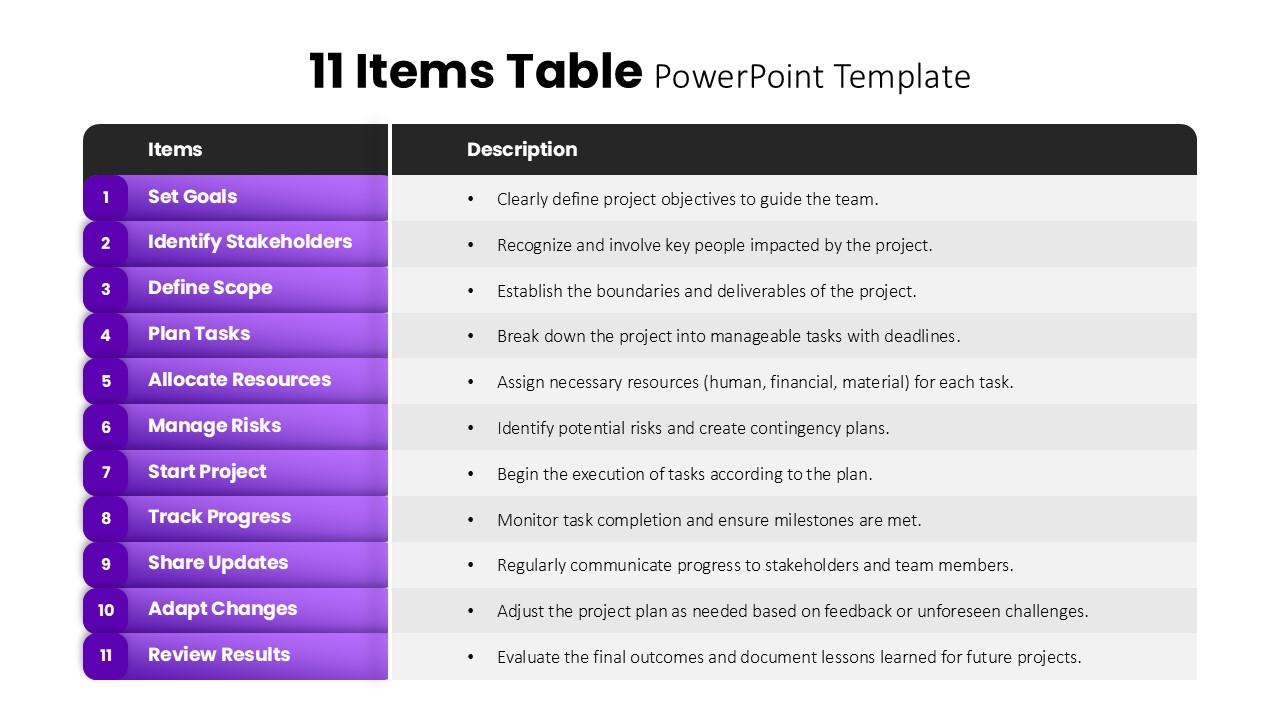
11 Items Table Project Planning Steps template for PowerPoint & Google Slides
Business
Product Feature Comparison Table Template for PowerPoint & Google Slides
Comparison Chart
Sales Growth Comparison Chart & Table Template for PowerPoint & Google Slides
Bar/Column
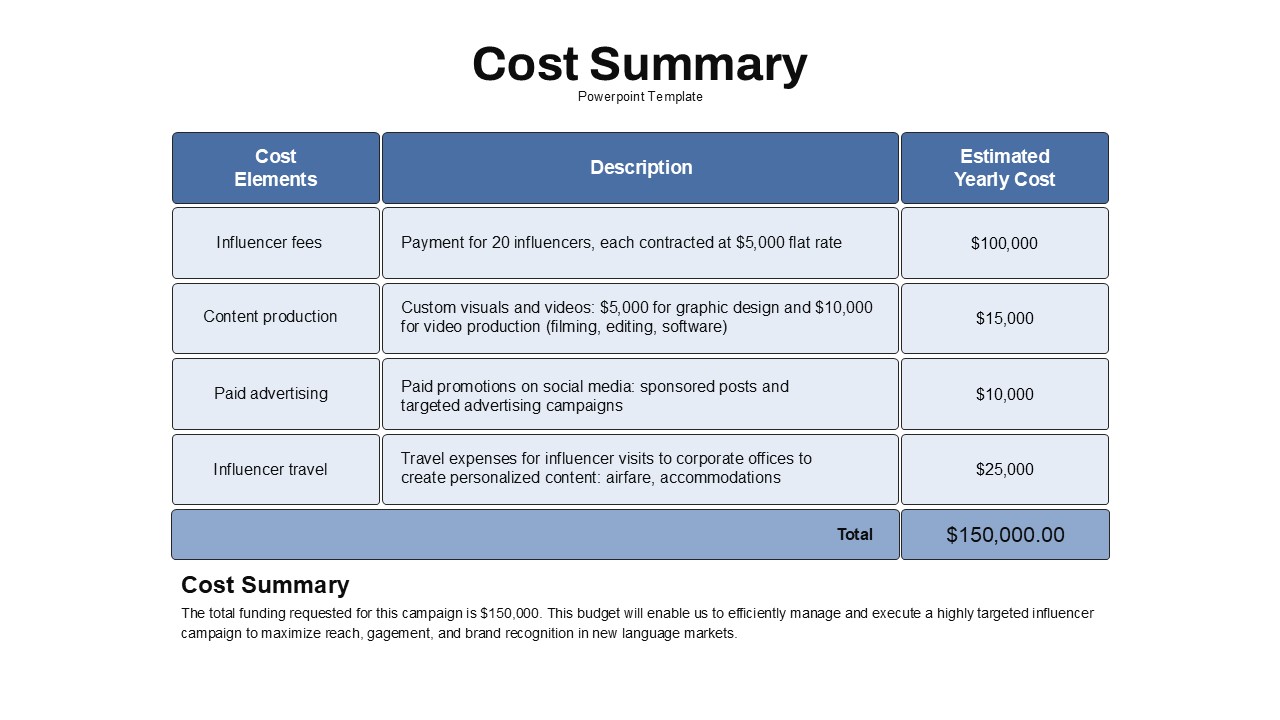
Cost Summary Table Template for PowerPoint & Google Slides
Business Report
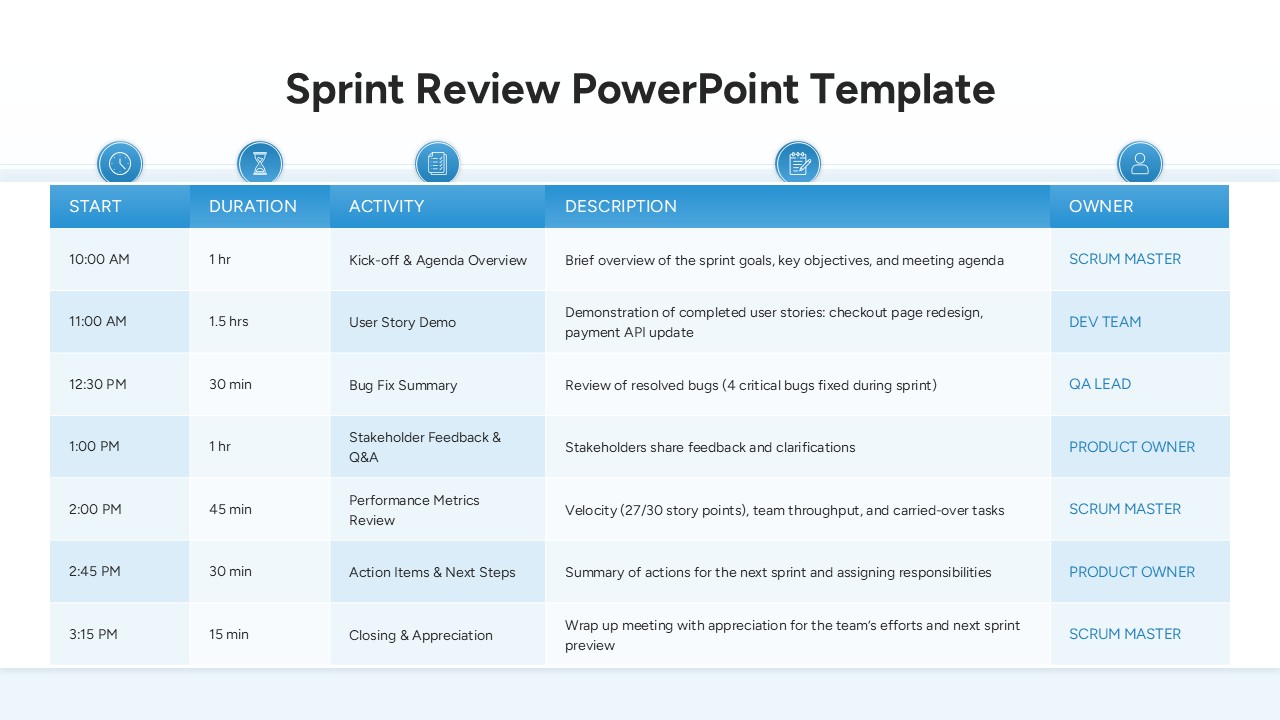
Sprint Review Meeting Agenda Table Template for PowerPoint & Google Slides
Agenda
Project Tracking Dashboard Table Template for PowerPoint & Google Slides
Project Status
Action Items Management Dashboard Table Template for PowerPoint & Google Slides
Project Status
Comprehensive Action Tracker Table Template for PowerPoint & Google Slides
Business
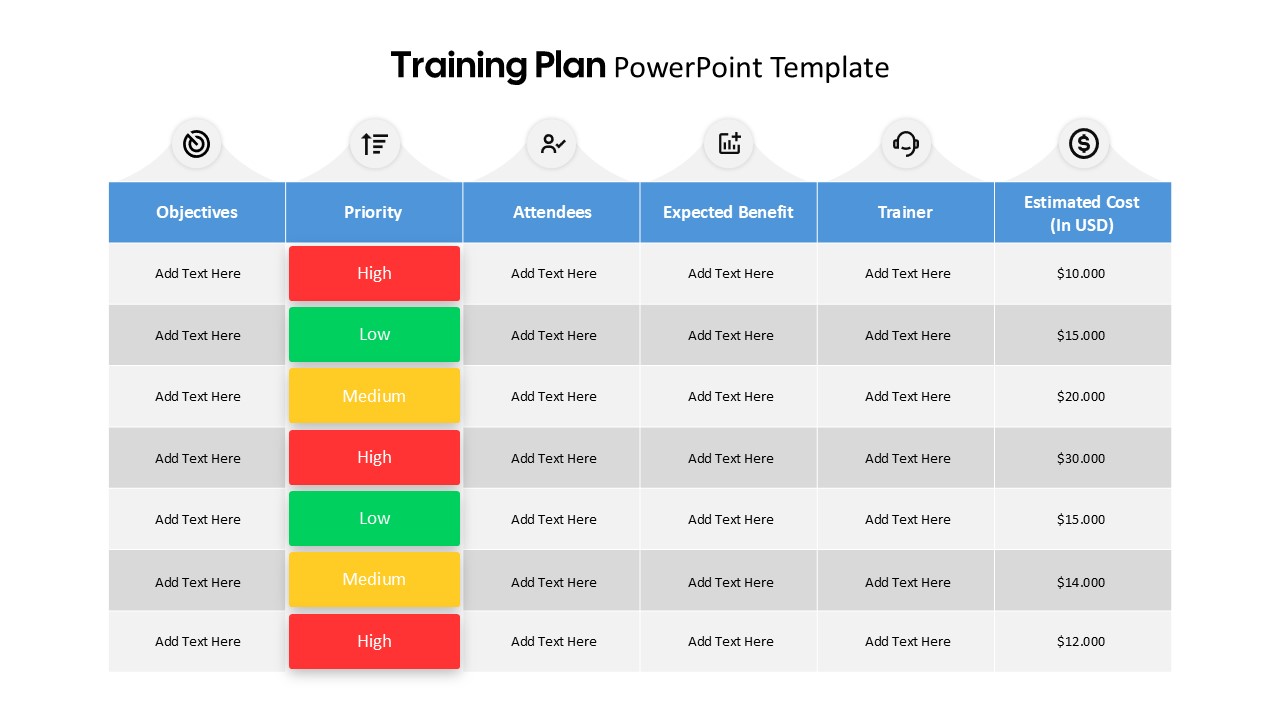
Training Plan Table Layout Template for PowerPoint & Google Slides
Employee Performance
Business Data Table Template for PowerPoint & Google Slides
Table
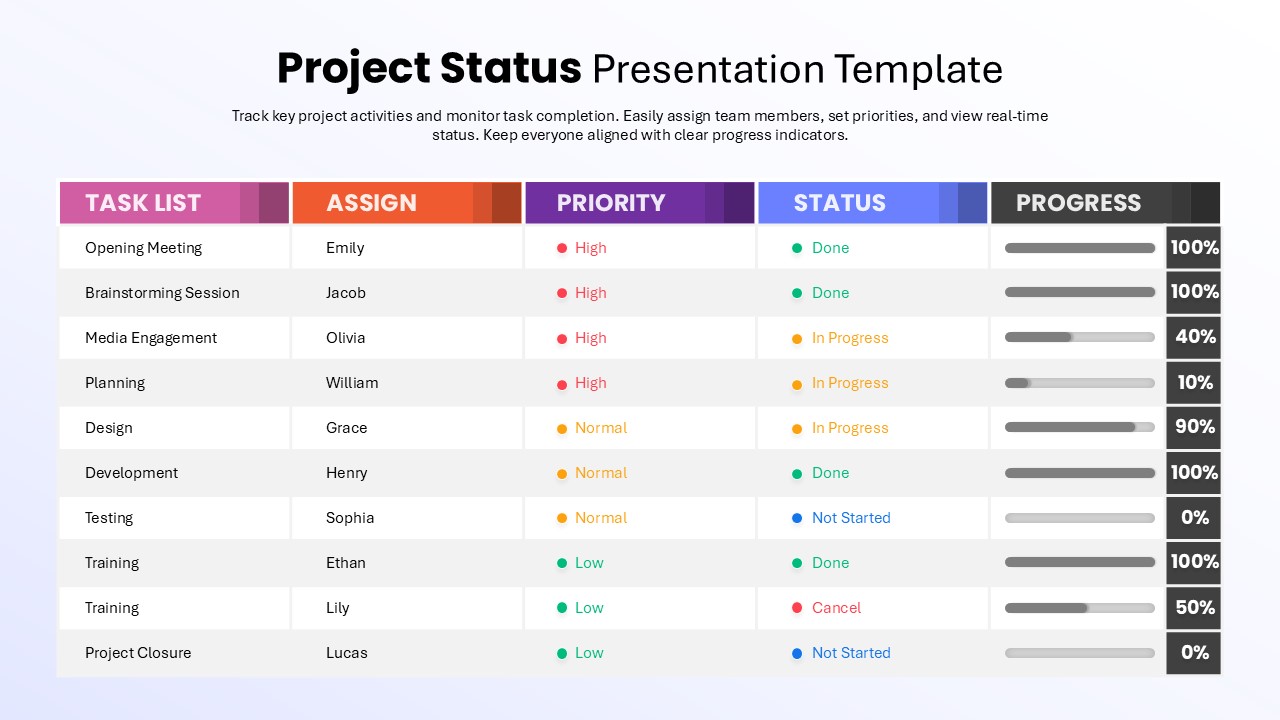
Dynamic Project Status Tracking Table Template for PowerPoint & Google Slides
Project Status
Multi-Column Table Presentation Template for PowerPoint & Google Slides
Table
Comparison Table Presentation Template for PowerPoint & Google Slides
Table
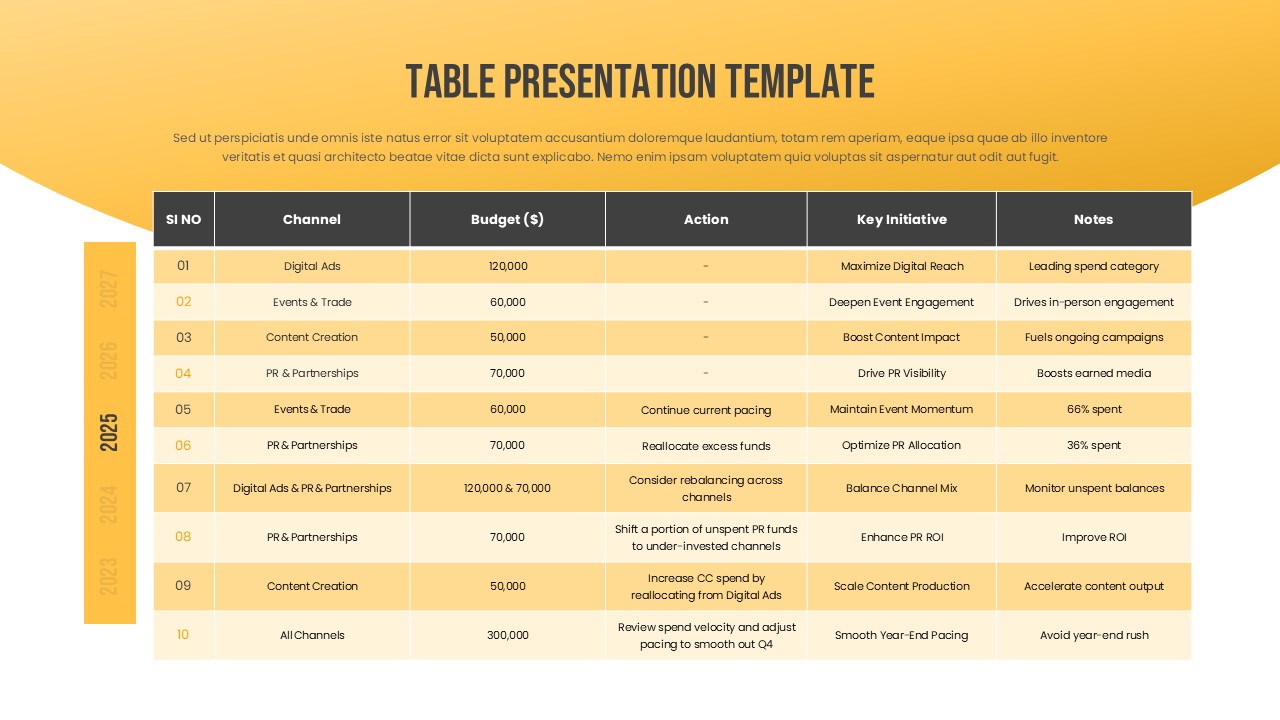
Marketing Budget Table Template for PowerPoint & Google Slides
Business
Project Status Update Dashboard Table Template for PowerPoint & Google Slides
Project Status
Six-Row Multi-Column Table Presentation Template for PowerPoint & Google Slides
Table
Colorful Comparison Table Presentation Template for PowerPoint & Google Slides
Table
Colorful Four-Column Table Layout Template for PowerPoint & Google Slides
Table
Colorful Business Data Comparison Table Template for PowerPoint & Google Slides
Table
Five Column Comparison Table Layout Template for PowerPoint & Google Slides
Comparison
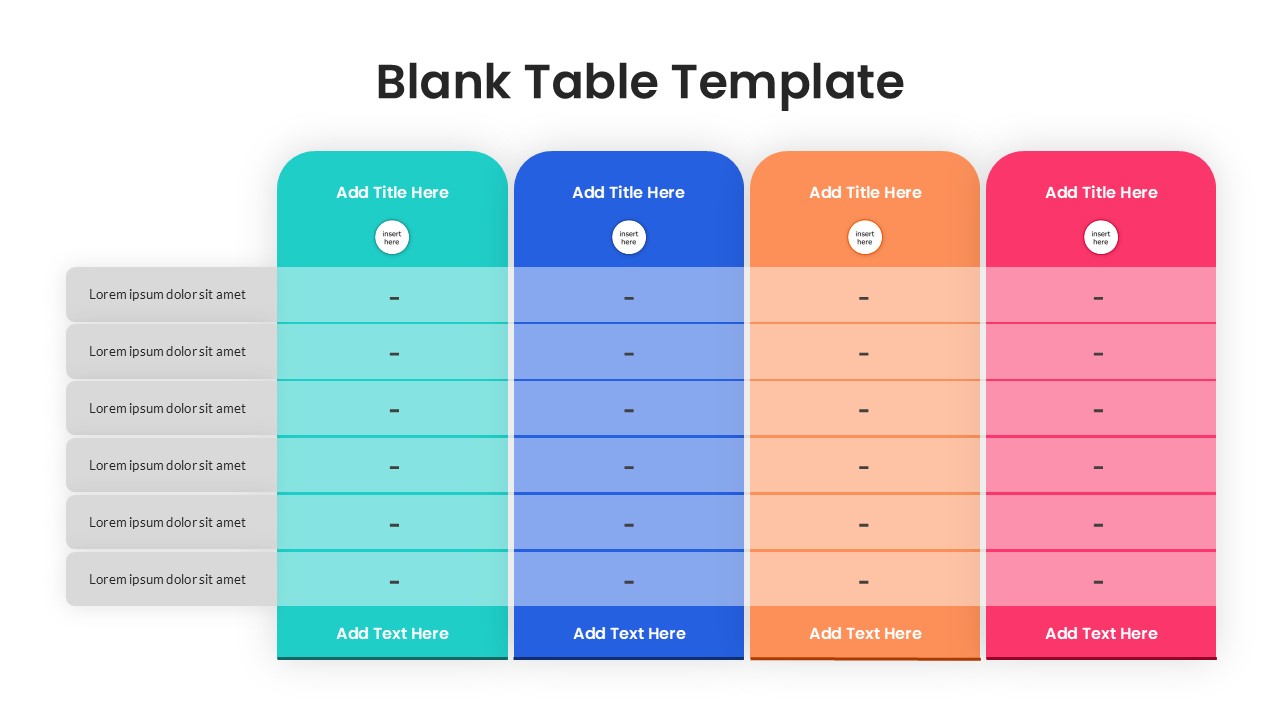
Blank Table Template for PowerPoint & Google Slides
Table
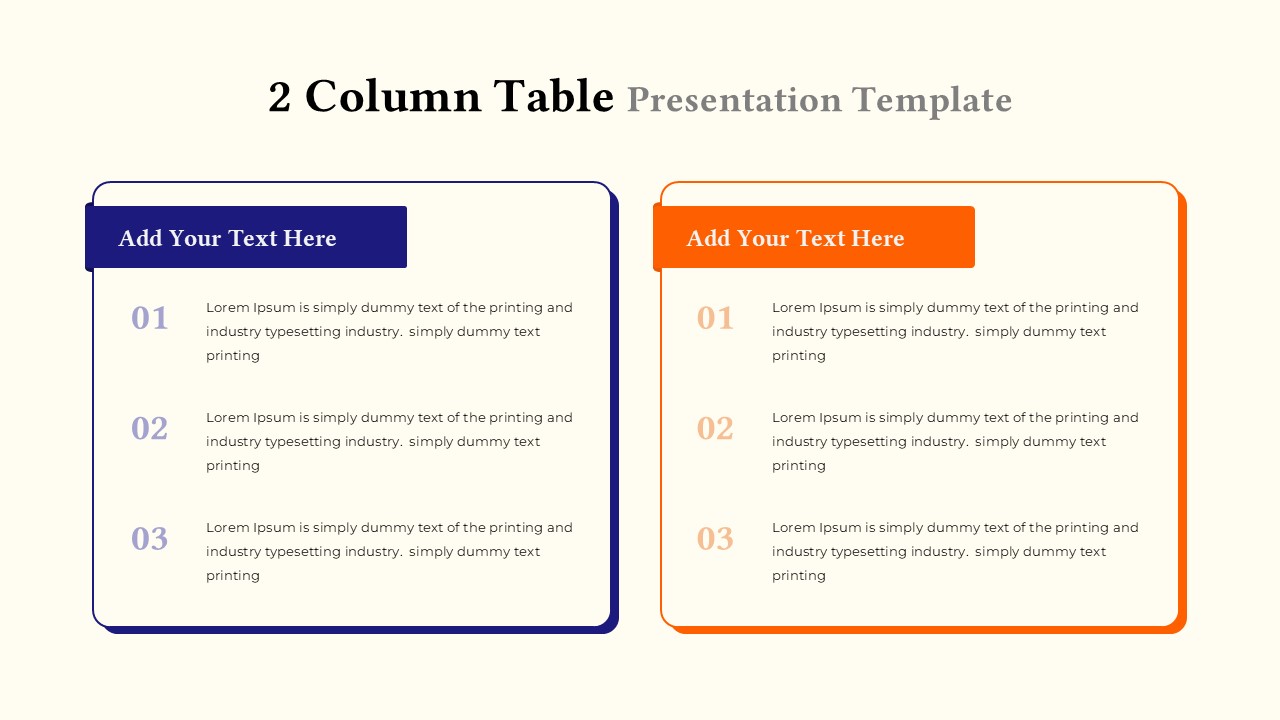
Two-Column Table Presentation Template for PowerPoint & Google Slides
Table
Six Column Data Table Template for PowerPoint & Google Slides
Table
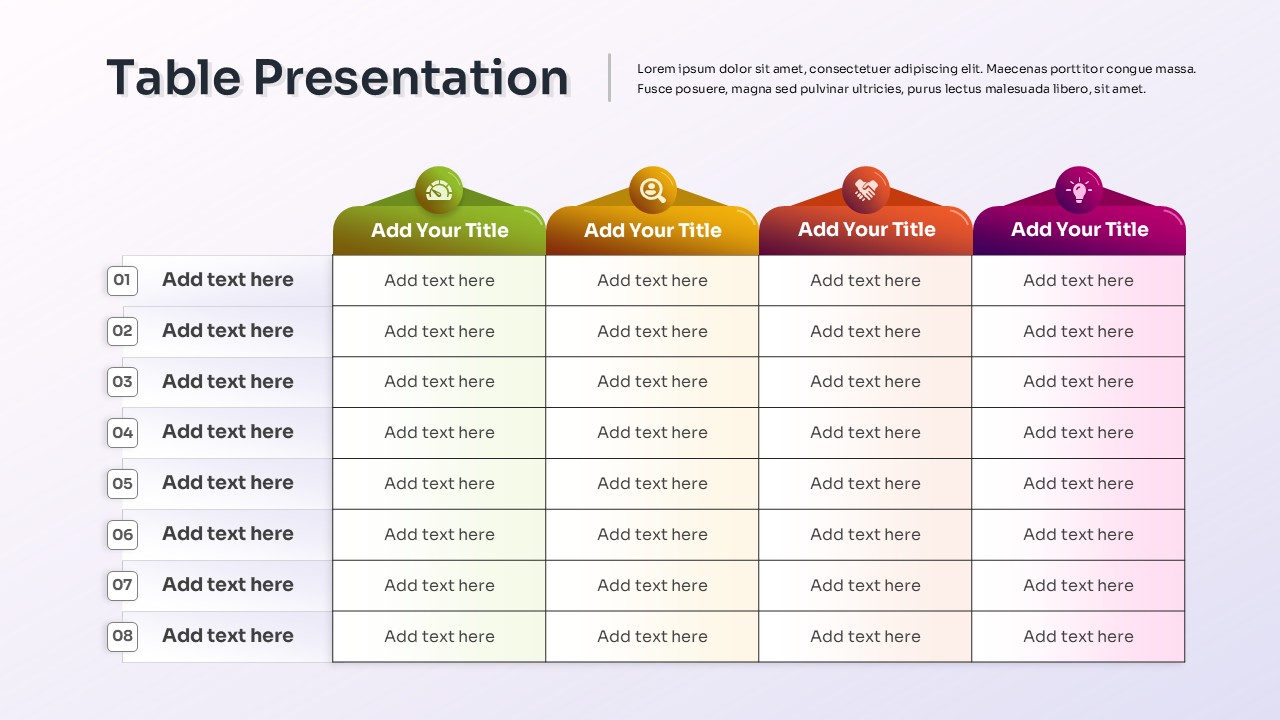
Colorful Table Presentation Template for PowerPoint & Google Slides
Table
Pros and Cons Comparison Table Template for PowerPoint & Google Slides
Comparison Chart
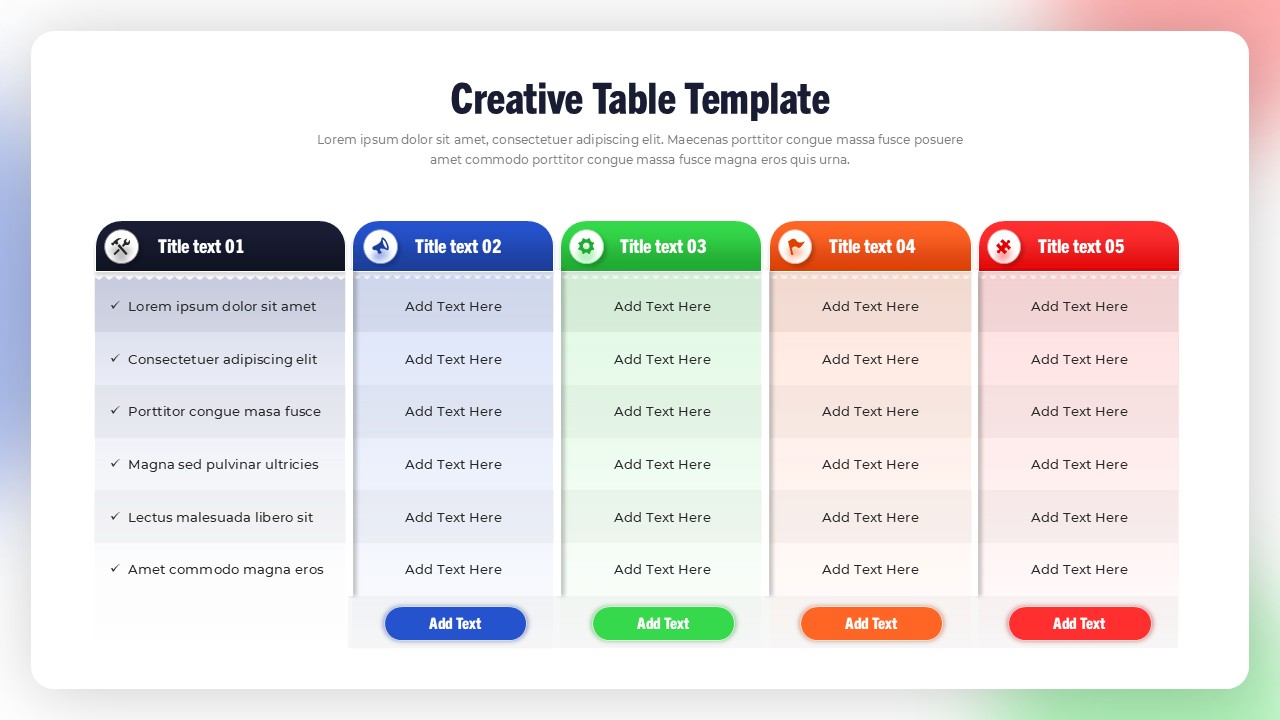
Creative Table Template for PowerPoint & Google Slides
Table

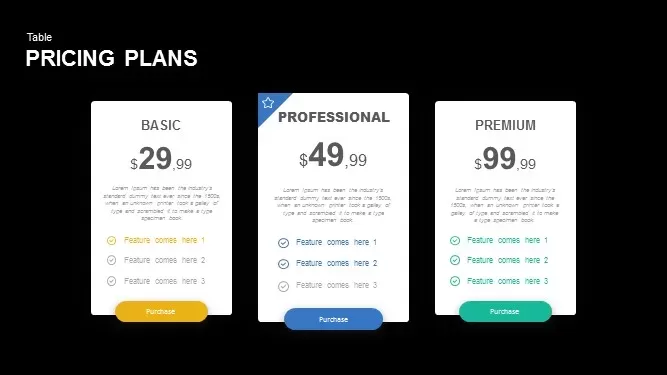
Pricing Plans Table for PowerPoint & Google Slides
Business Proposal
3D Column Chart with Data Table for PowerPoint & Google Slides
Bar/Column
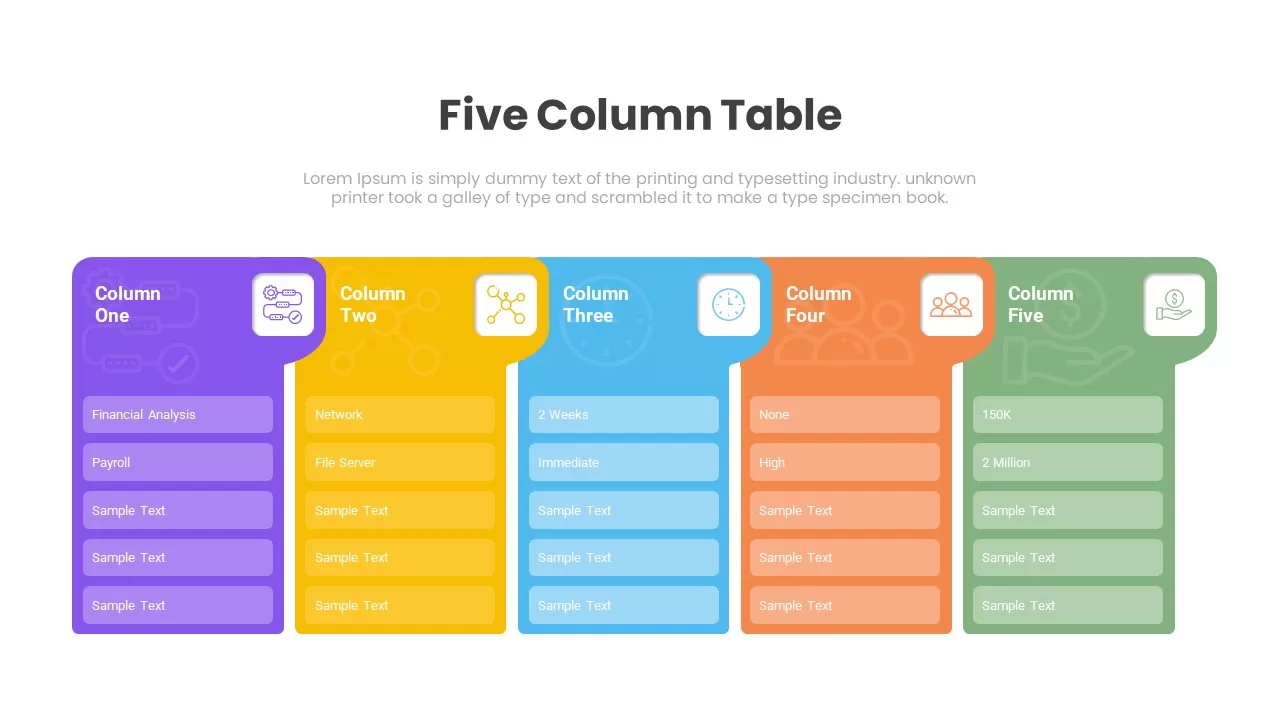
Five Column Table Infographics for PowerPoint & Google Slides
Business