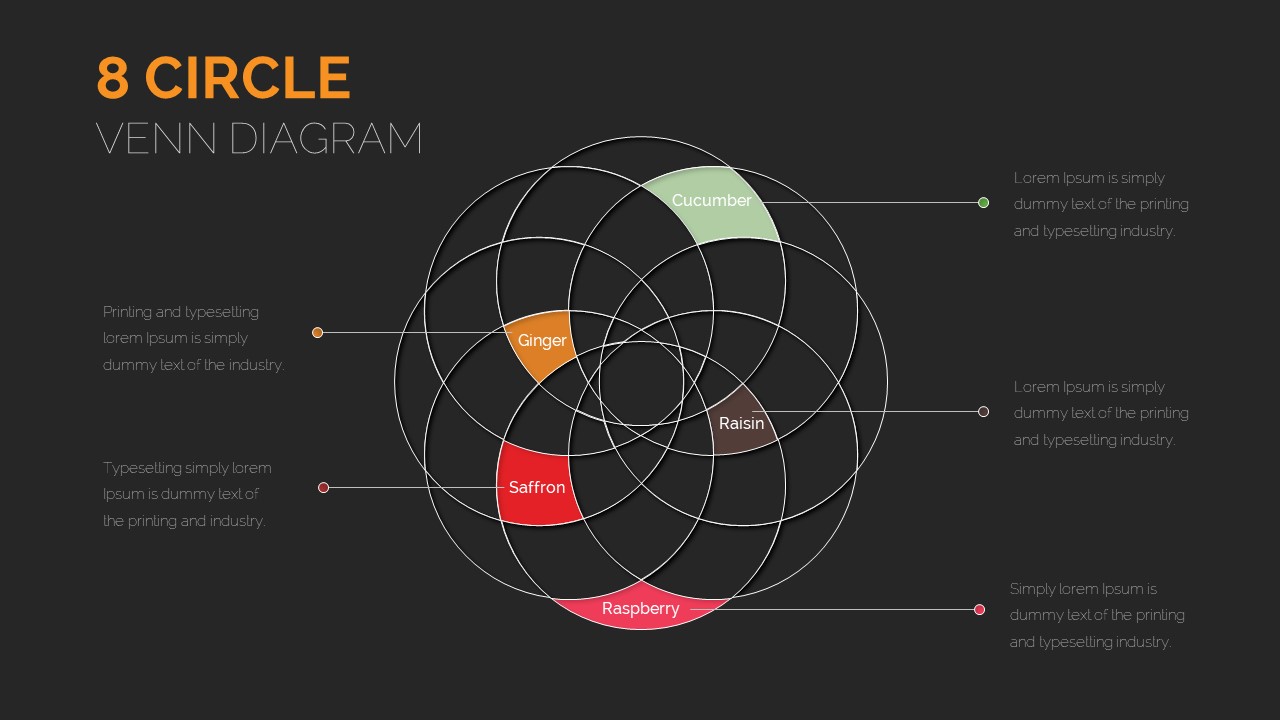
8 Circle Venn Diagram Infographic Design Template for PowerPoint & Google Slides


Description
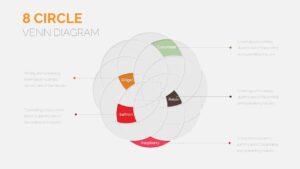
Leverage this eight-circle Venn diagram infographic to reveal complex relationships among multiple data sets. Each of the eight overlapping circles in this design represents a distinct group, color-coded in vibrant hues and outlined with subtle white strokes for emphasis. The interlocking layout highlights all possible intersections, enabling presenters to identify shared attributes, unique segments, and layered connections at a glance. Designed with a minimalist backdrop and crisp typography, this slide balances richly saturated fills and transparent overlaps, delivering a polished aesthetic that complements corporate and academic themes.
Built as a fully editable asset for PowerPoint and Google Slides, this template features customizable shapes, text placeholders, and master slides that streamline layout edits. Users can resize circles, adjust opacity levels, swap color schemes, and insert labels to match branding guidelines or pedagogical requirements. Whether illustrating market segment overlaps, classification criteria, or data set intersections, the eight-circle Venn diagram provides a clear, intuitive framework for organizing and presenting intricate information. Expand your library of circular visuals with our circular templates for more versatile diagram options.
Optimized for professional and educational presentations alike, this Venn diagram slide elevates data storytelling by emphasizing clarity and visual hierarchy. Its layered grouping supports comparative analyses, set theory examples, scientific classifications, stakeholder mappings, and cross-departmental reviews. The high-resolution design preserves detail across devices and printouts, while layered elements can be animated or highlighted to guide audience focus. With intuitive legends and effortless color overrides, this versatile diagram transforms complex insights into engaging, easy-to-follow visuals.
Seamless integration into existing slide decks enhances workflow efficiency, allowing bulk edits and color theme overrides in seconds. Advanced users can leverage grouped layers and animation presets to spotlight specific intersections or reveal sequences step-by-step. Ideal for market research, academic lectures, strategic planning, and workshop sessions, this eight-circle Venn diagram template adapts to diverse content areas, making it a go-to resource for clear, impactful presentations.
Who is it for
Marketing professionals, business analysts, educators, and researchers will benefit from this eight-circle Venn diagram when comparing overlapping data segments, illustrating set theory examples, or presenting multifactorial relationships. Consultants, project managers, and academic instructors can leverage its clear, color-coded intersections to communicate insights effectively in strategic workshops, market reports, lessons, and boardroom presentations.
Other Uses
Apart from data comparisons, repurpose this diagram for stakeholder mapping, risk assessment matrices, product positioning analyses, taxonomy classifications, and workflow overlap studies. For layered hierarchical visualizations, the five-layer concentric circles template can complement this Venn diagram, adding depth to multi-tiered presentations. To depict radial relationships or interconnected spokes, try the multi-layout circle spoke diagram for a structured, eye-catching approach. These templates work together to enhance training sessions, conference talks, investor pitches, and academic lectures, providing versatile circular diagram solutions.
Login to download this file

Item ID
SB03455
Related Templates

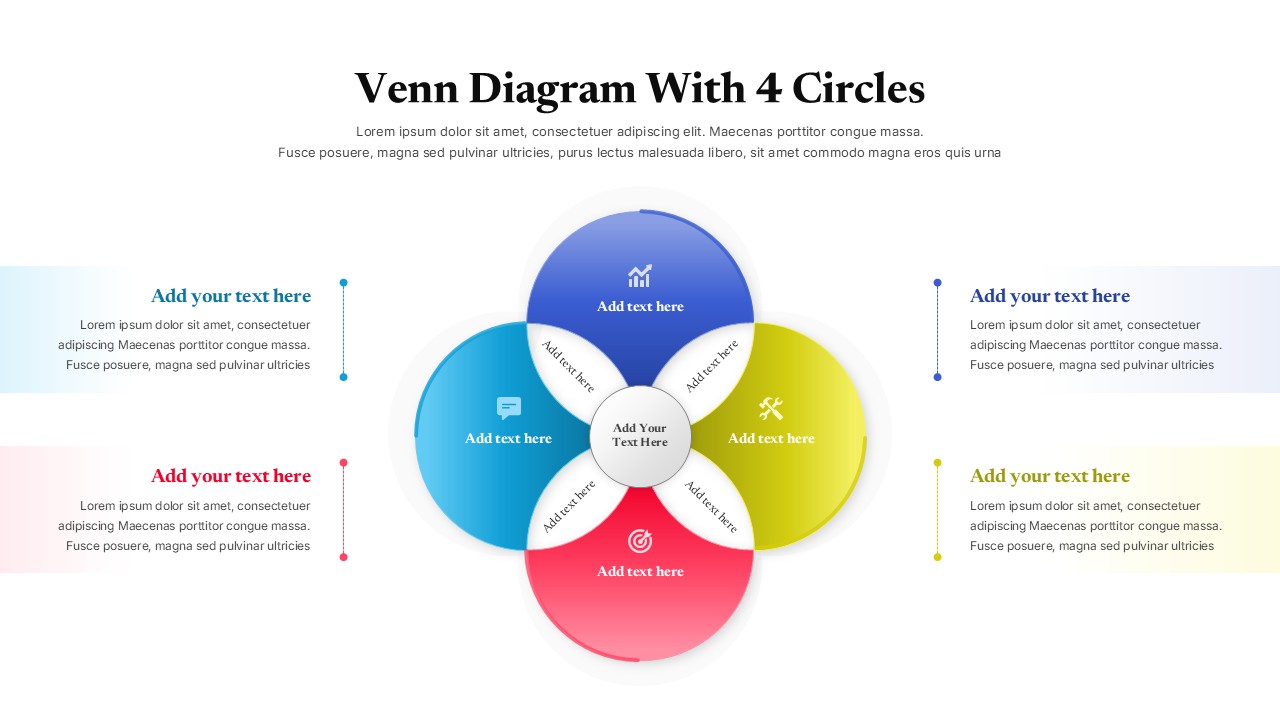
Four-Circle Venn Process Diagram template for PowerPoint & Google Slides
Process

Creative Three-Circle Venn Diagram Template for PowerPoint & Google Slides
Comparison
Five Circle Venn Diagram for Template for PowerPoint & Google Slides
Circular
Professional 6 Circle Venn Diagram Template for PowerPoint & Google Slides
Circular
Colorful Venn Diagram with 4 Circle for PowerPoint & Google Slides
Circular
Modern Gear Venn Diagram Infographic Template for PowerPoint & Google Slides
Comparison
Salience Model Venn Diagram Infographic Template for PowerPoint & Google Slides
Circular
Venn Diagram Infographics Pack Template for PowerPoint & Google Slides
Circular
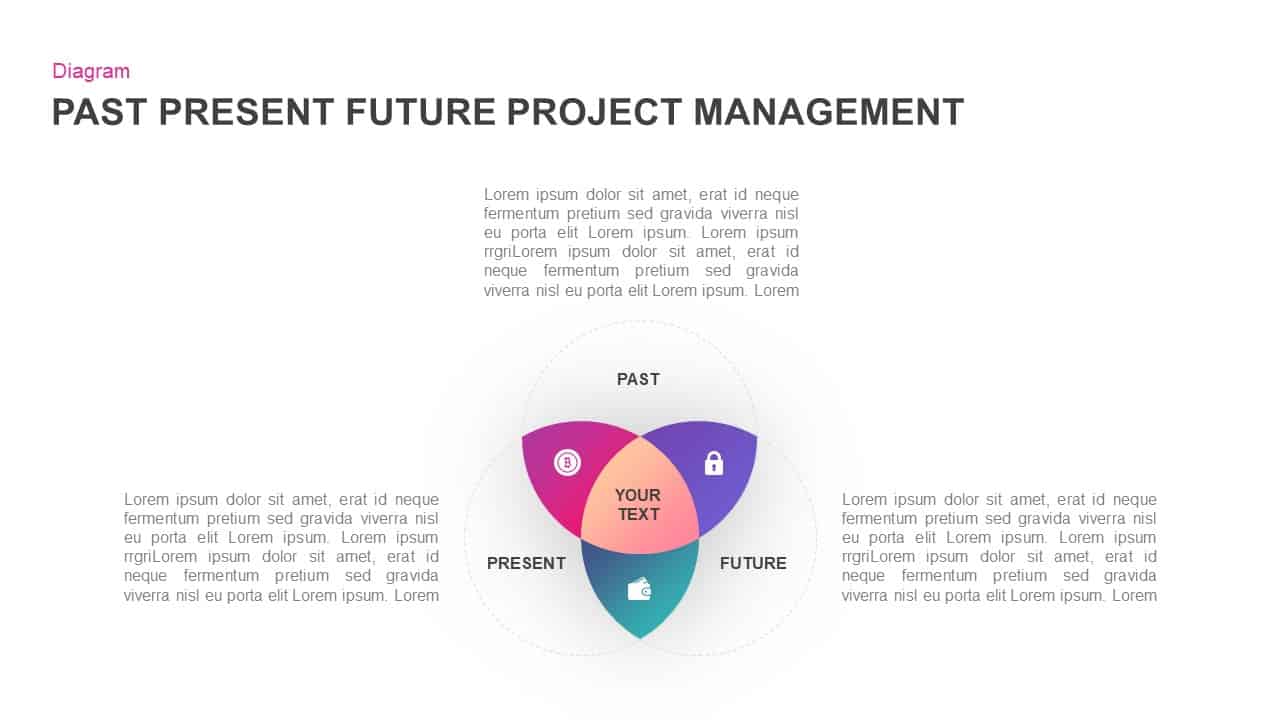
Past, Present & Future Venn Diagram Template for PowerPoint & Google Slides
Comparison
Colorful Venn Diagram Infographics Template for PowerPoint & Google Slides
Circular
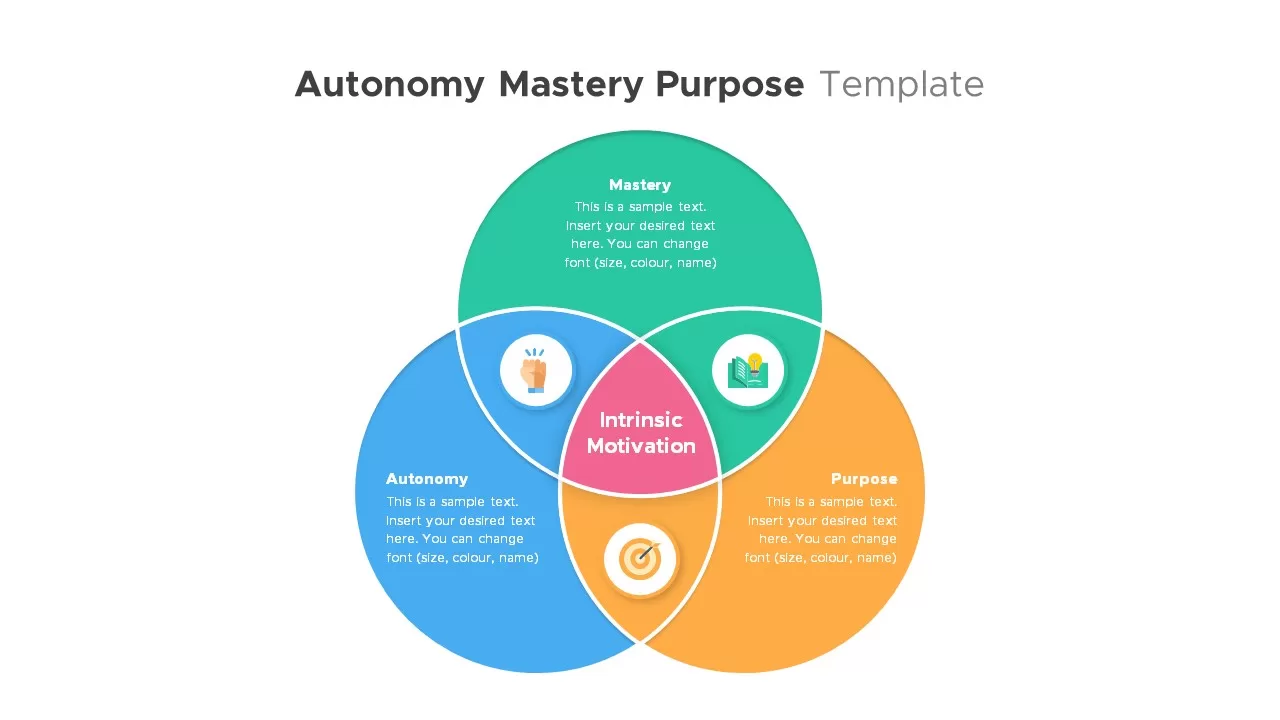
Autonomy, Mastery & Purpose Venn Diagram Template for PowerPoint & Google Slides
Circular
Free Simple Venn Diagram Overview template for PowerPoint & Google Slides
Comparison Chart
Free
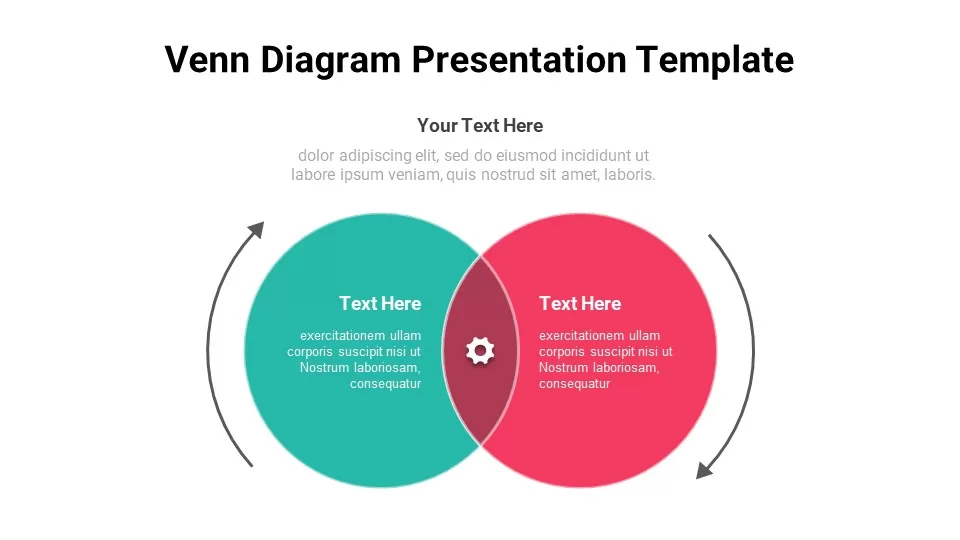
Free Venn Diagram template for PowerPoint & Google Slides
Charts
Free
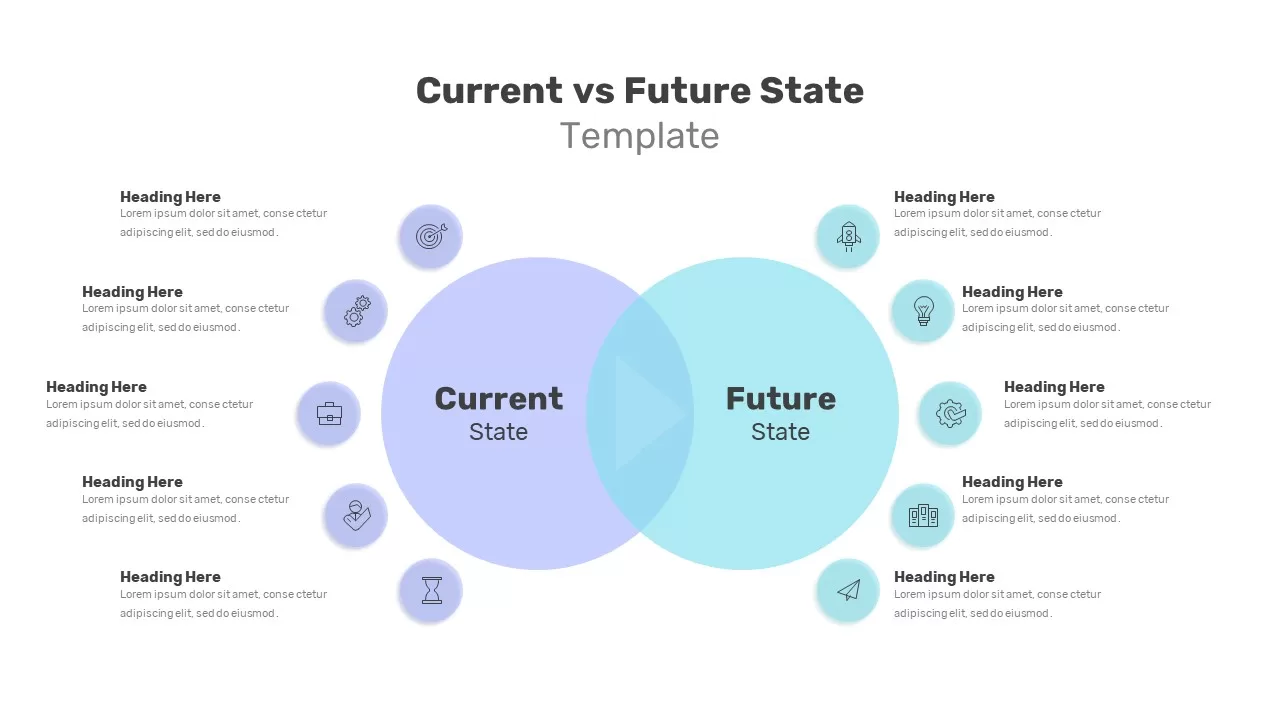
Current vs Future State Venn Diagram Template for PowerPoint & Google Slides
Comparison
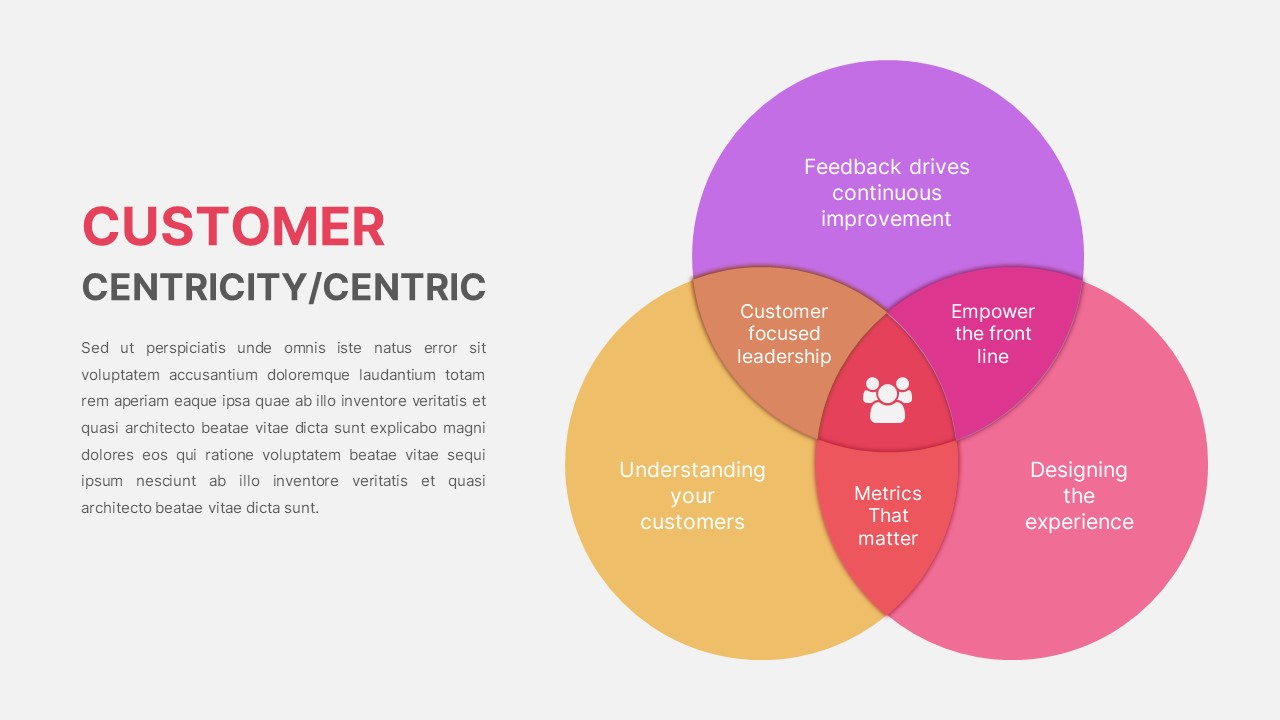
Customer Centricity Venn Diagram template for PowerPoint & Google Slides
Infographics
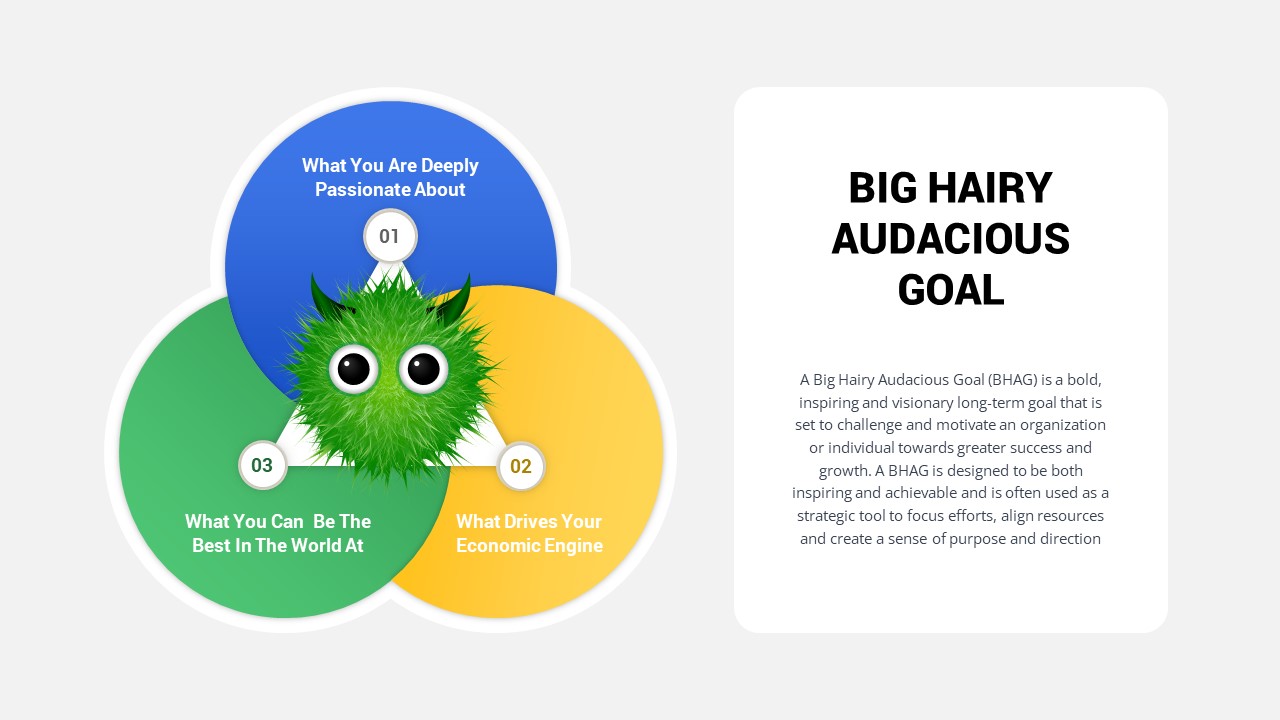
Big Hairy Audacious Goal Venn Diagram Template for PowerPoint & Google Slides
Circular
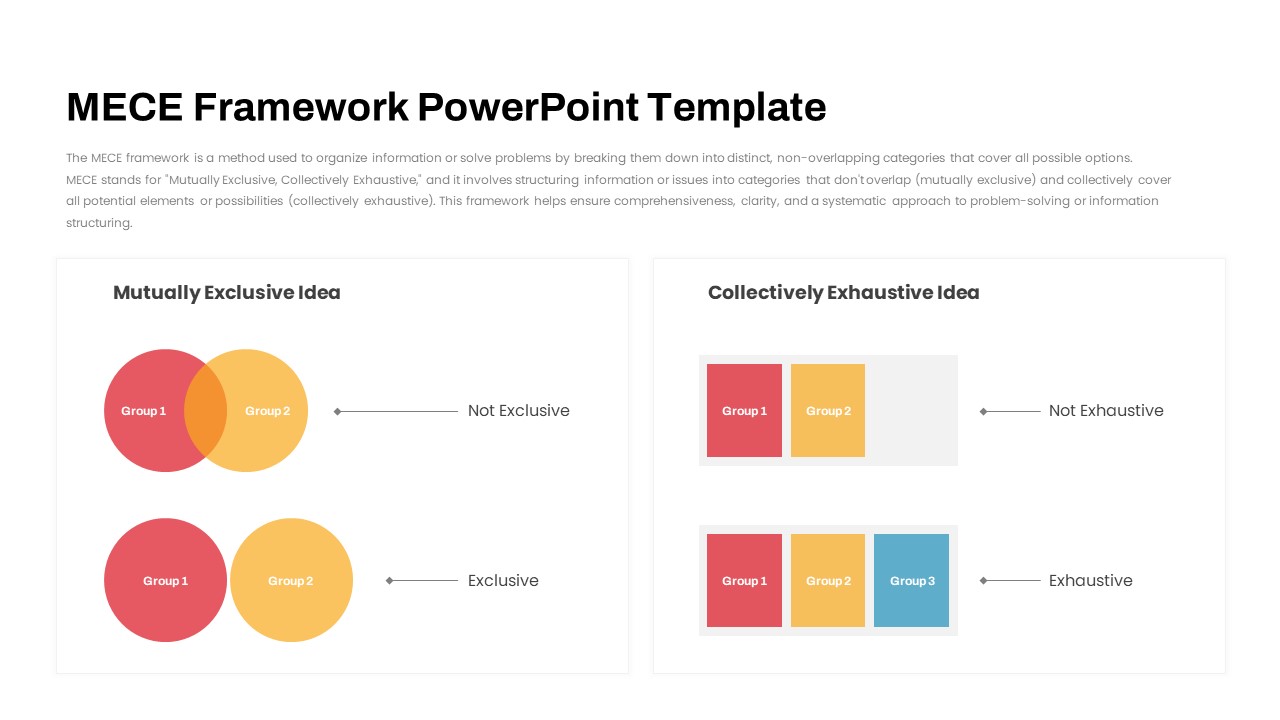
MECE Framework Venn & Block Diagram Template for PowerPoint & Google Slides
Comparison
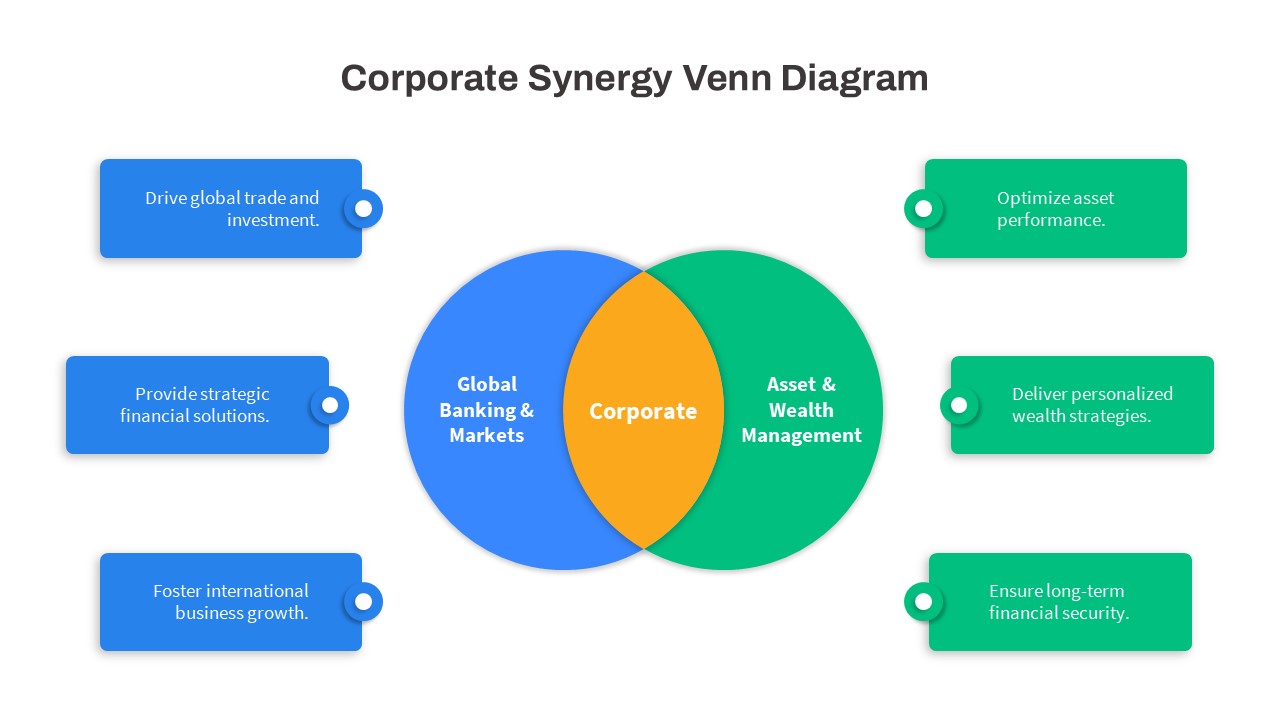
Corporate Synergy Venn Diagram Template for PowerPoint & Google Slides
Comparison
Modern Growth Hacking Venn Diagram Template for PowerPoint & Google Slides
Circular
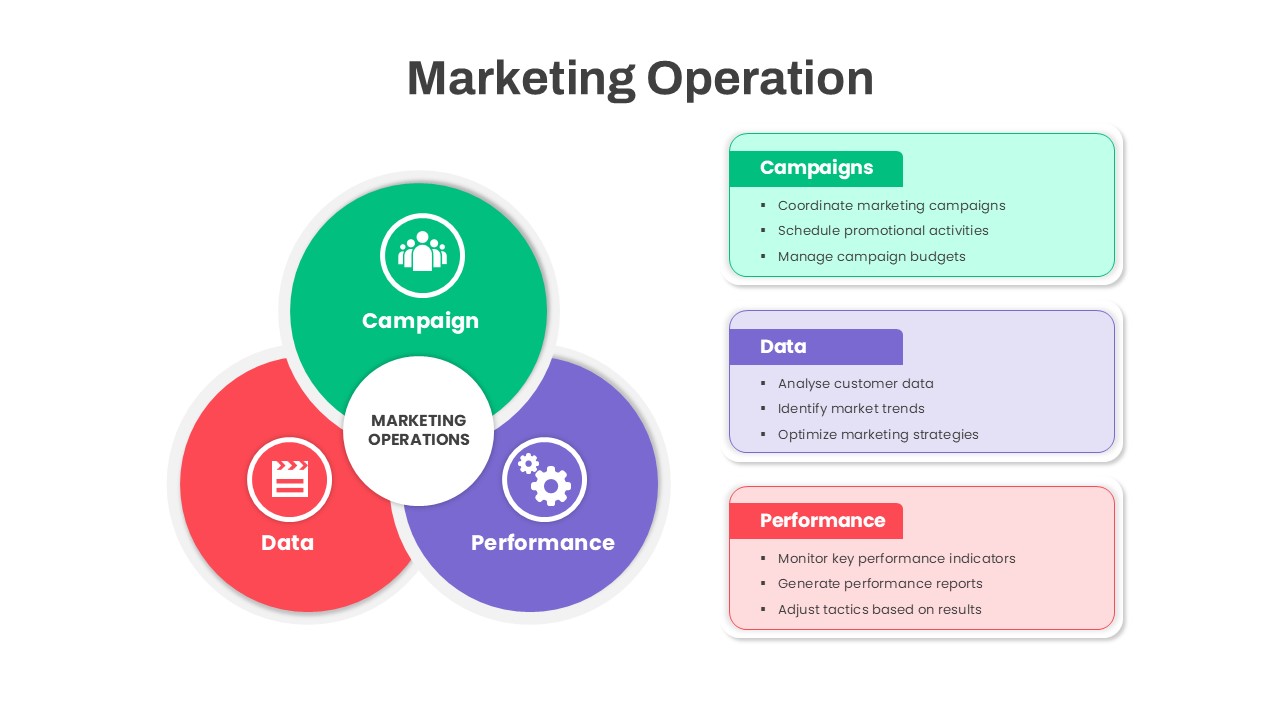
Marketing Operations Venn Diagram Template for PowerPoint & Google Slides
Circular
3Ps Triple Bottom Line Venn Diagram Template for PowerPoint & Google Slides
Circular
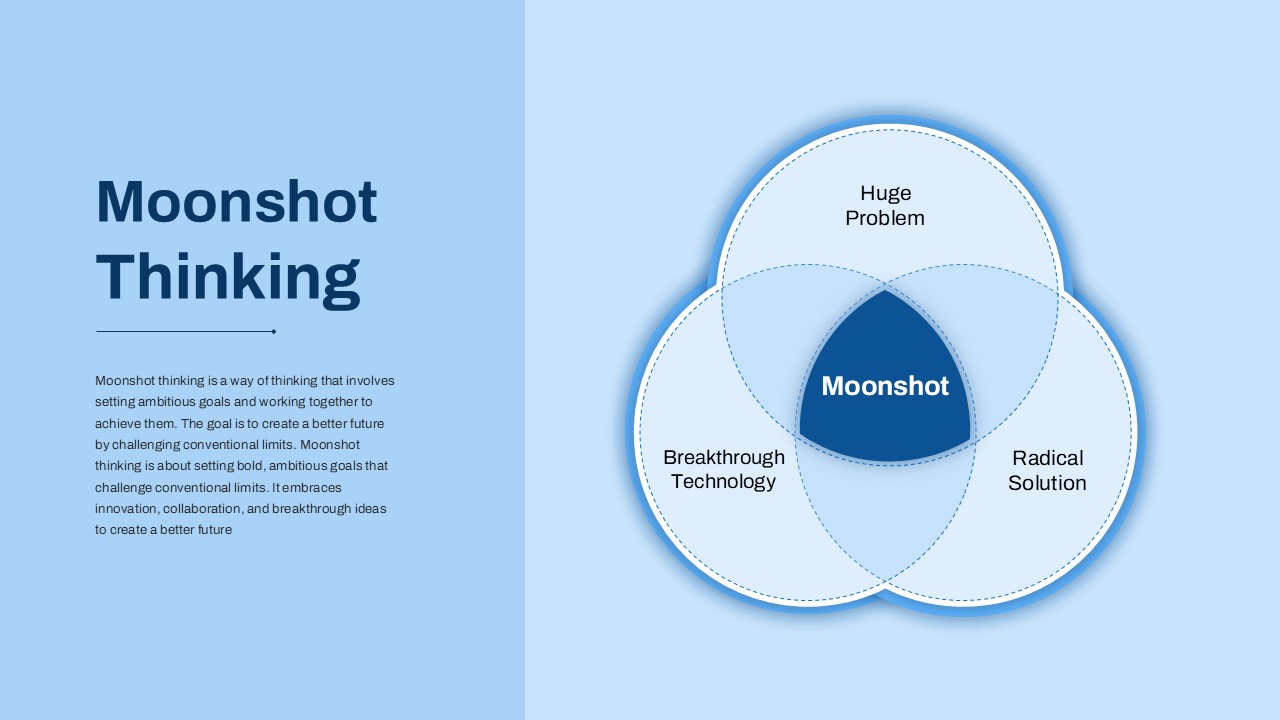
Bold Moonshot Thinking Venn Diagram Template for PowerPoint & Google Slides
Circular
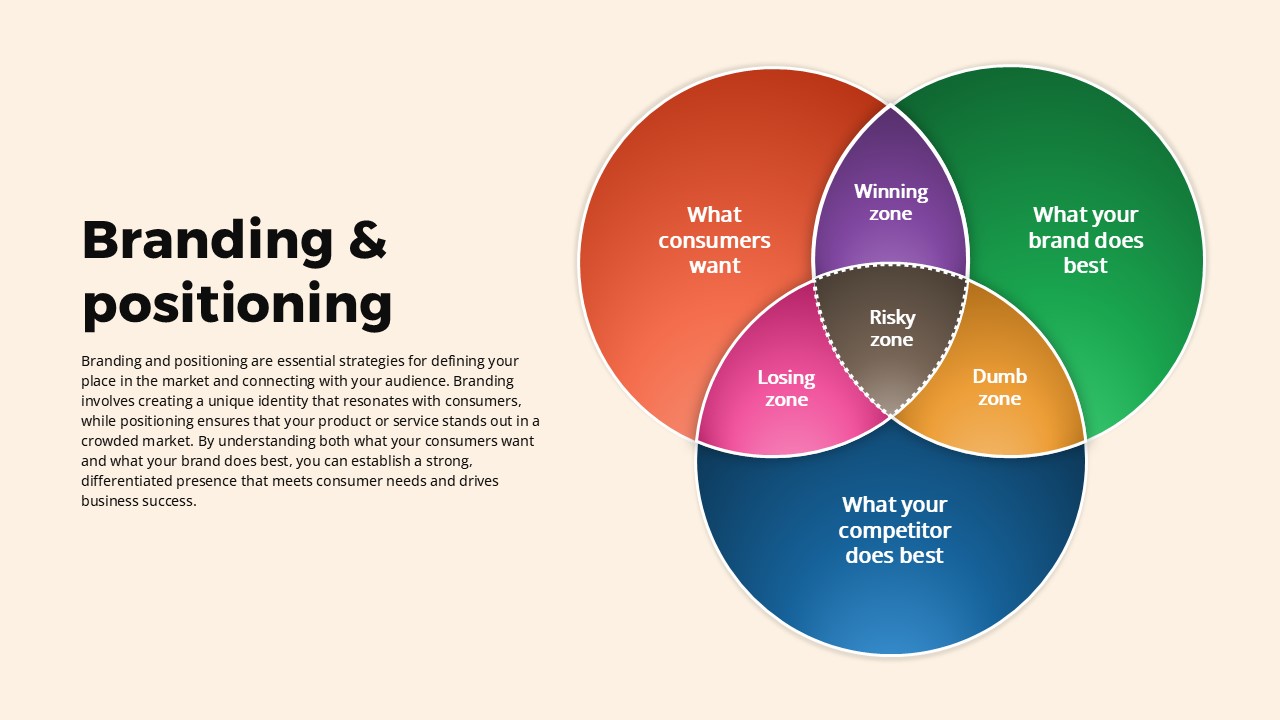
Branding and Positioning Venn Diagram Template for PowerPoint & Google Slides
Comparison
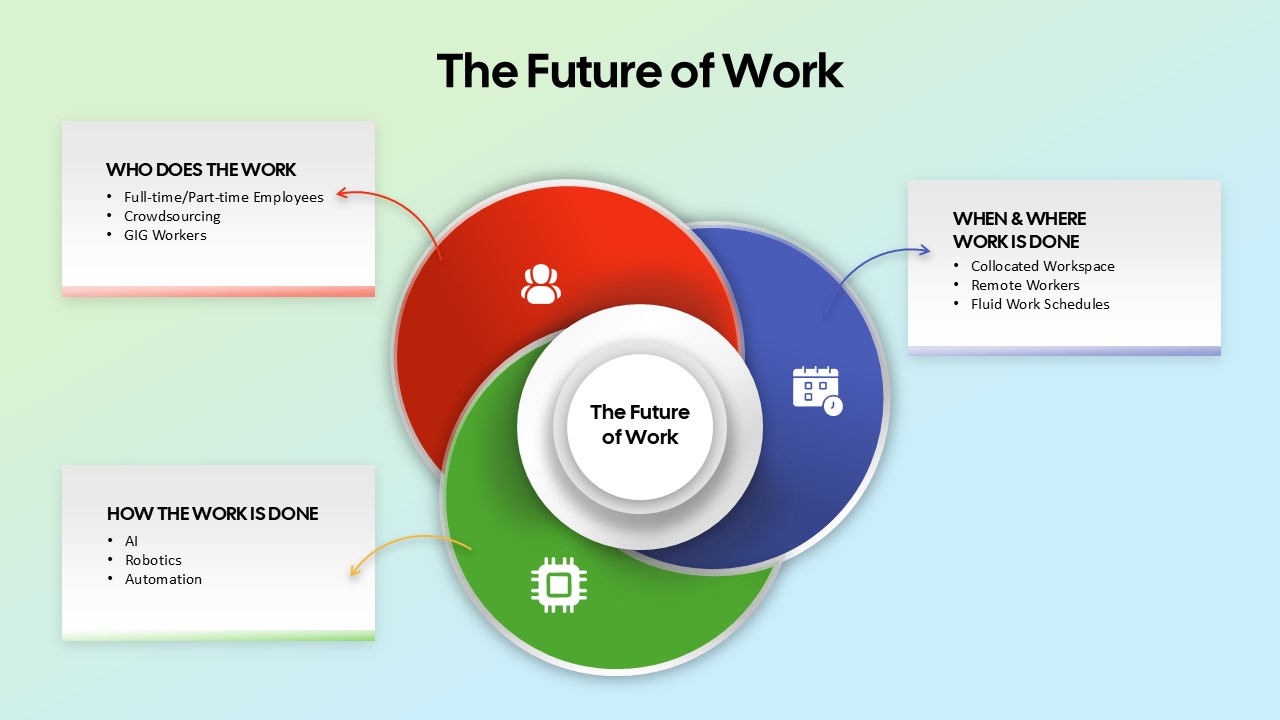
The Future of Work Venn Diagram Template for PowerPoint & Google Slides
Circular
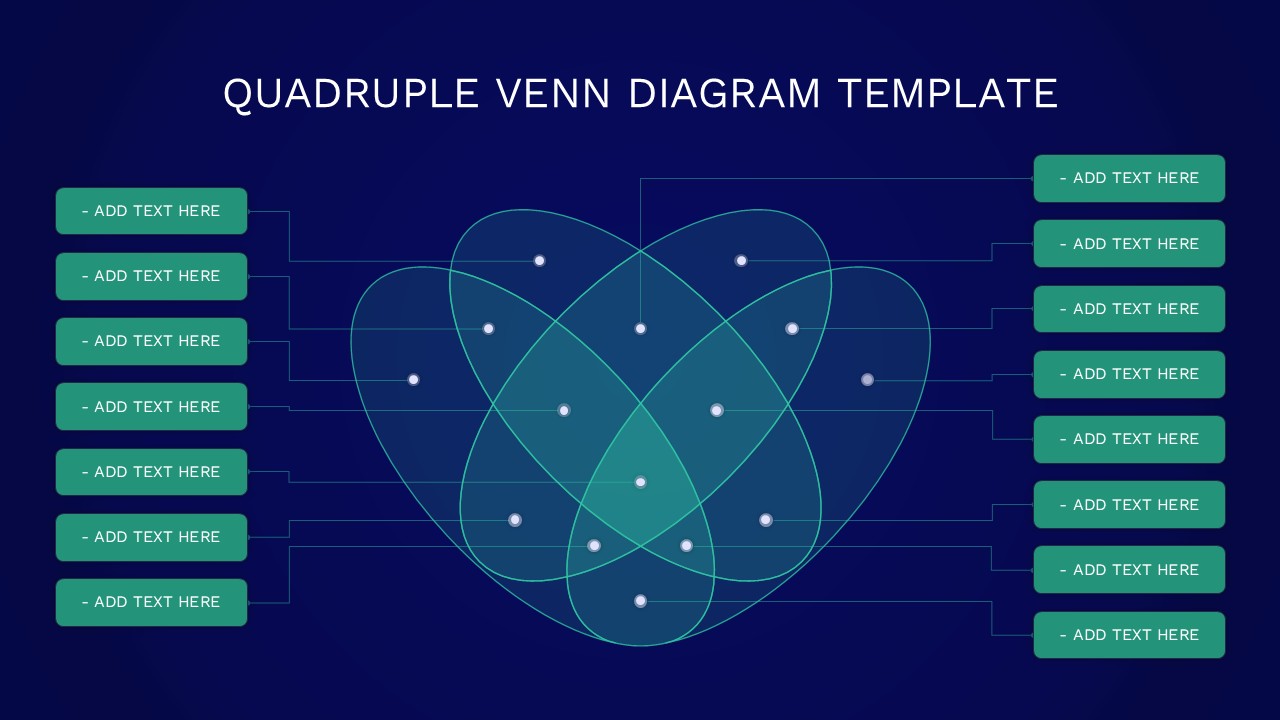
Quadruple Venn Diagram Template for PowerPoint & Google Slides
Circular
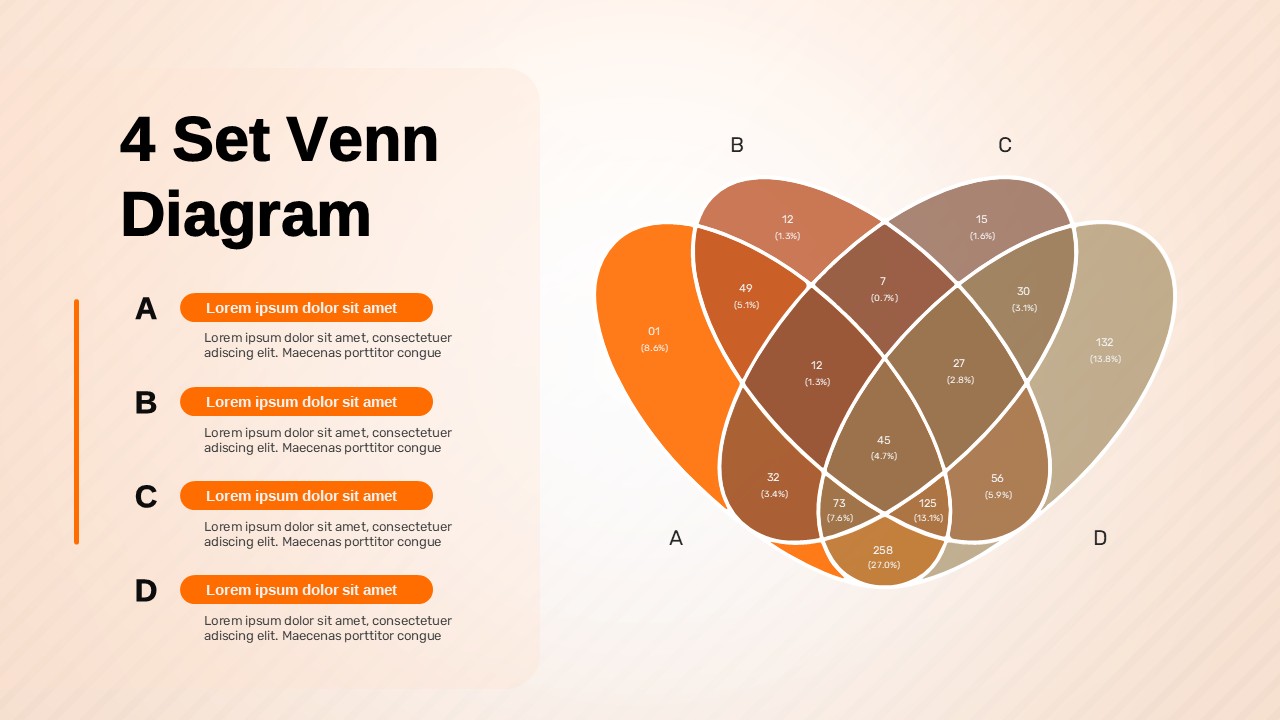
4 Set Venn Diagram Comparison Template for PowerPoint & Google Slides
Comparison
Three-Circle Diagram Infographic Template for PowerPoint & Google Slides
Circular
Six-Circle Process Infographic Diagram Template for PowerPoint & Google Slides
Circular
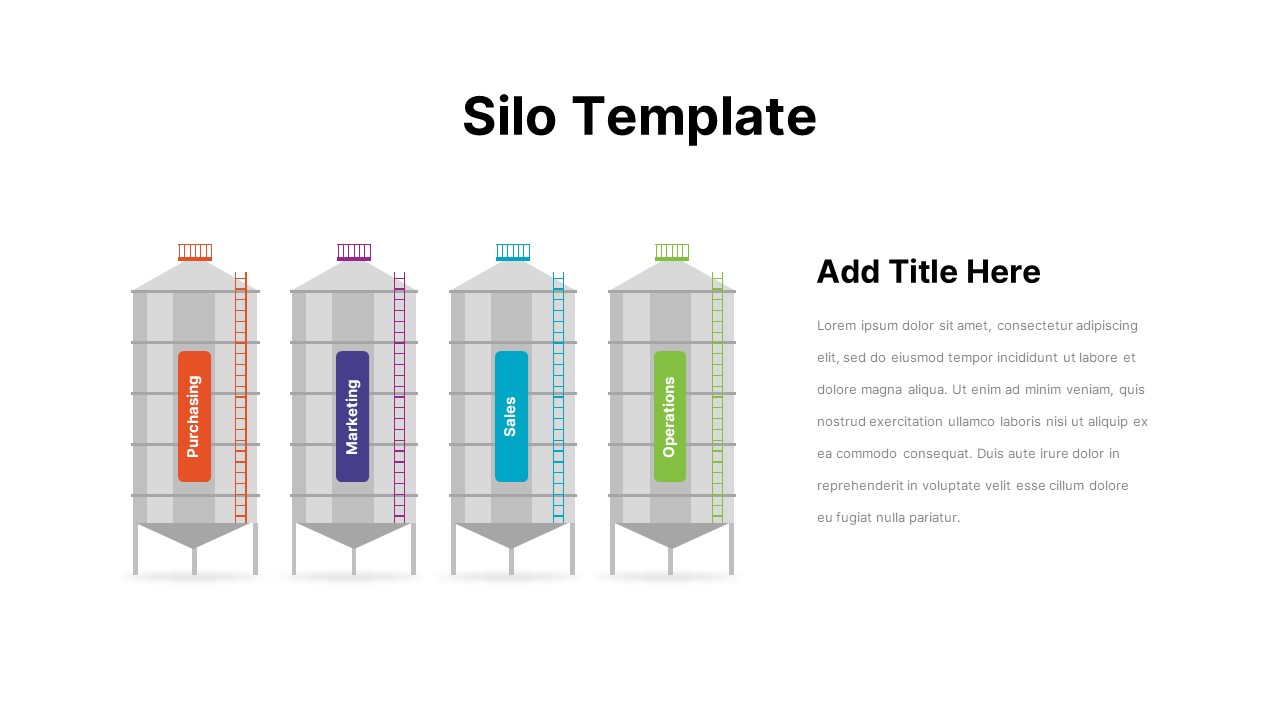
Business Silo Diagram Infographic Design Template for PowerPoint & Google Slides
Business
Circle Segment Sales Metrics Infographic Template for PowerPoint & Google Slides
Circular
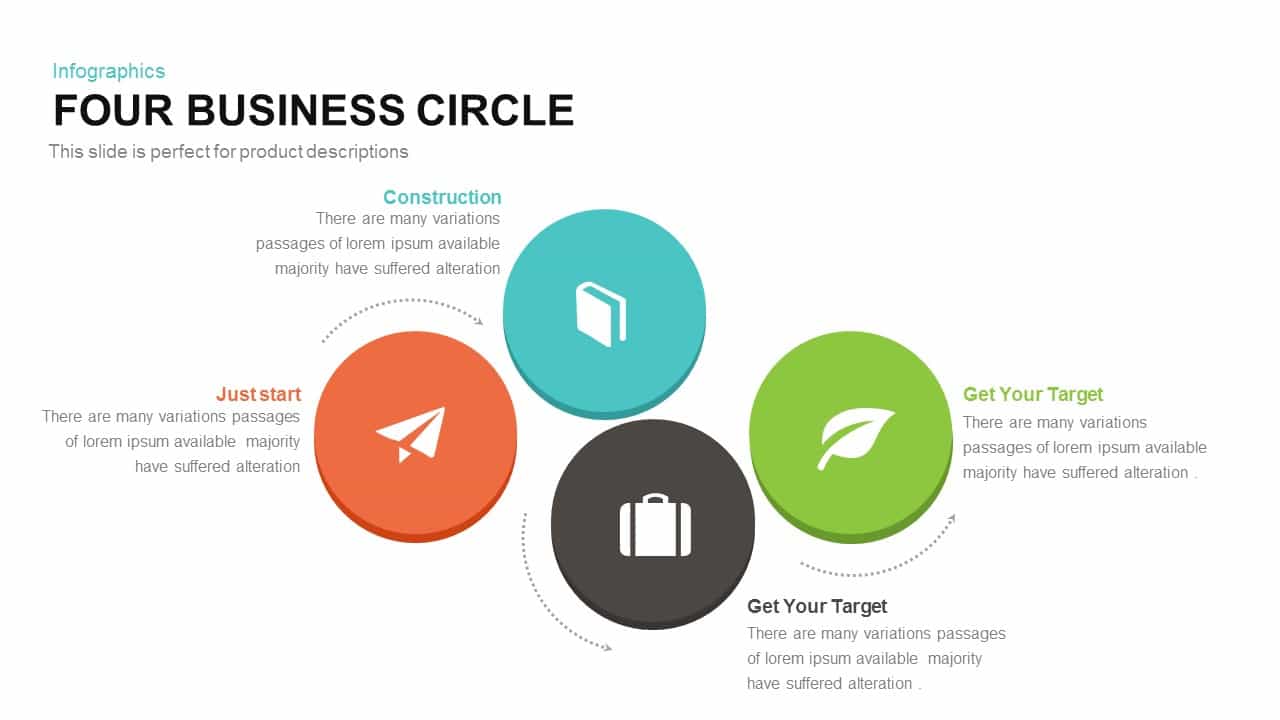
Four-Circle Business Process Infographic Template for PowerPoint & Google Slides
Circular
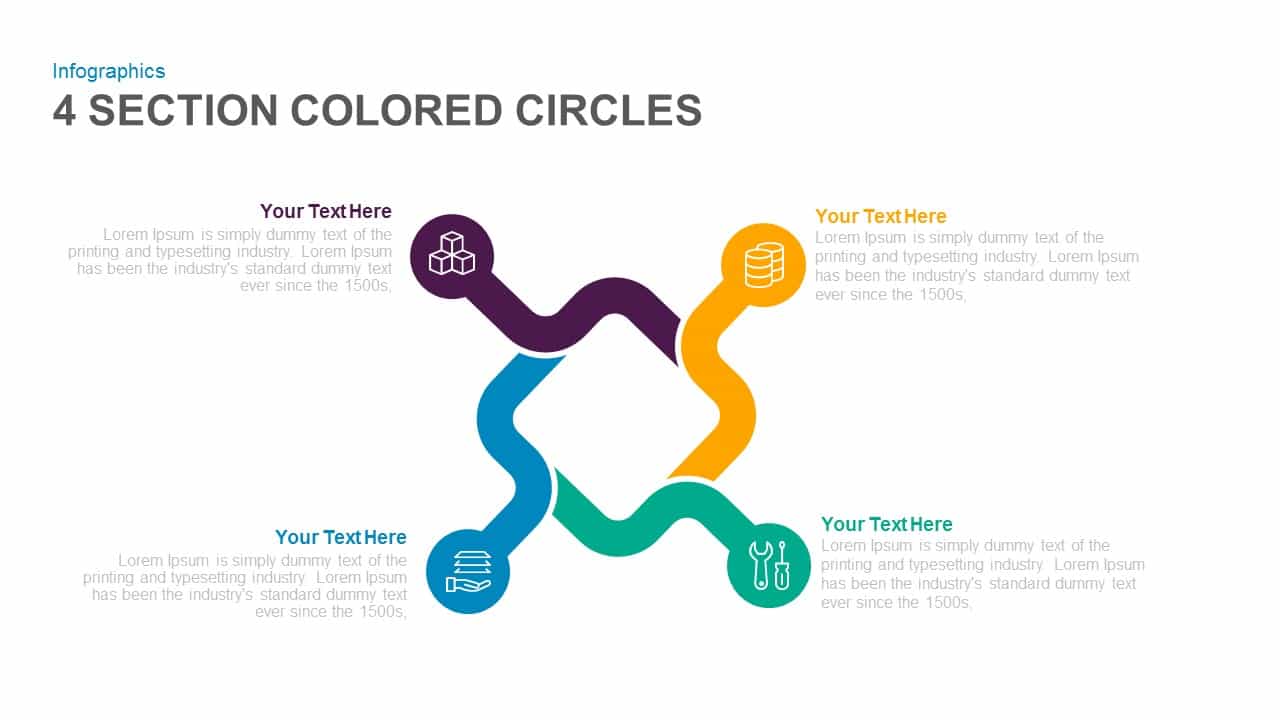
Four-Section Colored Circle Infographic Template for PowerPoint & Google Slides
Circular

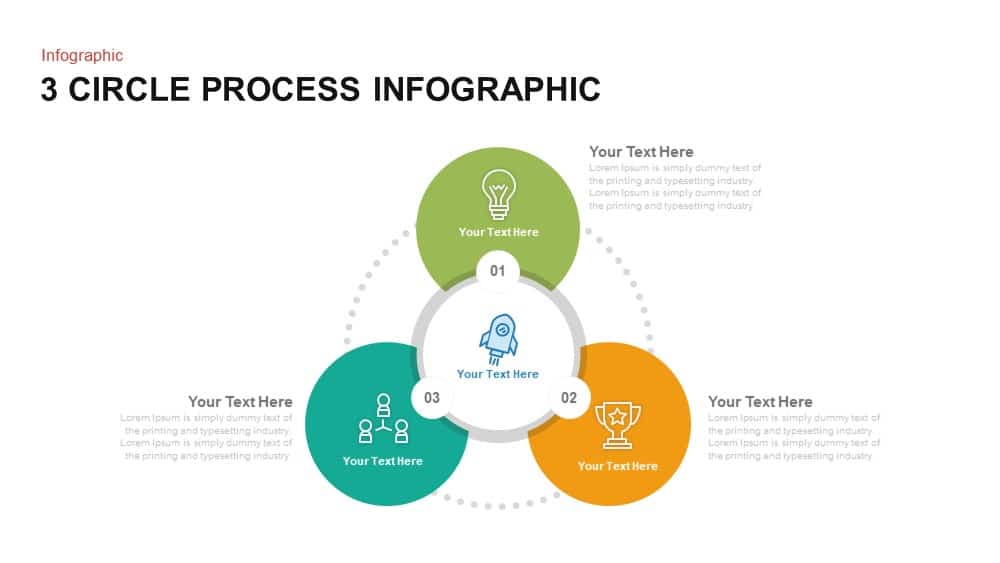
Three-Circle Process Infographic Template for PowerPoint & Google Slides
Circular
Four-Stage Circle Arrow Infographic Template for PowerPoint & Google Slides
Circular
Four-Stage Circle Arrow Infographic Template for PowerPoint & Google Slides
Circular
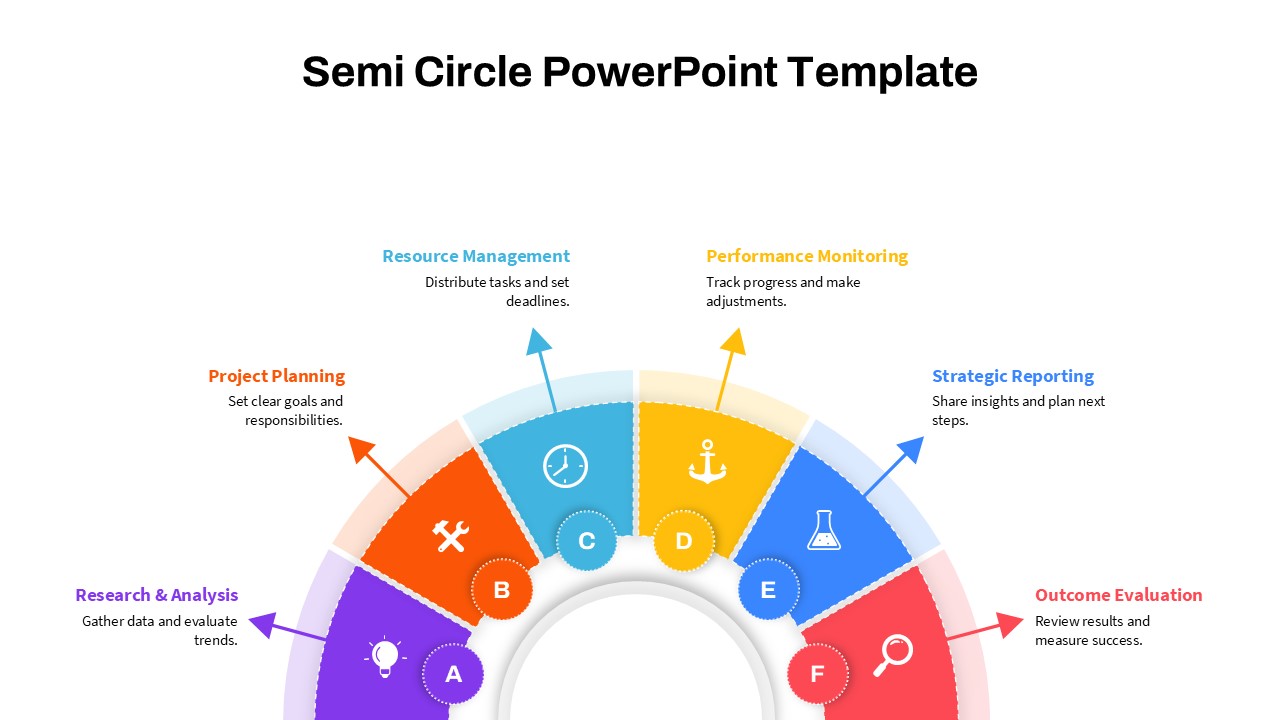
Modern Semi Circle Infographic Template for PowerPoint & Google Slides
Circular
Timeline Infographic Design Seven Stage template for PowerPoint & Google Slides
Timeline
Chess Piece Infographic Design Template for PowerPoint & Google Slides
Process
Hierarchy Infographic Design for PowerPoint & Google Slides
Business
Free Eight Circle Creative Diagram template for PowerPoint & Google Slides
Circular
Free
Circle Spider Diagram Representation Template for PowerPoint & Google Slides
Circular
Modern Circle SWOT Analysis Diagram Template for PowerPoint & Google Slides
SWOT
Modern Nine Circle Network Diagram Template for PowerPoint & Google Slides
Circular
Alternating Circle Timeline Diagram Template for PowerPoint & Google Slides
Timeline
Three Circle Arrow Process Diagram template for PowerPoint & Google Slides
Circular
Multi-Segment Circle Split Diagram template for PowerPoint & Google Slides
Circular

Eight Circle Diagram Template for PowerPoint & Google Slides
Circular
Multi-layout Circle Spoke Diagram Template for PowerPoint & Google Slides
Circular
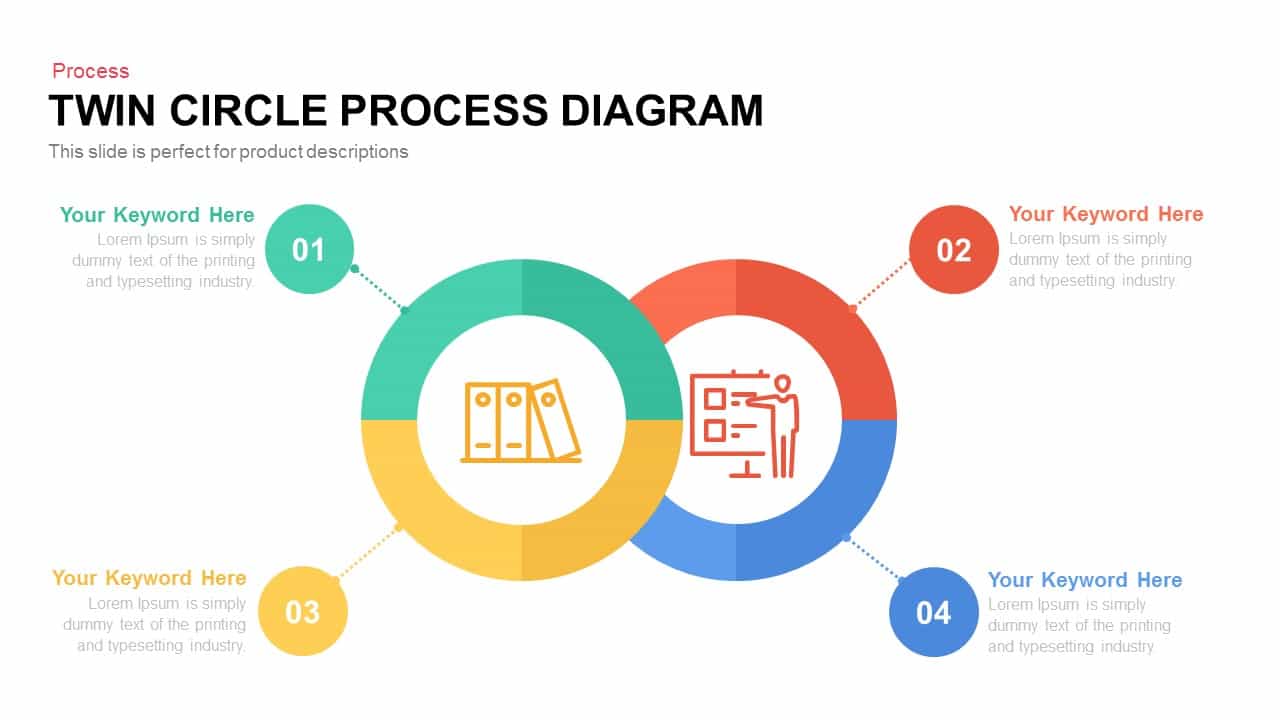
Editable Twin Circle Process Diagram Template for PowerPoint & Google Slides
Process
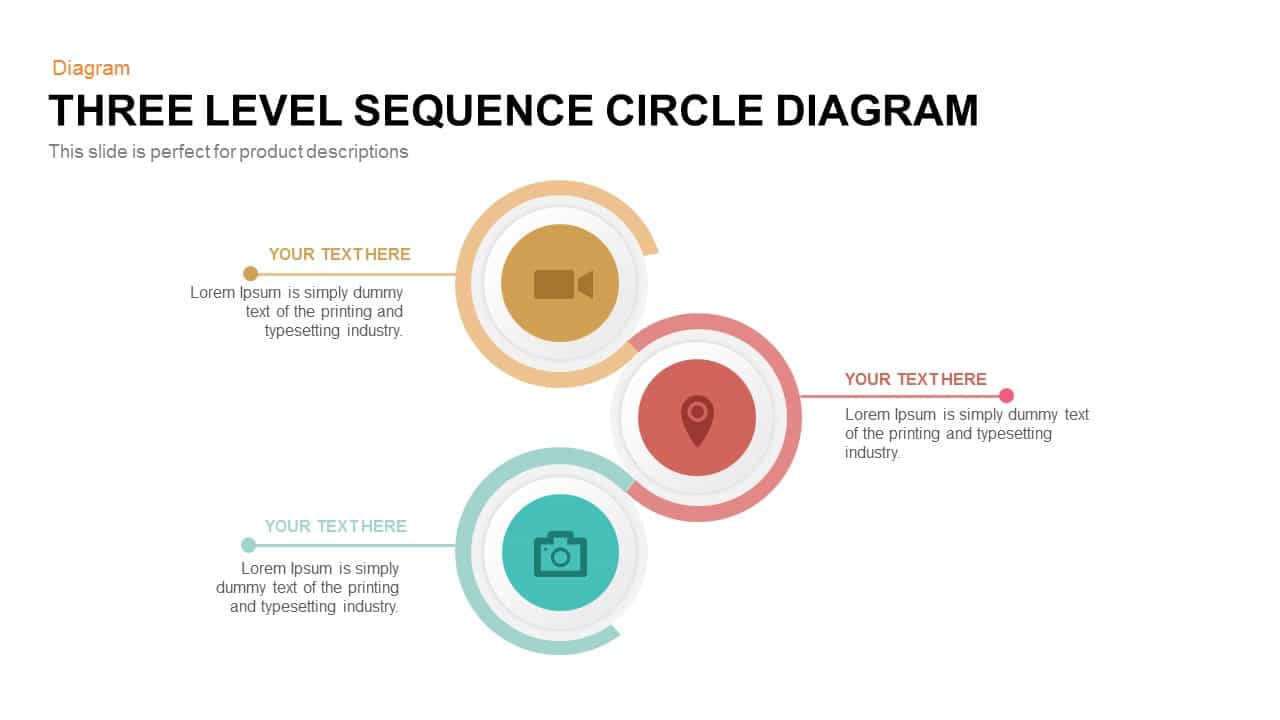
Three-Level Sequence Circle Diagram Template for PowerPoint & Google Slides
Circular
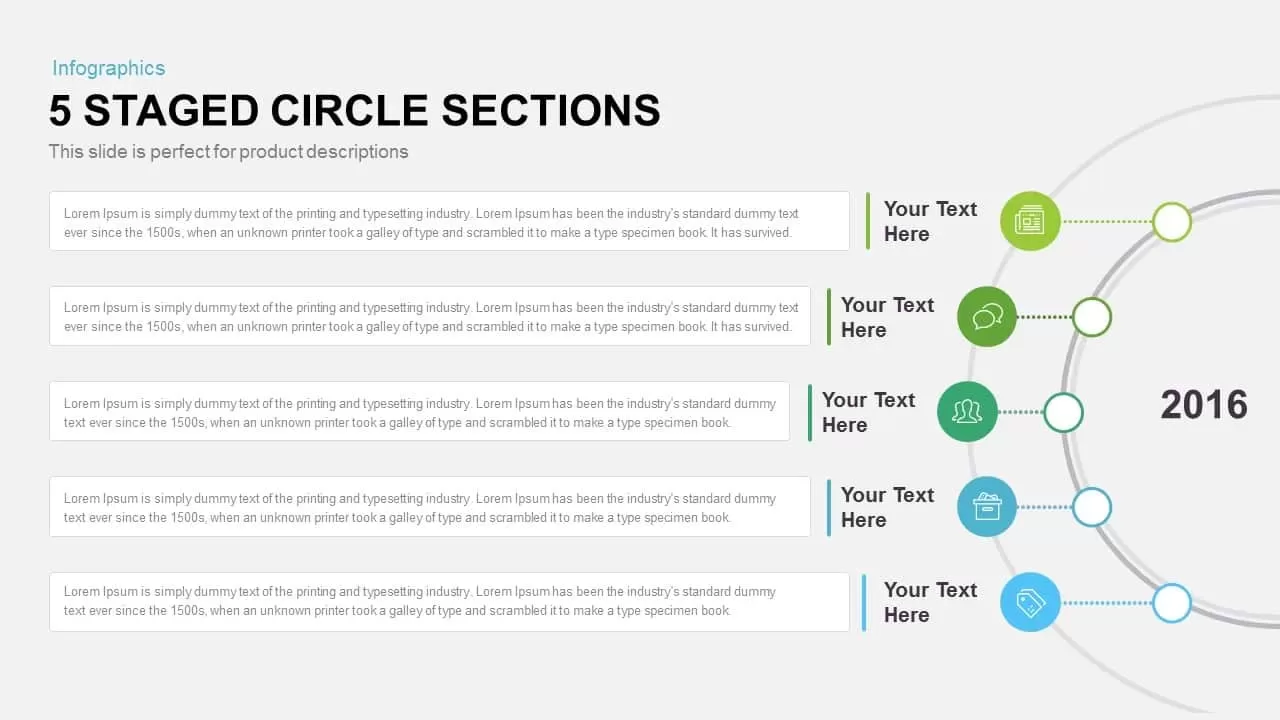
Five-Staged Circle Sections Diagram Template for PowerPoint & Google Slides
Circular
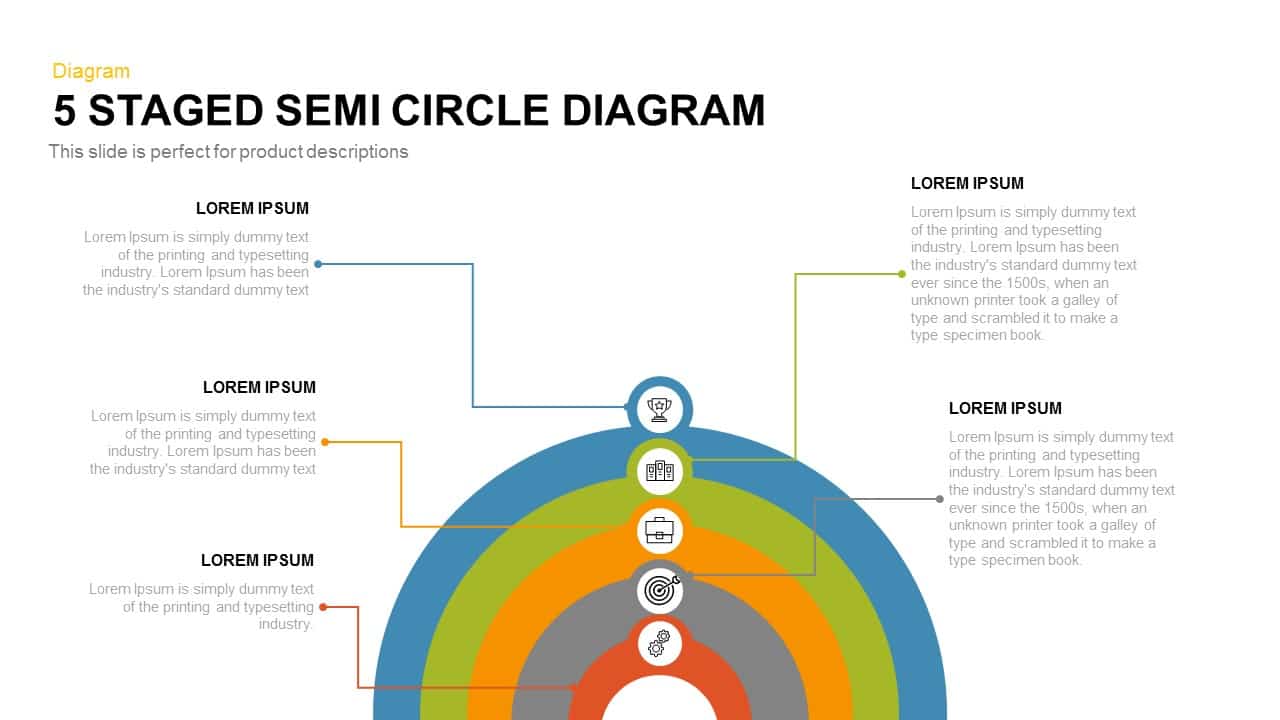
Five-Stage Semi-Circle Diagram Template for PowerPoint & Google Slides
Process
Five-Stage Circle Arrow Diagram Template for PowerPoint & Google Slides
Circular
Two-Stage Semi-Circle Diagram Overview Template for PowerPoint & Google Slides
Circular
Modern Multi-Section Circle Diagram Template for PowerPoint & Google Slides
Circular
Six-Stage Semi-Circle Diagram with Icons Template for PowerPoint & Google Slides
Circular
Four-Circle Hub and Spoke Diagram Template for PowerPoint & Google Slides
Process
Six Staged Circle Diagram template for PowerPoint & Google Slides
Circular
Five-Point Circle Timeline Diagram Template for PowerPoint & Google Slides
Timeline
Six-Stage Circle Process Diagram Template for PowerPoint & Google Slides
Process
Four-Stage Agenda Circle Diagram Slide Template for PowerPoint & Google Slides
Agenda
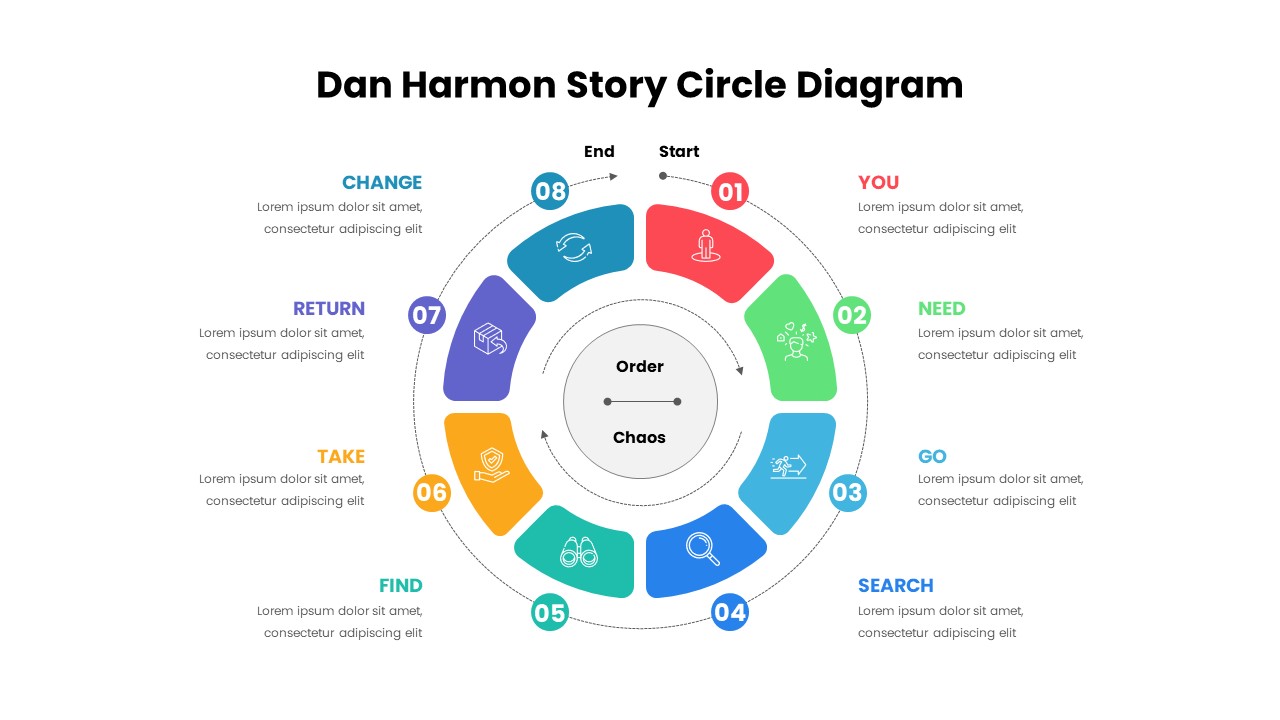
Dan Harmon Story Circle Diagram Template for PowerPoint & Google Slides
Circular
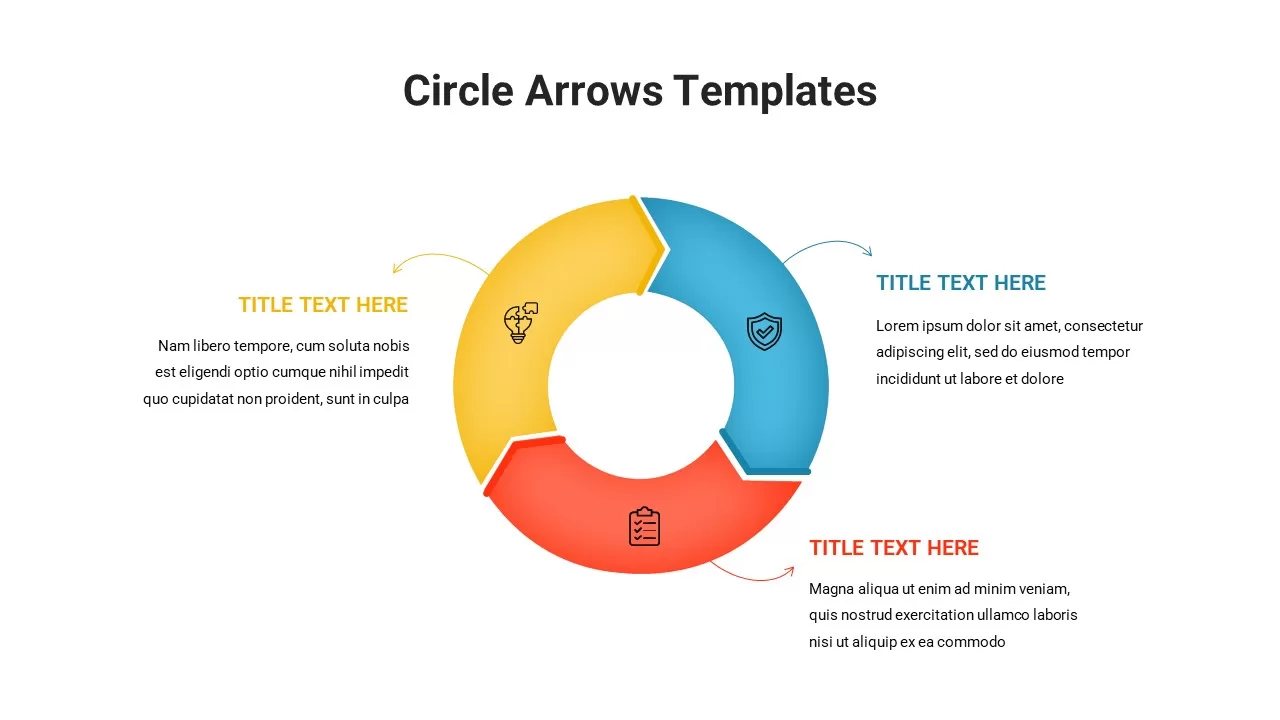
Circle Arrows Diagram template for PowerPoint & Google Slides
Process
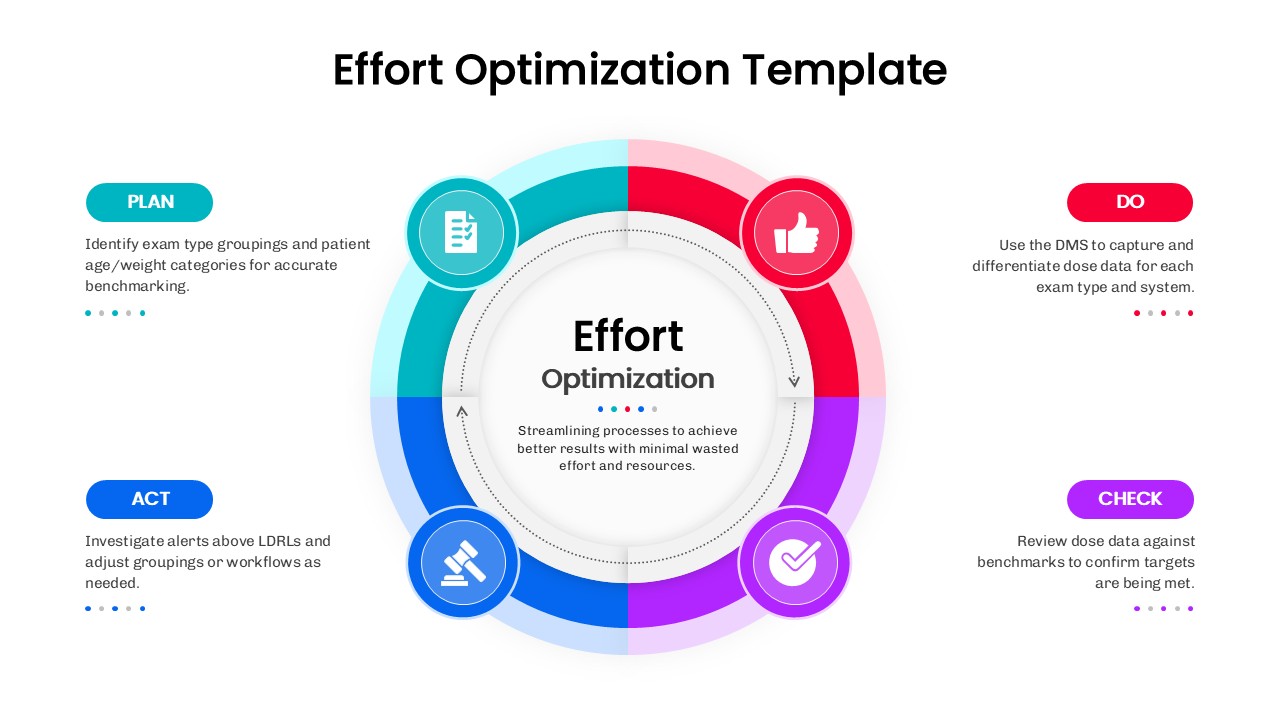
Effort Optimization PDCA Circle Diagram Template for PowerPoint & Google Slides
Circular
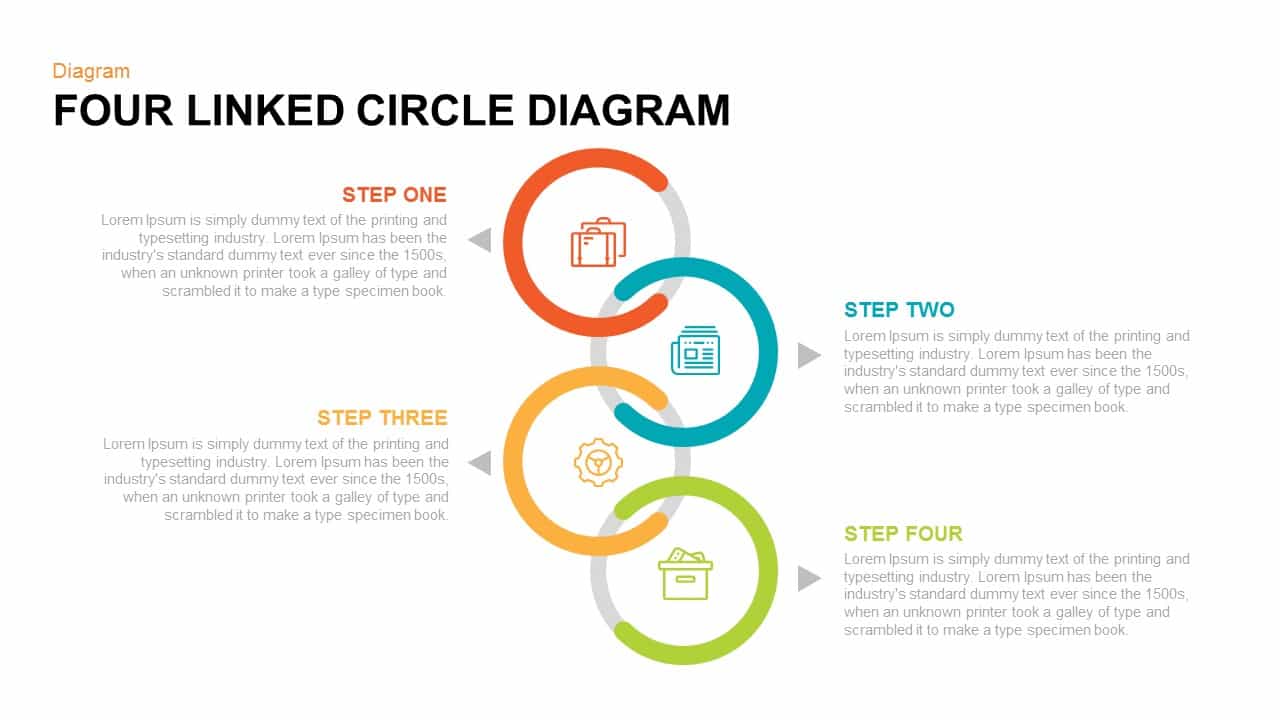
Four Linked Circle Diagram for PowerPoint & Google Slides
Process
Arrow Circle Flow Diagram for PowerPoint & Google Slides
Infographics

Company Features Circle Diagram for PowerPoint & Google Slides
Process
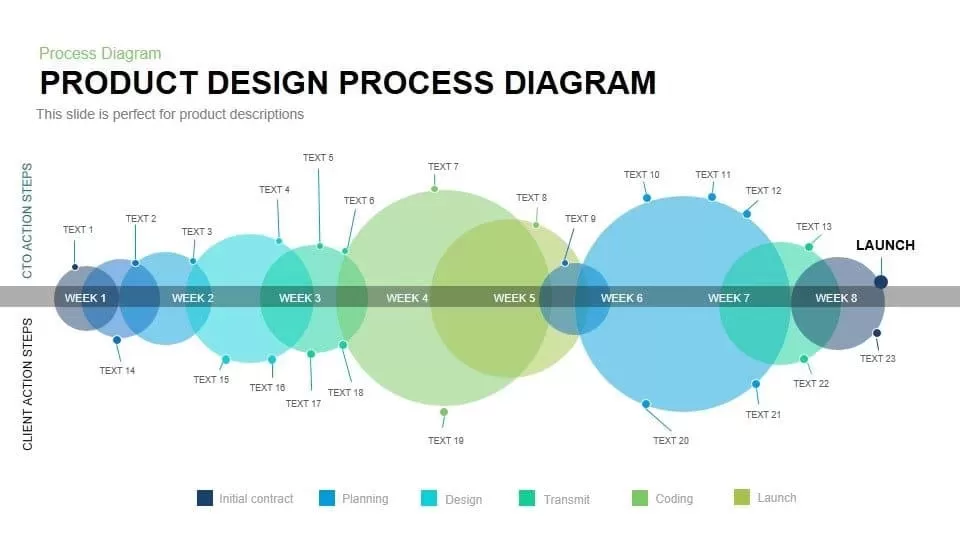
Product Design Process Diagram Template for PowerPoint & Google Slides
Timeline
Modern Bridge Diagram Slide Design Template for PowerPoint & Google Slides
Process
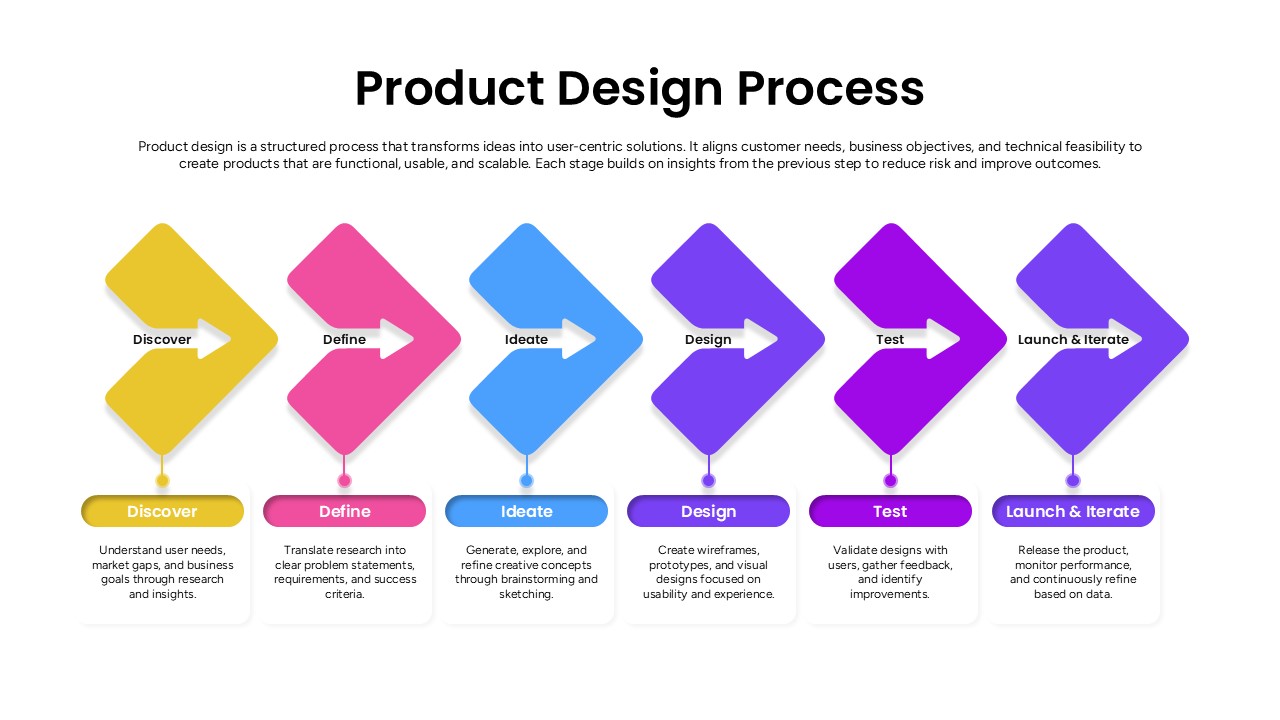
Product Design Process Flow Diagram Template for PowerPoint & Google Slides
Process
4 Level Sales Funnel Diagram Design for PowerPoint & Google Slides
Marketing Funnel
12 Segment Circle Puzzle Diagram Template for PowerPoint and Keynote
Circular
3D Circle Sample template for PowerPoint & Google Slides
Circular
Circle Strategy Creative Chart template for PowerPoint & Google Slides
Business Strategy
Circle Timeline Infographics template for PowerPoint & Google Slides
Timeline
Circle Chart Data template for PowerPoint & Google Slides
Pie/Donut
Four Circle Service template for PowerPoint & Google Slides
Process
Circle Abstract Shape Infographics Template for PowerPoint & Google Slides
Circular
Circle Graph Data Visualization Template for PowerPoint & Google Slides
Circular
Circle Mindmap template for PowerPoint & Google Slides
Mind Maps
Dynamic Circle Timeline Infographics template for PowerPoint & Google Slides
Timeline

Creative Zigzag Circle Service Steps Template for PowerPoint & Google Slides
Process
Modern 9-Section Circle Infographics Template for PowerPoint & Google Slides
Circular
Circle Arrows Process Flow template for PowerPoint & Google Slides
Process
Circle Arrow Process Flow template for PowerPoint & Google Slides
Process
Circle Arrow Process Flow template for PowerPoint & Google Slides
Process
Free Graduation Photo Collage Circle Slide Template for PowerPoint & Google Slides
Decks
Free

Blue Circle Mobile Apps Presentation Template for PowerPoint & Google Slides
Information Technology
Creative Circle Elements for PowerPoint & Google Slides
Infographics
4 Circle Process for PowerPoint & Google Slides
Process
Modern Business Speech Slide Design Template for PowerPoint & Google Slides
Business
Product Development Design Process template for PowerPoint & Google Slides
Process
Data Analytics Dashboard Design template for PowerPoint & Google Slides
Bar/Column
Modern Orange Business Plan Design Theme Template for PowerPoint & Google Slides
Company Profile
Free Corporate Design Deck Template for PowerPoint & Google Slides
Company Profile
Free
ADDIE Instructional Design Model Template for PowerPoint & Google Slides
Process
Six-Step Hexagon Design Thinking Models Template for PowerPoint & Google Slides
Circular
Open Door Transition Slide Design Template for PowerPoint & Google Slides
Opportunities Challenges
Free Space Minimal Deck Design Template for PowerPoint & Google Slides
Company Profile
Free
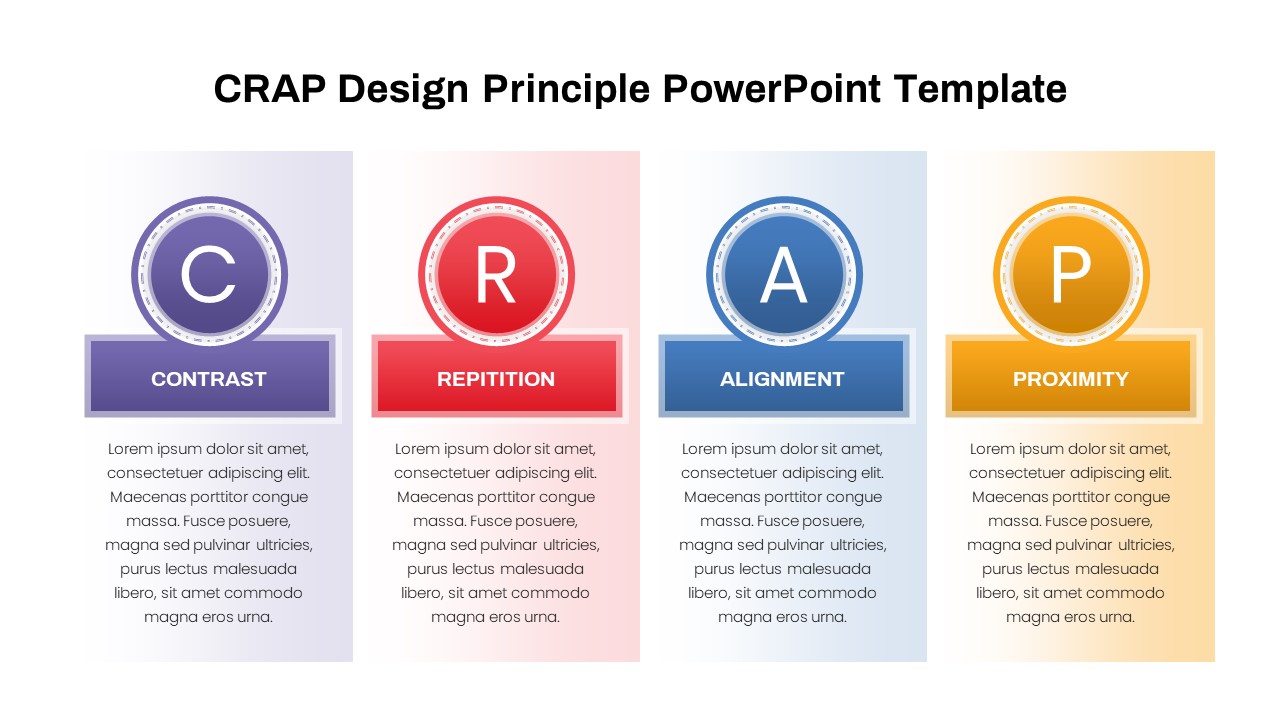
CRAP Design Principles Explained Template for PowerPoint & Google Slides
Business Strategy