4DX Scoreboard KPI Gauge Dashboard Template for PowerPoint & Google Slides

Description
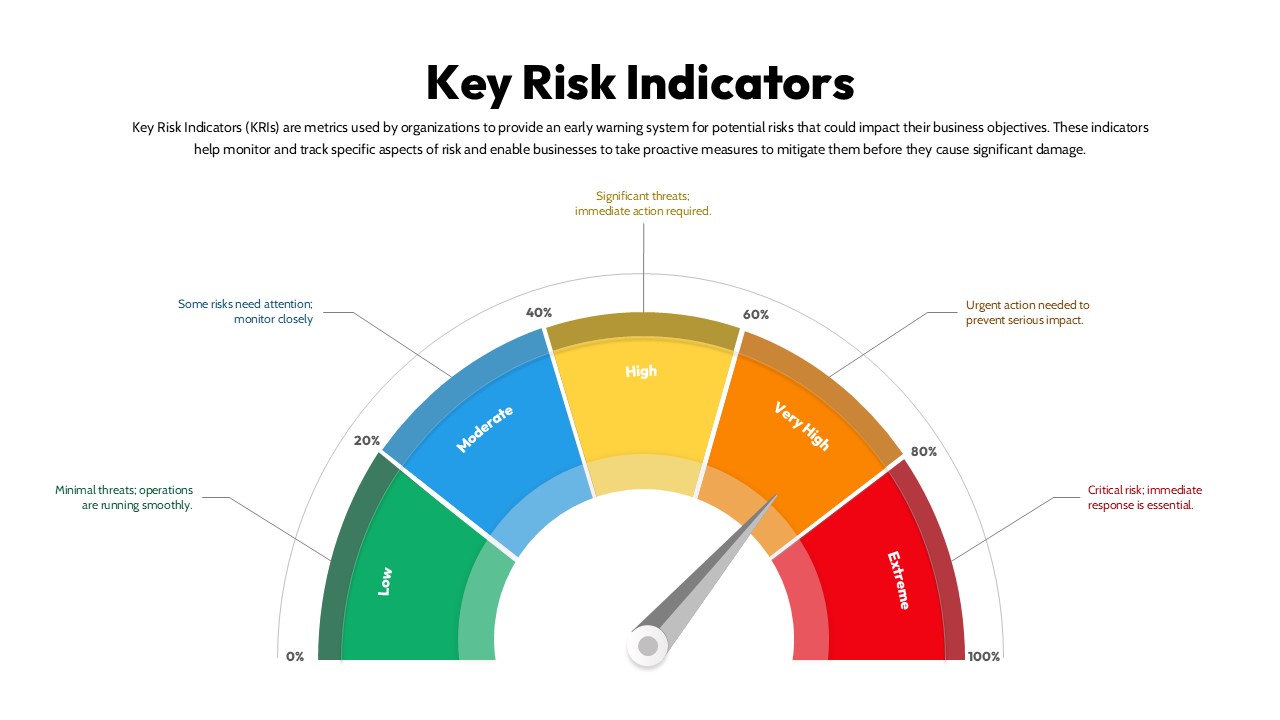
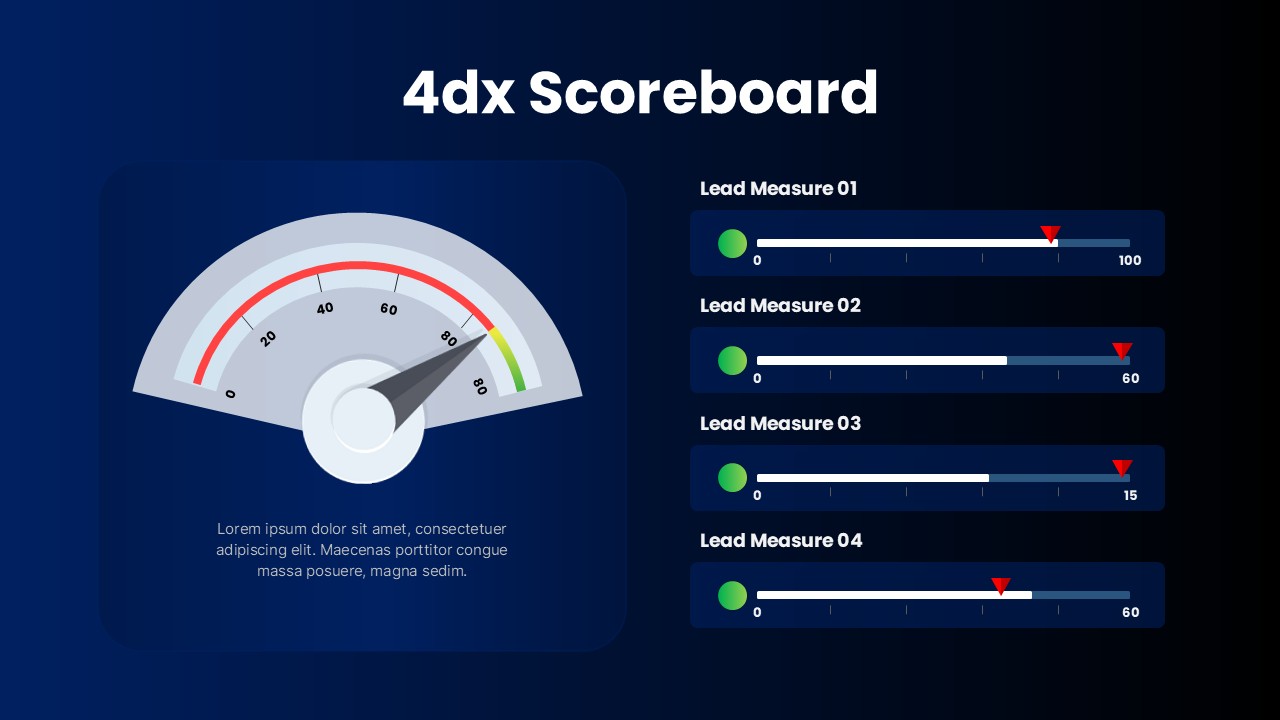
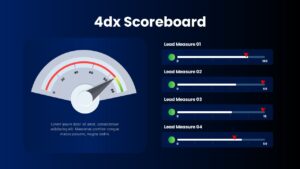
Visualize performance metrics with clarity using this 4DX scoreboard KPI dashboard slide. Inspired by the Four Disciplines of Execution framework, the layout combines a prominent speedometer-style gauge with four horizontal lead measure bars, offering a balanced view of overall progress and individual performance drivers. The semi-circular gauge on the left highlights cumulative results with color-coded ranges, while the right-hand progress indicators display measurable targets, current status markers, and numerical scales for precise tracking.
This clean, modern design allows teams to communicate lead and lag measures in a structured format that supports accountability and transparency. Each lead measure section includes a bold heading, progress bar, indicator marker, and value scale, making it easy to compare targets against actual results. Fully customizable in PowerPoint and Google Slides, you can adjust metrics, update labels, modify color zones, or align the design with your brand guidelines without disrupting the layout.
Ideal for weekly performance reviews, strategic execution meetings, and operational dashboards, this slide keeps teams focused on high-impact activities that drive measurable outcomes. The visual hierarchy ensures stakeholders instantly grasp priorities, progress gaps, and areas requiring attention.
Who is it for
Business leaders, operations managers, and strategy consultants can leverage this slide to track execution against strategic goals. It is also suitable for project managers and department heads presenting KPI updates in leadership or board meetings.
Other Uses
Beyond 4DX reporting, repurpose this dashboard to present sales performance metrics, marketing campaign results, productivity benchmarks, or financial performance summaries. The gauge and bar combination also works well for executive summaries, quarterly business reviews, or performance appraisal presentations.
Login to download this file

Item ID
SB05747
Related Templates

Sales Growth Dashboard: KPI Gauge & Line Template for PowerPoint & Google Slides
Revenue
Interactive Benchmarking Gauge Dashboard Template for PowerPoint & Google Slides
Pie/Donut
Risk Level Gauge Comparison Dashboard Template for PowerPoint & Google Slides
Comparison
Project Status Template Dashboard with Gauge for PowerPoint & Google Slides
Project Status
Free KPI Dashboard PowerPoint Template for PowerPoint & Google Slides
Charts
Free

Efficiency KPI Dashboard Metaphor Template for PowerPoint & Google Slides
Infographics
Performance KPI Dashboard Slide Template for PowerPoint & Google Slides
Business Report
KPI Dashboard template for PowerPoint & Google Slides
Business Report
KPI Dashboard Overview template for PowerPoint & Google Slides
Finance
KPI Dashboard Data Visualization Template for PowerPoint & Google Slides
Bar/Column
KPI Dashboard Data Overview Slide Template for PowerPoint & Google Slides
Bar/Column
Customer Satisfaction KPI Dashboard Template for PowerPoint & Google Slides
Customer Experience
Michigan County Map with KPI Dashboard Template for PowerPoint & Google Slides
World Maps
DevOps KPI Dashboard Performance Metrics Template for PowerPoint & Google Slides
Software Development
Purchasing KPI Metrics Dashboard Template for PowerPoint & Google Slides
Business Report
Procurement KPI Dashboard & Metrics Template for PowerPoint & Google Slides
Business Report
Patient-Satisfaction KPI Dashboard for PowerPoint & Google Slides
Business
Speedometer Infographic Gauge Comparison Template for PowerPoint & Google Slides
Comparison
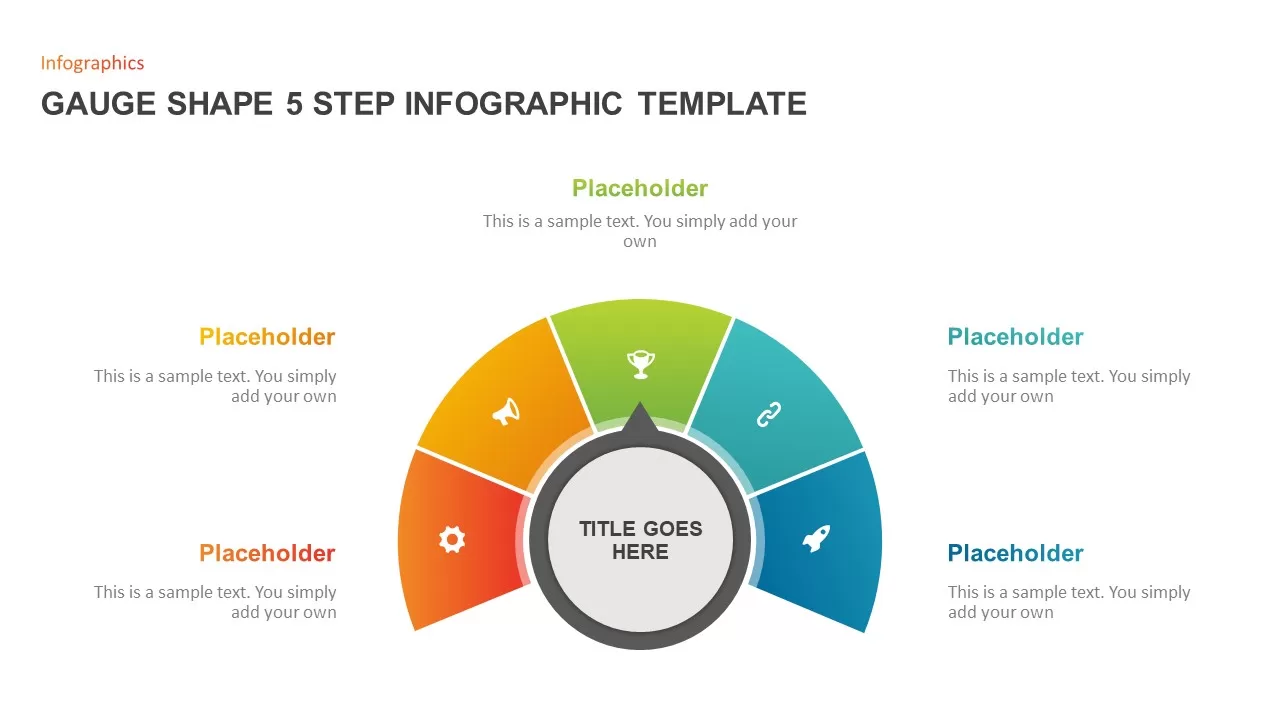
Gauge Shape 5-Step Infographic Diagram Template for PowerPoint & Google Slides
Process
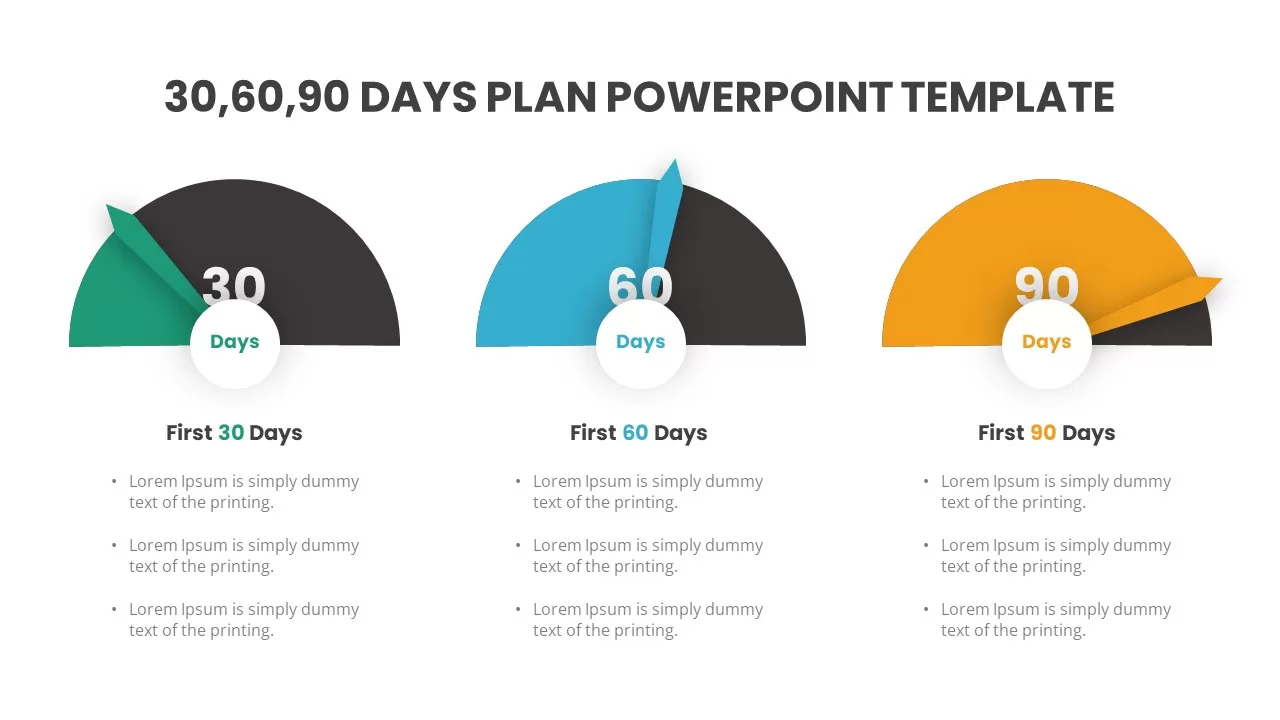
Gauge-Style 30-60-90 Day Plan Infographic Template for PowerPoint & Google Slides
Timeline
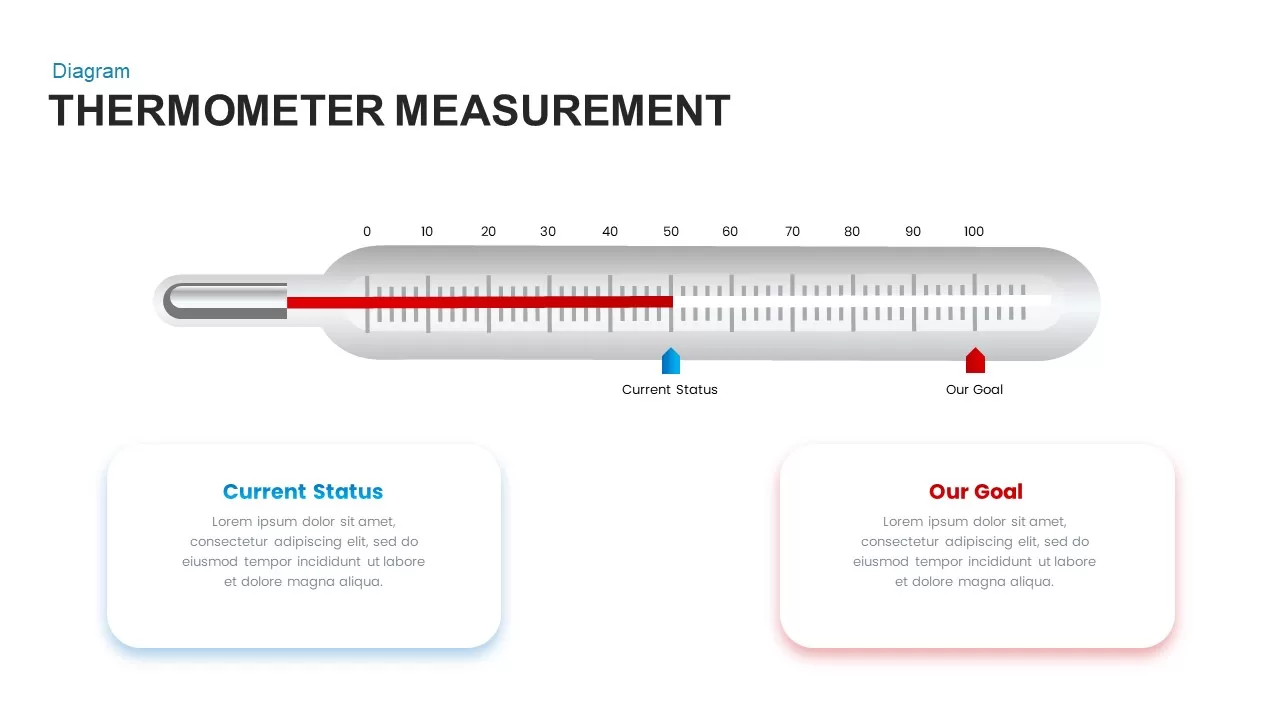
Thermometer Gauge Progress Measurement Template for PowerPoint & Google Slides
Comparison
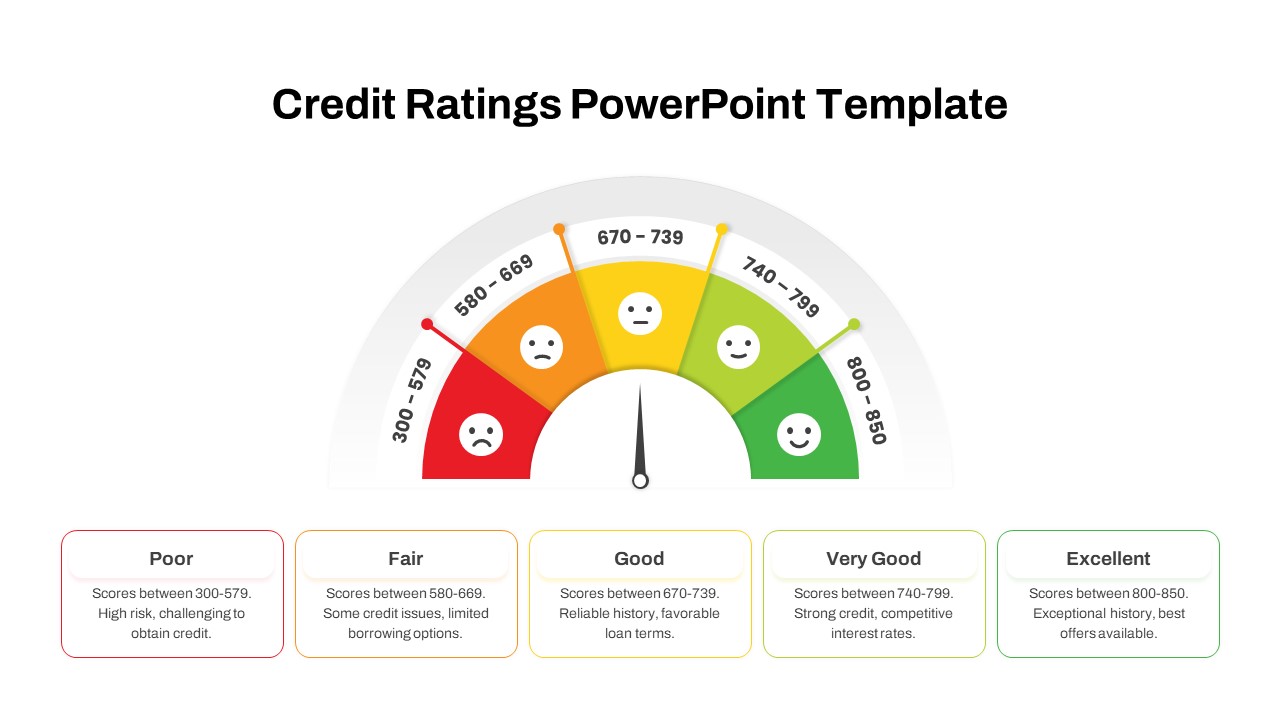
Credit Ratings Gauge Infographic Template for PowerPoint & Google Slides
Circular
Key Risk Indicators (KRI) Gauge Template for PowerPoint & Google Slides
Risk Management
Asia Map with KPI Metrics and Legend Template for PowerPoint & Google Slides
World Maps

Application Revenue Line Chart KPI Template for PowerPoint & Google Slides
Revenue
Professional Team Collage & KPI Slide Template for PowerPoint & Google Slides
Business
Circular Image Gallery & KPI Metrics Template for PowerPoint & Google Slides
Pie/Donut
Statistics Infographic & KPI Bar Chart Template for PowerPoint & Google Slides
Bar/Column
Monthly Recurring Revenue KPI Bar Chart Template for PowerPoint & Google Slides
Bar/Column
Free Balanced Scorecard Quadrant KPI Layout Template for PowerPoint & Google Slides
Employee Performance
Free
Comprehensive Release & Deployment KPI Template for PowerPoint & Google Slides
Software Development
Three Segment Donut Chart KPI Infographic Template for PowerPoint & Google Slides
Pie/Donut
Year in Review KPI Highlights Slide for PowerPoint & Google Slides
Business Report
E-commerce Analytics Dashboard Template for PowerPoint & Google Slides
Bar/Column

Dynamic Data Dashboard Infographic Template for PowerPoint & Google Slides
Bar/Column
Product Usage Analytics Dashboard Chart Template for PowerPoint & Google Slides
Bar/Column
Data Analytics Dashboard Design template for PowerPoint & Google Slides
Bar/Column
Business Dashboard Analytics & KPIs Template for PowerPoint & Google Slides
Bar/Column

Professional Team Efficiency Dashboard Template for PowerPoint & Google Slides
Business Report
Project Management Dashboard Template for PowerPoint & Google Slides
Project
Website Performance Dashboard template for PowerPoint & Google Slides
Charts
Sales Performance Dashboard template for PowerPoint & Google Slides
Business Report
Immigration Data Dashboard Template for PowerPoint & Google Slides
Bar/Column
Employee Skill Analysis Dashboard Template for PowerPoint & Google Slides
Employee Performance
Social Media Performance Dashboard Template for PowerPoint & Google Slides
Bar/Column

Net Promoter Score Dashboard Template for PowerPoint & Google Slides
Customer Experience
Modern Project Status Report Dashboard Template for PowerPoint & Google Slides
Project Status
Bull and Bear Stock Market Dashboard Template for PowerPoint & Google Slides
Infographics
Professional Nurse Infographic Dashboard Template for PowerPoint & Google Slides
Nursing
Heat Map Risk Matrix Dashboard Template for PowerPoint & Google Slides
Comparison Chart
Project Status Dashboard Table Template for PowerPoint & Google Slides
Project Status
Project Status Dashboard with Metrics Template for PowerPoint & Google Slides
Project Status
Colorful Project Status Dashboard Template for PowerPoint & Google Slides
Project Status
Weekly Update Schedule Dashboard Template for PowerPoint & Google Slides
Agenda
Project Status Dashboard Template for PowerPoint & Google Slides
Project Status
Weekly Status Report Dashboard Template for PowerPoint & Google Slides
HR
Free Metro UI Dashboard Infographic Template for PowerPoint & Google Slides
Business Report
Free
Website Performance Monitoring Dashboard Template for PowerPoint & Google Slides
Business Report
One Pager Project Status Dashboard Template for PowerPoint & Google Slides
Project Status
One Pager Annual Report Dashboard Template for PowerPoint & Google Slides
Business Report
Social Media Analytics Dashboard Template for PowerPoint & Google Slides
Digital Marketing
Social Media Statistics 2023 Dashboard Template for PowerPoint & Google Slides
Comparison
Mastodon Metrics Infographic Dashboard Template for PowerPoint & Google Slides
Business Report
Soccer Match Stats Dashboard Slide Template for PowerPoint & Google Slides
Graphics
Employee Satisfaction Survey Dashboard Template for PowerPoint & Google Slides
Employee Performance
Weekly Project Status Dashboard Template for PowerPoint & Google Slides
Project Status
Freight Logistics Dashboard Infographic Template for PowerPoint & Google Slides
Comparison Chart
Free Quarterly Business Review Dashboard Template for PowerPoint & Google Slides
Business
Free
Cost Cutting Savings Dashboard Template for PowerPoint & Google Slides
Pie/Donut
Macroeconomic Indicators Dashboard Template for PowerPoint & Google Slides
PEST
Free Monthly Report PowerPoint Template for PowerPoint & Google Slides
Business Report
Free
Quarterly Financial Summary Dashboard Template for PowerPoint & Google Slides
Business Report
Banking Financial Overview Dashboard Template for PowerPoint & Google Slides
Finance
Quarterly Business Review Dashboard Template for PowerPoint & Google Slides
Pitch Deck
Monthly Business Review Dashboard Deck Template for PowerPoint & Google Slides
Business Report
Project Progress Dashboard Pie Charts Template for PowerPoint & Google Slides
Project
Monthly Sales Performance Dashboard Template for PowerPoint & Google Slides
Charts
HR Report Dashboard Template for PowerPoint & Google Slides
Employee Performance
Budget Forecast Dashboard & Donut Charts Template for PowerPoint & Google Slides
Pie/Donut
Inventory Management Dashboard Template for PowerPoint & Google Slides
Process
Digital Marketing KPIs Dashboard Dark Template for PowerPoint & Google Slides
Business Report
Employee Performance Metrics Dashboard Template for PowerPoint & Google Slides
Employee Performance
Turnover Analysis Dashboard Template for PowerPoint & Google Slides
Employee Performance
Project Tracking Dashboard Table Template for PowerPoint & Google Slides
Project Status
Action Items Management Dashboard Table Template for PowerPoint & Google Slides
Project Status
Electronic Health Records Dashboard template for PowerPoint & Google Slides
Health
Customer Interview Insights Dashboard Template for PowerPoint & Google Slides
Customer Experience
Account Overview Dashboard template for PowerPoint & Google Slides
Business
Project Status Dashboard Report Template for PowerPoint & Google Slides
Project Status
Project Status Update Dashboard Table Template for PowerPoint & Google Slides
Project Status
Cohort Analysis Retention Dashboard Template for PowerPoint & Google Slides
Comparison Chart
Project Status Dashboard Template for PowerPoint & Google Slides
Project Status
Dashboard Project Status Template for PowerPoint & Google Slides
Project Status
Task Completion Rate Dashboard Template for PowerPoint & Google Slides
Business
Project Status Dashboard with RAG Legend Template for PowerPoint & Google Slides
Project Status
End of Year Review Dashboard Template for PowerPoint & Google Slides
Business Report
Construction Project Dashboard Template for PowerPoint & Google Slides
Project
Employee Headcount Dashboard Report Template for PowerPoint & Google Slides
Employee Performance
Engineering Maintenance Dashboard Slide for PowerPoint & Google Slides
Software Development
Incident Tracking Dashboard for PowerPoint & Google Slides
Business Plan