Colorful Venn Diagram with 4 Circle for PowerPoint & Google Slides
Description
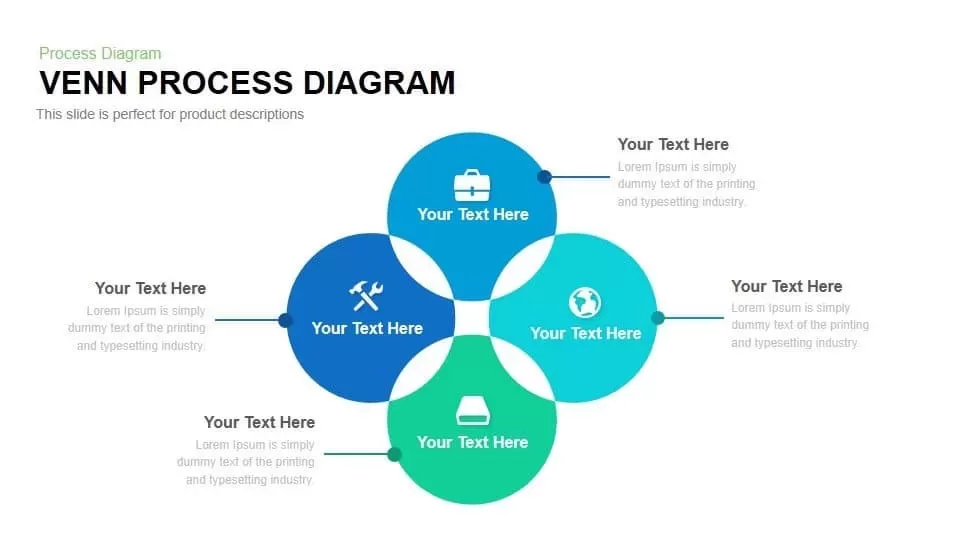
Present complex relationships with clarity using this 4 Circle Venn Diagram slide. This visually engaging diagram leverages four overlapping circles—blue, yellow, red, and dark blue—to illustrate interconnected ideas, processes, or categories. At the center, a highlighted core space emphasizes the common element shared across all four segments, making it ideal for showcasing unified strategies, overlapping roles, or combined outcomes. Each circle comes with editable icons and text placeholders, ensuring your message is both structured and visually appealing.
The clean design offers flexibility for a range of applications, from business models and project strategies to educational frameworks and research comparisons. Color-coded sections provide immediate visual distinction, enabling audiences to easily grasp how separate ideas intersect and align. Supporting text areas around the diagram allow you to elaborate on each quadrant without cluttering the central graphic.
Fully customizable, this Venn Diagram adapts seamlessly in both PowerPoint and Google Slides, giving you the ability to adjust colors, replace icons, or resize shapes according to your branding needs. Its modern style ensures a professional look in executive boardrooms, academic lectures, or team workshops. Whether analyzing market overlaps, aligning departmental goals, or teaching logical relationships, this 4 Circle Venn Diagram delivers impact through simplicity and precision.
Who is it for
Business professionals, educators, consultants, and students who need to explain relationships, overlaps, and intersections across multiple concepts in a clear and structured way.
Other Uses
This Venn Diagram can also be repurposed for brainstorming sessions, marketing strategy comparisons, team role allocations, academic presentations, or visualizing customer journey overlaps. It is equally effective for data analysis, research frameworks, or corporate training programs.
Login to download this file


