3D Conversion Funnel Diagram Infographic Template for PowerPoint & Google Slides
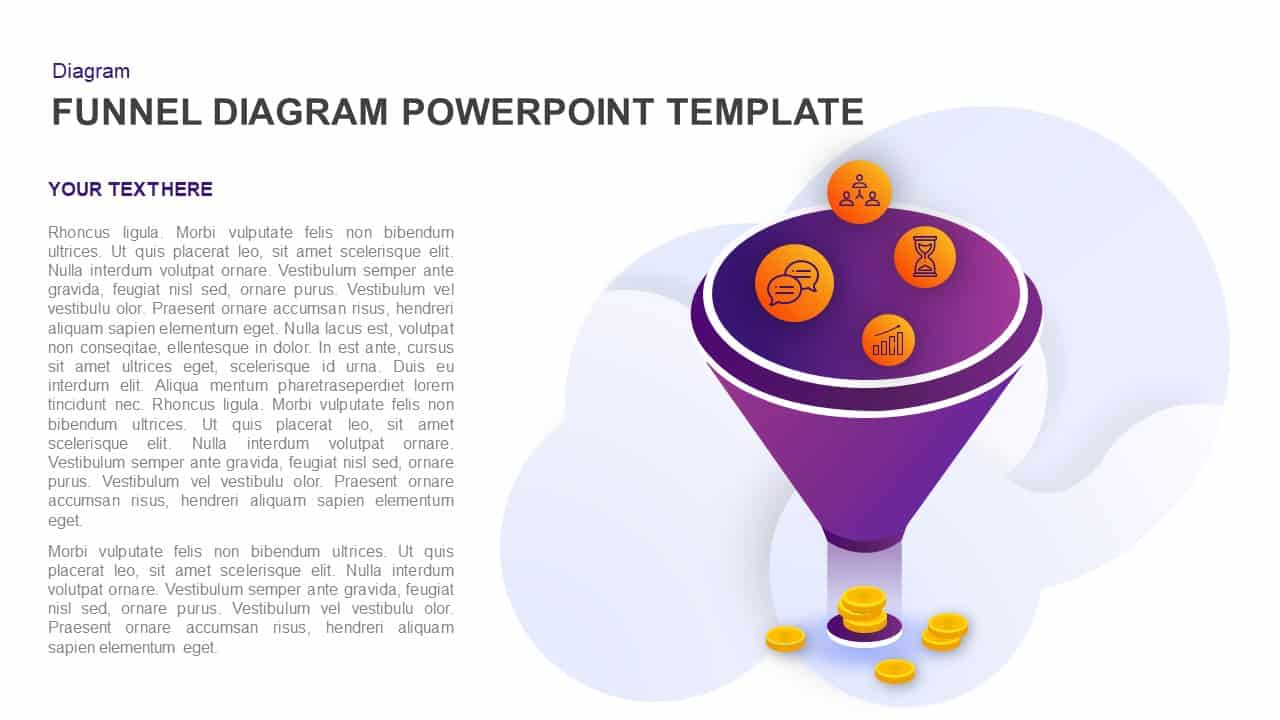
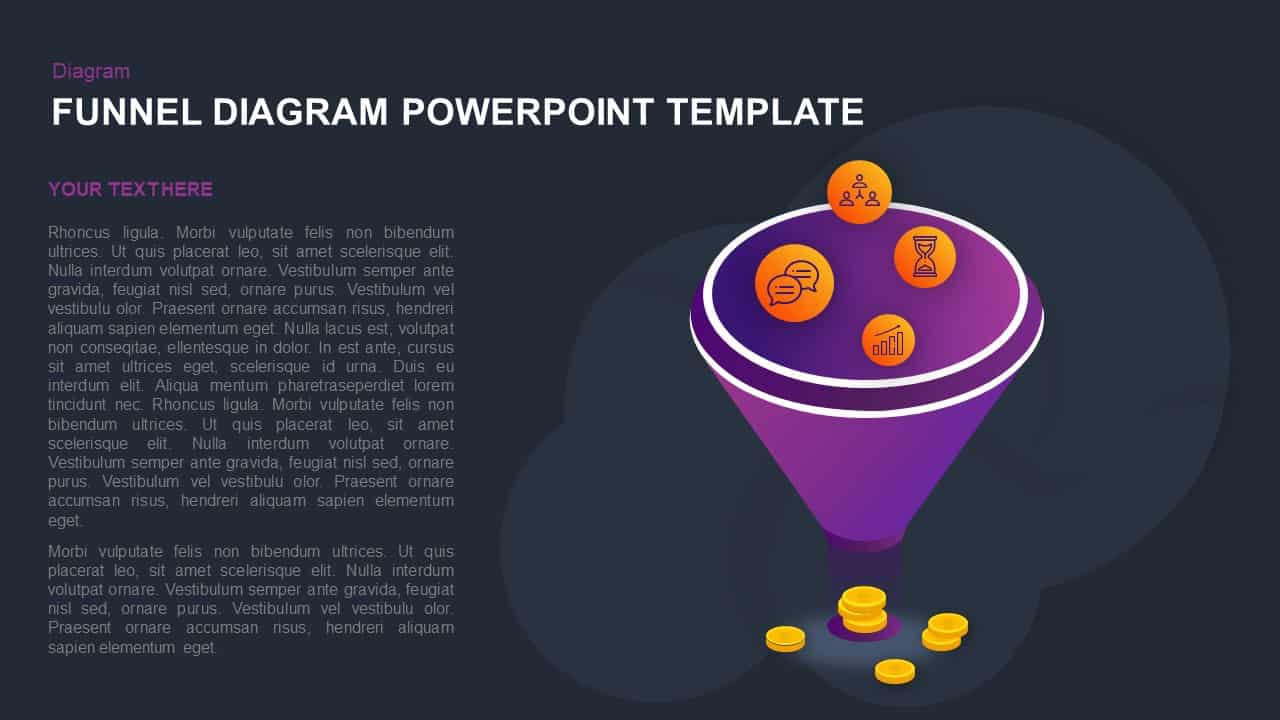

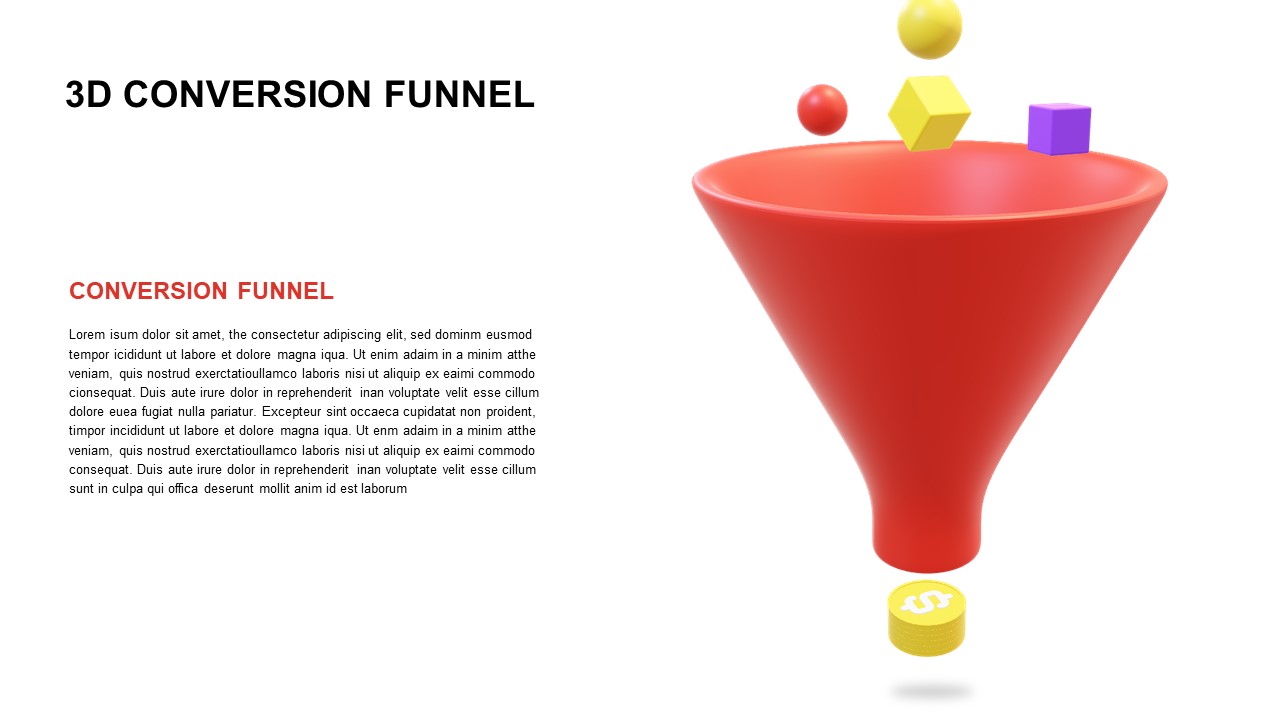
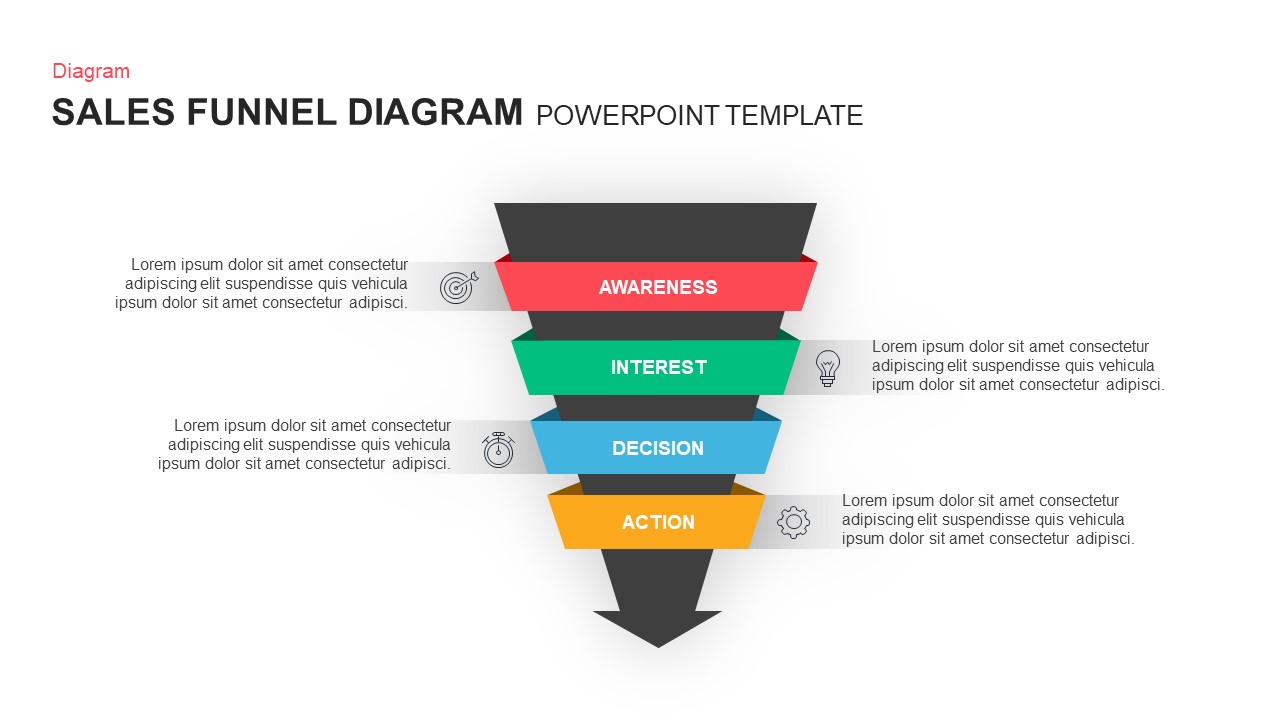
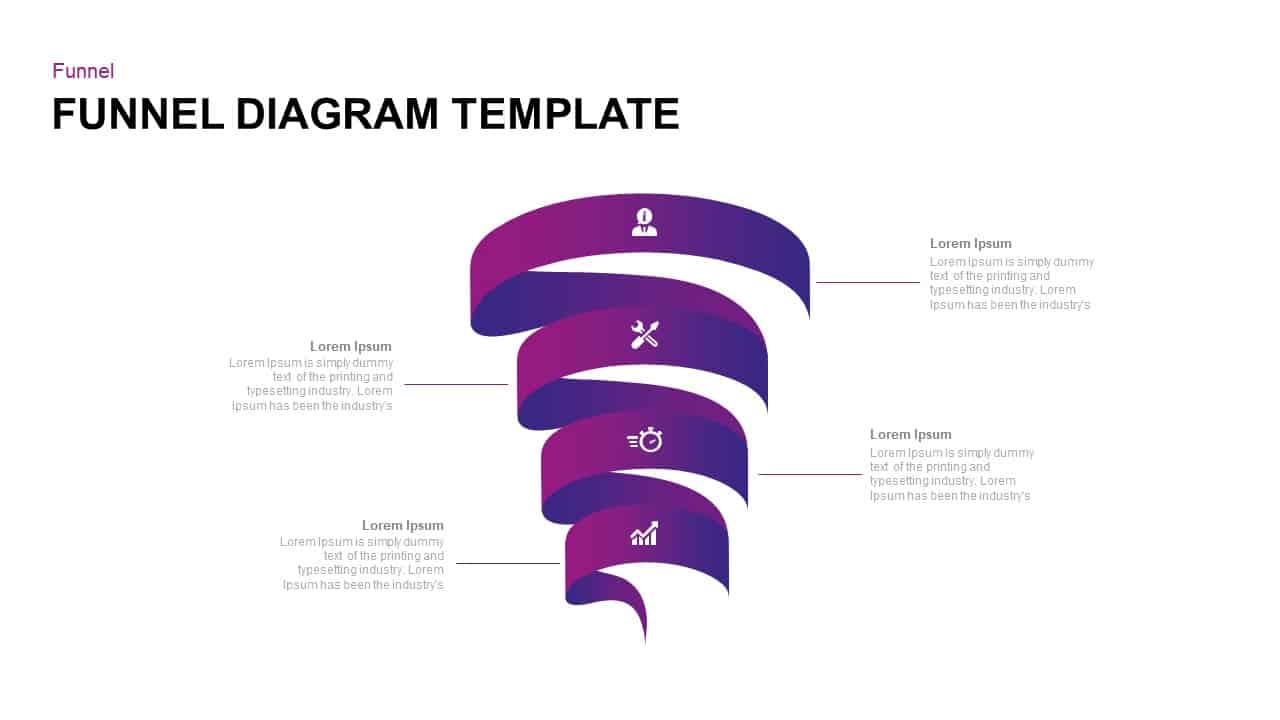
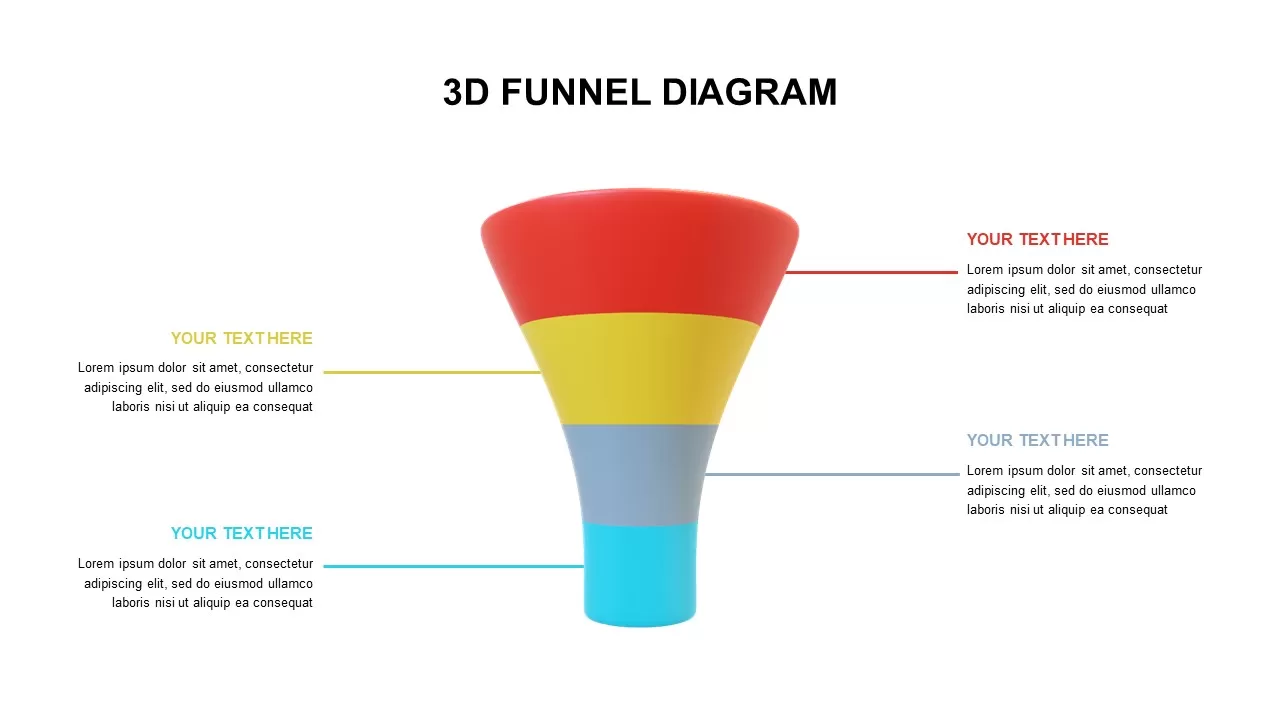
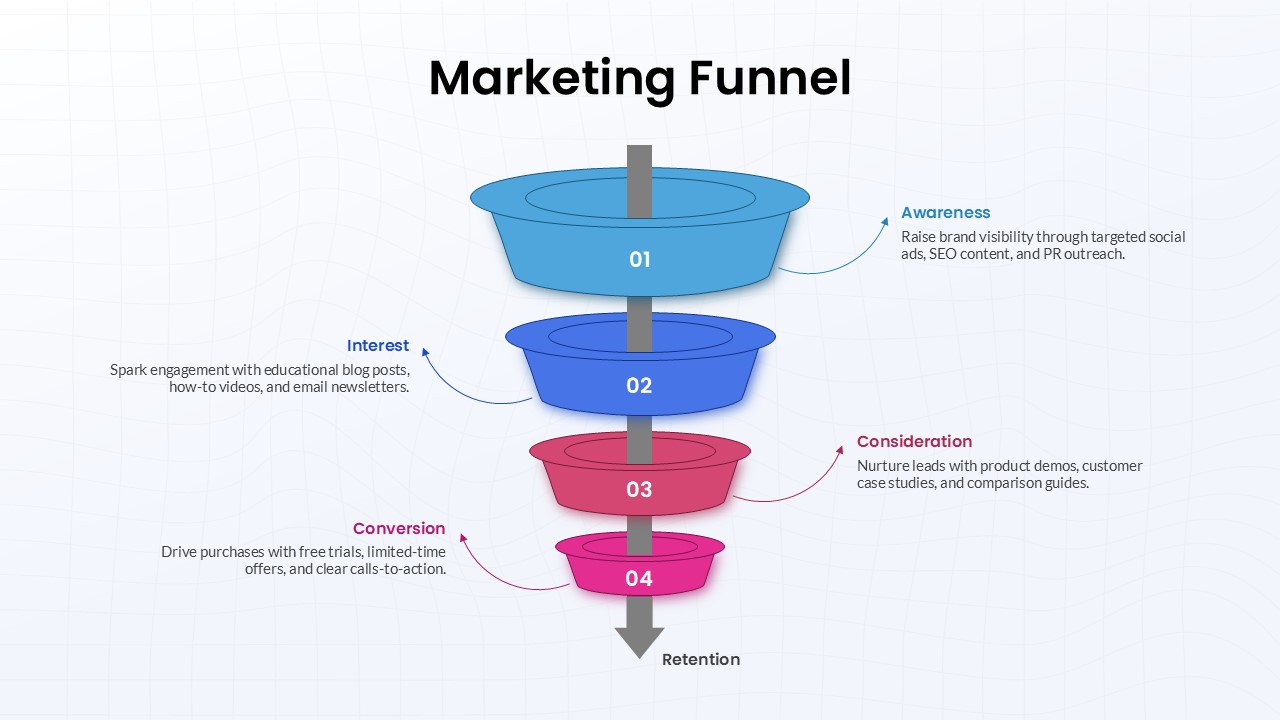
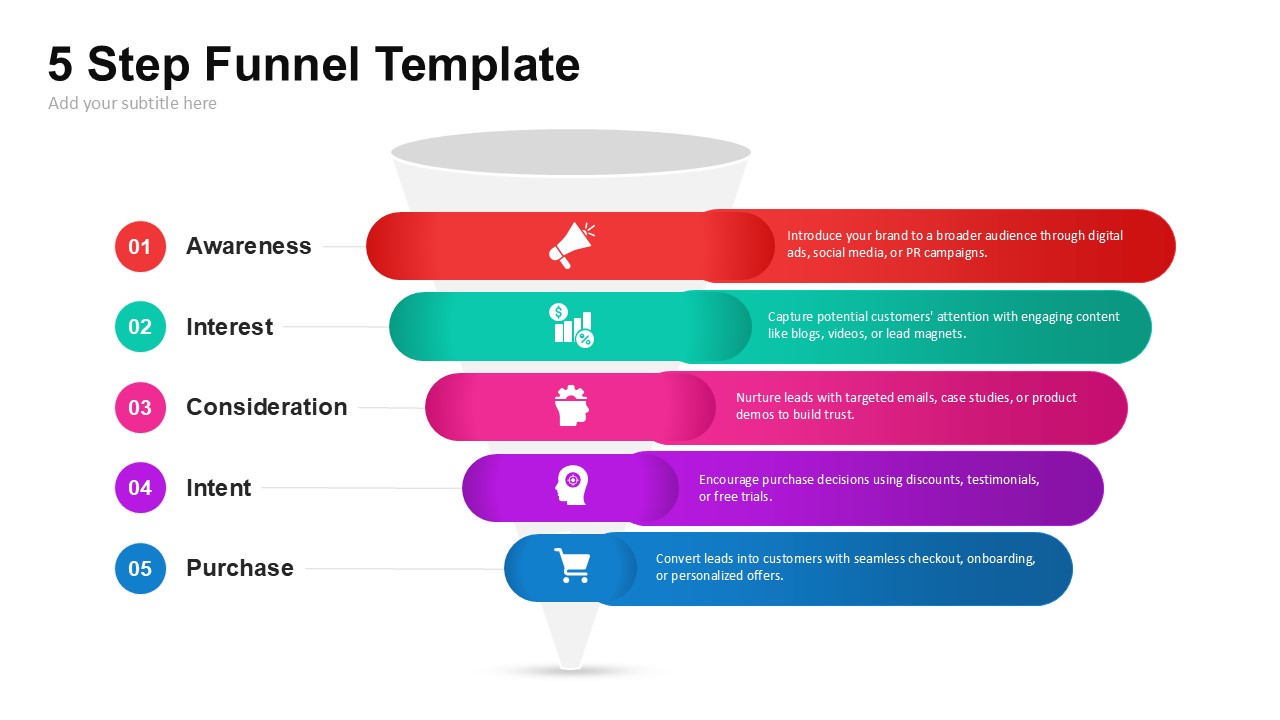
Use this eye-catching 3D conversion funnel diagram to visualize lead progression and conversion metrics with professional finesse. A rich purple gradient funnel dominates the right side of the slide, its top mouth receiving four vibrant orange icon bubbles—representing Awareness, Interest, Evaluation, and Decision stages—and narrowing to a transparent chute that dispenses golden coins, symbolizing successful conversions. The isometric shading and subtle drop shadows create depth, guiding viewers’ eyes from initial inputs to revenue outputs. If you’d like to explore similar designs, check out our full range of funnel templates for different business needs.
Fully constructed on master slides with editable vector shapes, this template empowers you to customize every element in seconds. Swap the stage icons, adjust gradient stops, or resize the funnel to suit your brand palette without disrupting the layout. Add or remove icon bubbles to expand or contract the funnel stages, and update text placeholders directly on the slide. Built-in animation presets allow you to reveal each stage sequentially, reinforcing the narrative flow and keeping your audience engaged.
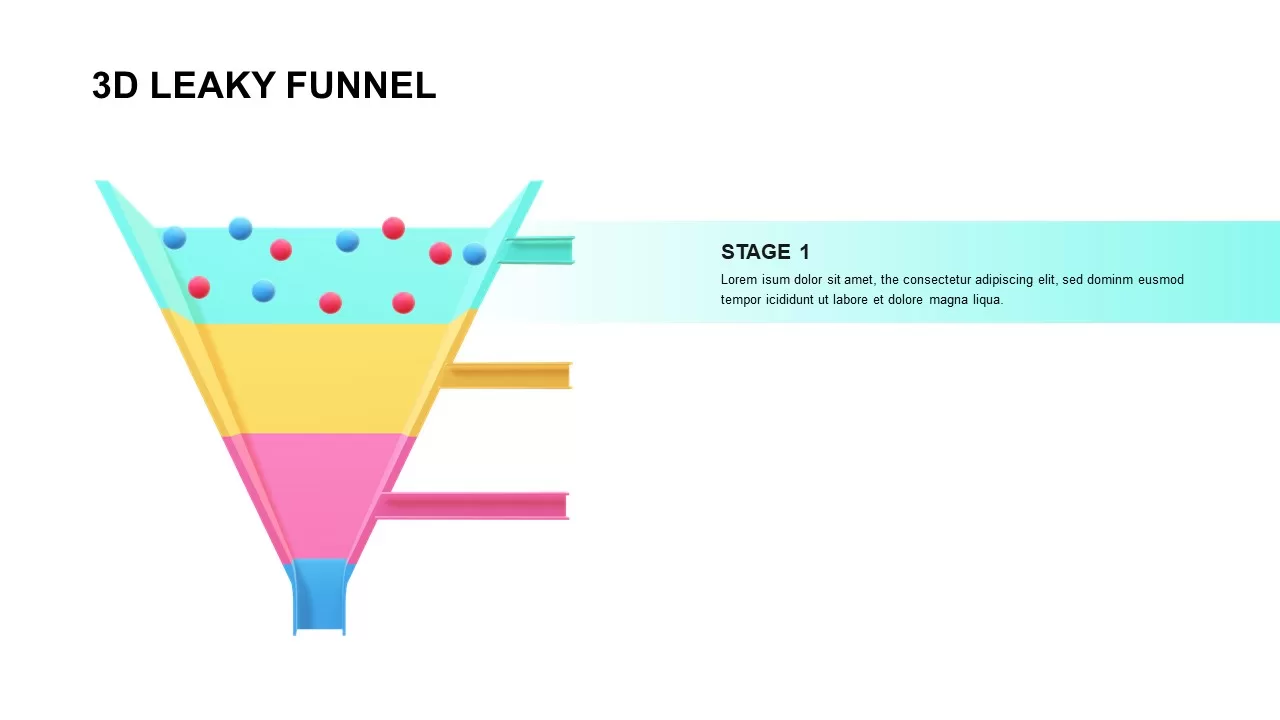
Designed for seamless compatibility across PowerPoint and Google Slides, this slide maintains pixel-perfect clarity on any device and simplifies version control when collaborating with distributed teams. The clean white background and neutral gray typography ensure maximum readability, while the dual-color accent scheme emphasizes key data points without overpowering the overall design. Whether you need to pinpoint leakages in your funnel, benchmark stage-by-stage performance, or illustrate projected ROI, templates like the 3d leaky funnel diagram offer additional options to track how opportunities drop off across different stages.
Who is it for
Sales leaders, marketing managers, and growth analysts will rely on this template to diagnose drop-off points, optimize campaign funnels, and report conversion metrics. Consultants, startup founders, and digital strategists can leverage its clear 3D layout to align stakeholders around performance goals and revenue forecasts.
Other Uses
Beyond lead-generation funnels, repurpose this slide to map recruitment pipelines, project intake processes, or resource-allocation workflows. Simply replace icons and labels to illustrate any multi-stage progression—from product development lifecycles to customer onboarding journeys. For in-depth performance tracking, the funnel analysis template can be used alongside this diagram to showcase conversion data and stage-specific metrics in detail.
Login to download this file

Item ID
SB01157
Related Templates

Free 3D Conversion Funnel Overview template for PowerPoint & Google Slides
Funnel
Free
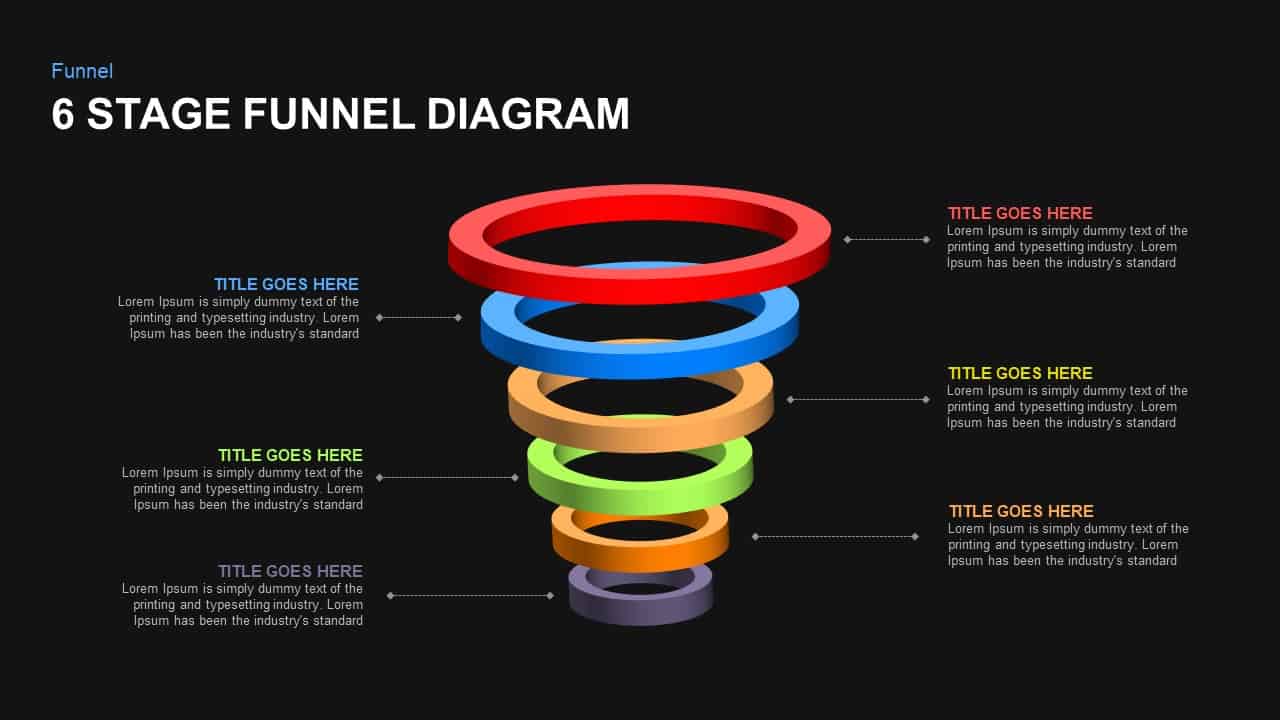
6-Stage Funnel Diagram Infographic Template for PowerPoint & Google Slides
Funnel
Four-Stage Funnel Diagram Infographic Template for PowerPoint & Google Slides
Funnel
Four-Stage Funnel Diagram Infographic Template for PowerPoint & Google Slides
Funnel
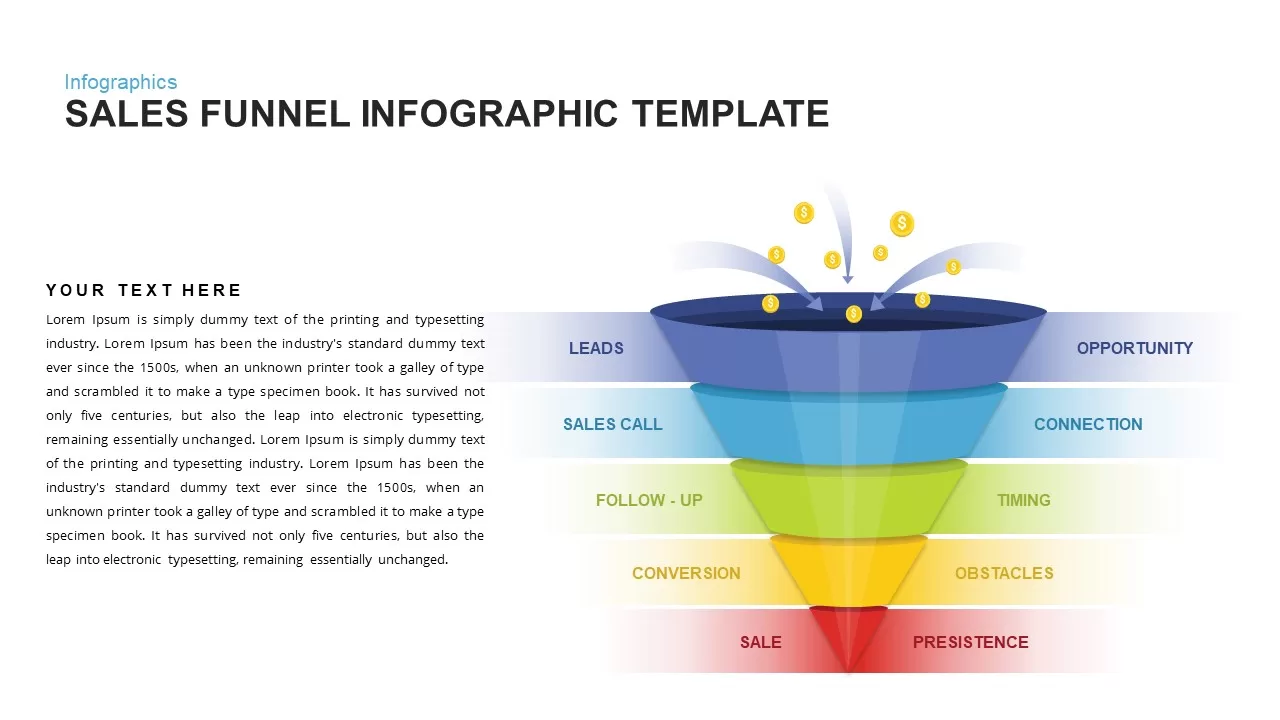
Sales Funnel Infographic Diagram Template for PowerPoint & Google Slides
Funnel
Professional 3D Funnel Infographic Template for PowerPoint & Google Slides
Funnel
Gradient 5-Stage Funnel Infographic Template for PowerPoint & Google Slides
Funnel
Five-Stage Marketing Funnel Infographic Template for PowerPoint & Google Slides
Funnel
Four-Step Funnel Infographic Pack Template for PowerPoint & Google Slides
Funnel
Free Multi-Step Funnel Infographic Slide Pack Template for PowerPoint & Google Slides
Funnel
Free
Sales Process Workflow Funnel Diagram PowerPoint Template for PowerPoint & Google Slides
Funnel
Business Funnel Diagram template for PowerPoint & Google Slides
Funnel
AARRR Funnel Diagram template for PowerPoint & Google Slides
Funnel
Funnel Diagram Template for PowerPoint & Google Slides
Infographics
4 Level Funnel Diagram Template for PowerPoint & Google Slides
Funnel
Funnel Diagram template for PowerPoint & Google Slides
Funnel
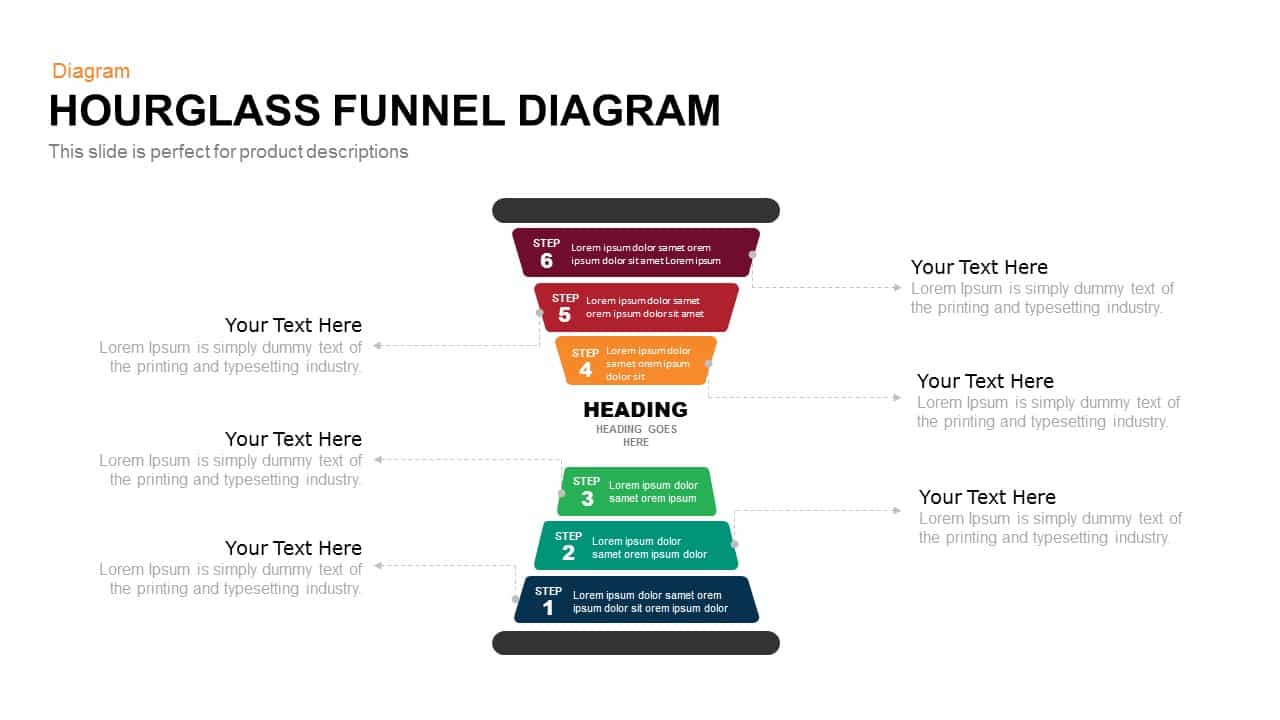
Hourglass Funnel Diagram Process Template for PowerPoint & Google Slides
Funnel
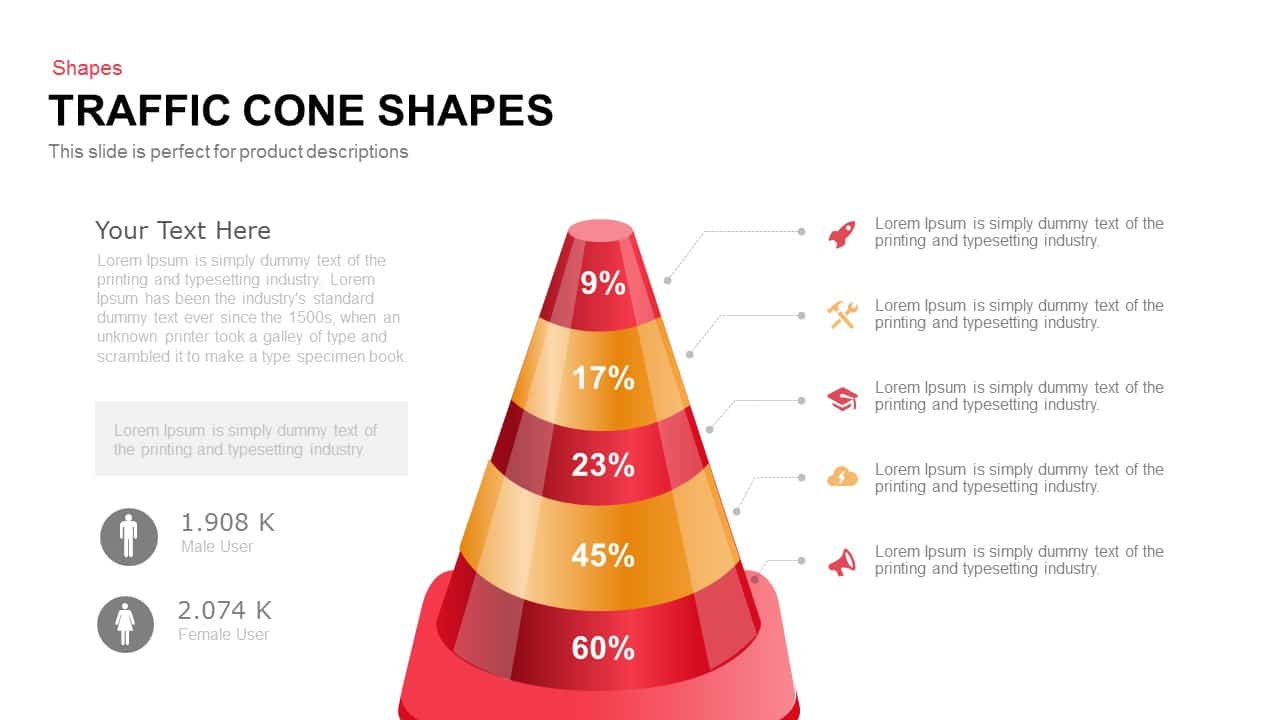
Traffic Cone Funnel Diagram Slide Template for PowerPoint & Google Slides
Funnel
Professional Four-Stage Funnel Diagram Template for PowerPoint & Google Slides
Funnel
Four and Five-Stage Funnel Diagram Template for PowerPoint & Google Slides
Funnel
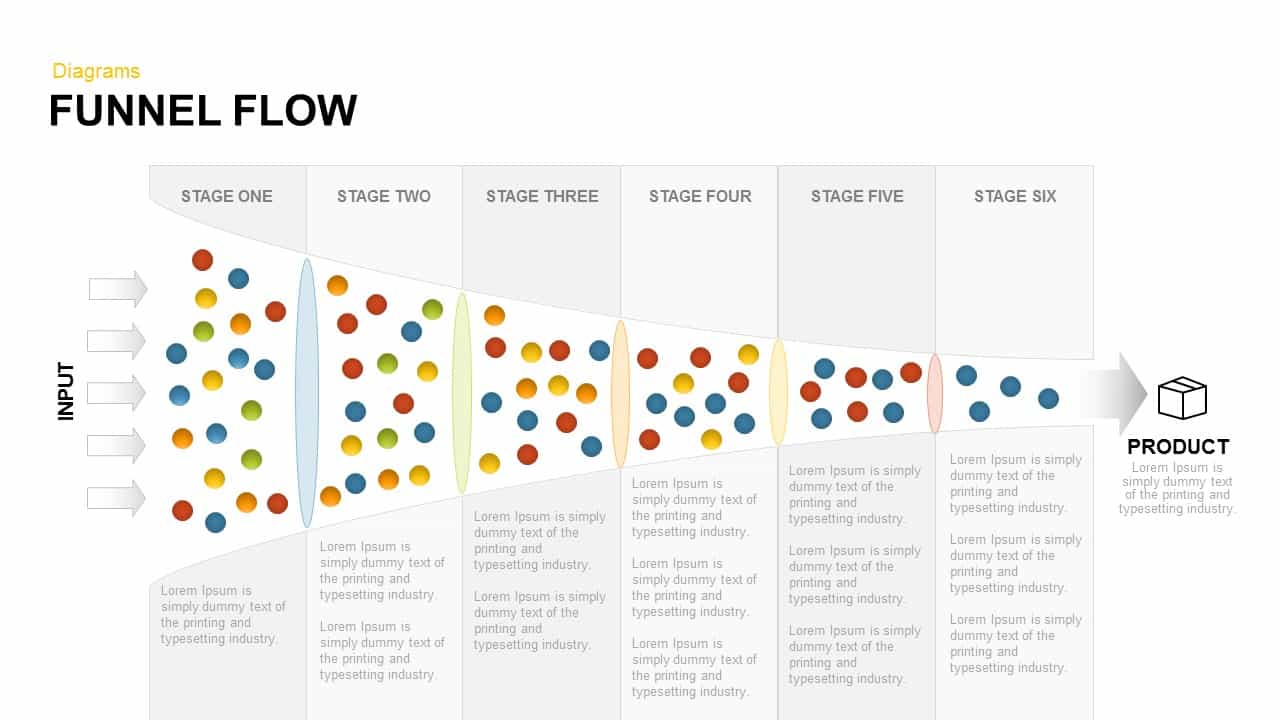
Funnel Flow Diagram template for PowerPoint & Google Slides
Funnel
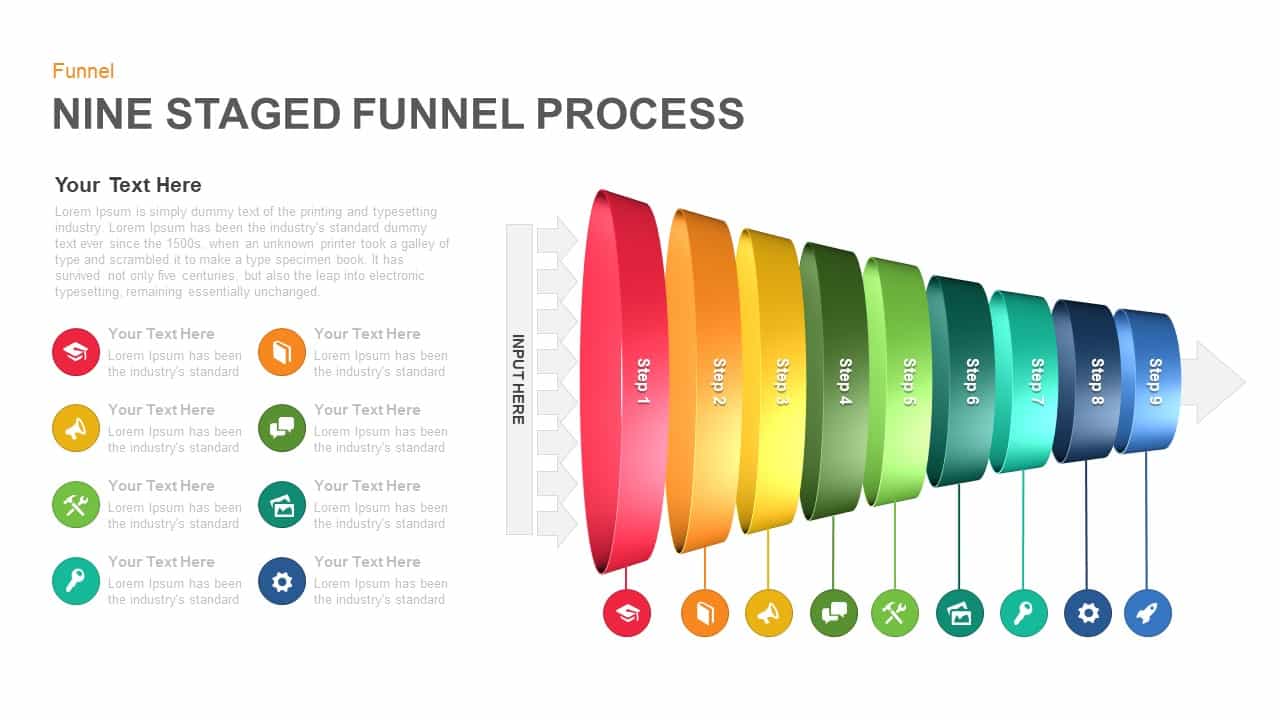
Nine-Stage 3D Funnel Process Diagram Template for PowerPoint & Google Slides
Funnel
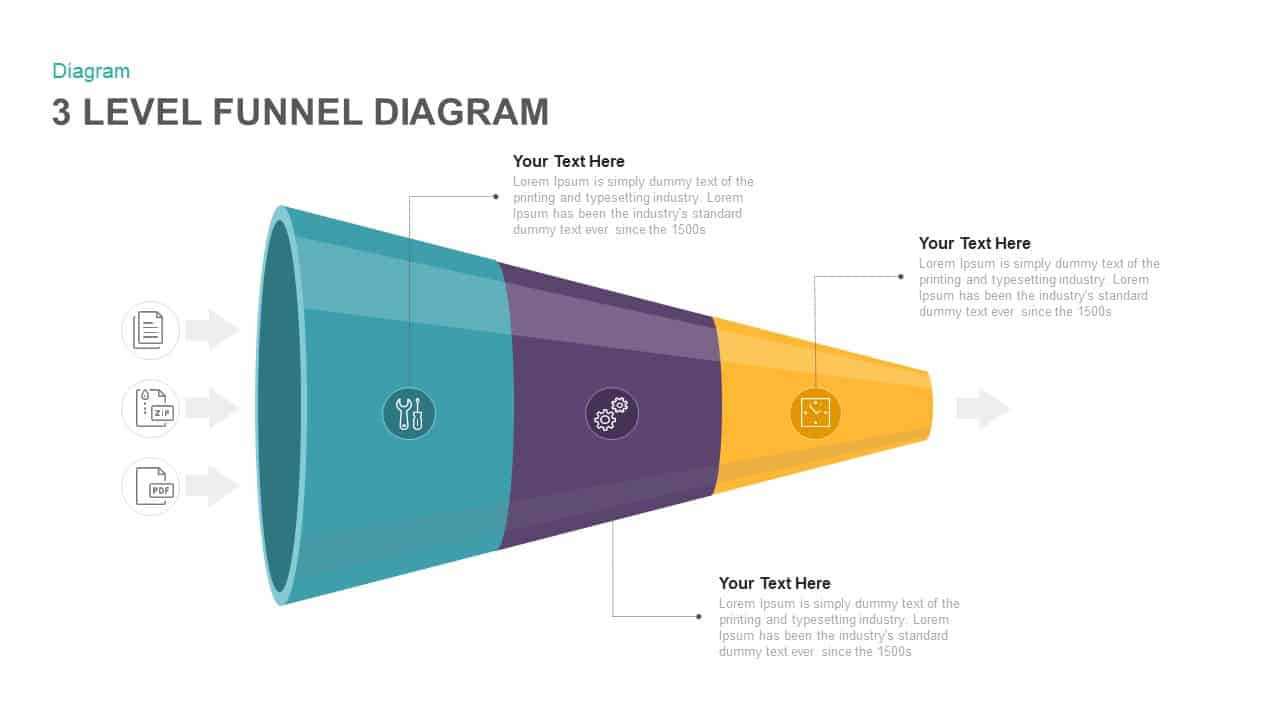
Three Level Funnel Process Diagram Template for PowerPoint & Google Slides
Funnel

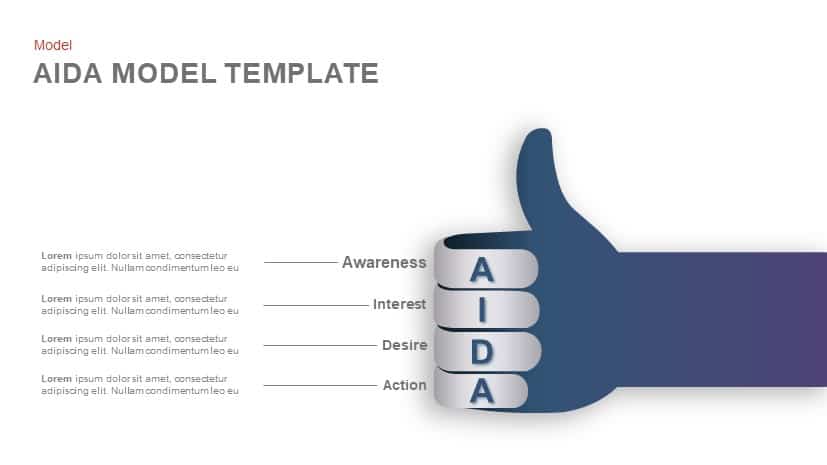
AIDA Model Funnel Thumb Diagram Template for PowerPoint & Google Slides
Process
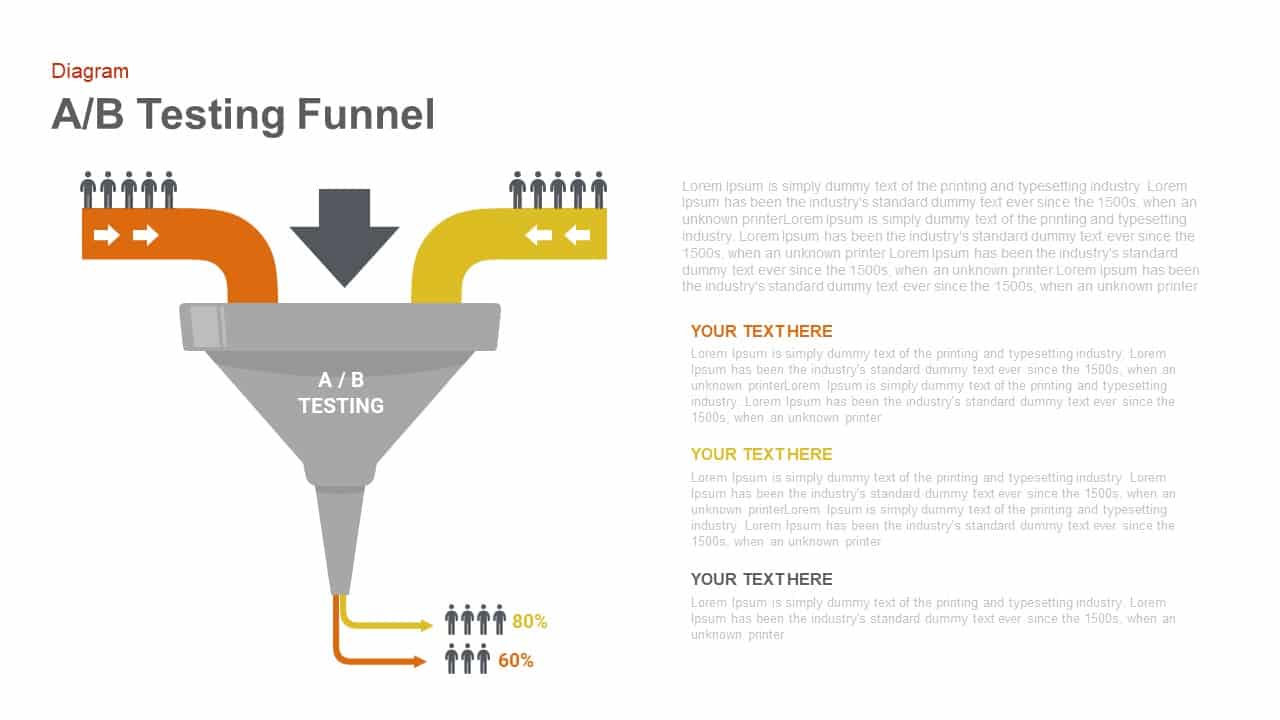
A/B Testing Funnel Diagram Template for PowerPoint & Google Slides
Digital Marketing
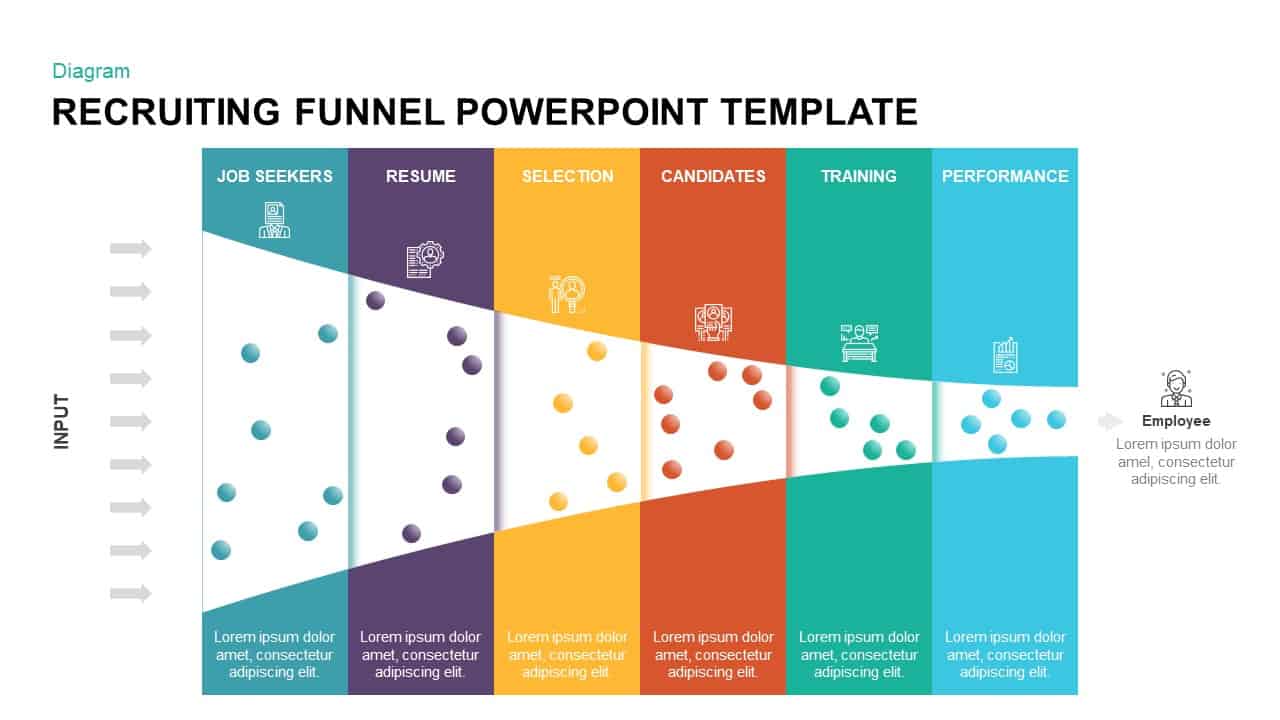
Animated Recruiting Funnel Diagram Template for PowerPoint & Google Slides
Funnel
Professional Sales Funnel Diagram Template for PowerPoint & Google Slides
Funnel
Five-Step Gradient Blue Funnel Diagram Template for PowerPoint & Google Slides
Funnel
Four-Step Spiral Funnel Diagram Template for PowerPoint & Google Slides
Funnel
5-Step Colorful Funnel Diagram Template for PowerPoint & Google Slides
Funnel
Free 4-Step 3D Funnel Diagram Template for PowerPoint & Google Slides
Funnel
Free
3D Leaky Funnel Diagram template for PowerPoint & Google Slides
Funnel
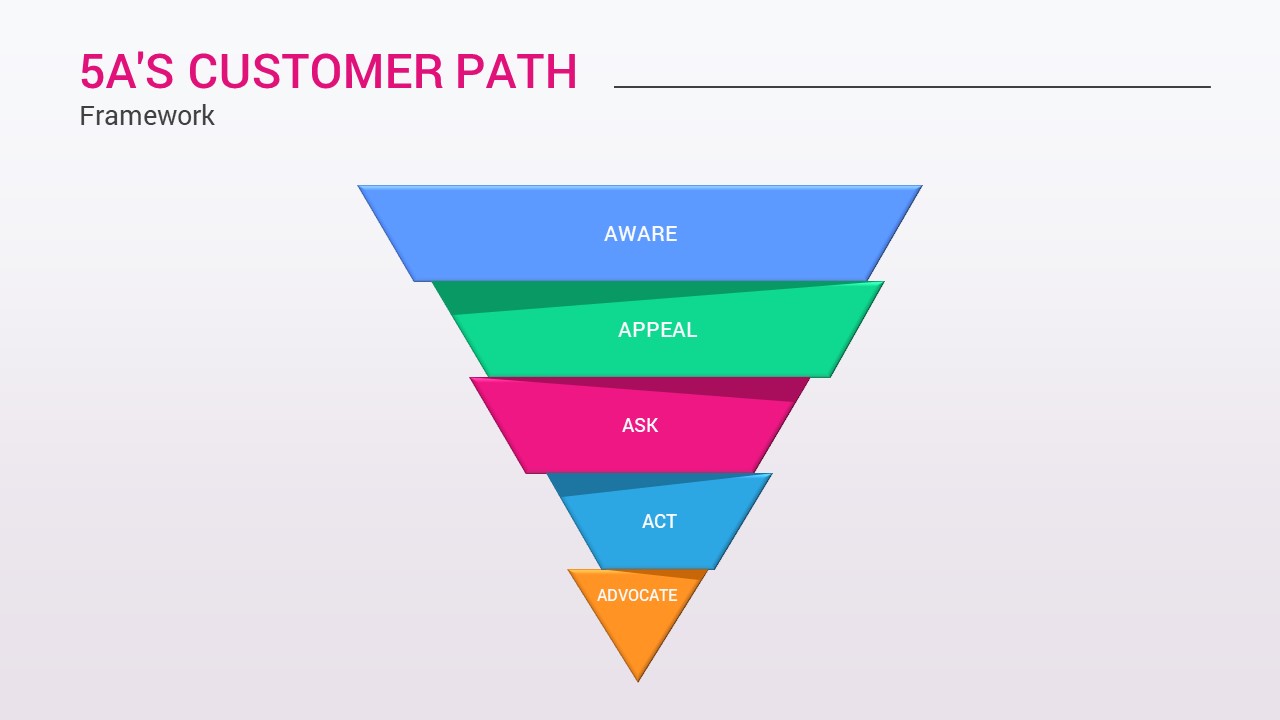
5A’s Customer Path Funnel Diagram Template for PowerPoint & Google Slides
Funnel
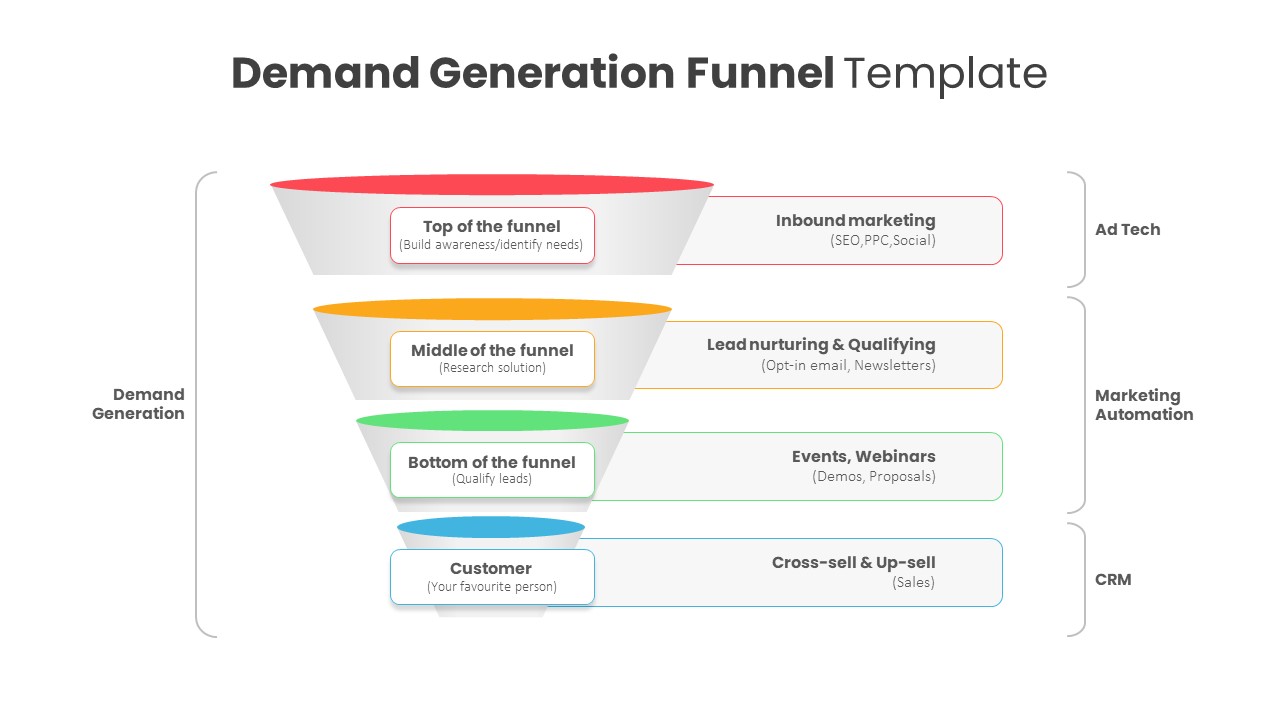
Demand Generation Funnel Diagram Template for PowerPoint & Google Slides
Funnel
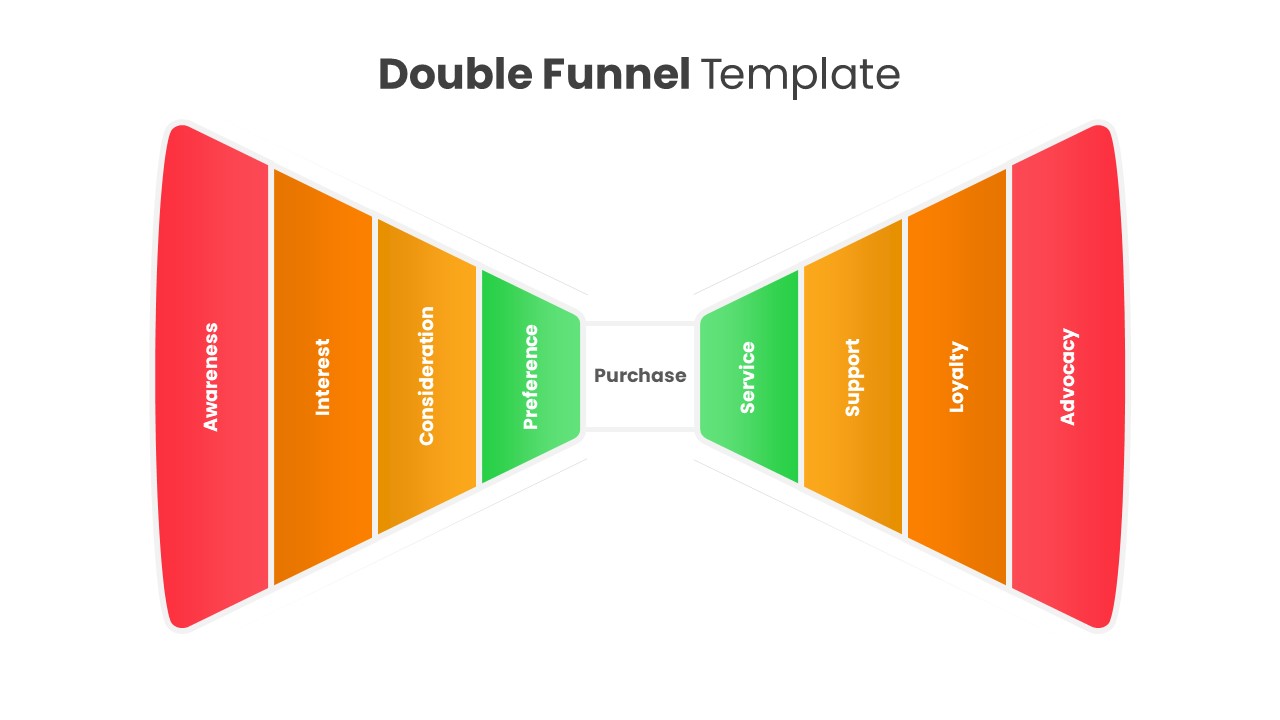
Double Funnel Lifecycle Diagram Template for PowerPoint & Google Slides
Funnel
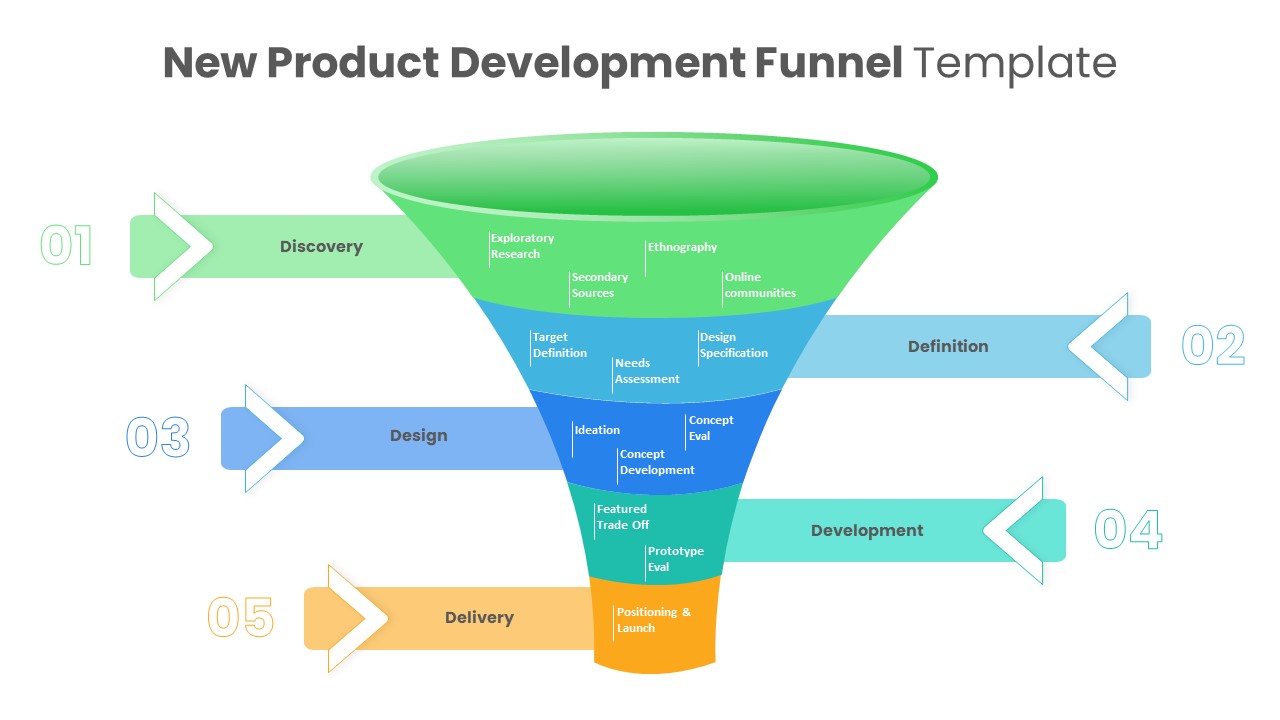
New Product Development Funnel Diagram Template for PowerPoint & Google Slides
Funnel
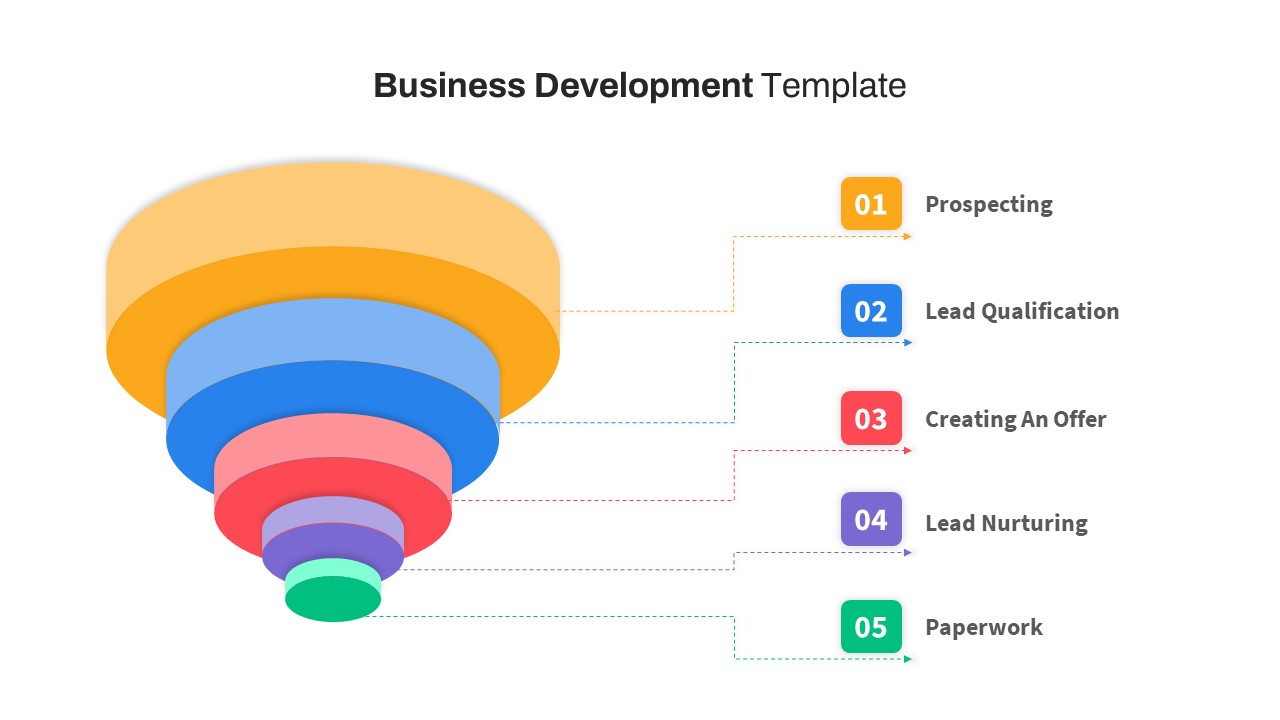
Free Business Development Funnel Diagram Template for PowerPoint & Google Slides
Marketing Funnel
Free
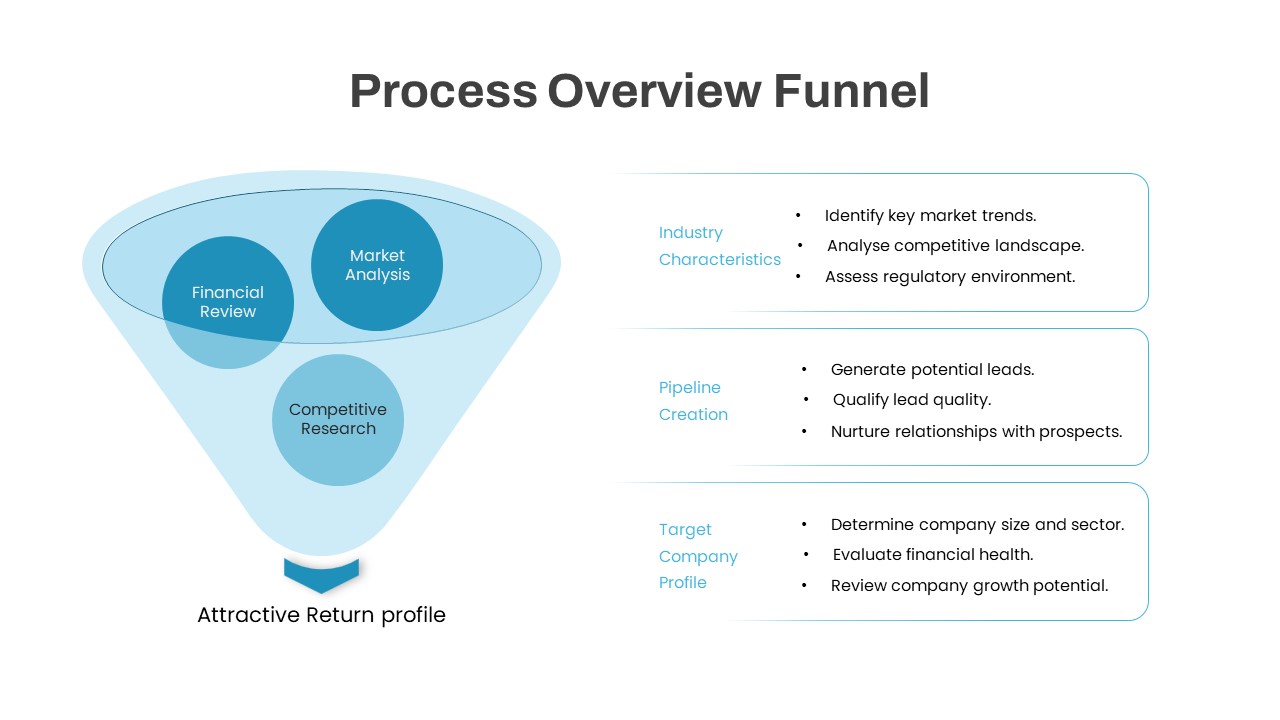
Process Overview Funnel Diagram Template for PowerPoint & Google Slides
Funnel
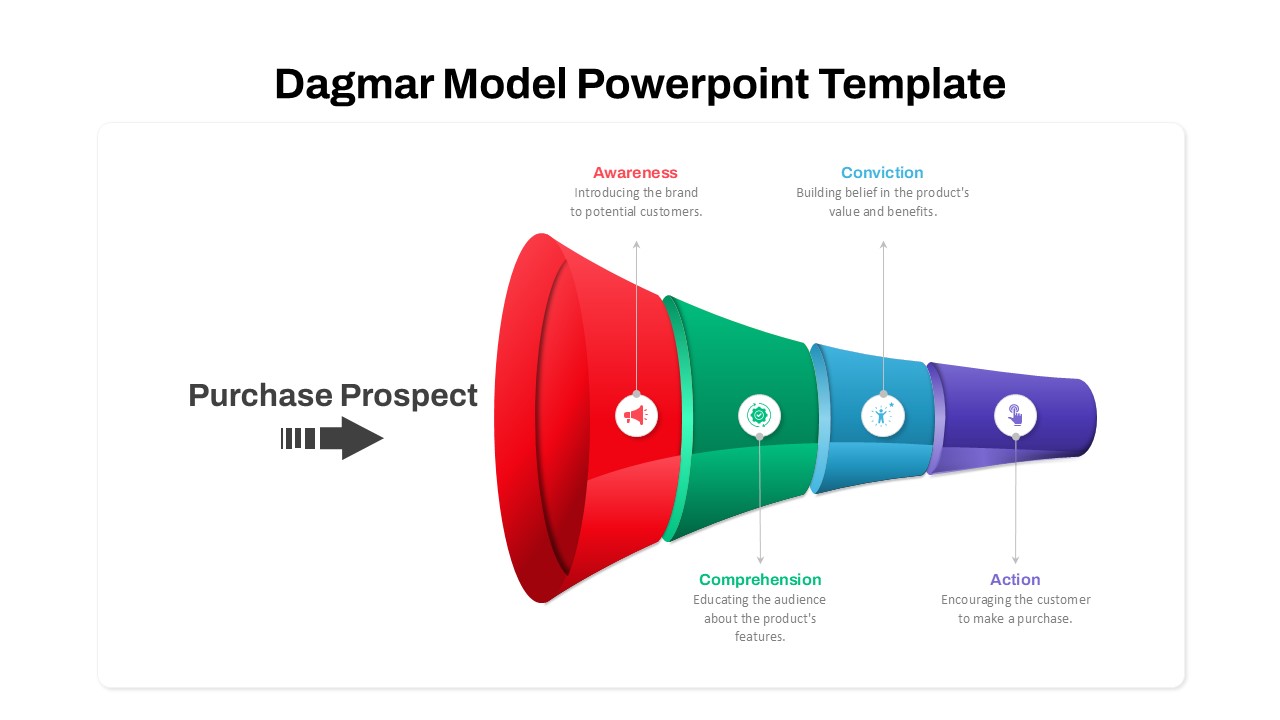
Dagmar Model Marketing Funnel Diagram Template for PowerPoint & Google Slides
Funnel
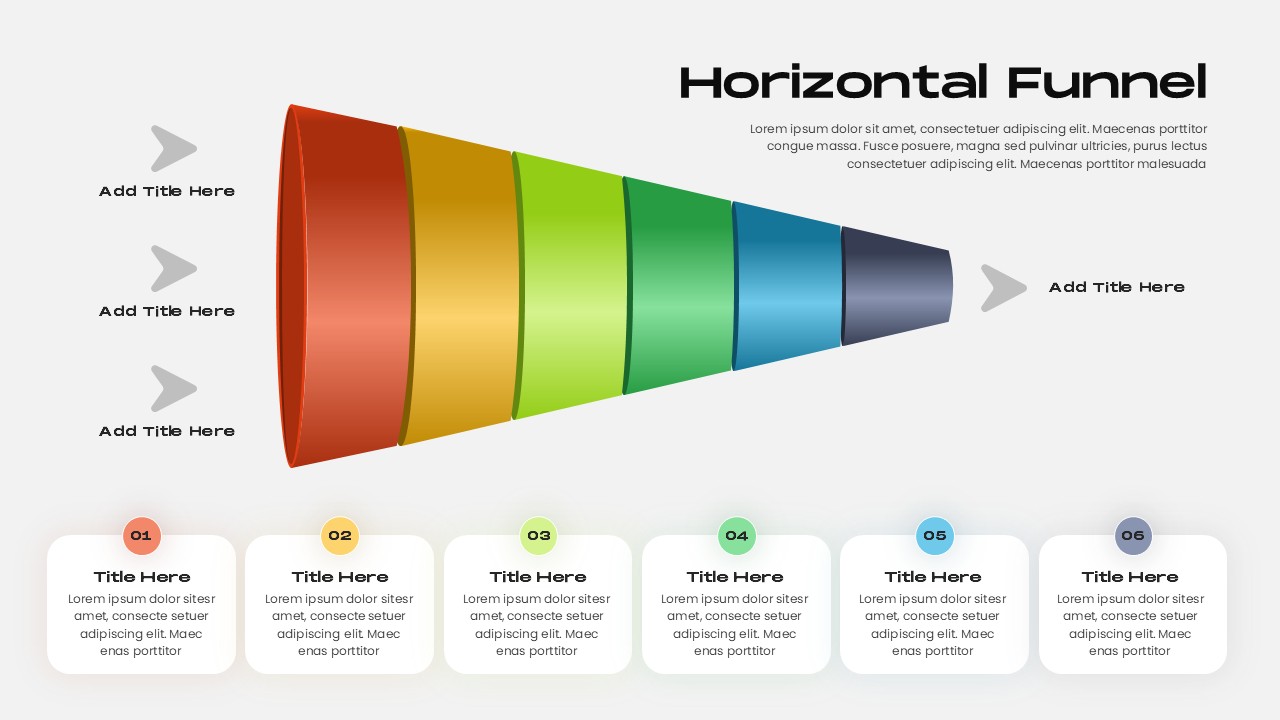
Horizontal Funnel Diagram Process Template for PowerPoint & Google Slides
Funnel
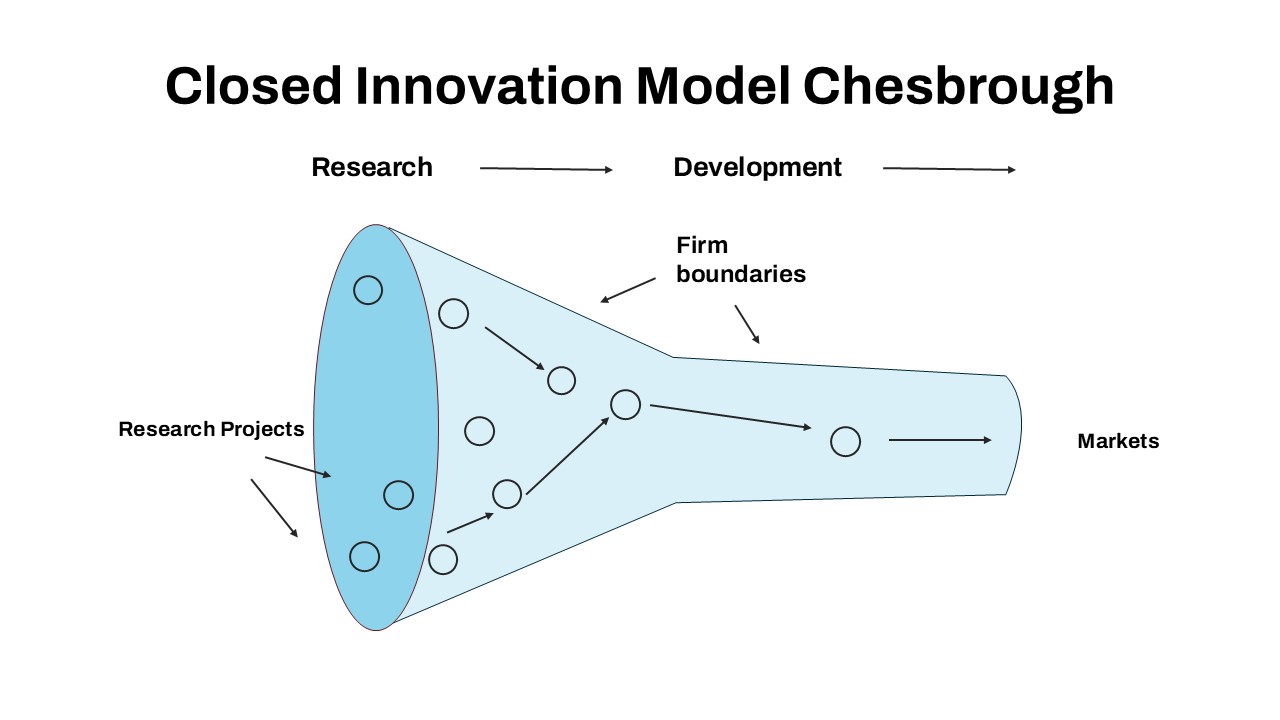
Closed Innovation Model Funnel Diagram Template for PowerPoint & Google Slides
Funnel
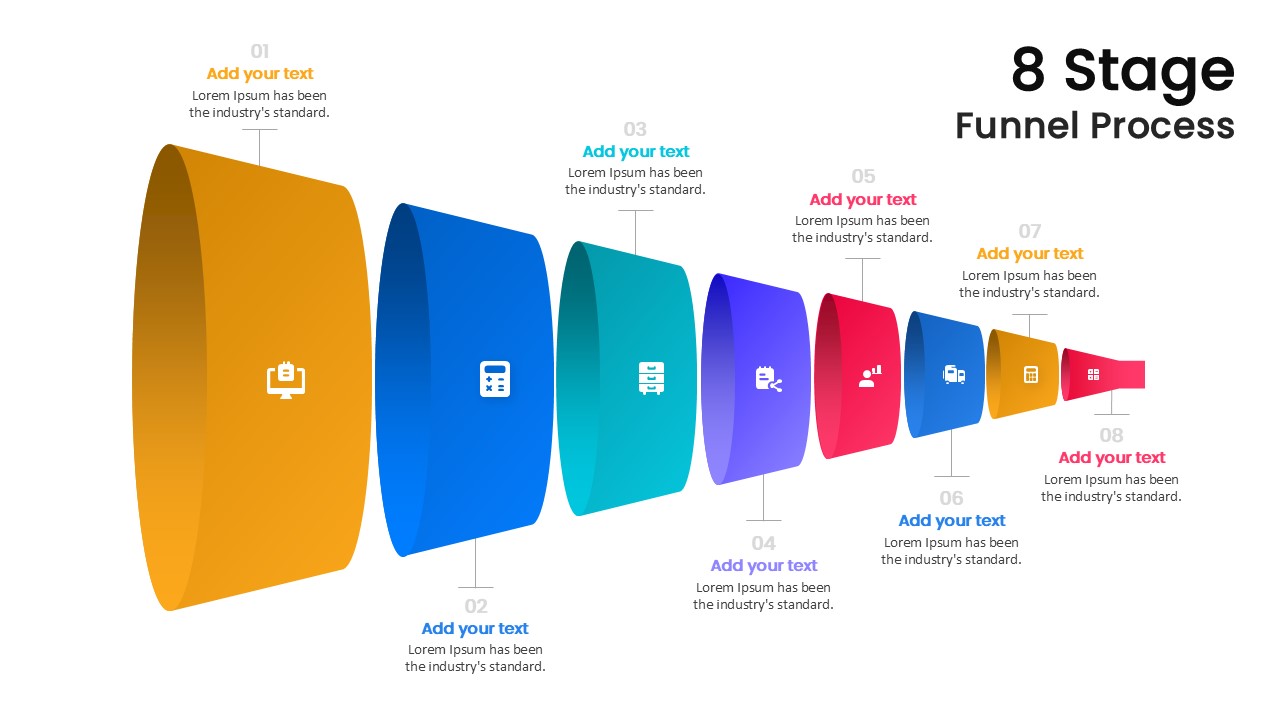
Modern 8-Stage Funnel Process Diagram Template for PowerPoint & Google Slides
Funnel
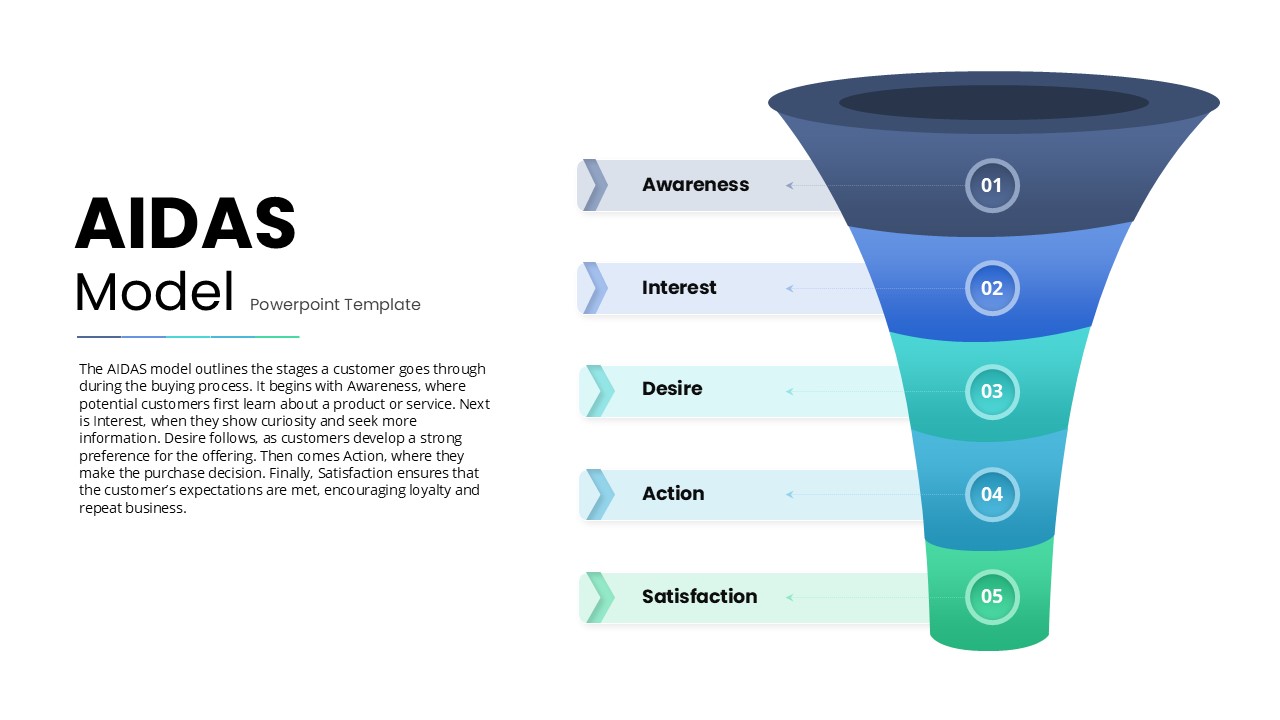
AIDAS Customer Journey Funnel Diagram Template for PowerPoint & Google Slides
Marketing Funnel
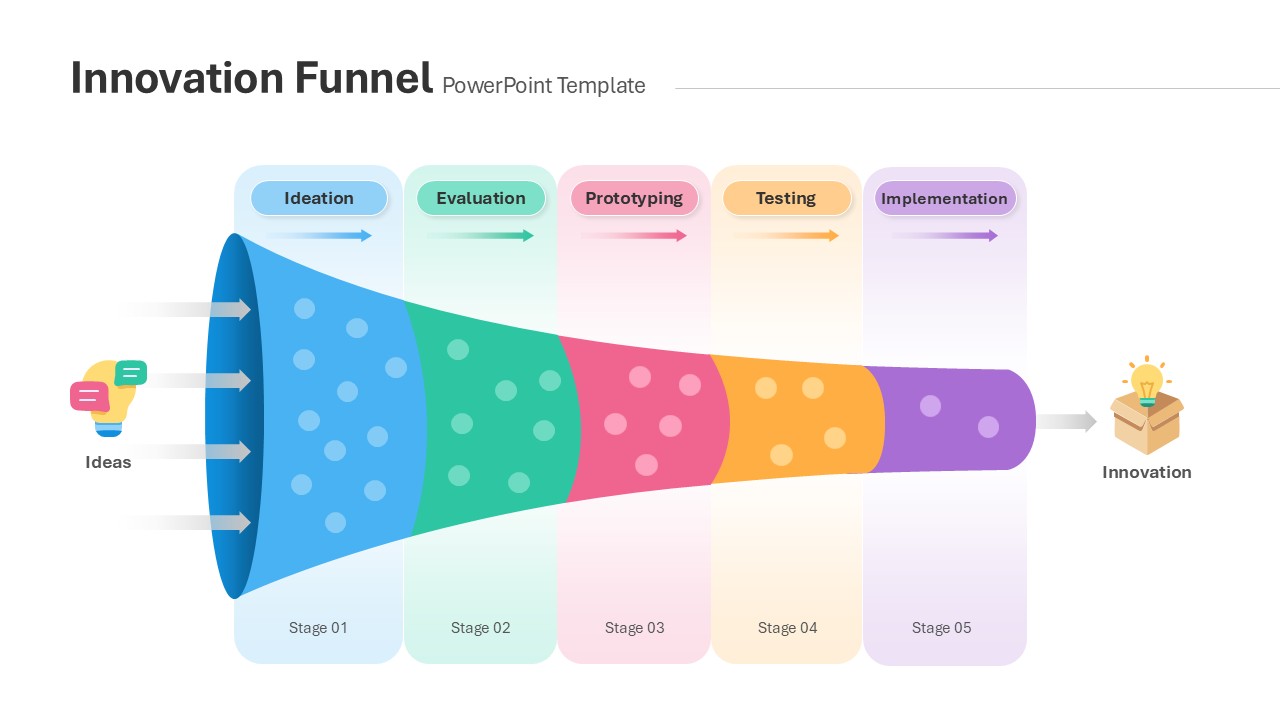
Innovation Funnel Process Diagram Template for PowerPoint & Google Slides
Funnel
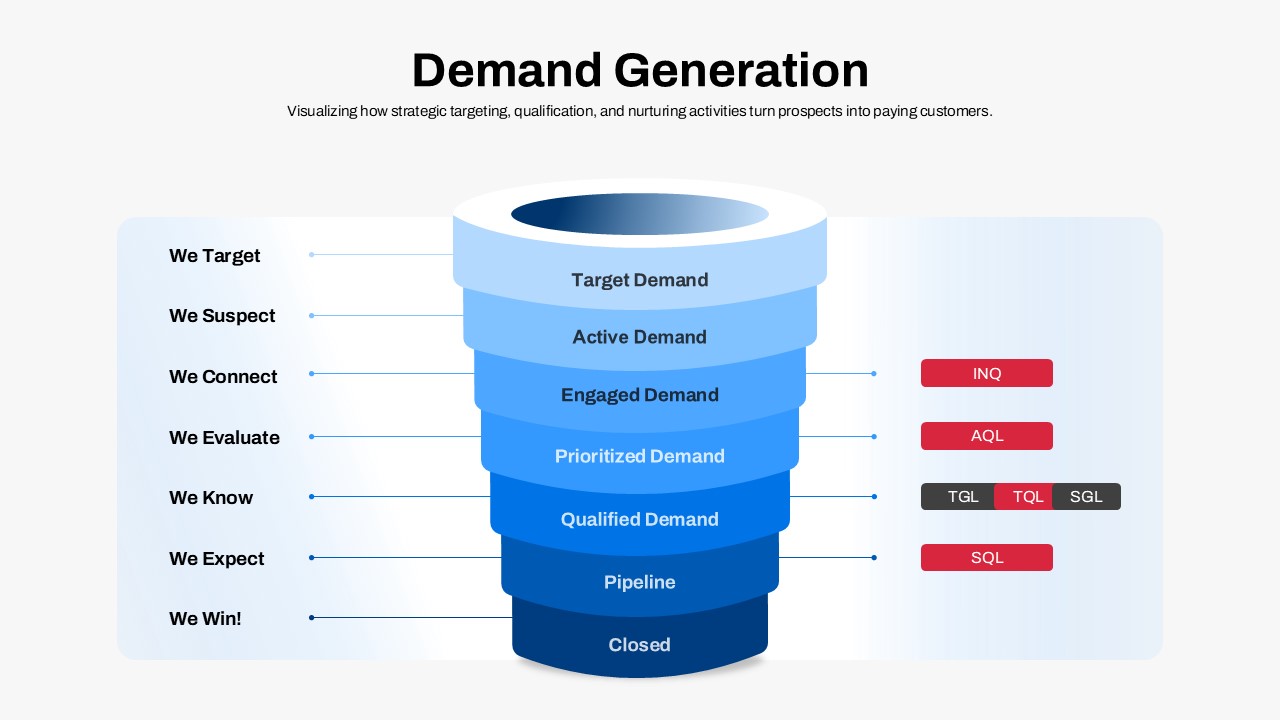
Demand Generation Funnel Process Diagram Template for PowerPoint & Google Slides
Funnel
Five-Step Modern Funnel Diagram Template for PowerPoint & Google Slides
Funnel
Four-Stage Marketing Funnel Diagram Template for PowerPoint & Google Slides
Marketing Funnel
5 Stage Sales Funnel Diagram Template for PowerPoint & Google Slides
Funnel

Sales Funnel Diagram for PowerPoint & Google Slides
Marketing Funnel
Funnel Filter Diagram for PowerPoint & Google Slides
Funnel
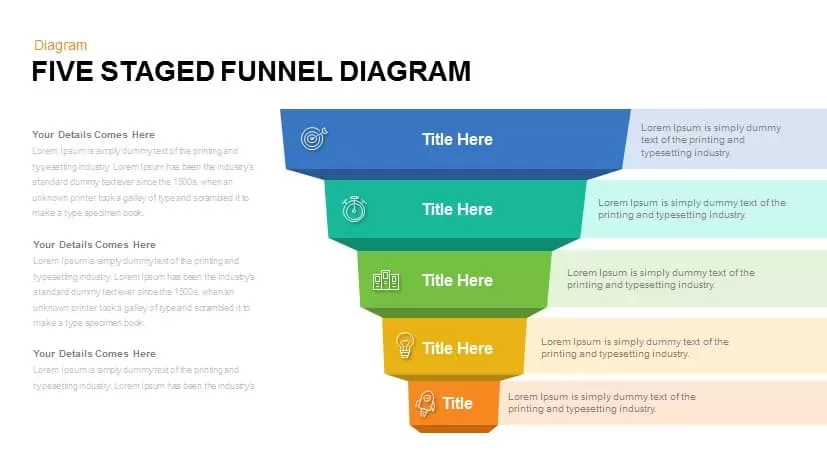
Five Staged Funnel Diagram for PowerPoint & Google Slides
Funnel
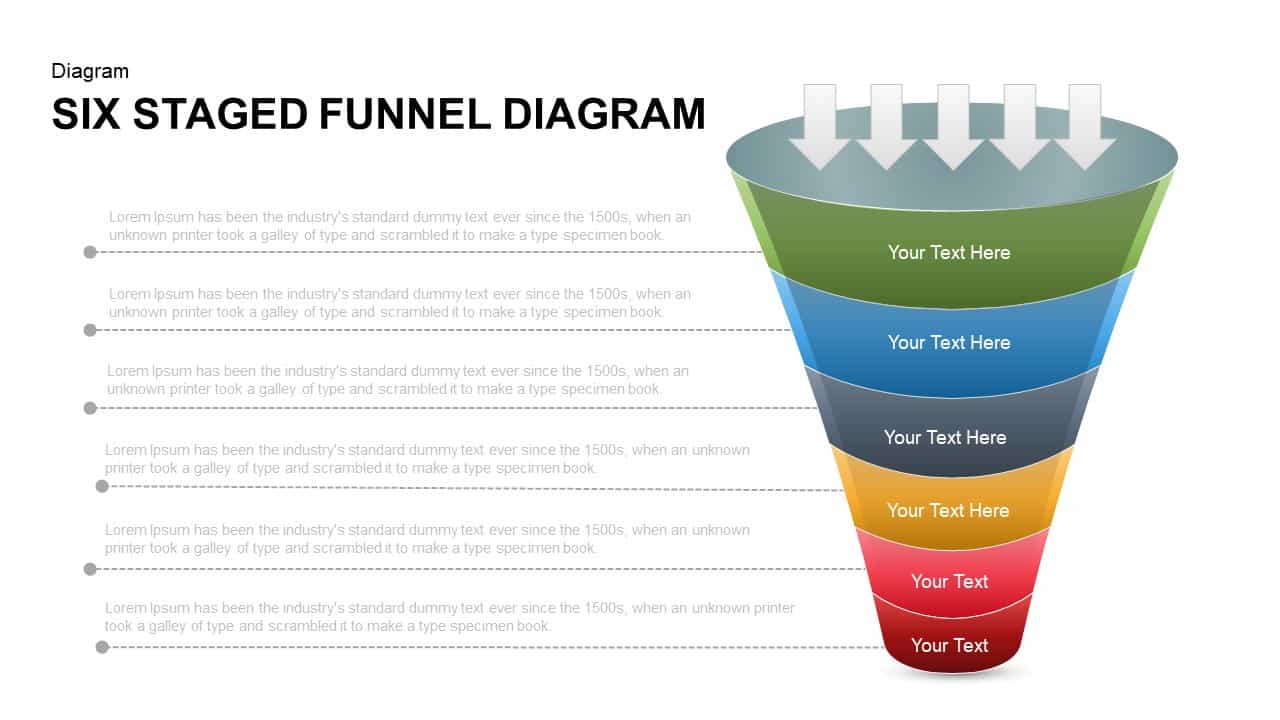
Six Staged Funnel Diagram for PowerPoint & Google Slides
Funnel
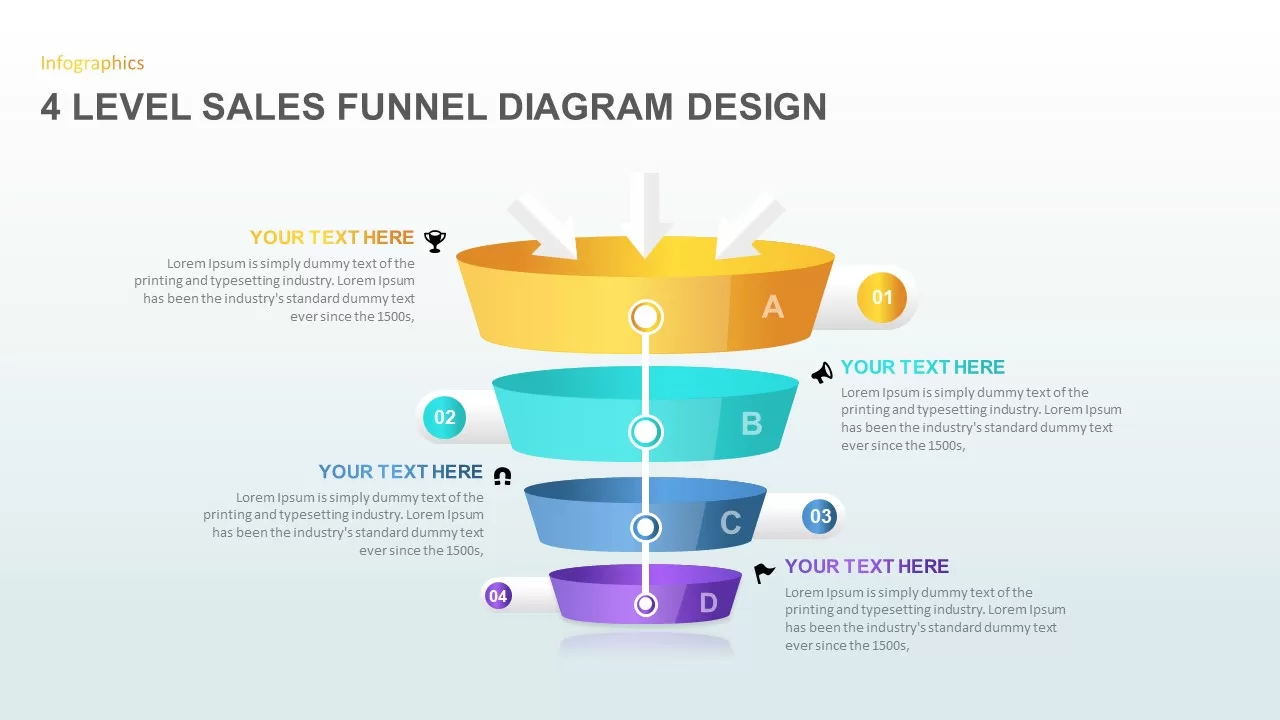
4 Level Sales Funnel Diagram Design for PowerPoint & Google Slides
Marketing Funnel
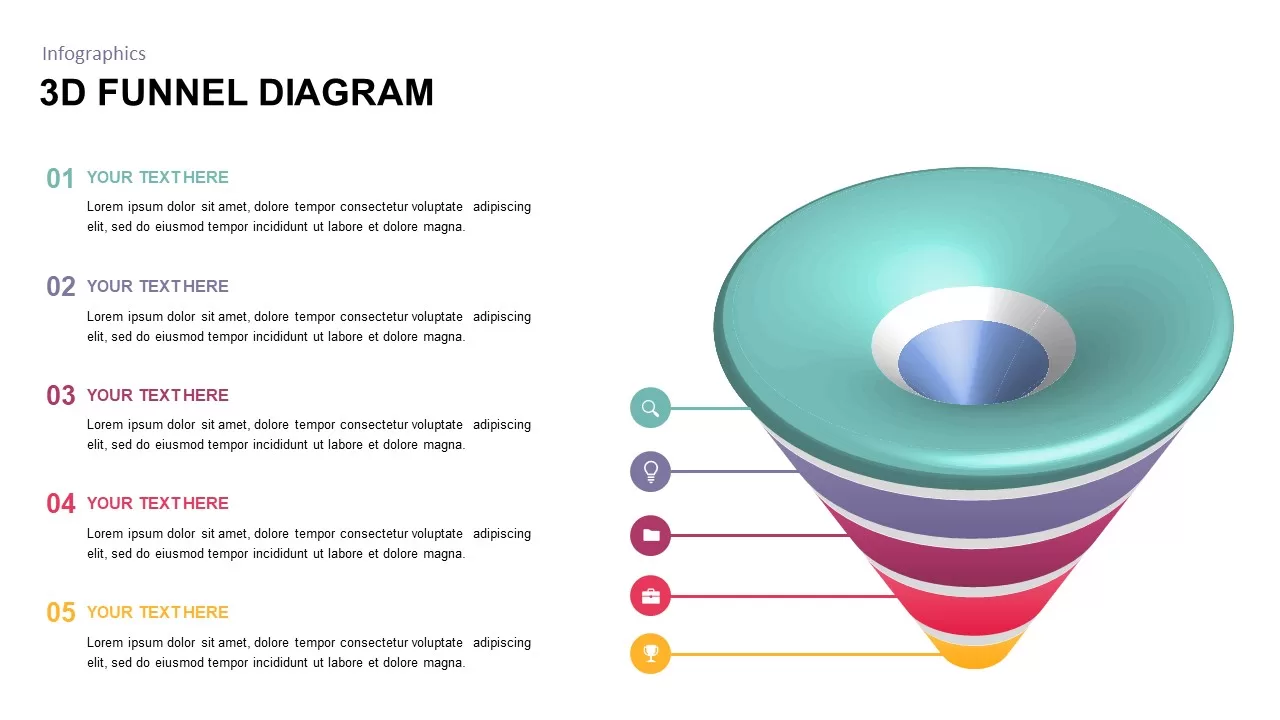
3D Funnel Diagram Infographics for PowerPoint & Google Slides
Funnel
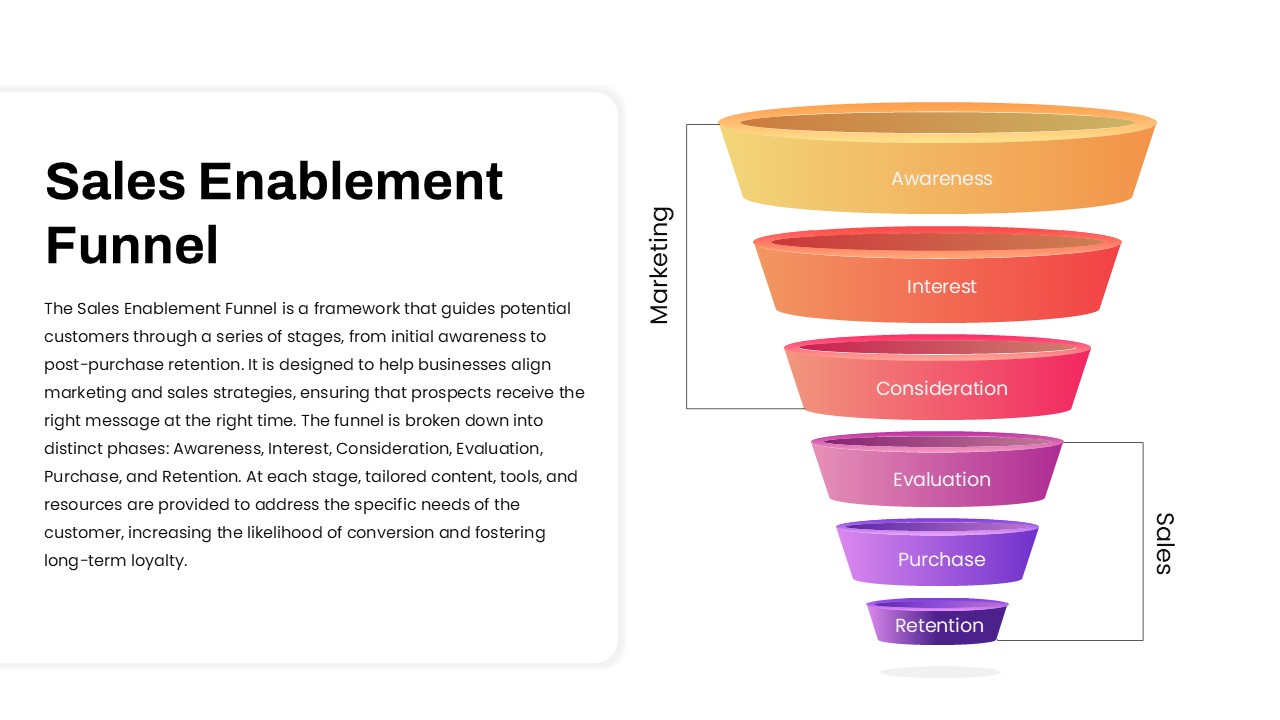
Sales Enablement Funnel diagram for PowerPoint & Google Slides
Funnel

Innovation Ambition Matrix & Funnel Strategy Slides for PowerPoint & Google Slides
Process
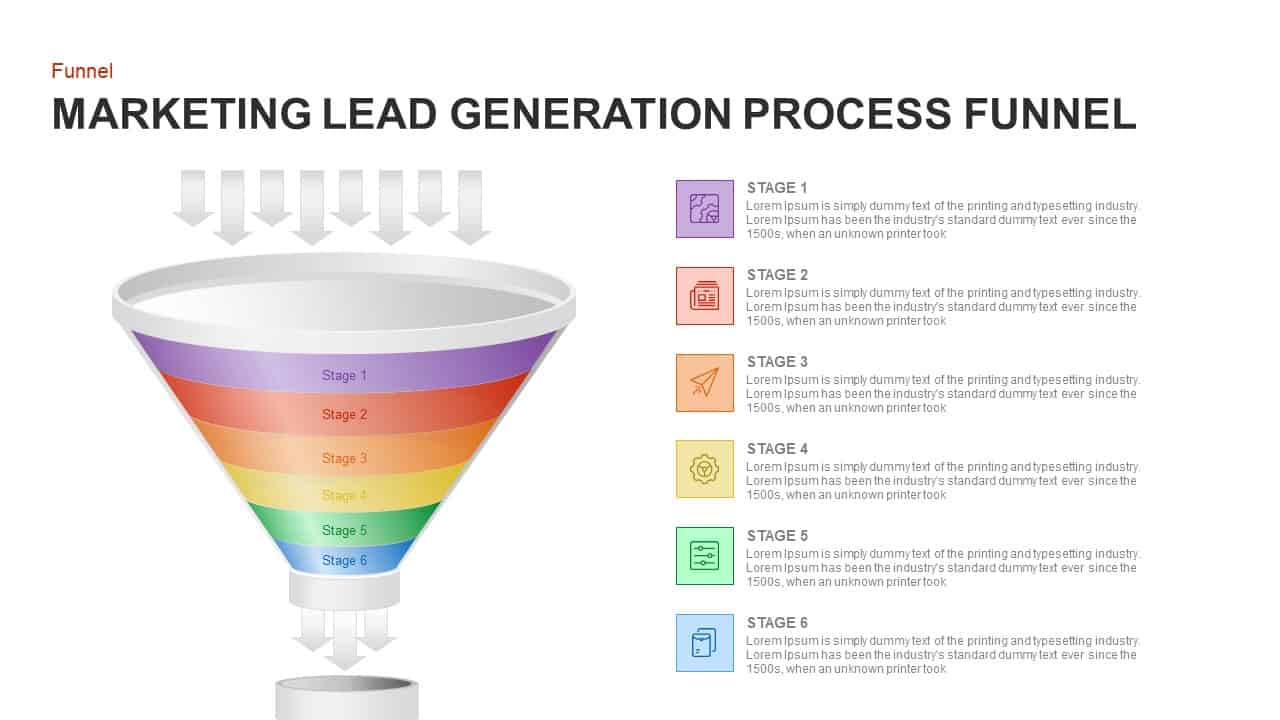
Marketing Lead Generation Process Funnel PowerPoint Template for PowerPoint & Google Slides
Funnel
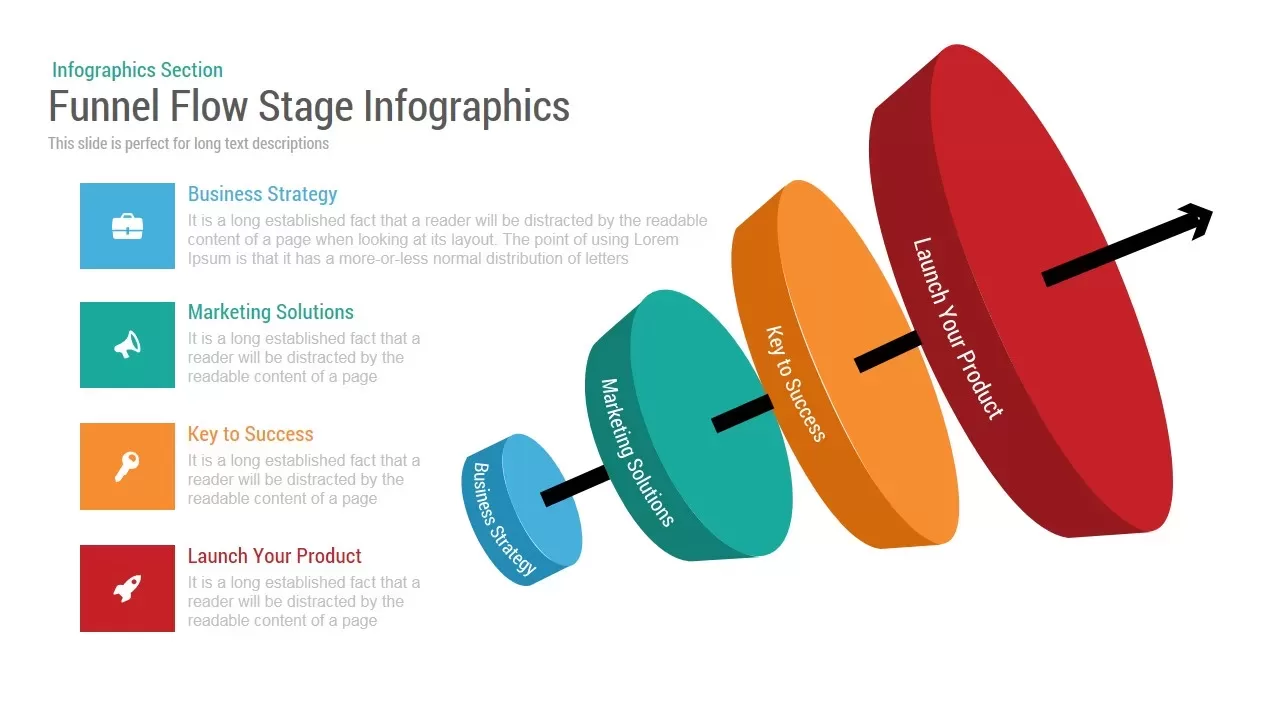
Funnel Flow Stage Infographics template for PowerPoint & Google Slides
Funnel
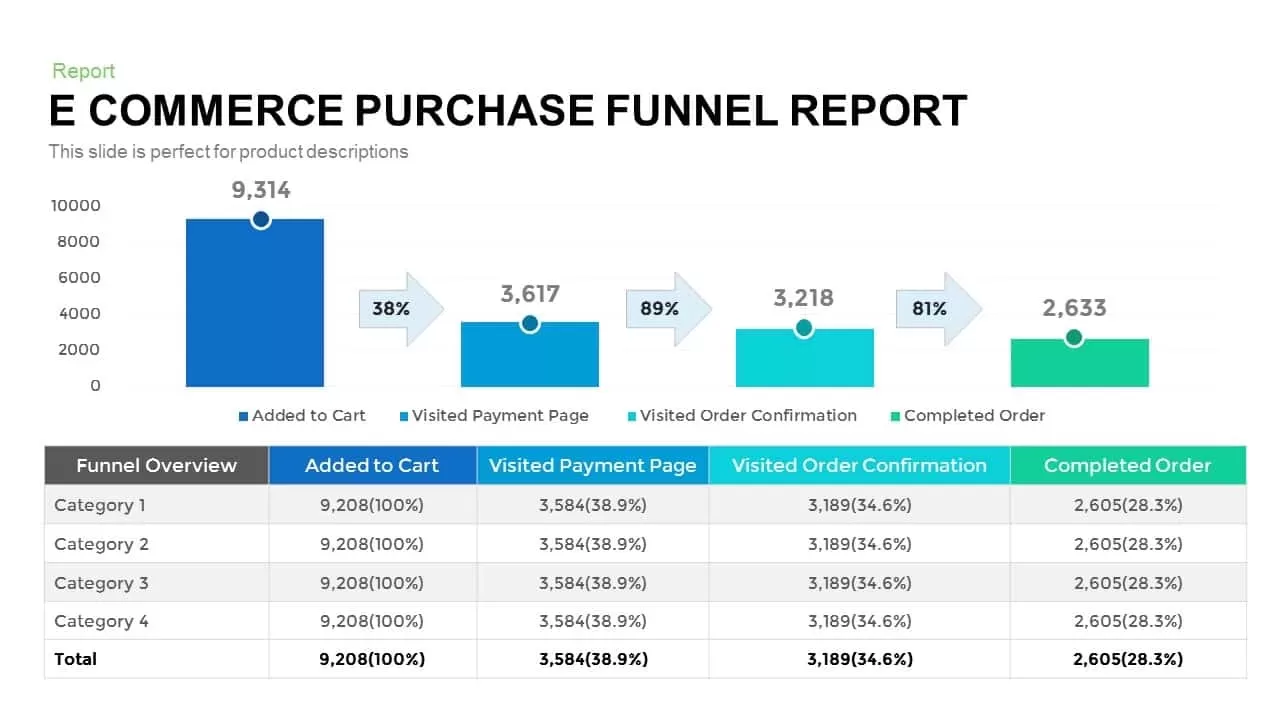
E-commerce Purchase Funnel Report template for PowerPoint & Google Slides
Funnel
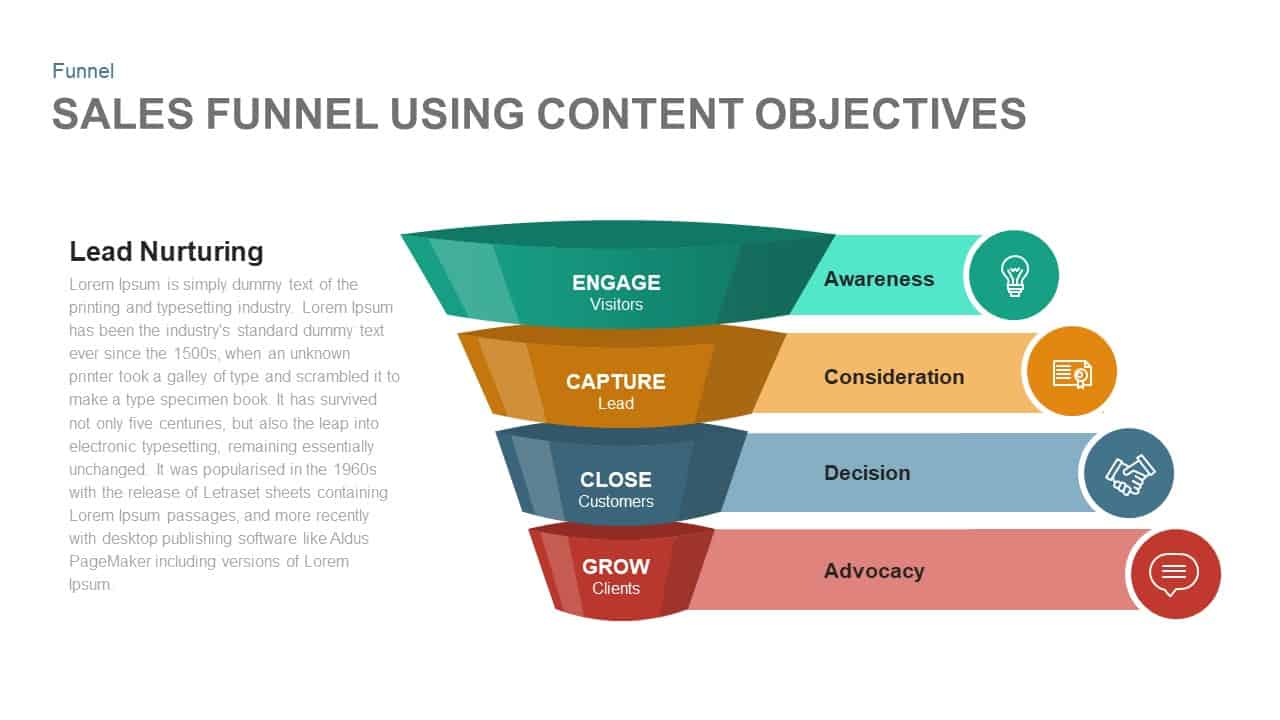
Sales Funnel Using Content Objectives Template for PowerPoint & Google Slides
Funnel
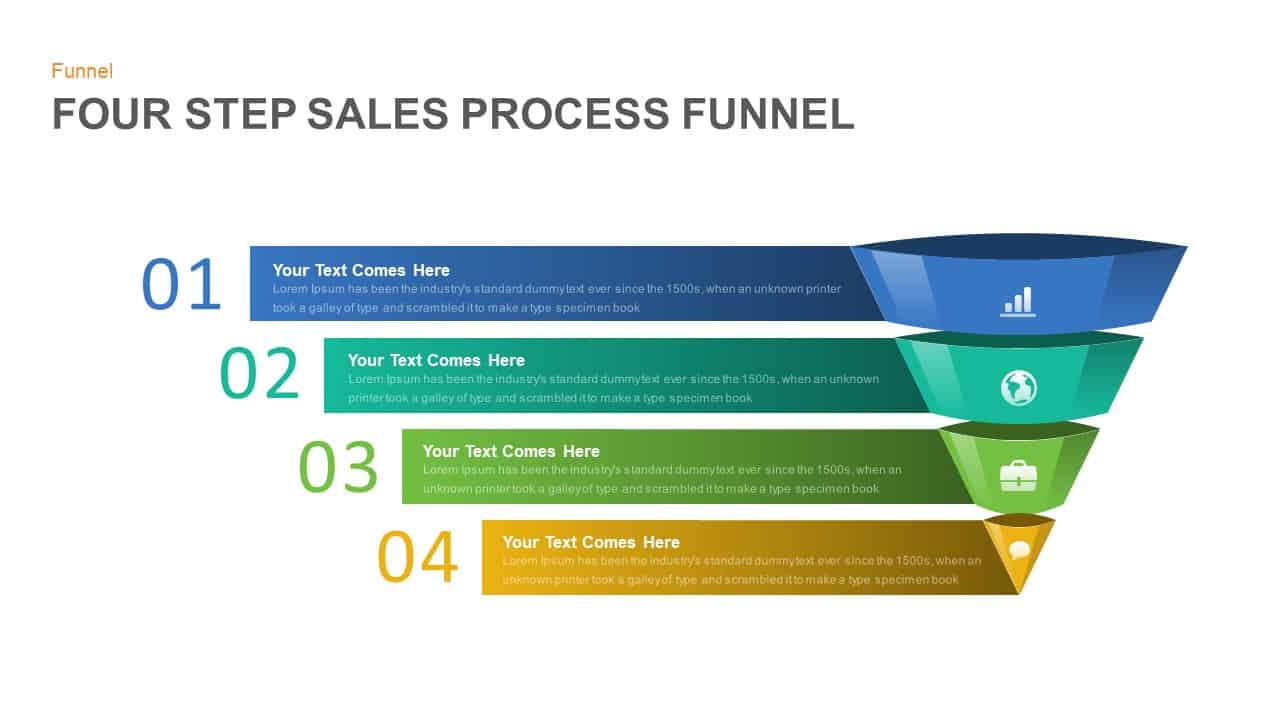
Four Step Sales Process Funnel Template for PowerPoint & Google Slides
Funnel
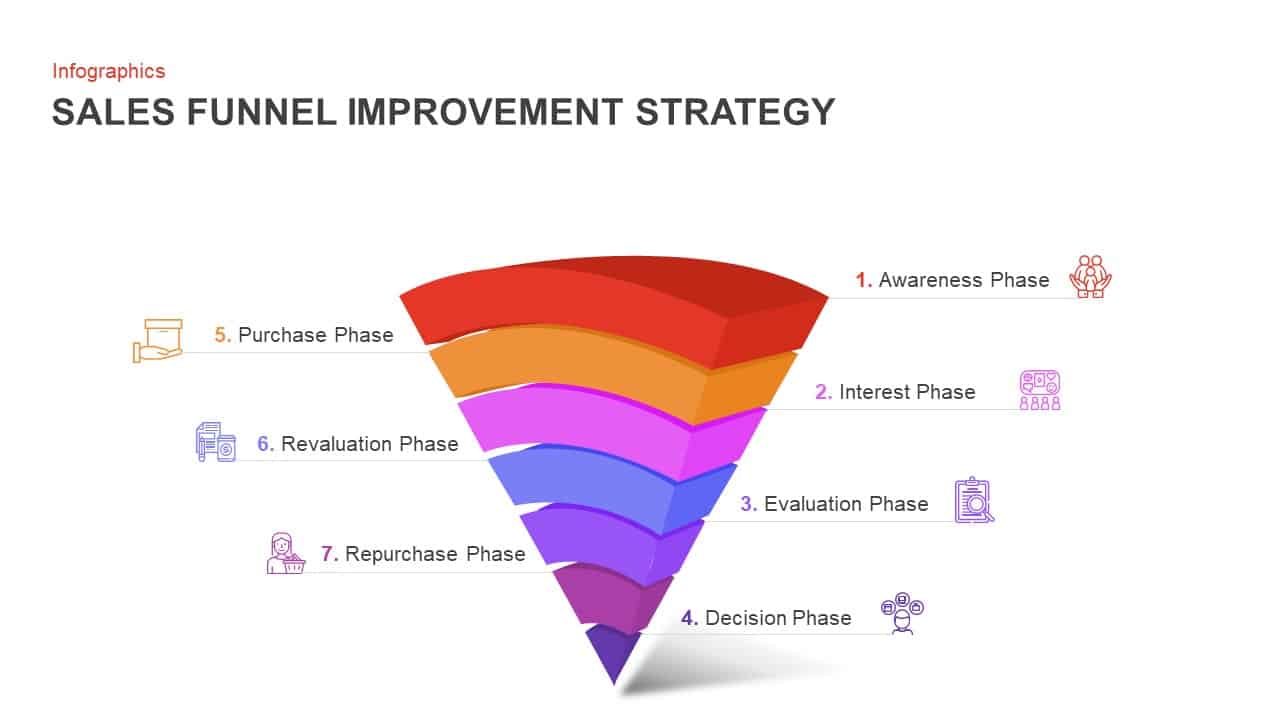
7-Step Sales Funnel Improvement Strategy Template for PowerPoint & Google Slides
Infographics
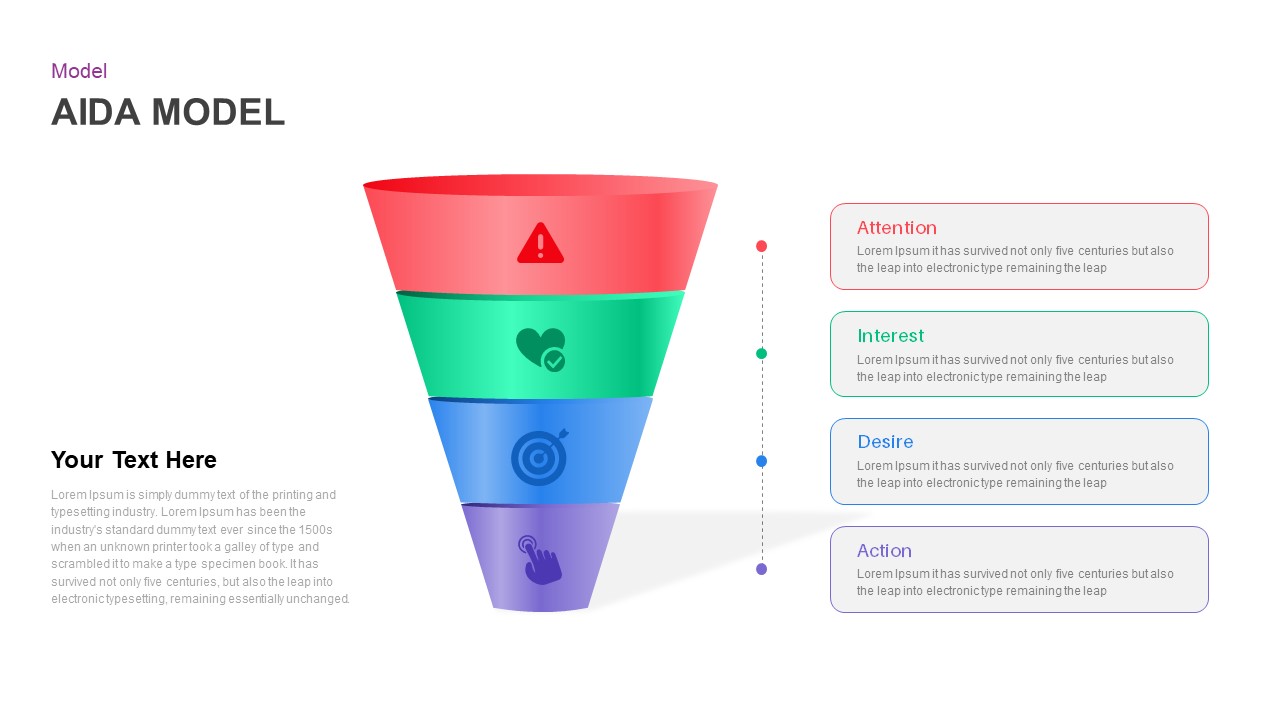
AIDA Marketing Funnel Model Template for PowerPoint & Google Slides
Marketing
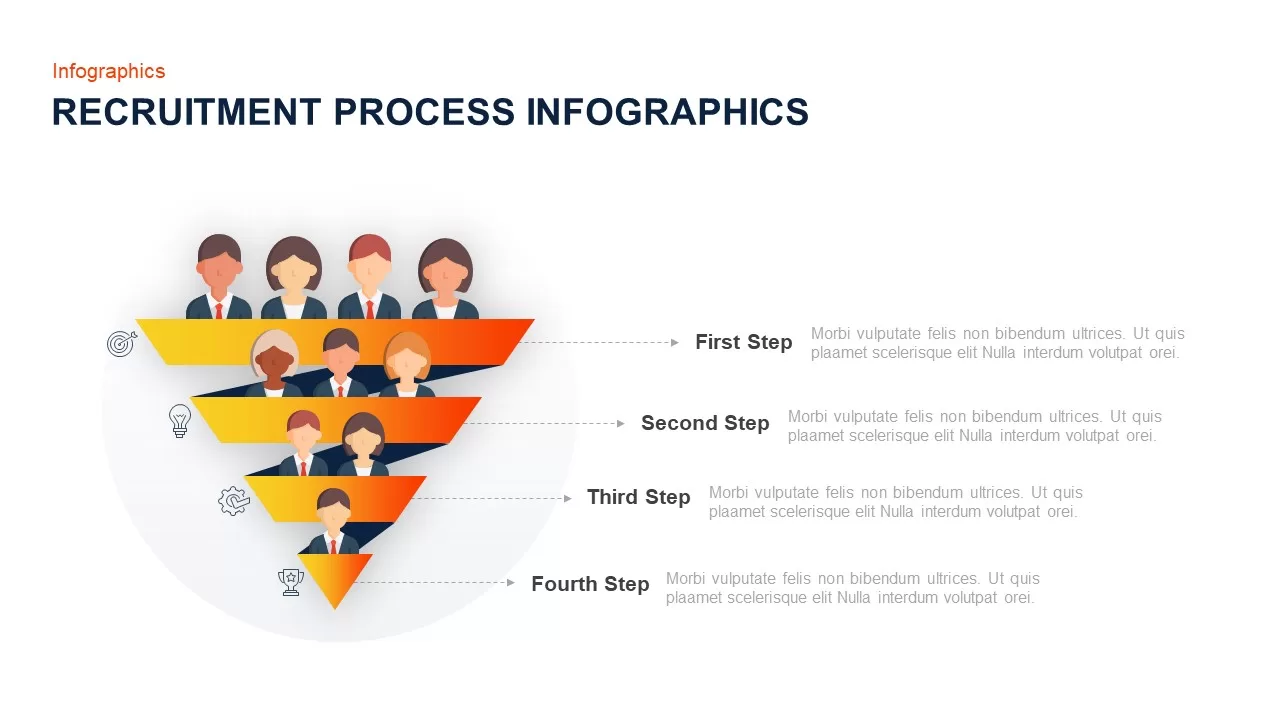
Recruitment Process Funnel Infographics Template for PowerPoint & Google Slides
Recruitment
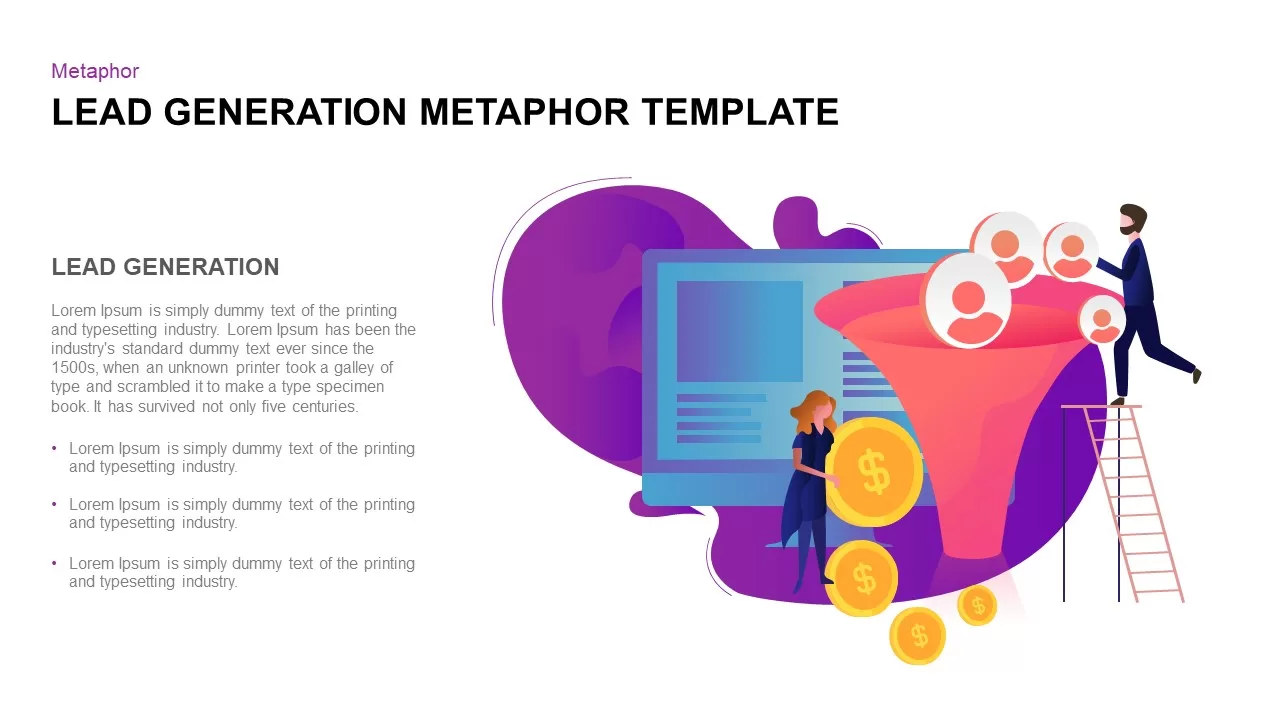
Lead Generation Funnel Metaphor Template for PowerPoint & Google Slides
Marketing Funnel
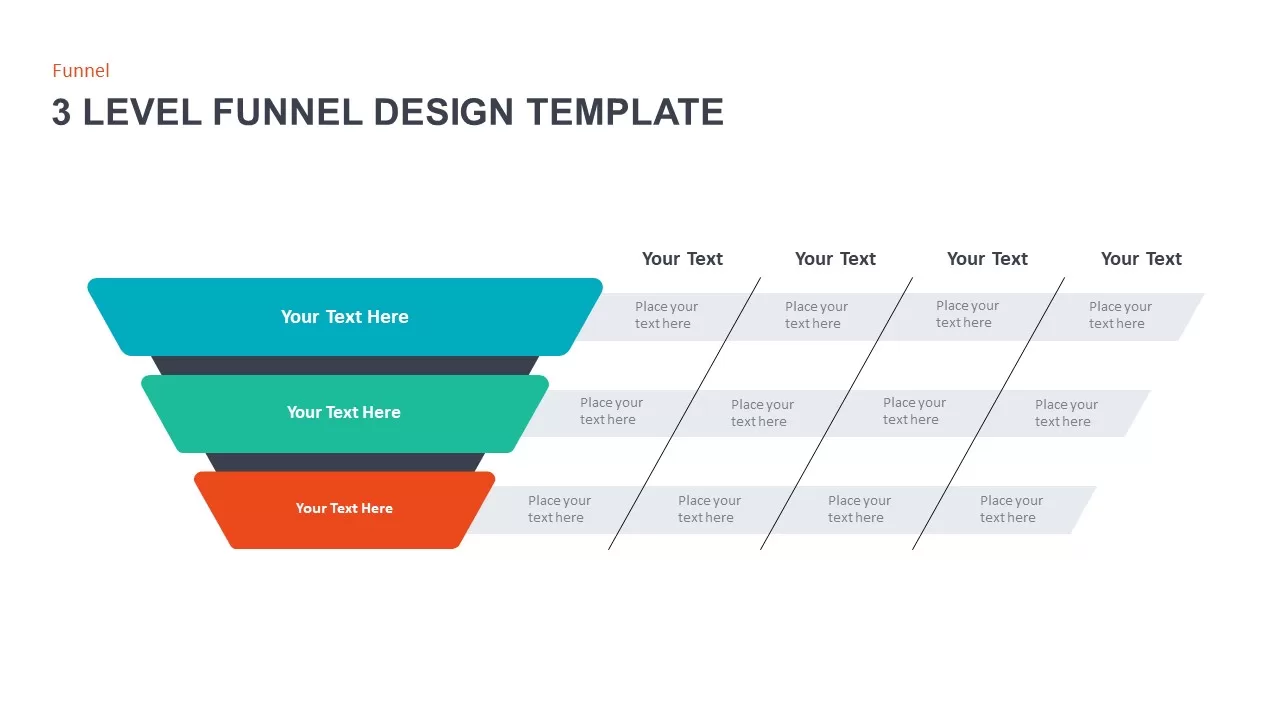
3 Level Funnel Design Visualization Template for PowerPoint & Google Slides
Funnel
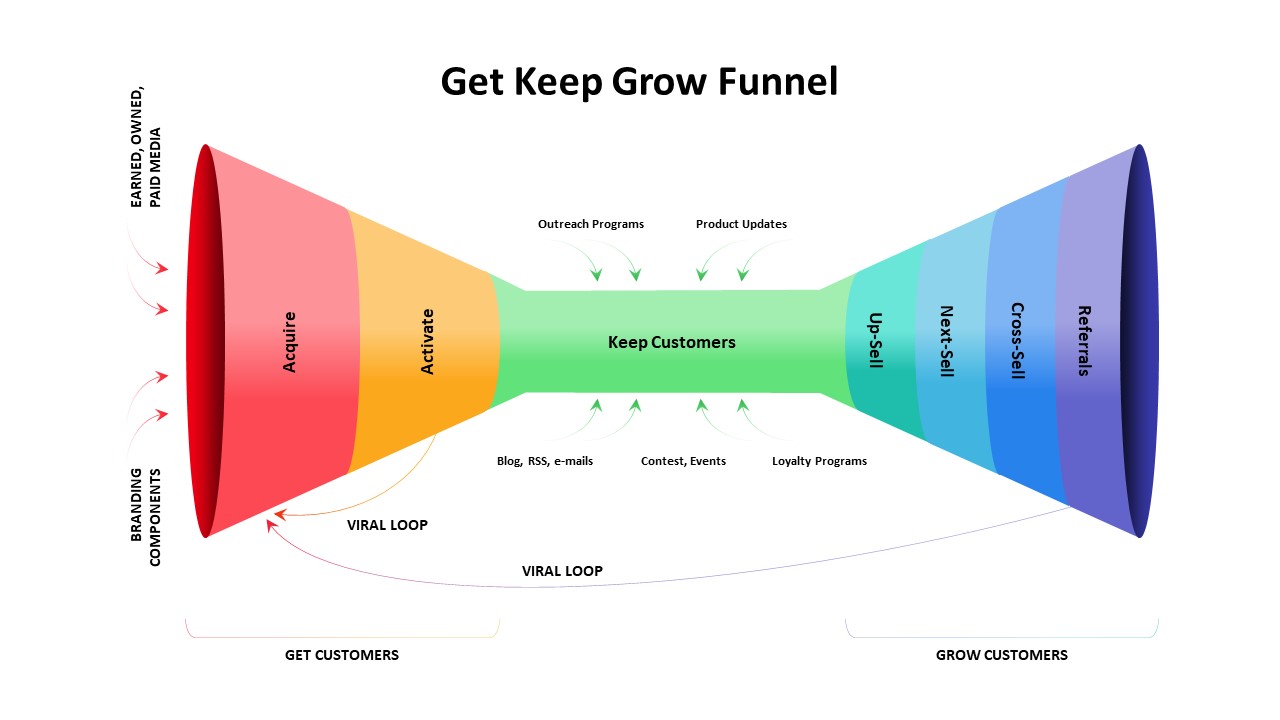
Get Keep Grow Customer Funnel Lifecycle Template for PowerPoint & Google Slides
Funnel
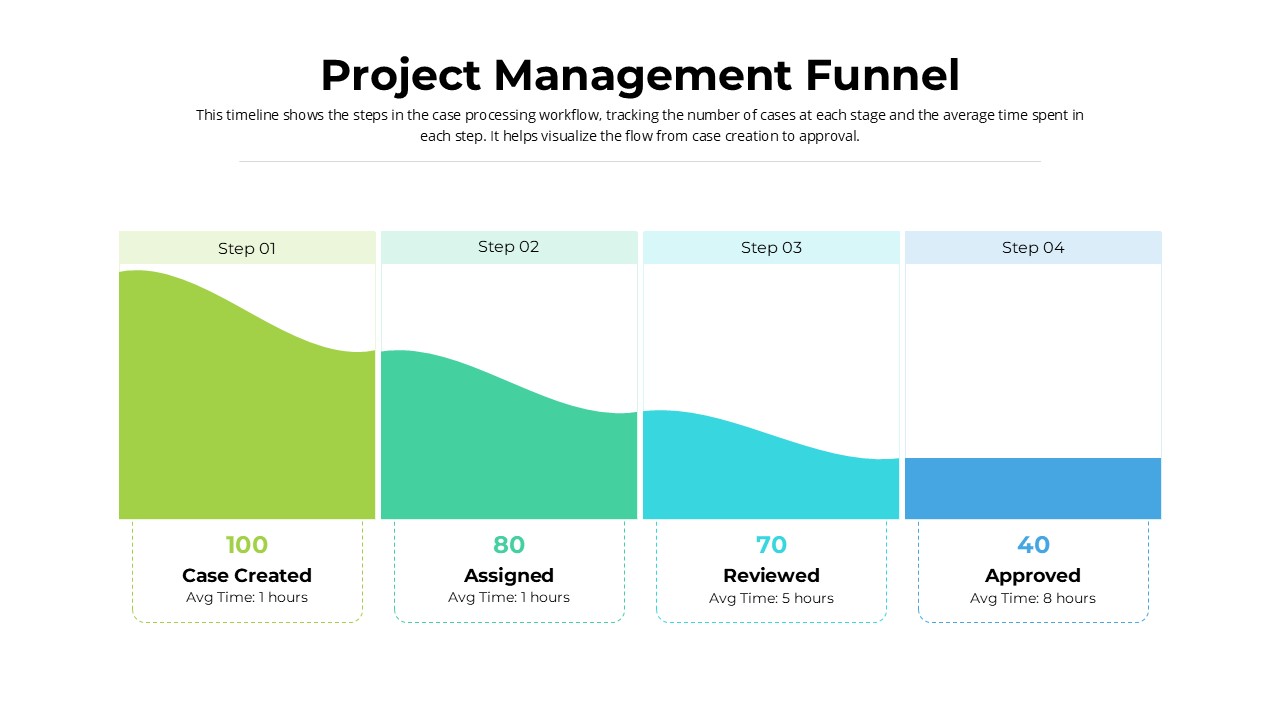
Project Management Funnel template for PowerPoint & Google Slides
Project
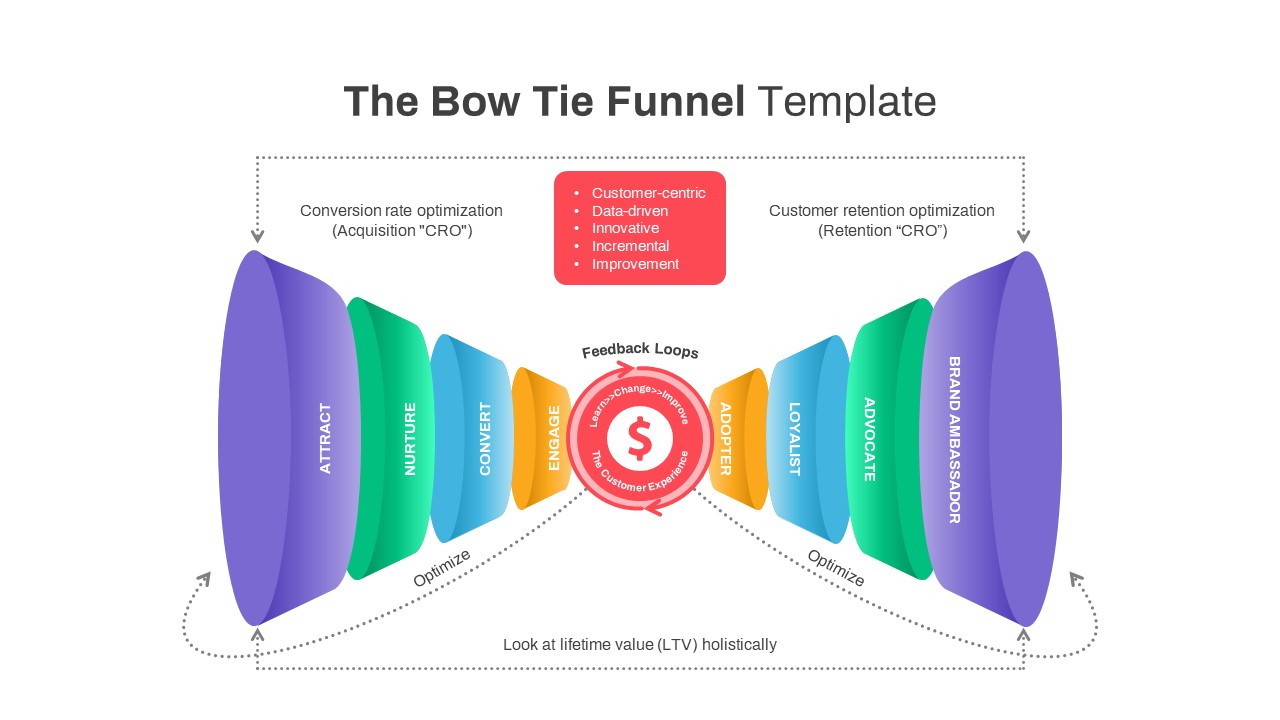
Bow Tie Customer Funnel Presentation Template for PowerPoint & Google Slides
Funnel
Inverted Sales Funnel Marketing Stages Template for PowerPoint & Google Slides
Marketing Funnel
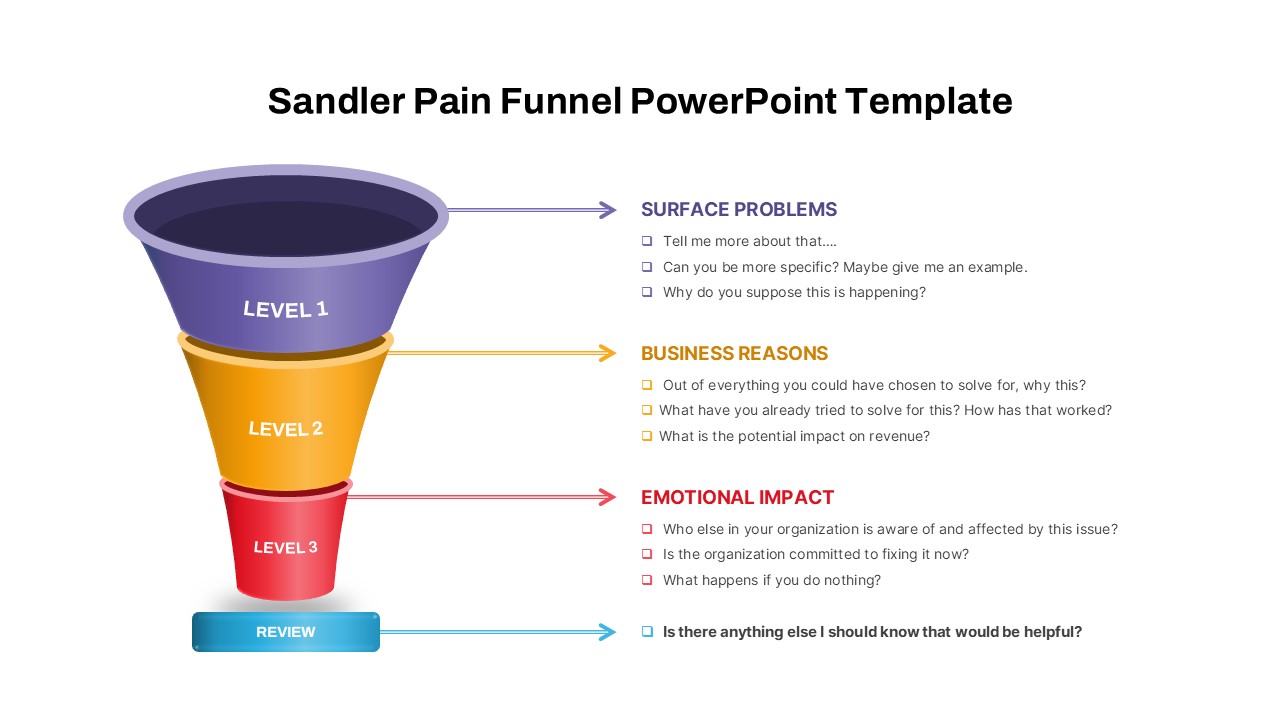
Sandler Pain Funnel Sales Qualification Template for PowerPoint & Google Slides
Funnel
8 Stage Funnel Process template for PowerPoint & Google Slides
Funnel
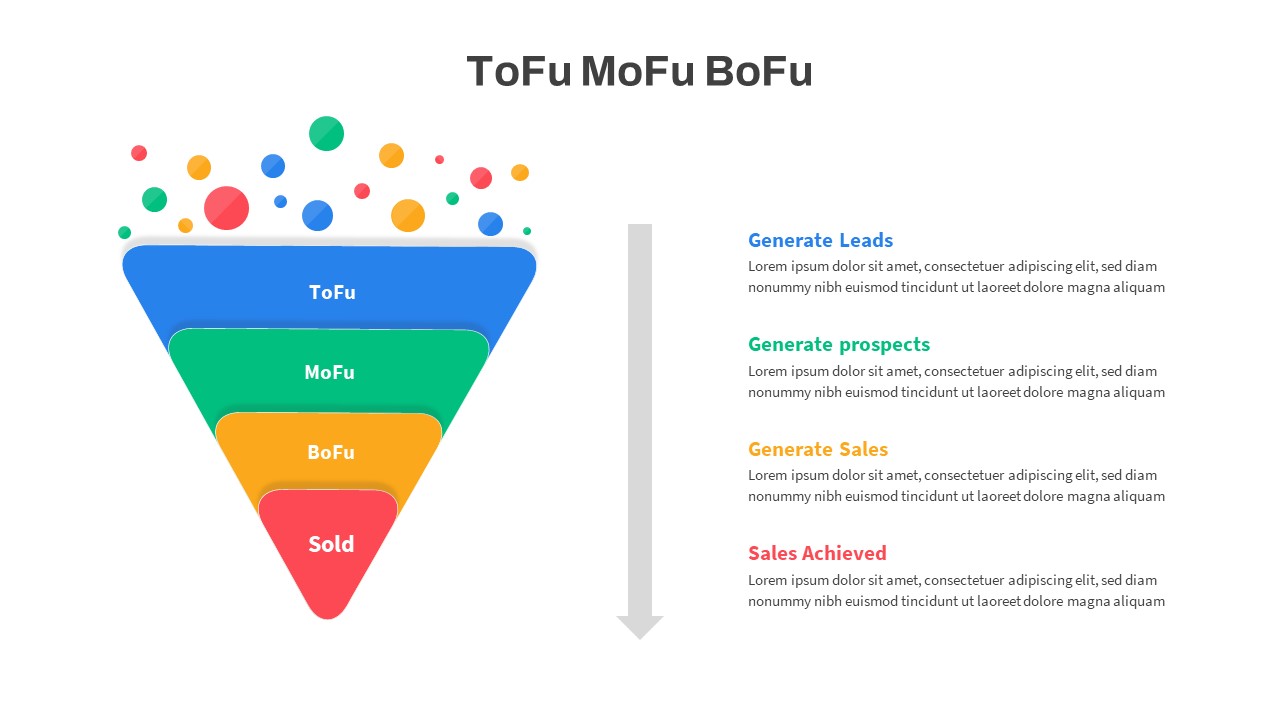
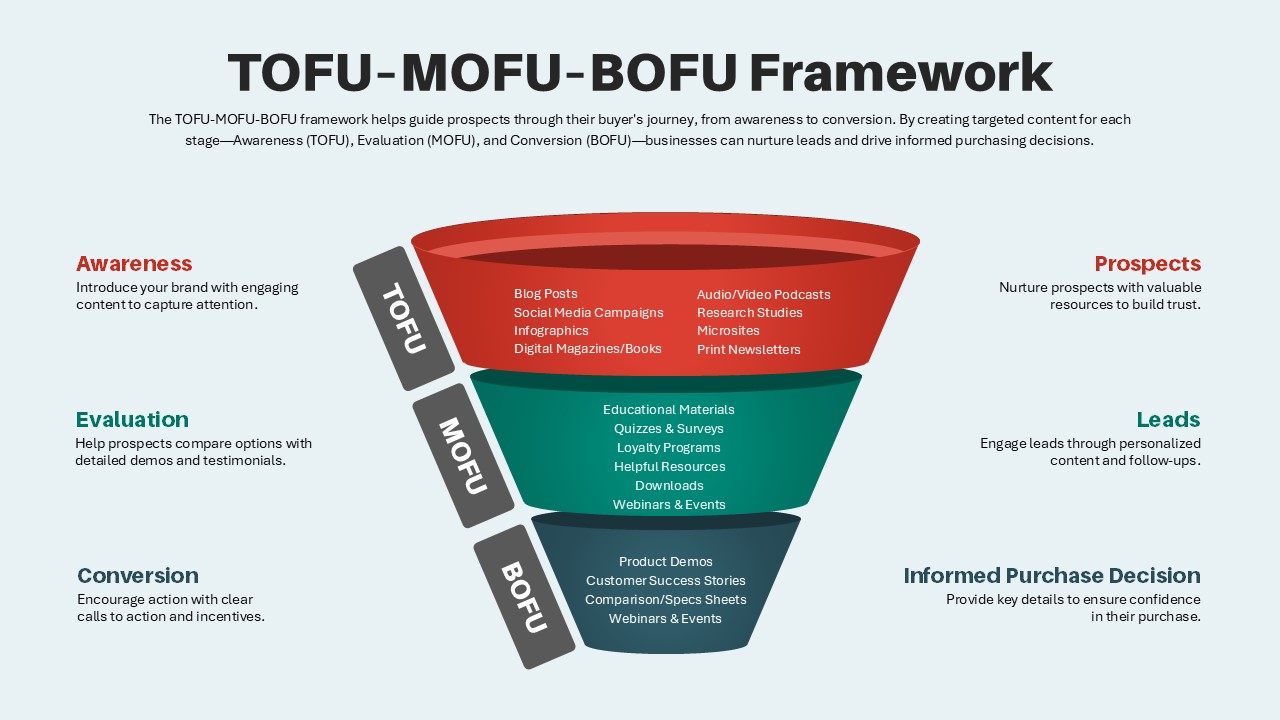
TOFU-MOFU-BOFU Marketing Funnel Template for PowerPoint & Google Slides
Funnel
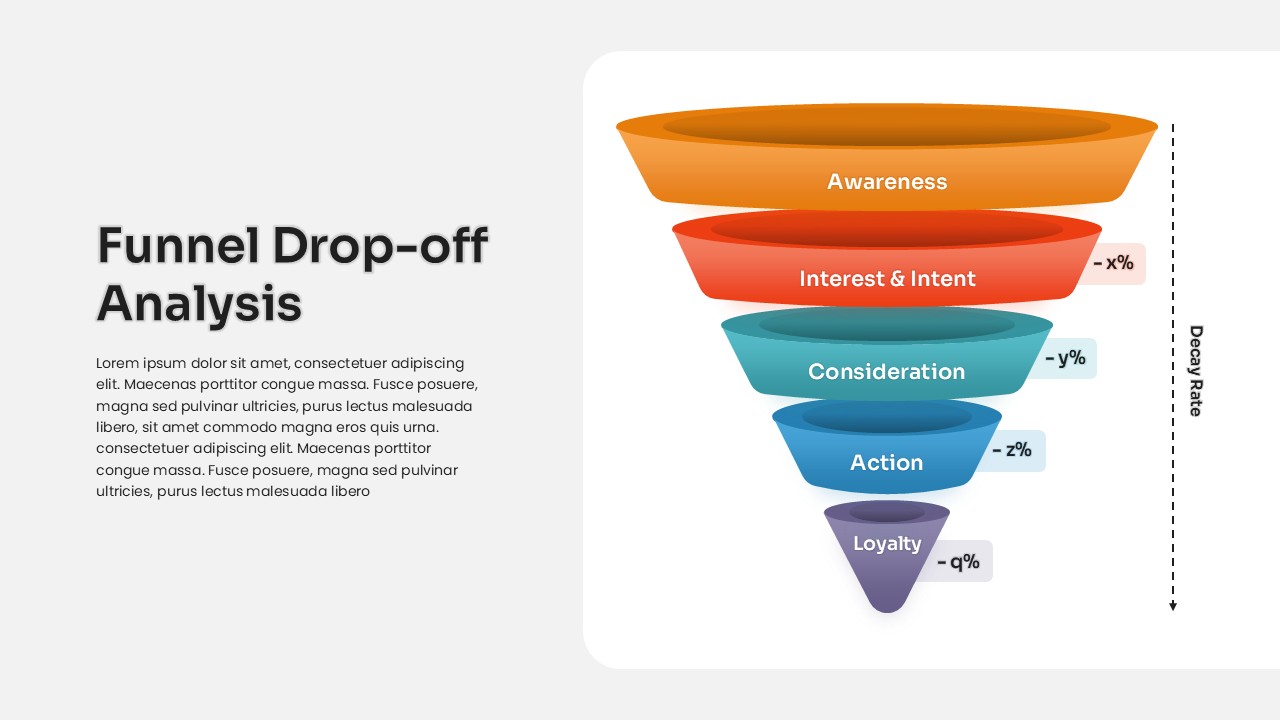
Funnel Drop-off Analysis template for PowerPoint & Google Slides
Business
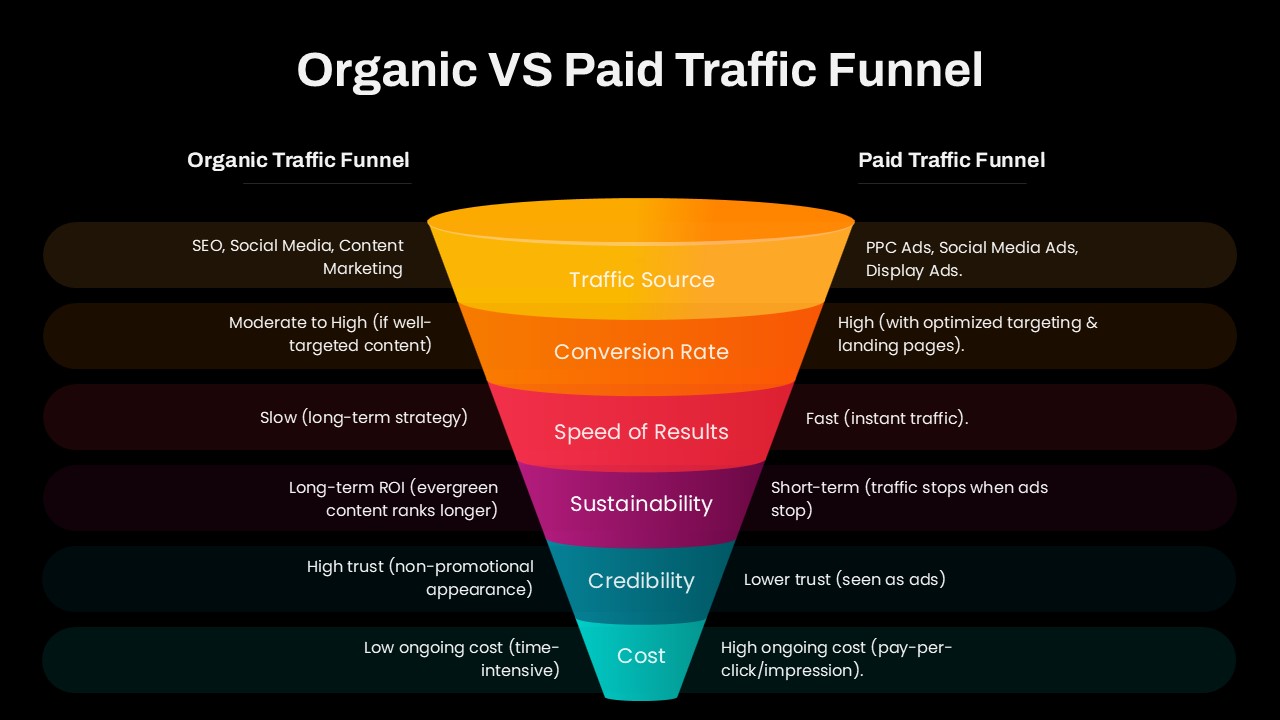
Organic vs Paid Traffic Funnel Template for PowerPoint & Google Slides
Marketing Funnel

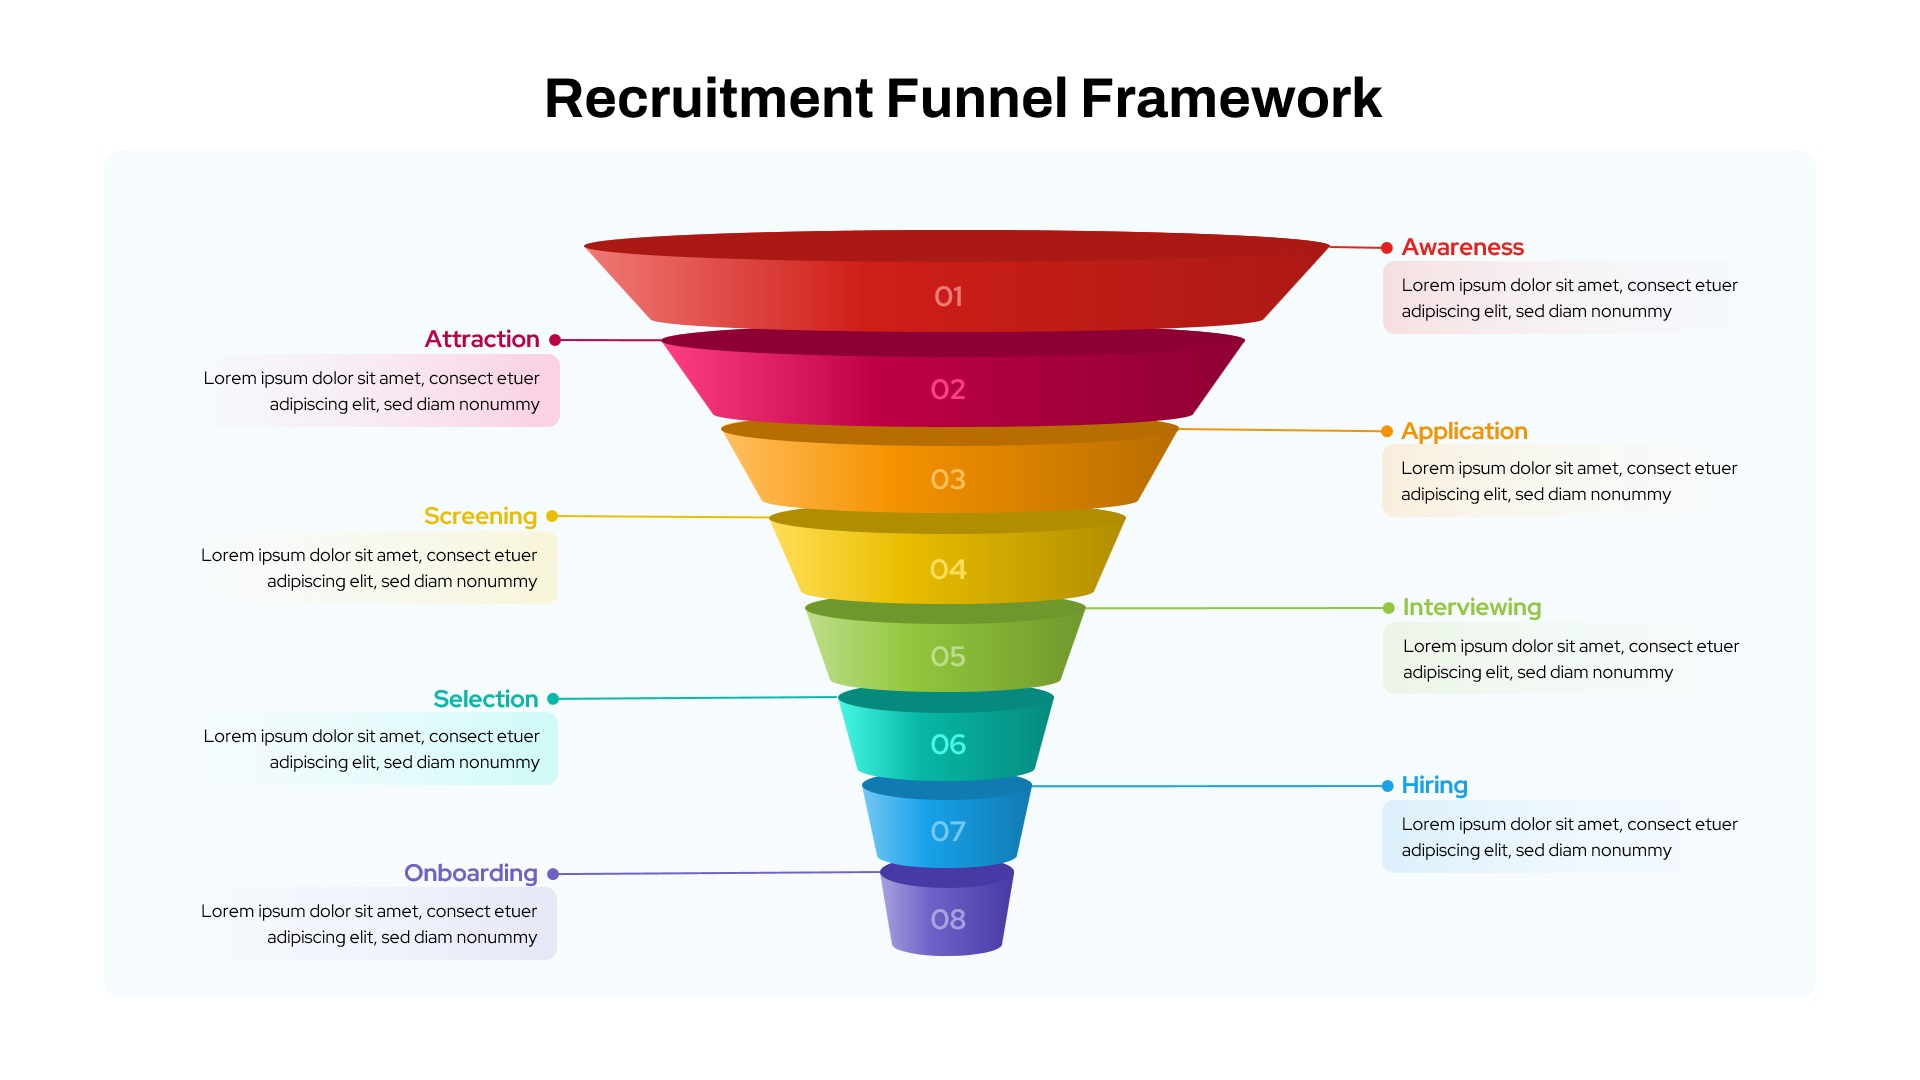
Recruitment Funnel Framework template for PowerPoint & Google Slides
Recruitment
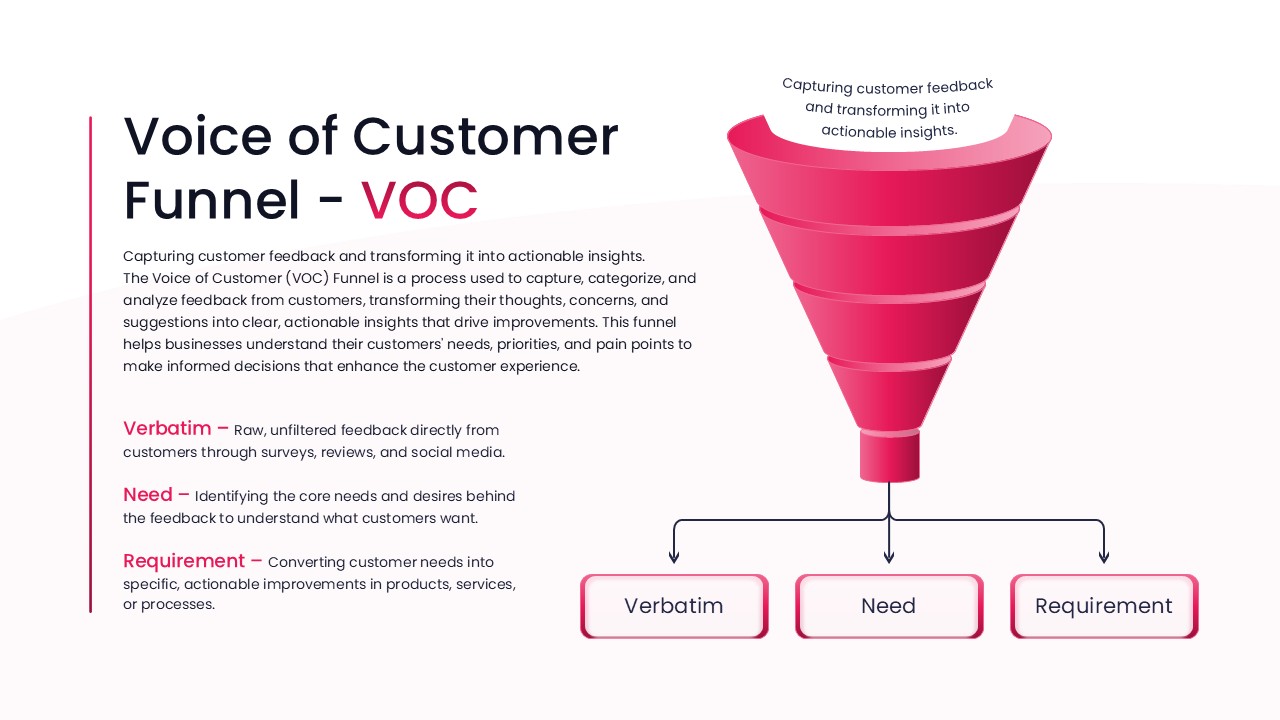
Voice of Customer Funnel (VOC) template for PowerPoint & Google Slides
Marketing
Pirate Metrics AARRR Funnel Framework Template for PowerPoint & Google Slides
Funnel
Funnel and Flywheel Thinking Comparison template for PowerPoint & Google Slides
Infographics
Project Management Funnel Template for PowerPoint & Google Slides
Funnel
Hiring Funnel Timeline with Six Phases Template for PowerPoint & Google Slides
Recruitment
Four-Stage Marketing Funnel Template for PowerPoint & Google Slides
Marketing Funnel
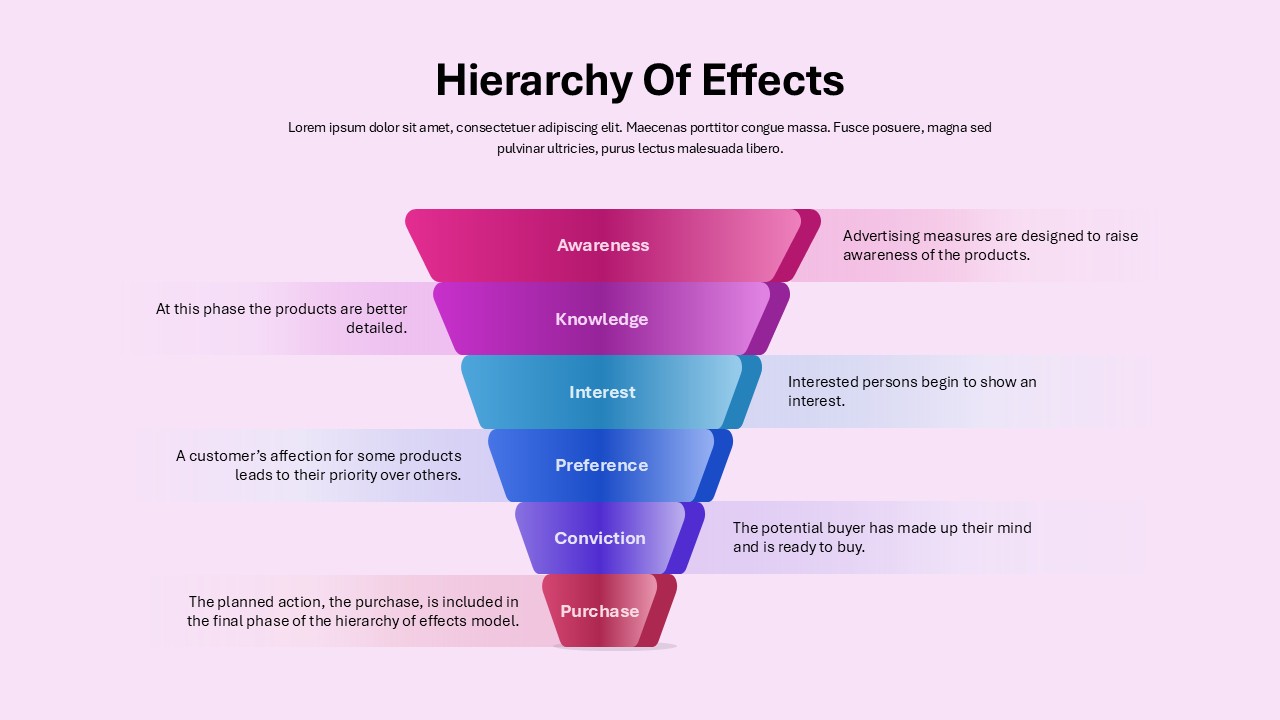
Marketing Funnel Hierarchy of Effects Template for PowerPoint & Google Slides
Marketing Funnel
5-Step Marketing Funnel Template for PowerPoint & Google Slides
Marketing Funnel
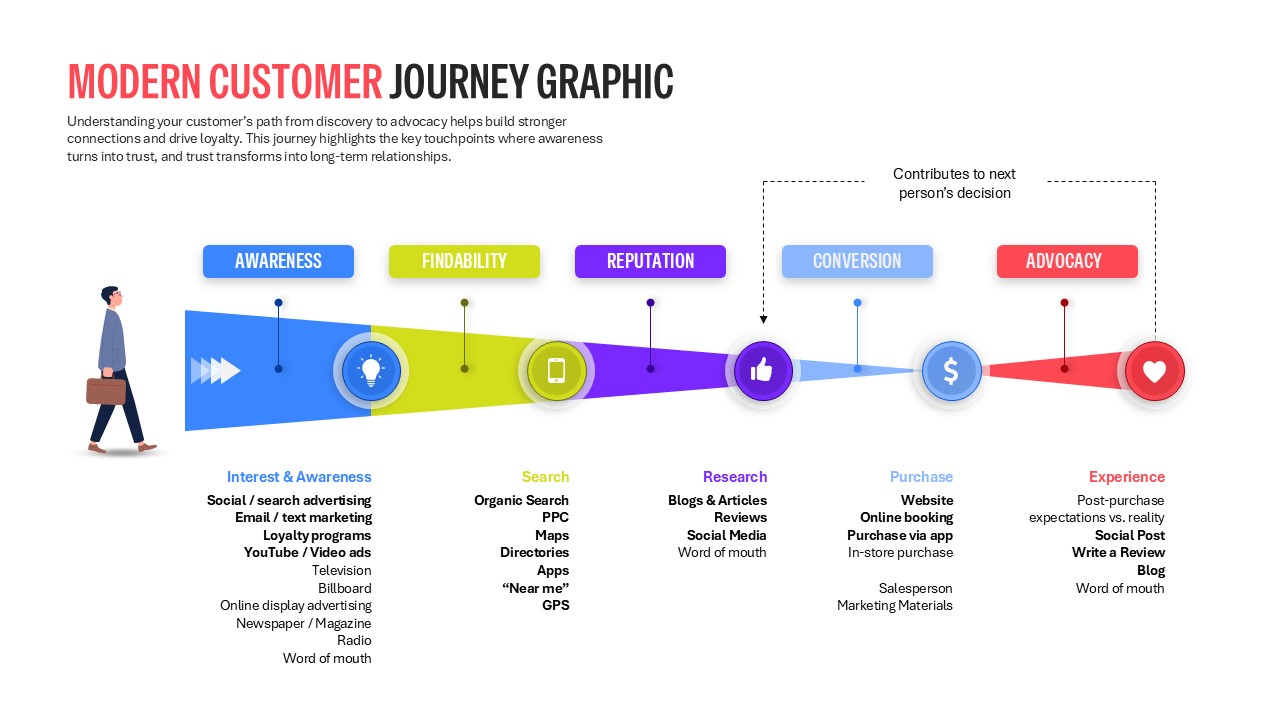
Modern Customer Journey Graphic Funnel Template for PowerPoint & Google Slides
Customer Journey
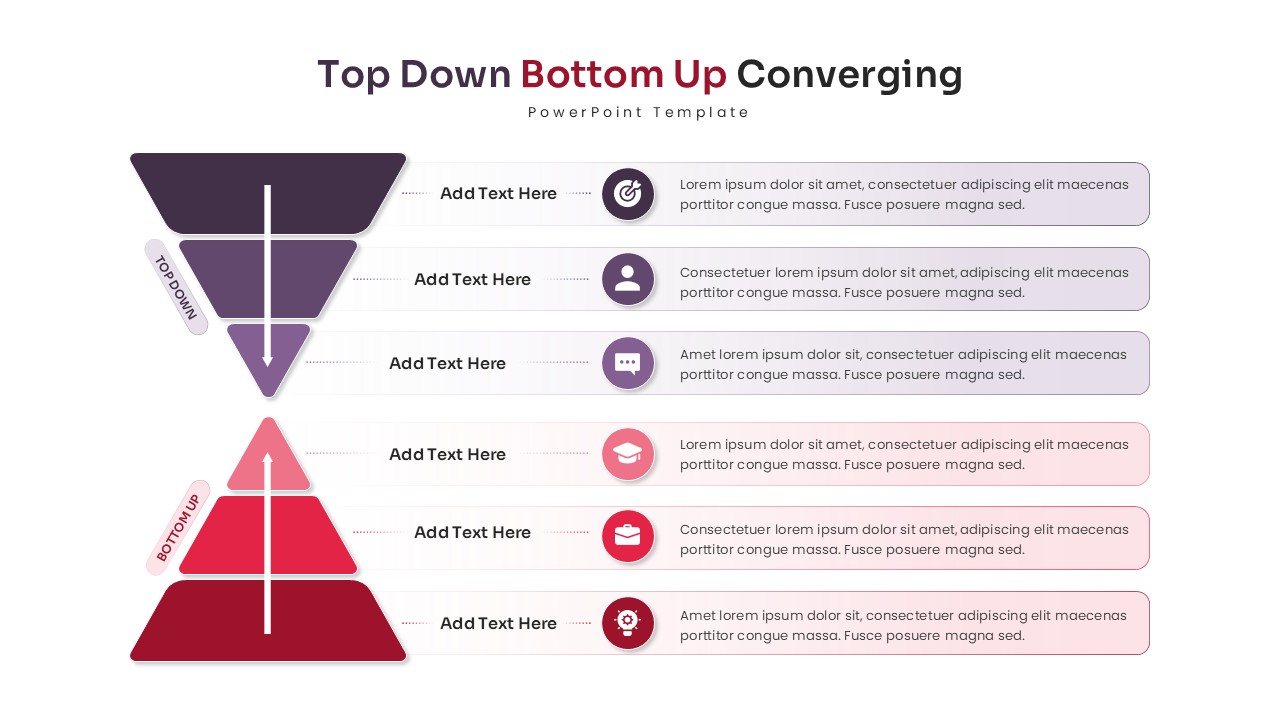
Top Down Bottom Up Converging Funnel for PowerPoint & Google Slides
Funnel
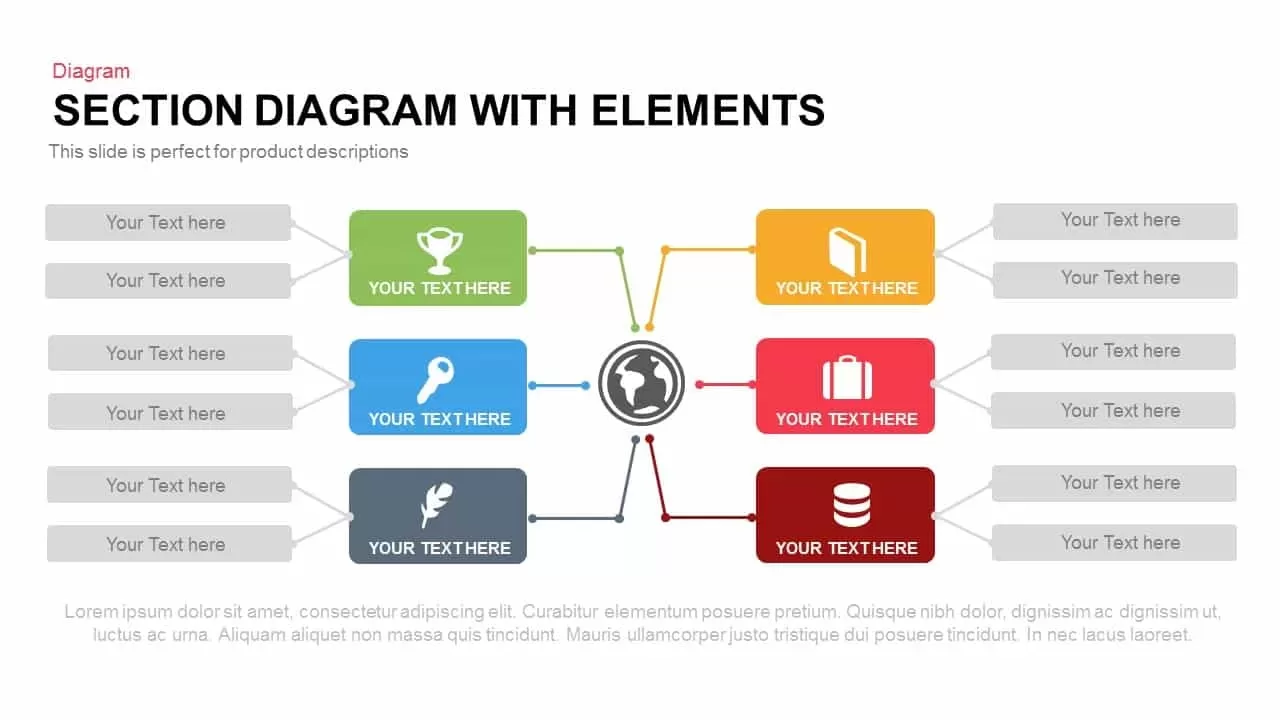
Section Diagram Elements Infographic Template for PowerPoint & Google Slides
Process
Eight Segment Star Diagram Infographic Template for PowerPoint & Google Slides
Process
Five Stage Process Diagram Infographic Template for PowerPoint & Google Slides
Process
Segmented Pyramid Diagram Infographic Template for PowerPoint & Google Slides
Pyramid
Creative Tree Infographic Diagram Template for PowerPoint & Google Slides
Infographics
4 Factors Circular Diagram Infographic Template for PowerPoint & Google Slides
Circular
Circular CRM Process Diagram Infographic Template for PowerPoint & Google Slides
Circular
3D Block Arrow Infographic Diagram Template for PowerPoint & Google Slides
Arrow
Four-Step Puzzle Diagram Infographic Template for PowerPoint & Google Slides
Process
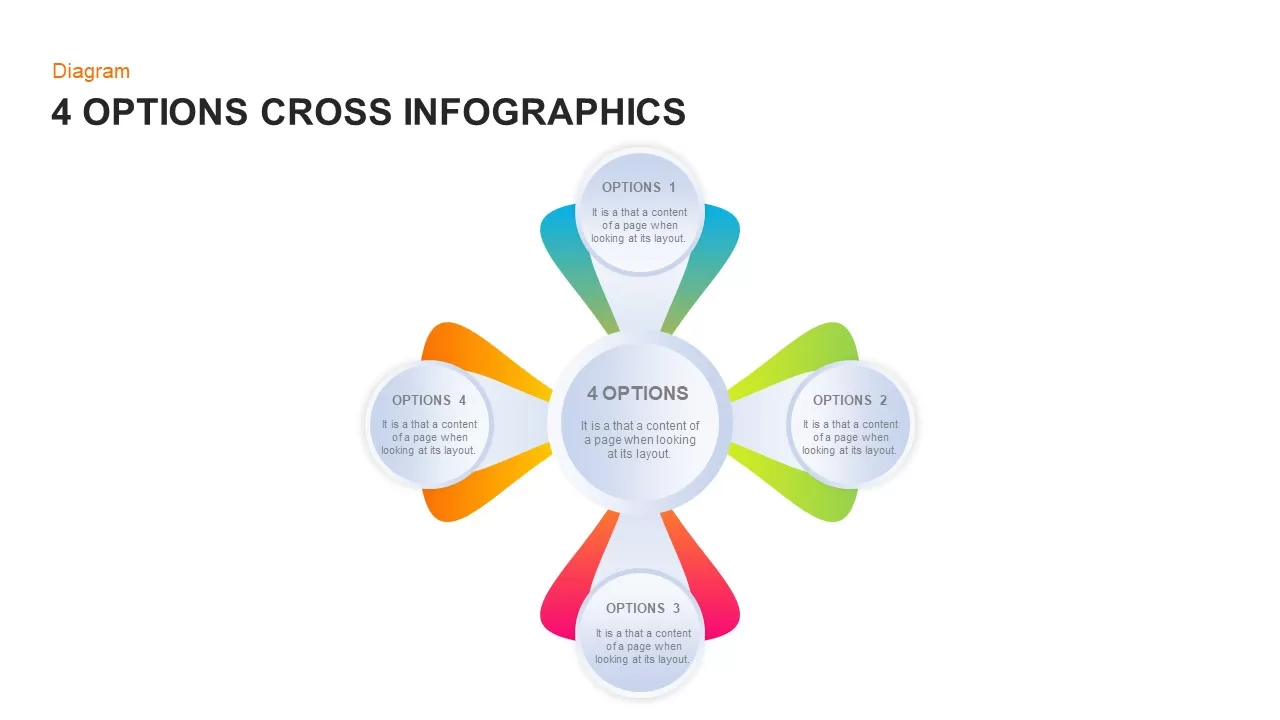
Four-Option Cross Infographic Diagram Template for PowerPoint & Google Slides
Comparison
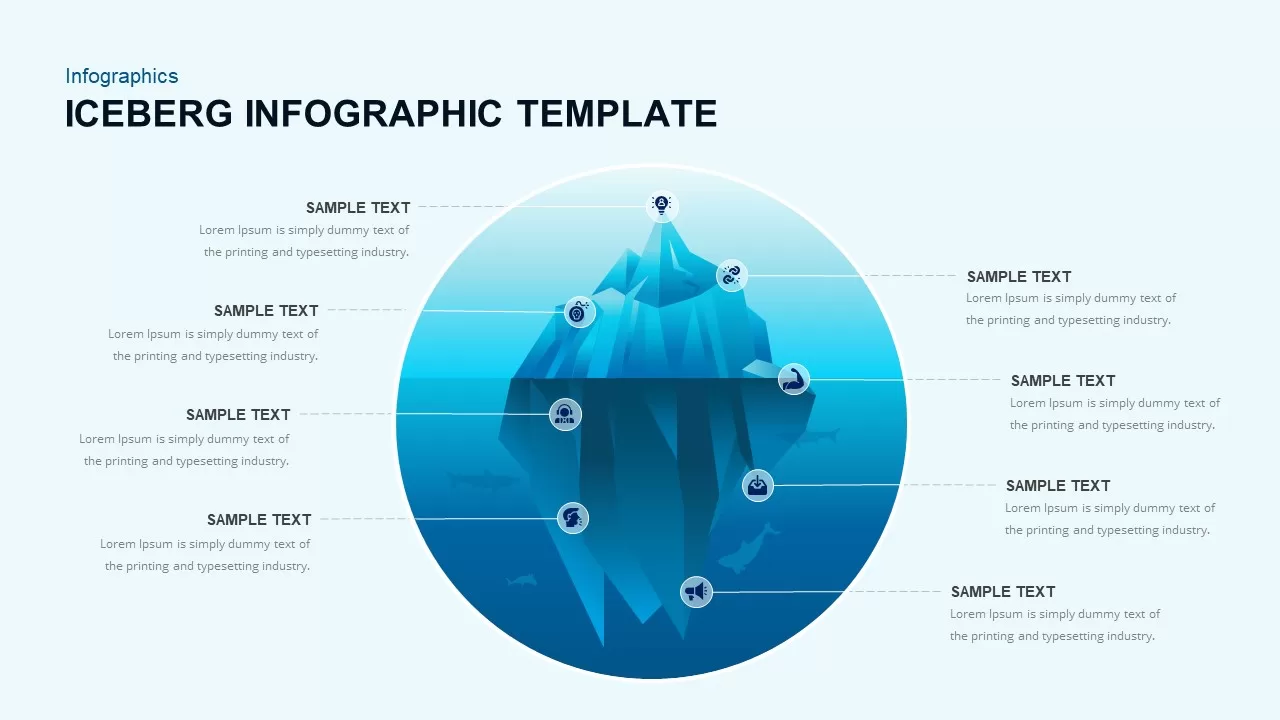
Iceberg Infographic Diagram template for PowerPoint & Google Slides
Opportunities Challenges
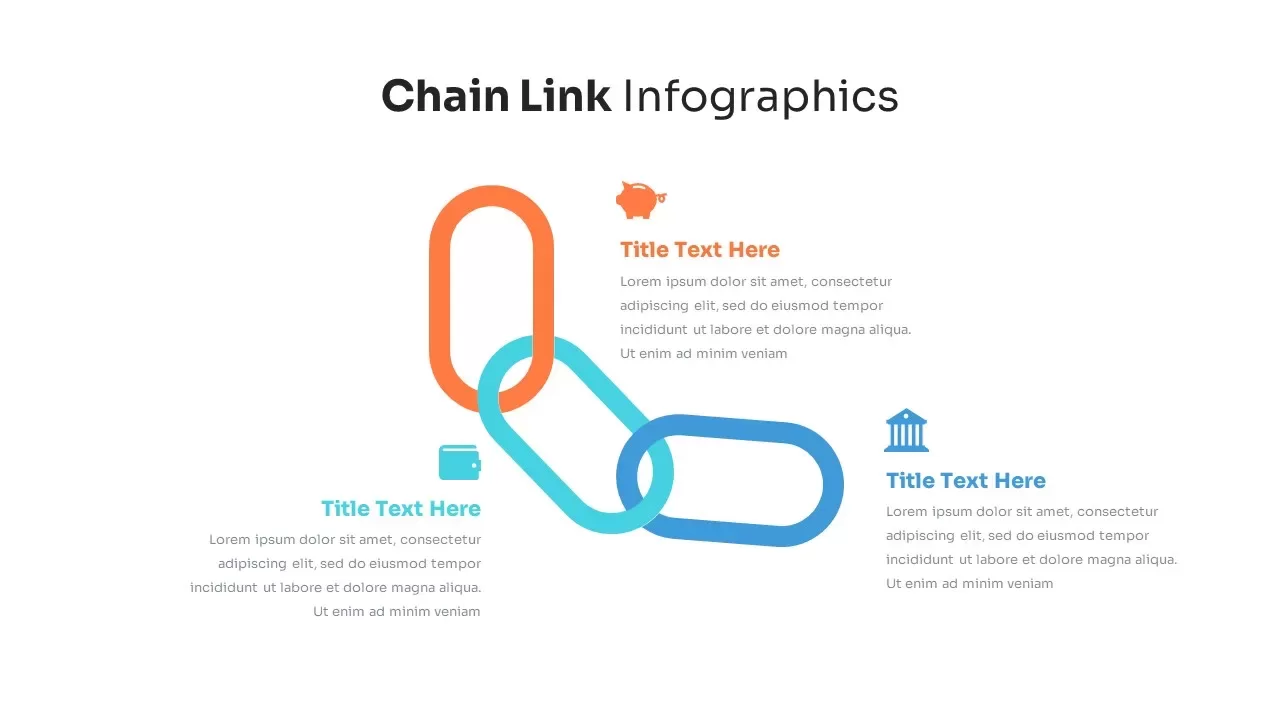
Chain Link Process Infographic Diagram Template for PowerPoint & Google Slides
Process
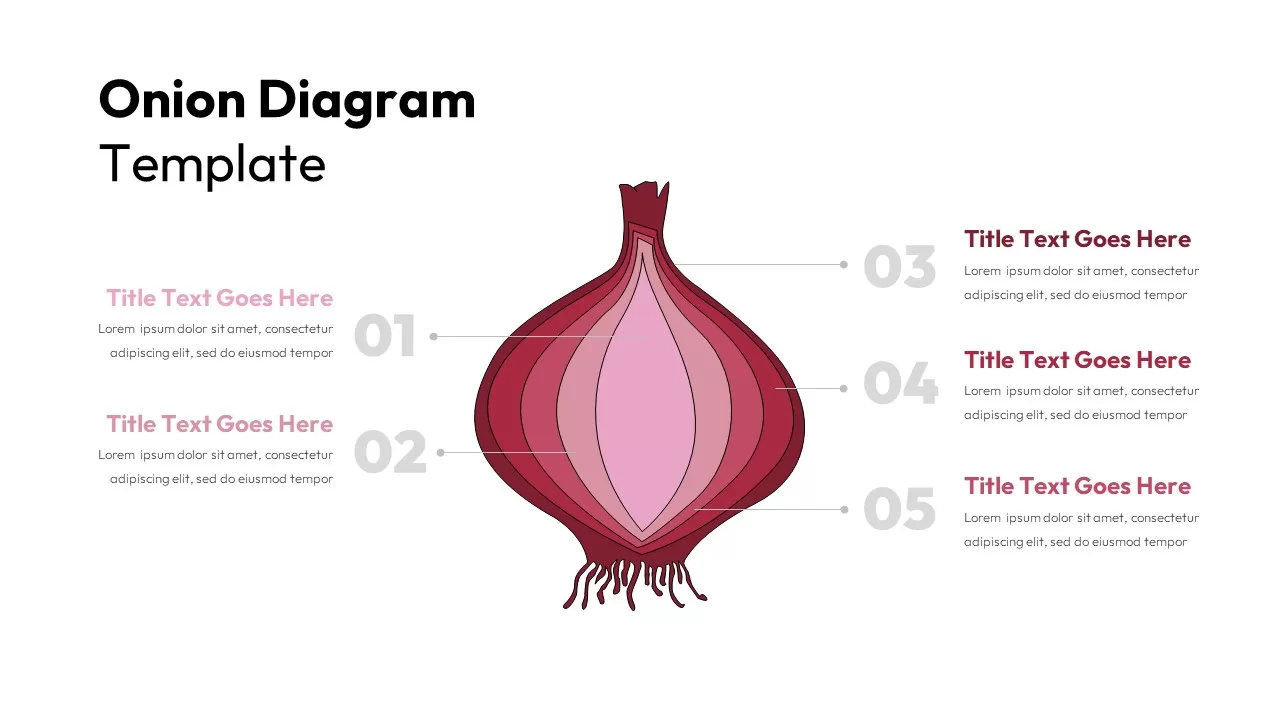
Five-Layer Onion Diagram Infographic Template for PowerPoint & Google Slides
Process
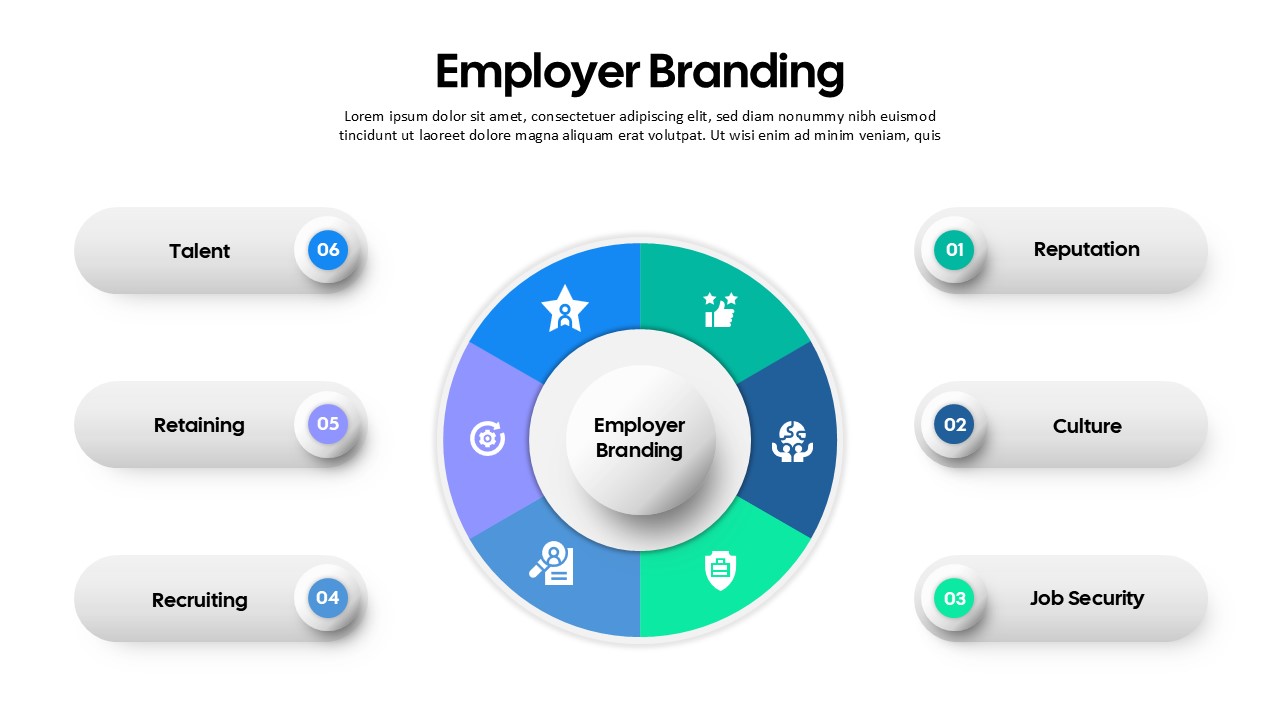
Employer Branding Infographic Diagram Template for PowerPoint & Google Slides
Recruitment