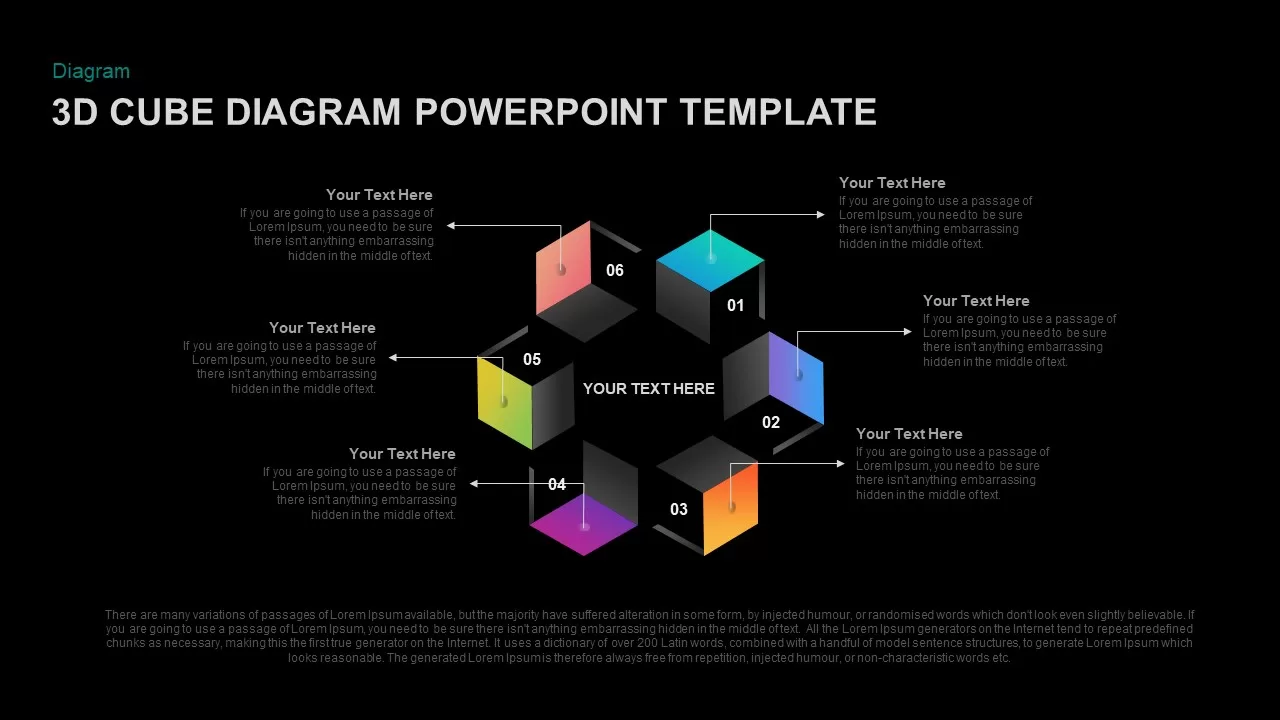
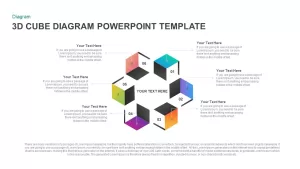
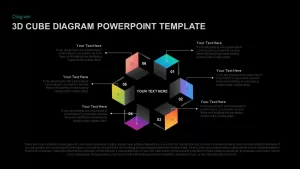
Circular 3D Cube Six-Segment Diagram Template for PowerPoint & Google Slides

Description
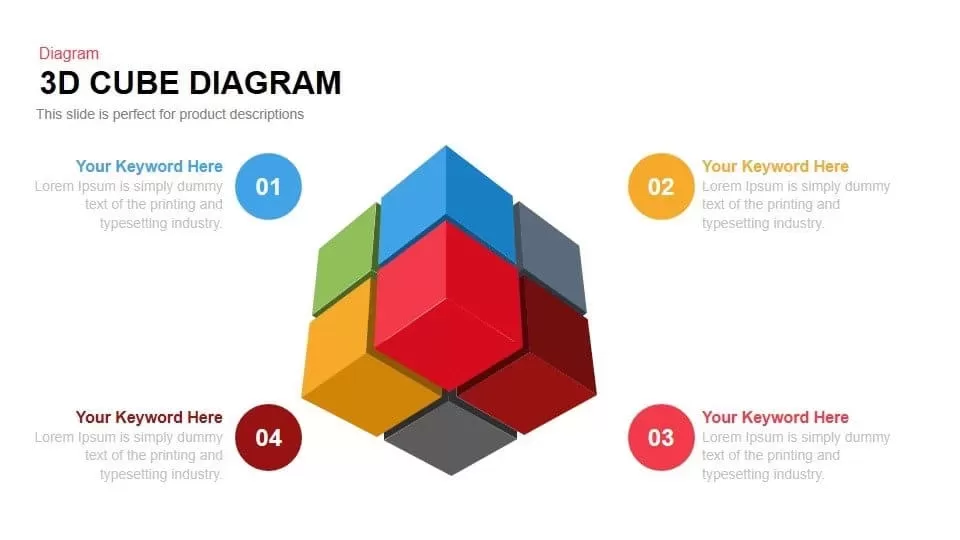
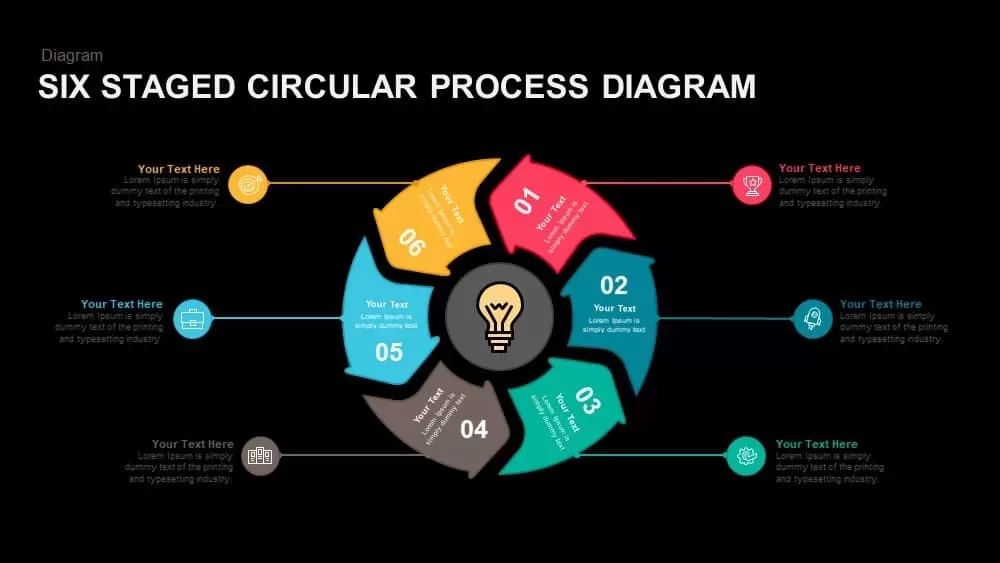
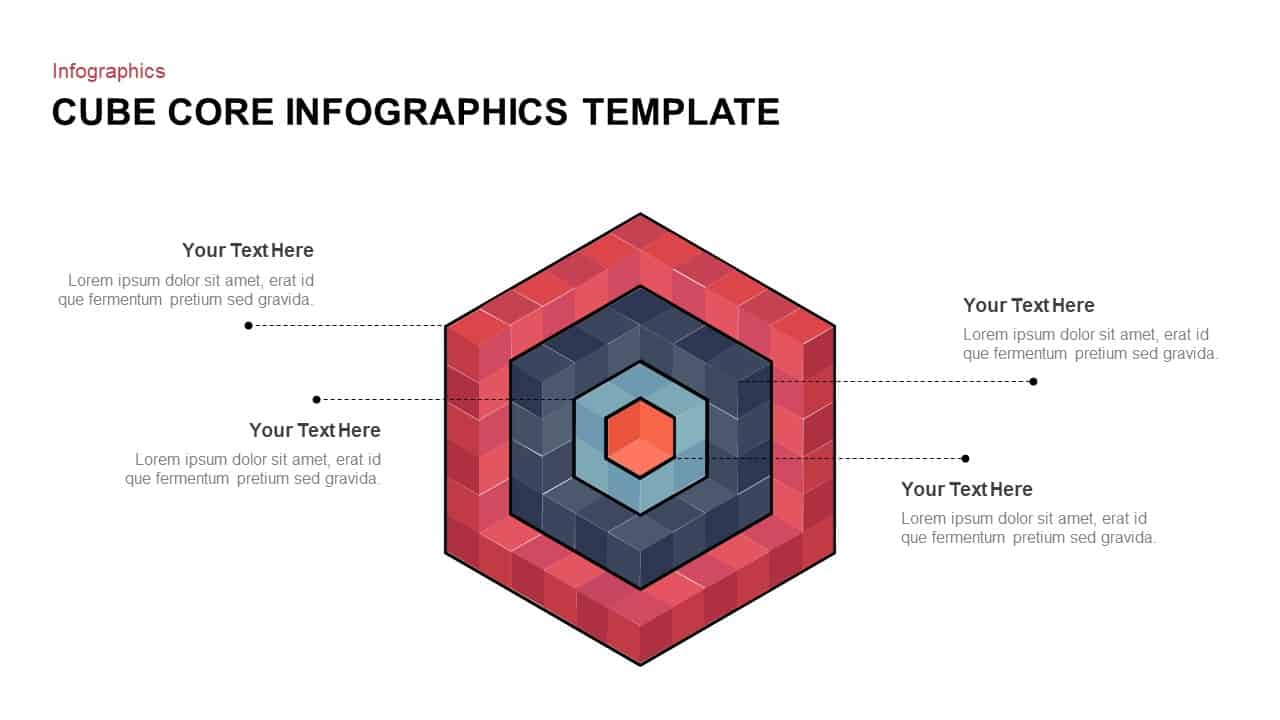
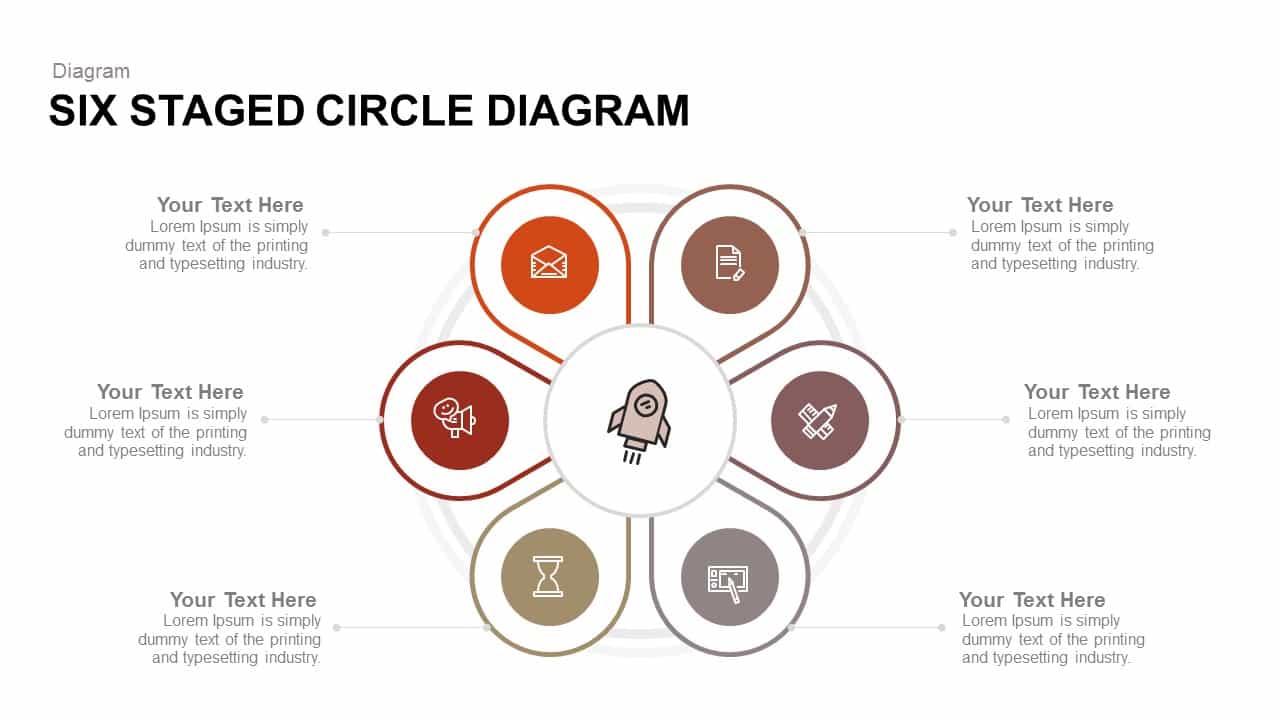
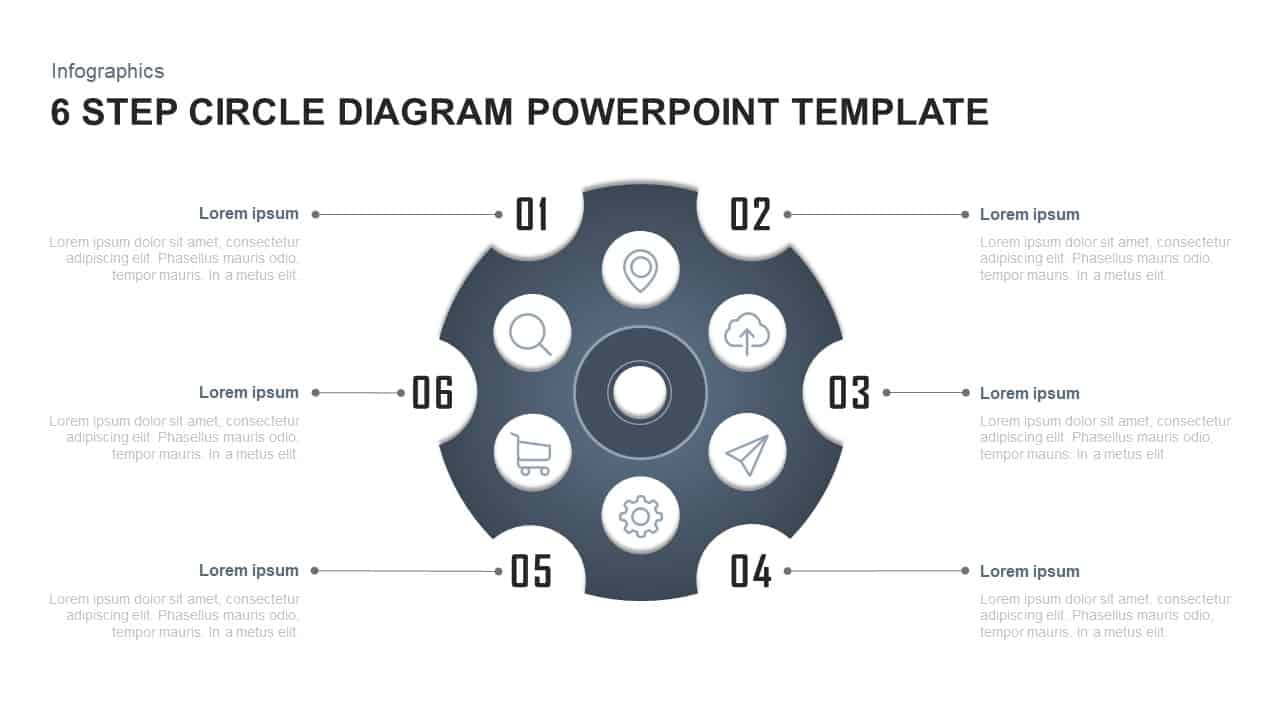
Showcase a six-stage framework with this striking 3D cube circular diagram slide. Six isometric cubes orbit a central hub, each angled for a dynamic perspective and accented with vibrant gradient fills. Numbered labels on cube faces guide viewers through sequential steps, while curved connector lines link modules to adjacent text callouts. The clean white backdrop and dark text maintain high readability and allow gradients to pop, making this slide ideal for corporate presentations, workshops, and training sessions.
Designed for both PowerPoint and Google Slides, this graphic leverages master slides and theme color controls to simplify customization. Swap gradients for your brand palette, replace placeholder icons, and edit text fields without manual realignment. All elements are vector-based, ensuring crisp scalability and rotation. Grouped layers allow you to animate individual cubes or callouts in sequence, guiding audiences step by step without altering slide structure.
Beyond process mapping, this versatile infographic adapts to product feature comparisons, departmental breakdowns, or strategic roadmaps. Place a core objective in the central hub and expand outward with supporting cubes for metrics, milestones, or stakeholder roles. Duplicate or reorder the slide to compare scenarios side by side or adjust segment order to reflect changing priorities. Whether leading board briefings, academic lectures, or department reviews, this slide turns complex data into clear, engaging visuals.
Optional dark- and light-mode variations support high-contrast displays and printouts, while smart connectors adjust automatically when cubes are repositioned. Detailed slide notes guide you through gradient edits, font changes, and icon library integration. This comprehensive toolkit reduces design time, maintains consistency, and elevates your narrative with professional polish.
Who is it for
Project managers, consultants, and business analysts will leverage this slide to map six-step processes, present strategic roadmaps, or illustrate product feature breakdowns. Trainers, educators, and team leads can also use it for workshop modules, academic lessons, or department reviews.
Other Uses
Repurpose this layout to compare multiple scenarios, highlight performance metrics, or showcase stakeholder roles. Adapt cube labels for quarterly milestones, risk assessments, or resource allocation plans—then duplicate or reorder segments to match evolving priorities.
Login to download this file

Item ID
SB01979
Related Templates

Six Segment Hexagon Circular Diagram Template for PowerPoint & Google Slides
Circular
Six-Segment Circular Hub Infographic Template for PowerPoint & Google Slides
Circular
Six-Segment Circular Arrow Cycle Template for PowerPoint & Google Slides
Circular
Six-Segment Circular Arrow Infographic Template for PowerPoint & Google Slides
Circular

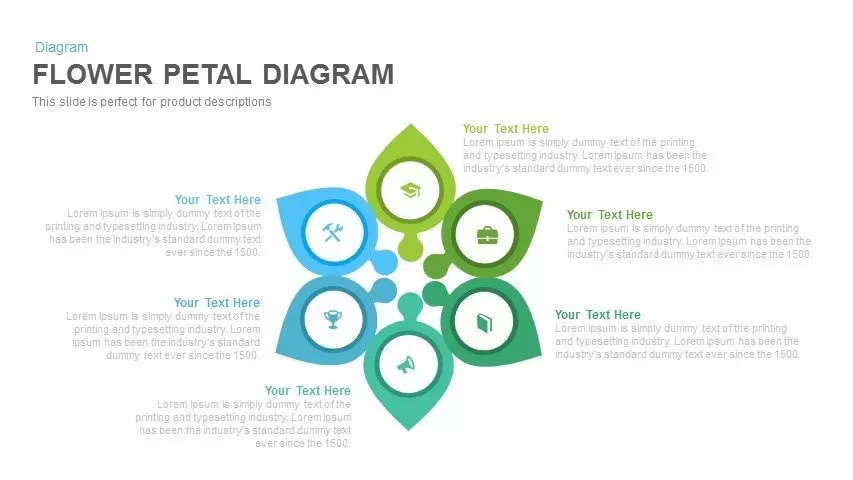
Six-Segment Flower Petal Diagram Template for PowerPoint & Google Slides
Circular
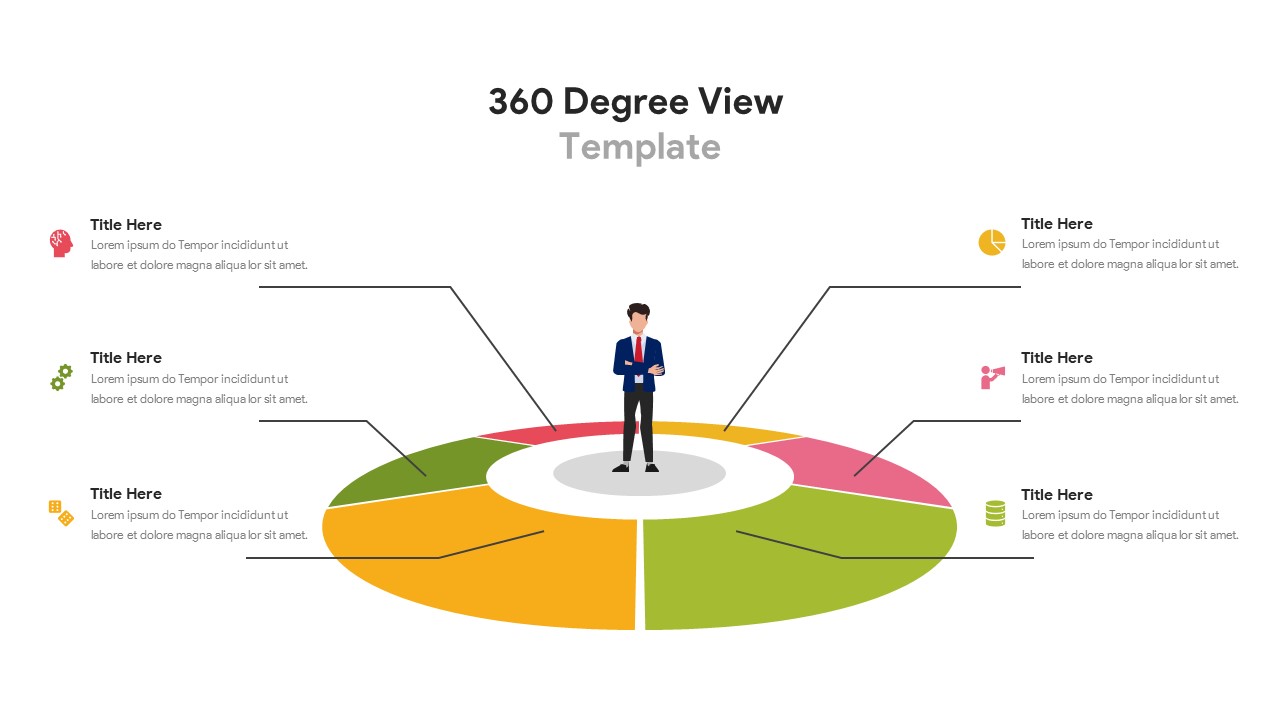
Six-Segment 360 Degree View Infographic Template for PowerPoint & Google Slides
Circular
Seven-Segment Circular Arrow Diagram Template for PowerPoint & Google Slides
Arrow
Three-Segment Circular Arrow Cycle Template for PowerPoint & Google Slides
Circular
Four-Segment Circular Arrow Cycle Template for PowerPoint & Google Slides
Circular

3D Cube Problem-Solving Diagram Template for PowerPoint & Google Slides
Process
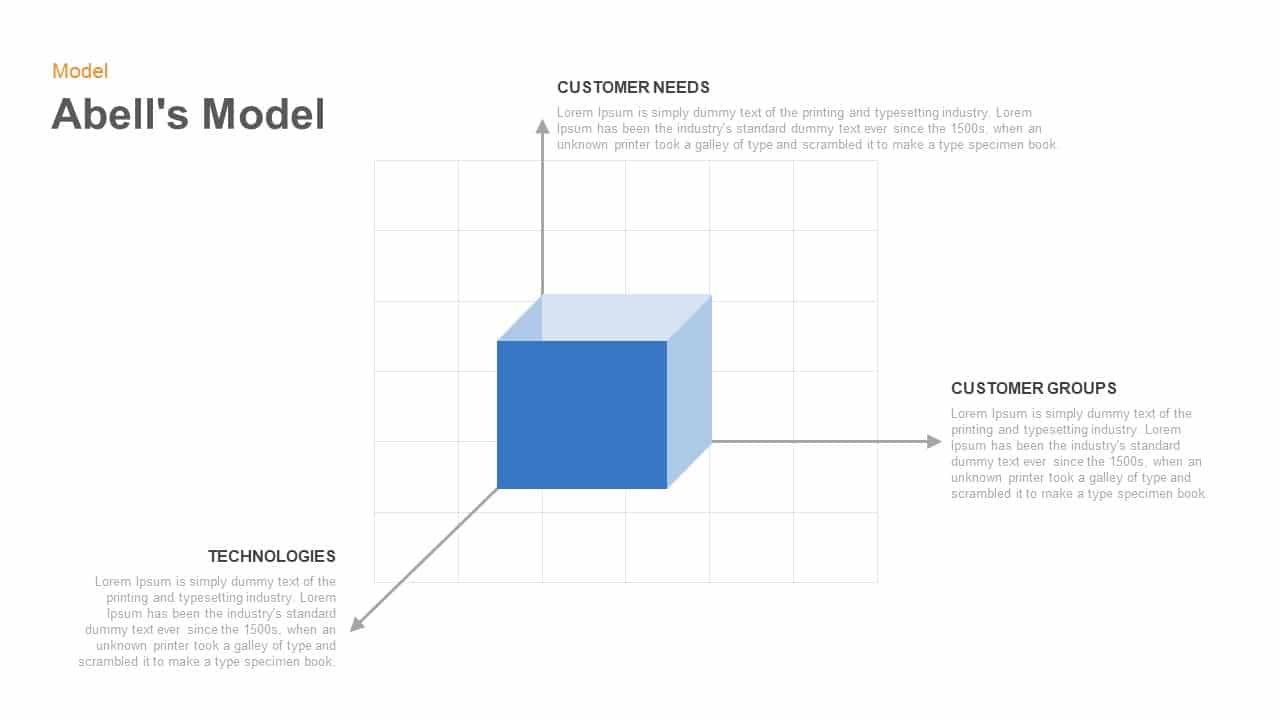
Abell’s 3D Cube Model Diagram Template for PowerPoint & Google Slides
Business Models
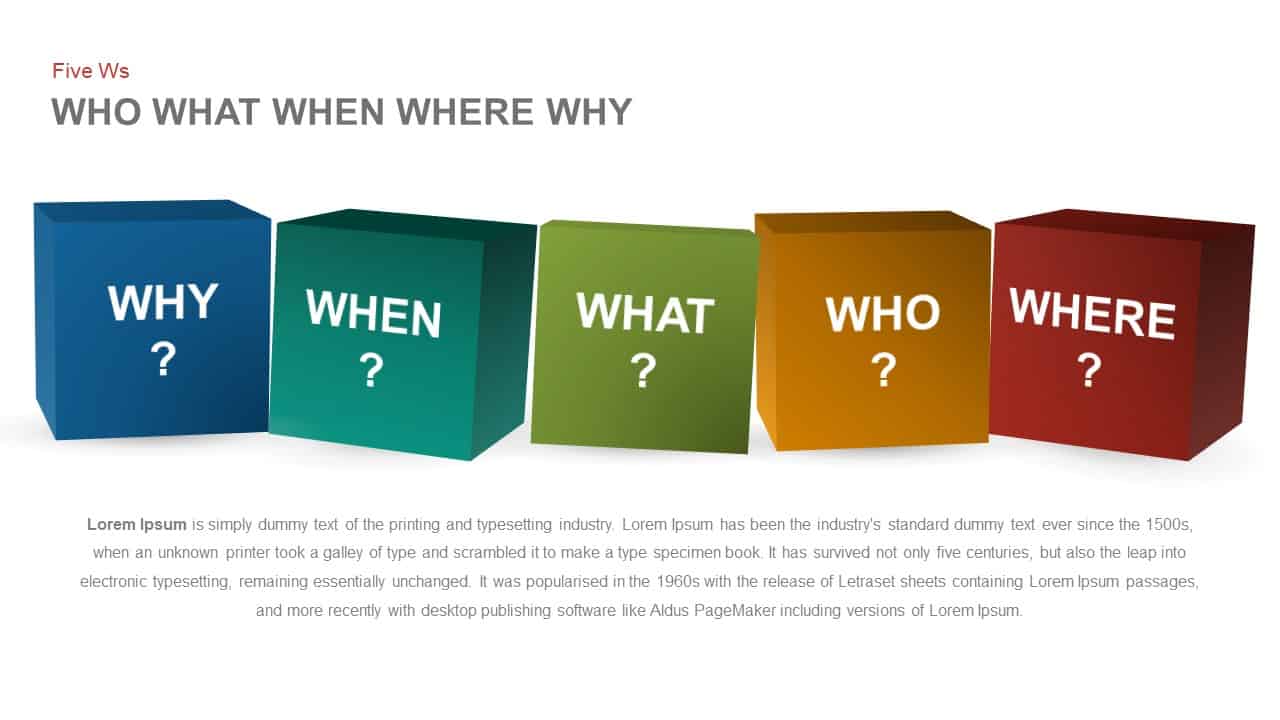
Five Ws Framework Cube Diagram Template for PowerPoint & Google Slides
Comparison
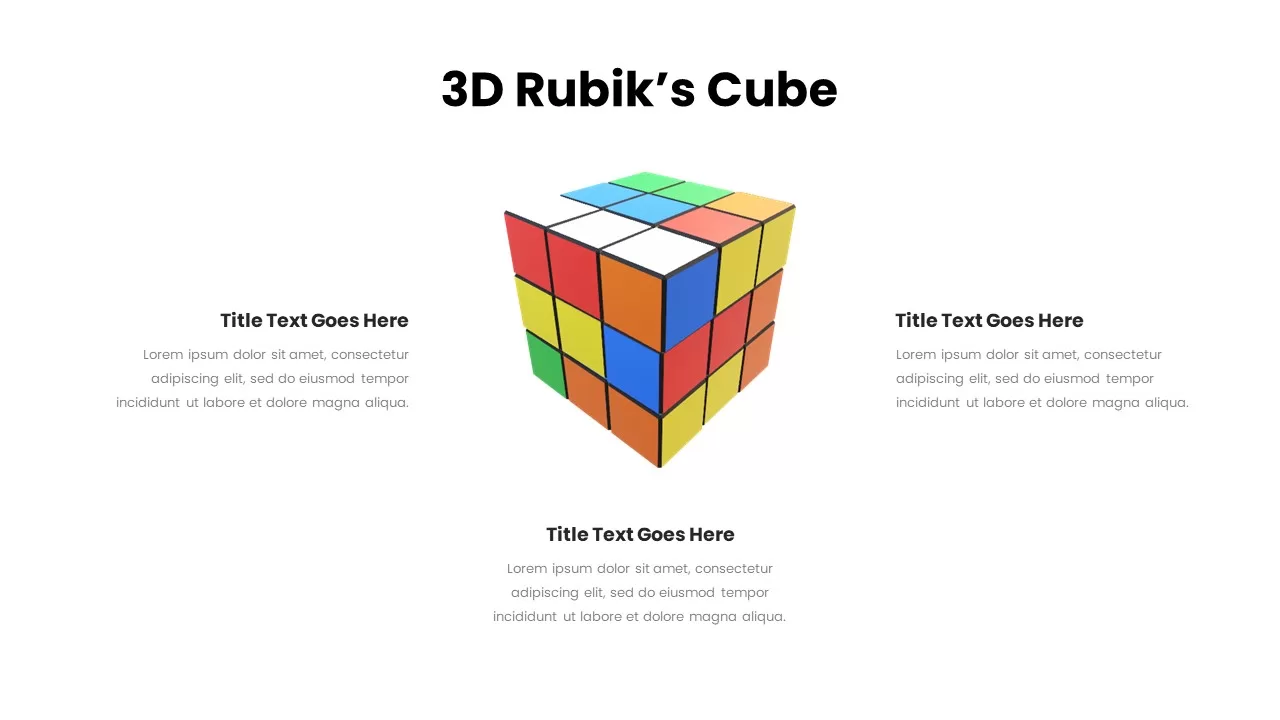
Dynamic 3D Rubik’s Cube Diagram Pack Template for PowerPoint & Google Slides
Infographics
Multi-Segment Circle Split Diagram template for PowerPoint & Google Slides
Circular
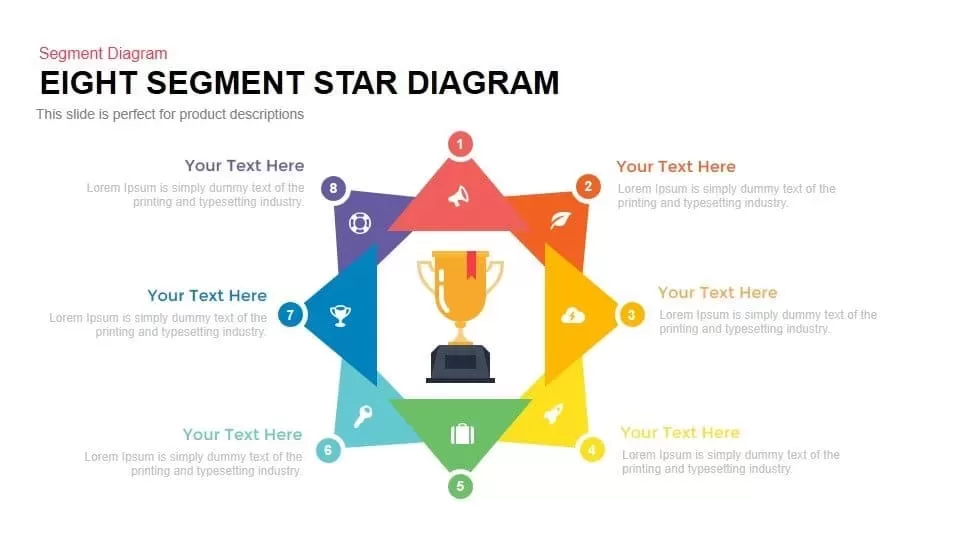
Eight Segment Star Diagram Infographic Template for PowerPoint & Google Slides
Process
Pie Segment Diagram Four-Step Process Template for PowerPoint & Google Slides
Pie/Donut
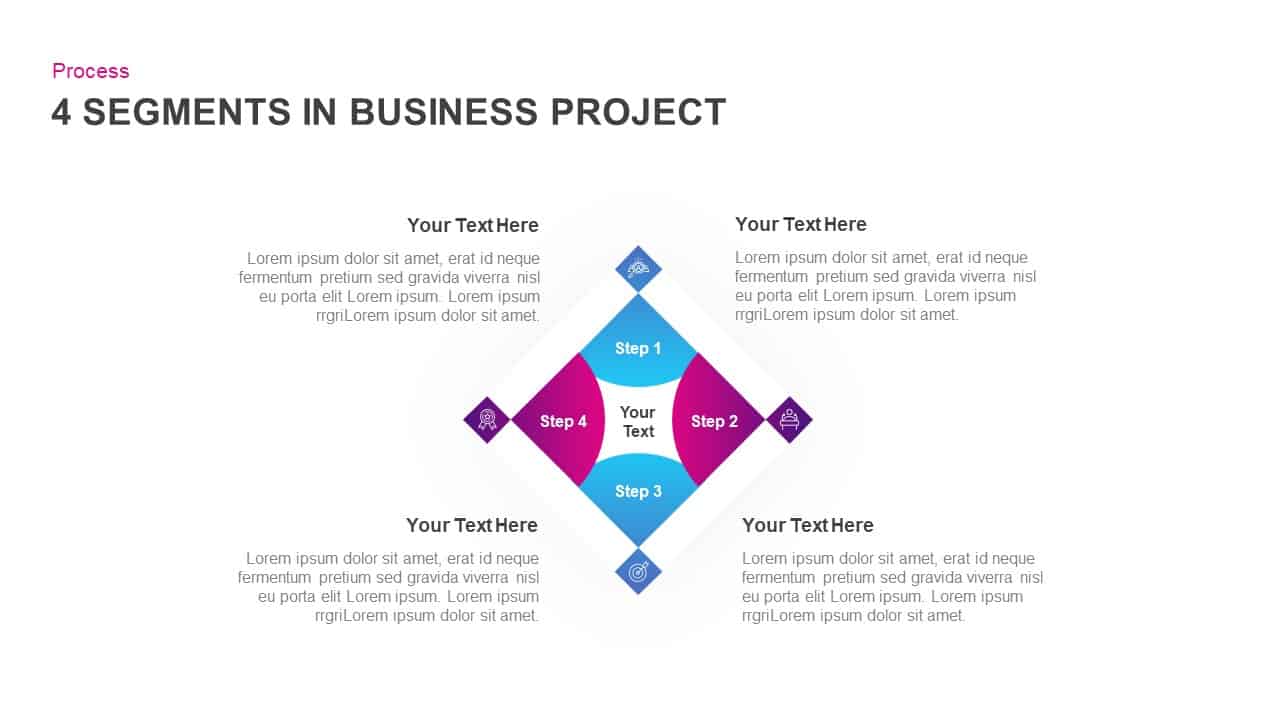
4-Segment Business Project Diamond Diagram Template for PowerPoint & Google Slides
Process
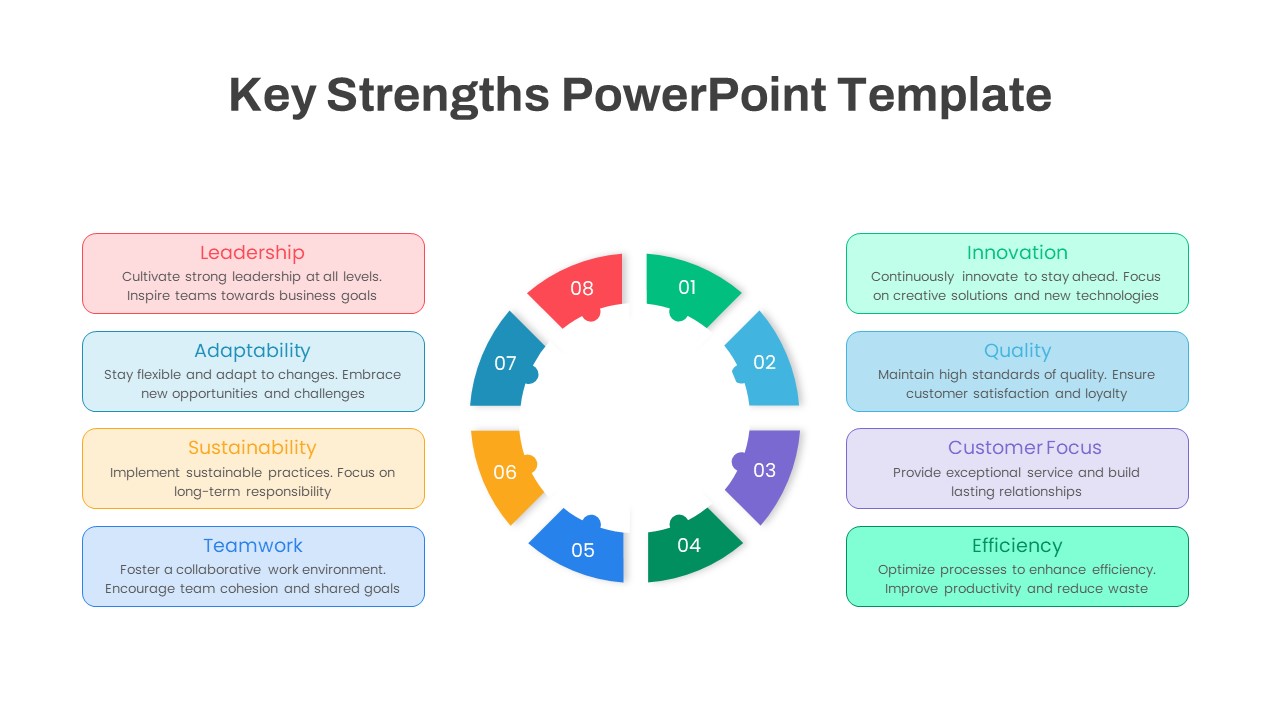
Eight-Segment Key Strengths Diagram Template for PowerPoint & Google Slides
Circular
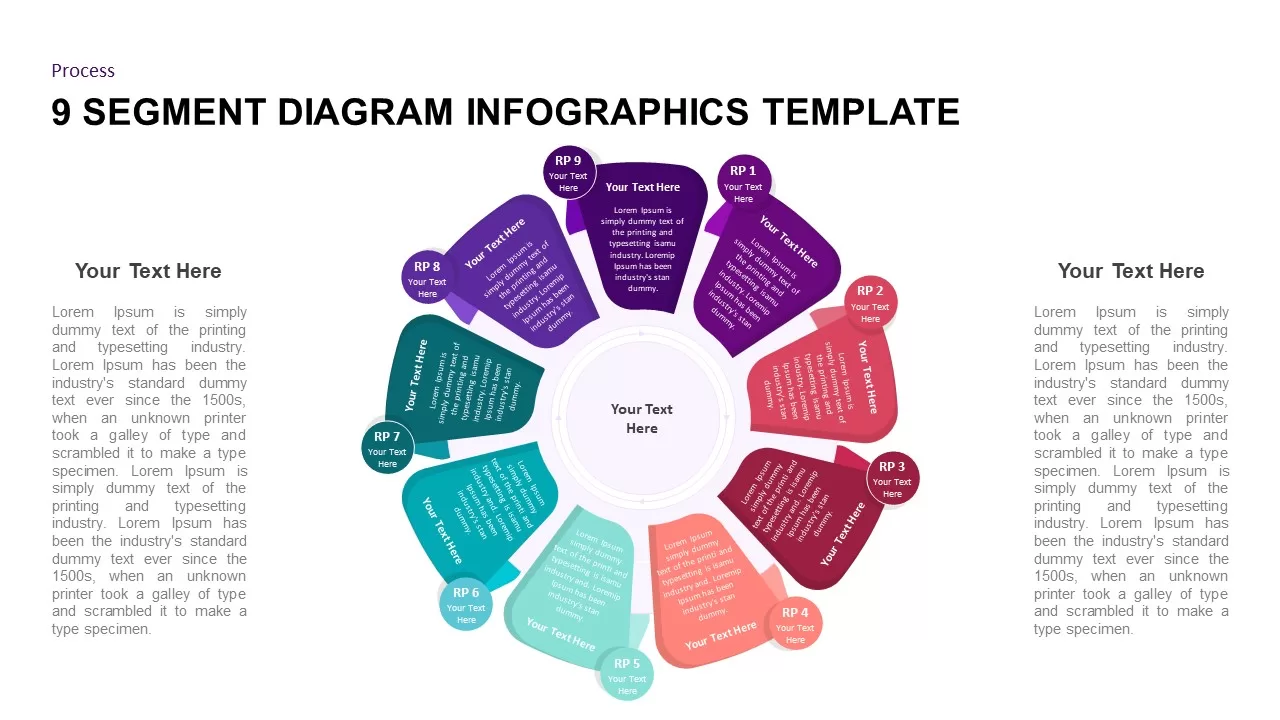
9 Segment Diagram Infographics for PowerPoint & Google Slides
Process
Six Step Creative Circular Diagram Template for PowerPoint & Google Slides
Circular
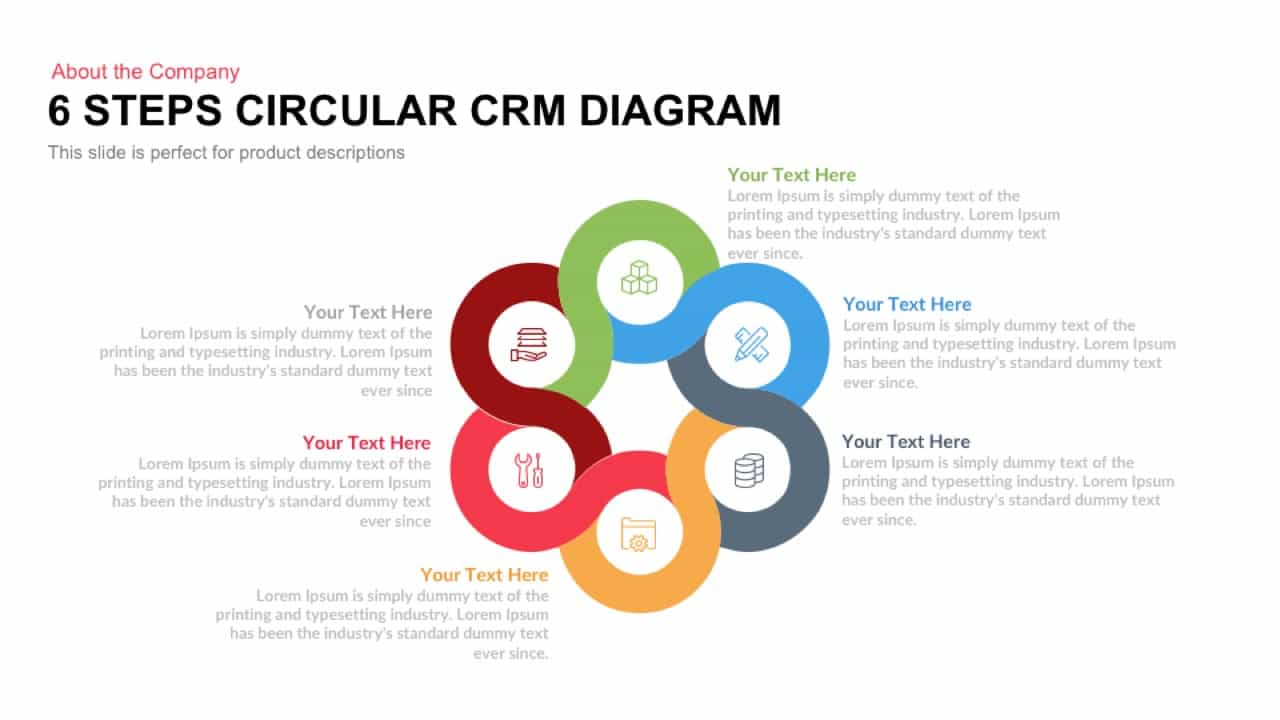
Six Steps Circular CRM Diagram Template for PowerPoint & Google Slides
Customer Journey
Six Section Circular Infographic Diagram Template for PowerPoint & Google Slides
Circular
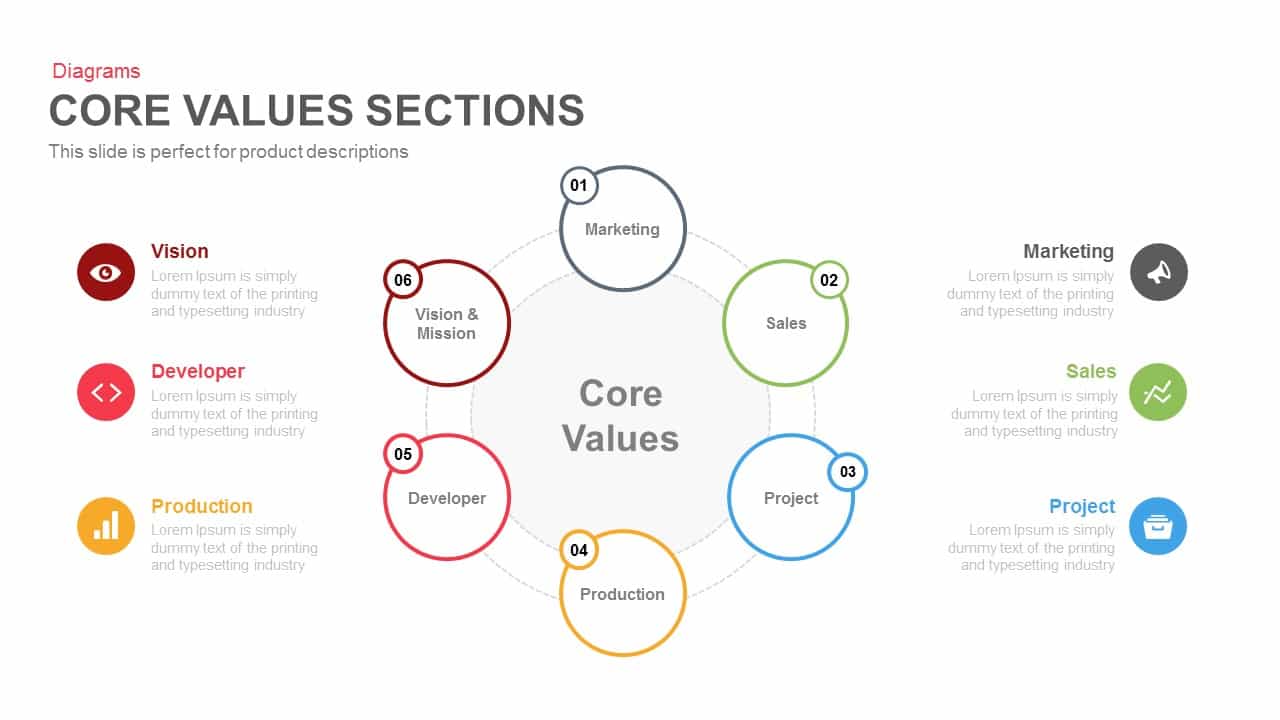
Six-Part Core Values Circular Diagram Template for PowerPoint & Google Slides
Circular
Six-Stage Circular Cycle Diagram Template for PowerPoint & Google Slides
Process
Six-Process Circular Arrow Diagram Template for PowerPoint & Google Slides
Circular

Six-Stage Circular Process Diagram Template for PowerPoint & Google Slides
Process
Six Stage Circular Diagram with Icons Template for PowerPoint & Google Slides
Circular
Three to Six Staged Circular Diagram Template for PowerPoint & Google Slides
Process
Six-Stage Circular Diagram Process Template for PowerPoint & Google Slides
Circular
Six-Stage Clockwise Circular Diagram Template for PowerPoint & Google Slides
Circular
Six-Stage Circular Flow Diagram Template for PowerPoint & Google Slides
Circular
Six-Step Circular Diagram Infographics Template for PowerPoint & Google Slides
Circular
3D Cube Ladder template for PowerPoint & Google Slides
Process
Rubix Cube Product Description Template for PowerPoint & Google Slides
Business
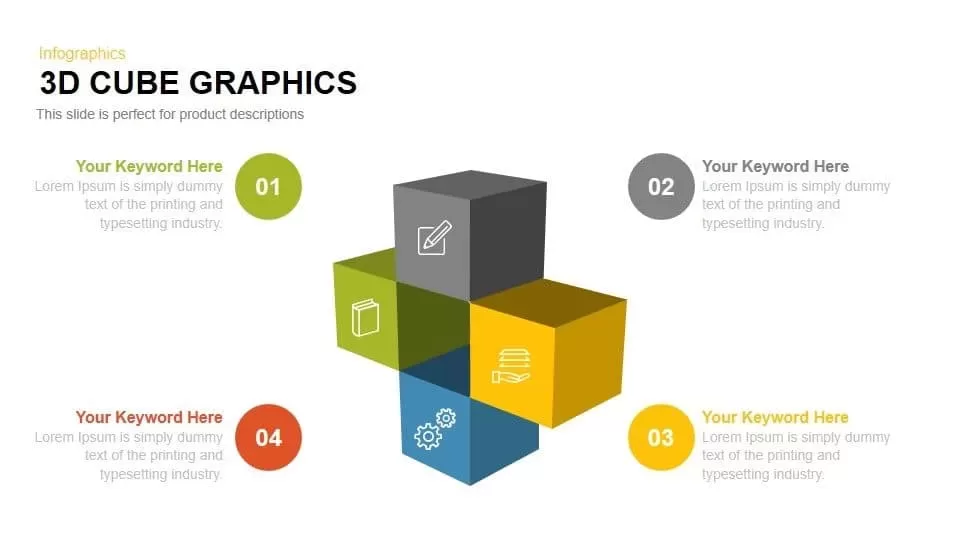
3D Cube Graphics for Four-Step Process Template for PowerPoint & Google Slides
Process
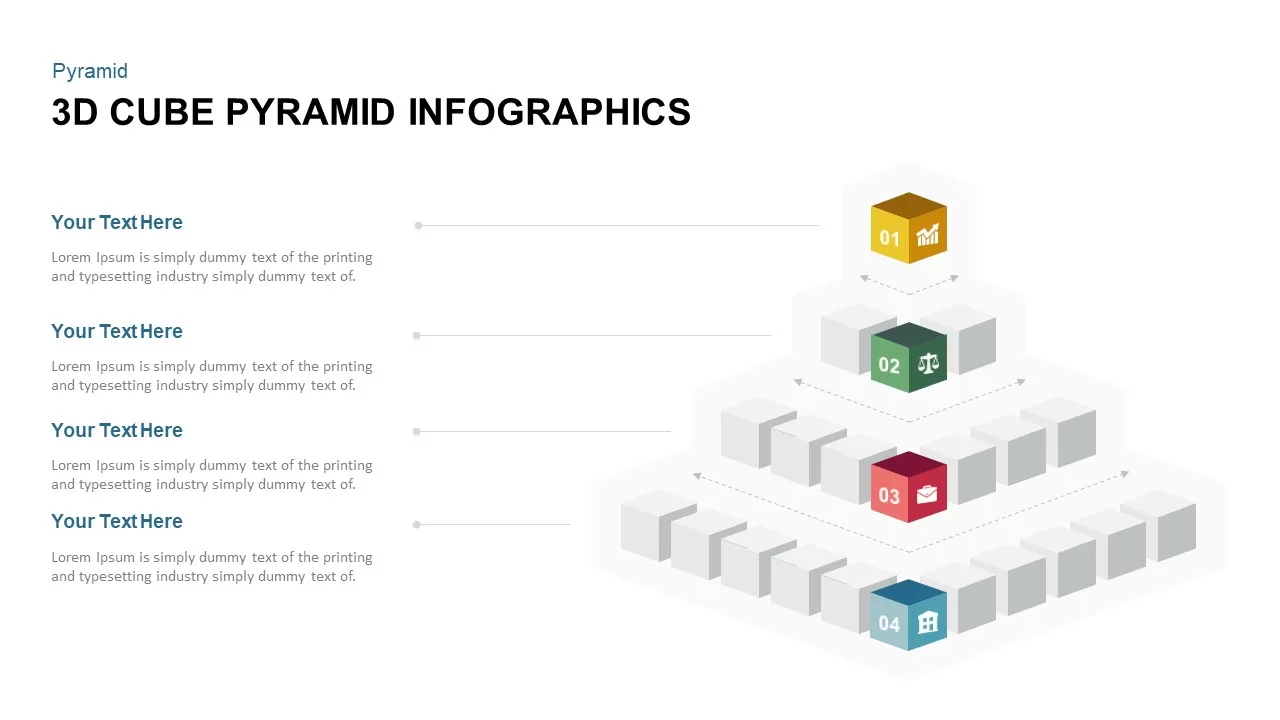
3D Cube Pyramid Infographics Slide Template for PowerPoint & Google Slides
Pyramid
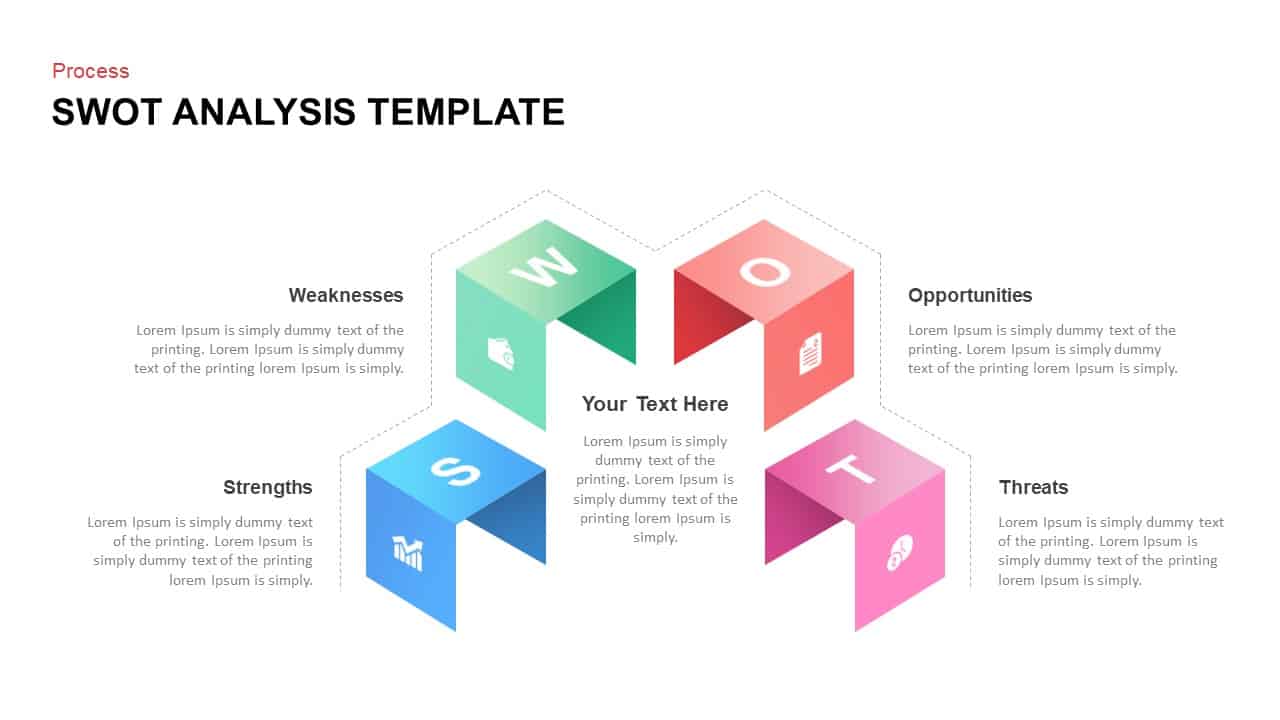
3D Cube SWOT Analysis Infographic Template for PowerPoint & Google Slides
SWOT
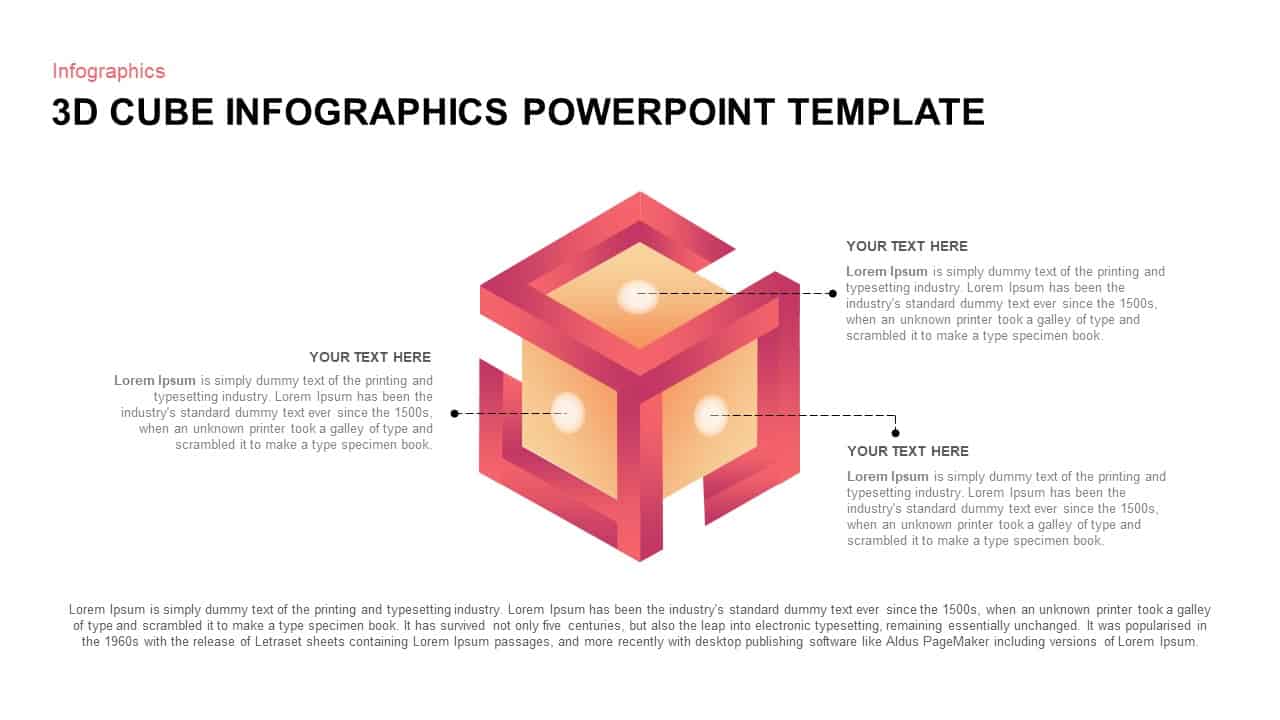
3D Cube Infographics template for PowerPoint & Google Slides
Process
Cube Core Infographics Template for PowerPoint & Google Slides
Process
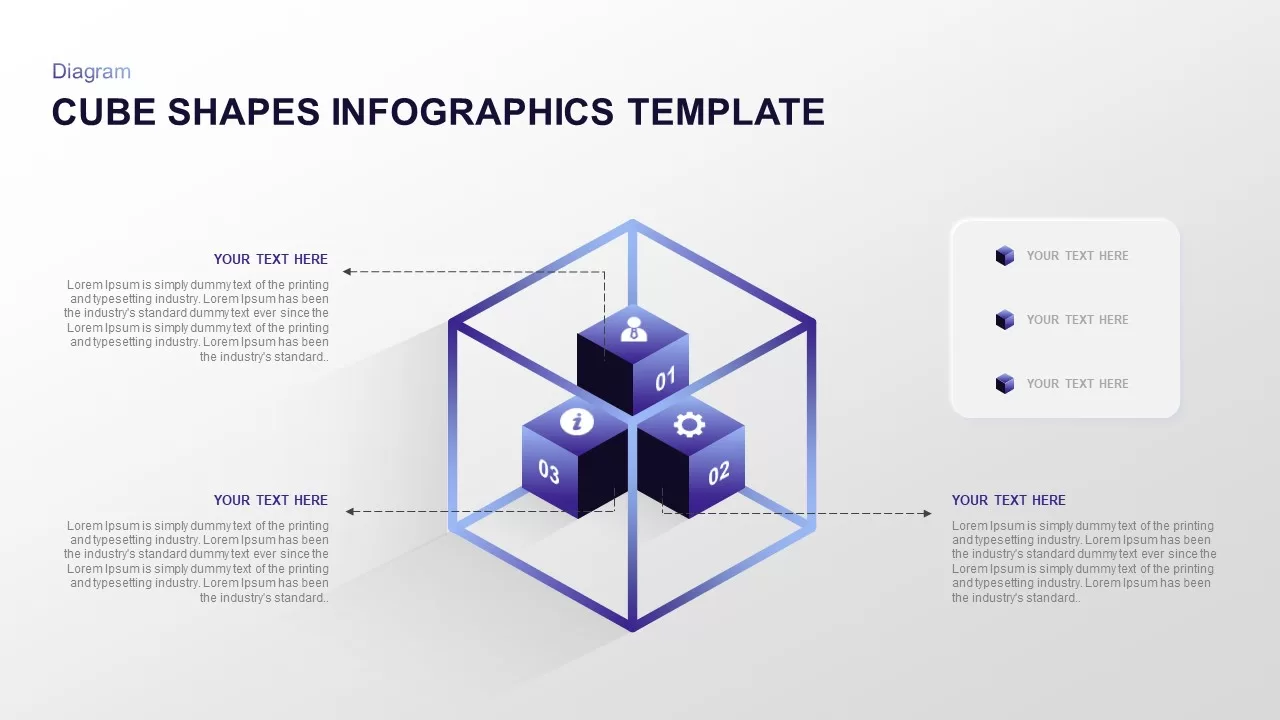
Isometric 3D Cube Shapes Infographics Template for PowerPoint & Google Slides
Infographics
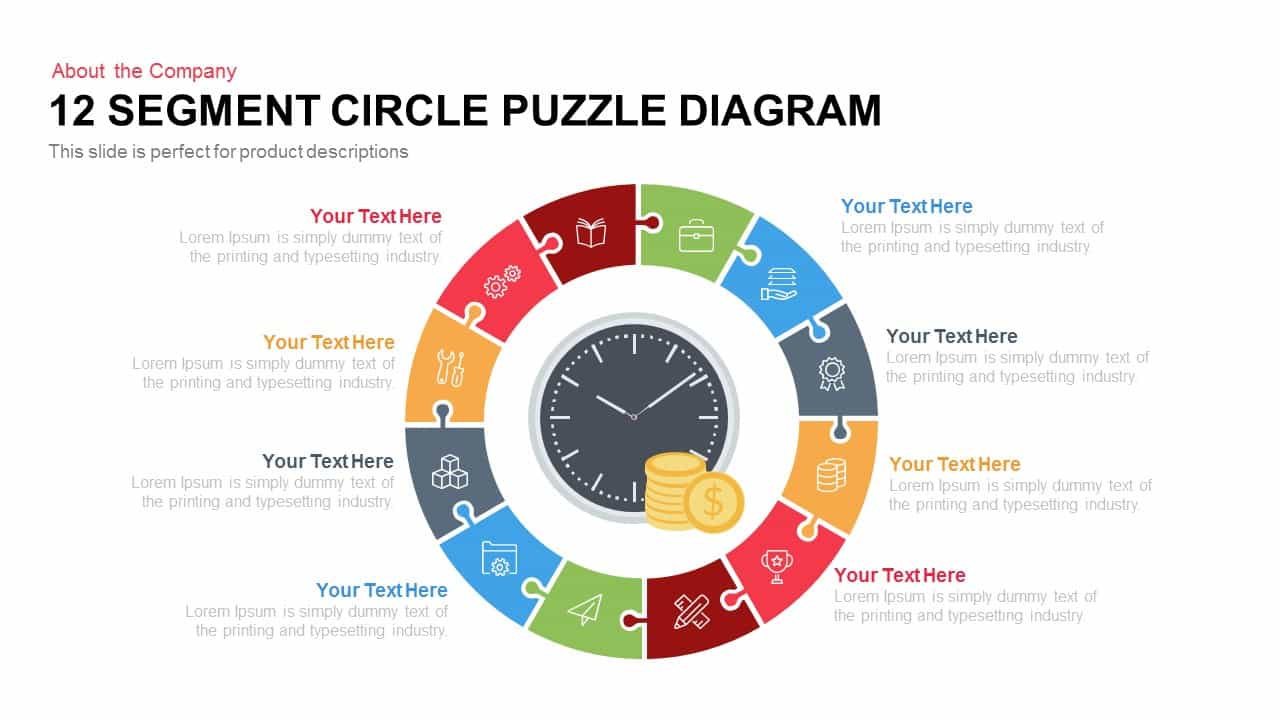
12 Segment Circle Puzzle Diagram Template for PowerPoint and Keynote
Circular
Circle Segment Sales Metrics Infographic Template for PowerPoint & Google Slides
Circular
Eight-Segment 3D Arrow Infographics Template for PowerPoint & Google Slides
Arrow
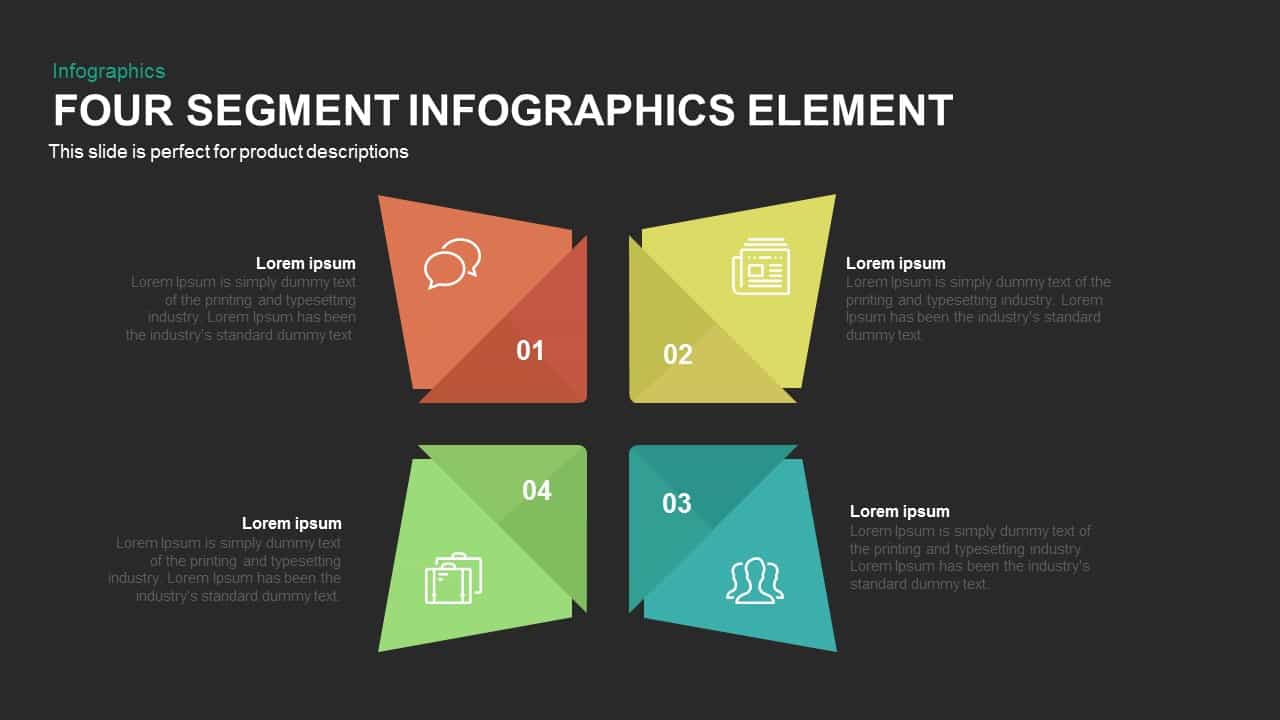
Four Segment Infographics Element Template for PowerPoint & Google Slides
Comparison
Eight-Segment Direct Marketing Wheel Template for PowerPoint & Google Slides
Circular
Four-Segment Flywheel Infographic Model Template for PowerPoint & Google Slides
Process
Shield Four-Segment Infographic Template for PowerPoint & Google Slides
Process
Colorful Four-Segment Wheel Chart Template for PowerPoint & Google Slides
Circular
Five-Segment Pentagon Digital Journey Template for PowerPoint & Google Slides
Process
Three Segment Donut Chart KPI Infographic Template for PowerPoint & Google Slides
Pie/Donut
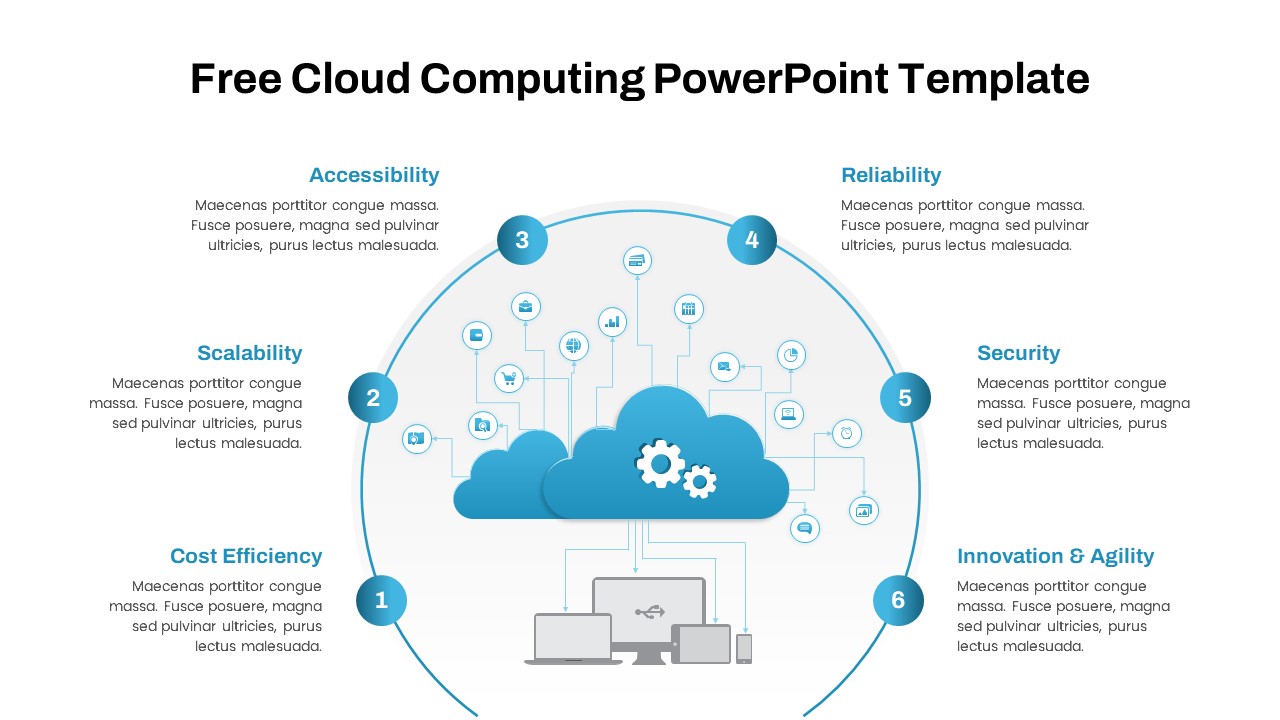
Free Cloud Computing Six-Step Circular Template for PowerPoint & Google Slides
Cloud Computing
Free
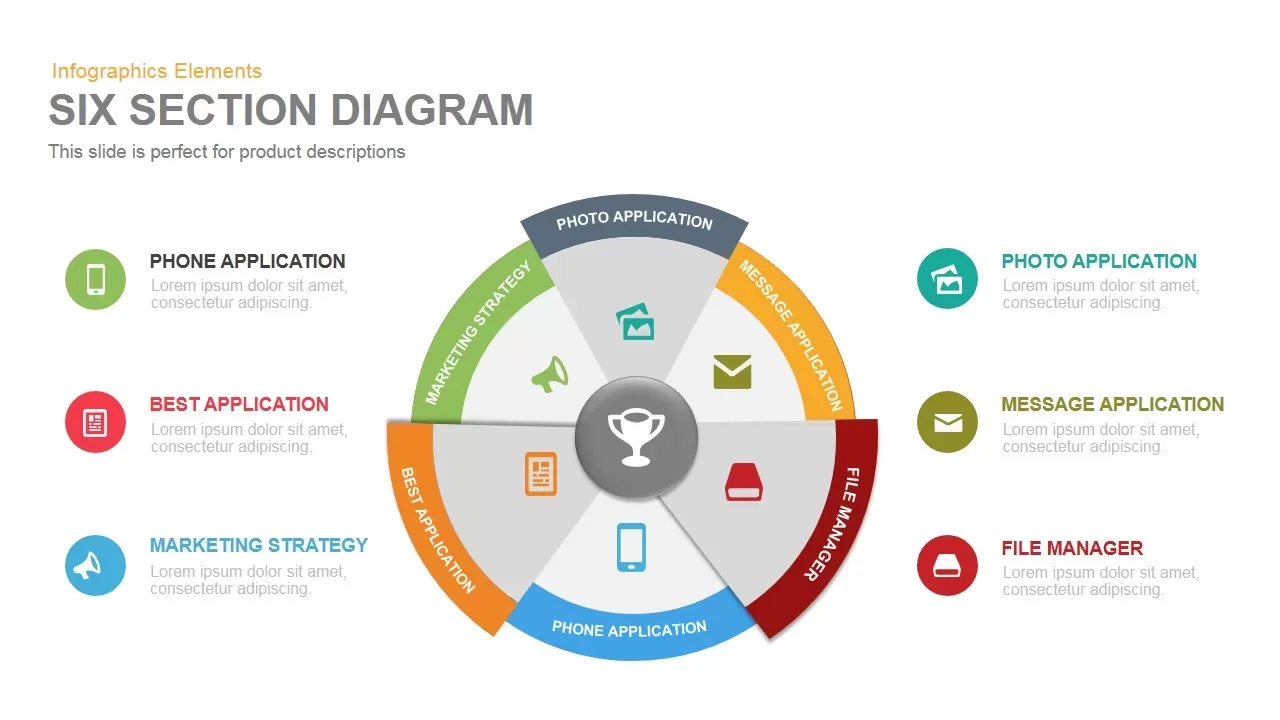
Six Section Diagram template for PowerPoint & Google Slides
Circular
Six Arrow Radial Process Diagram template for PowerPoint & Google Slides
Infographics
Six Hexagon Stages Process Flow Diagram Template for PowerPoint & Google Slides
Process
Six Stage Zigzag Process Diagram Template for PowerPoint & Google Slides
Process
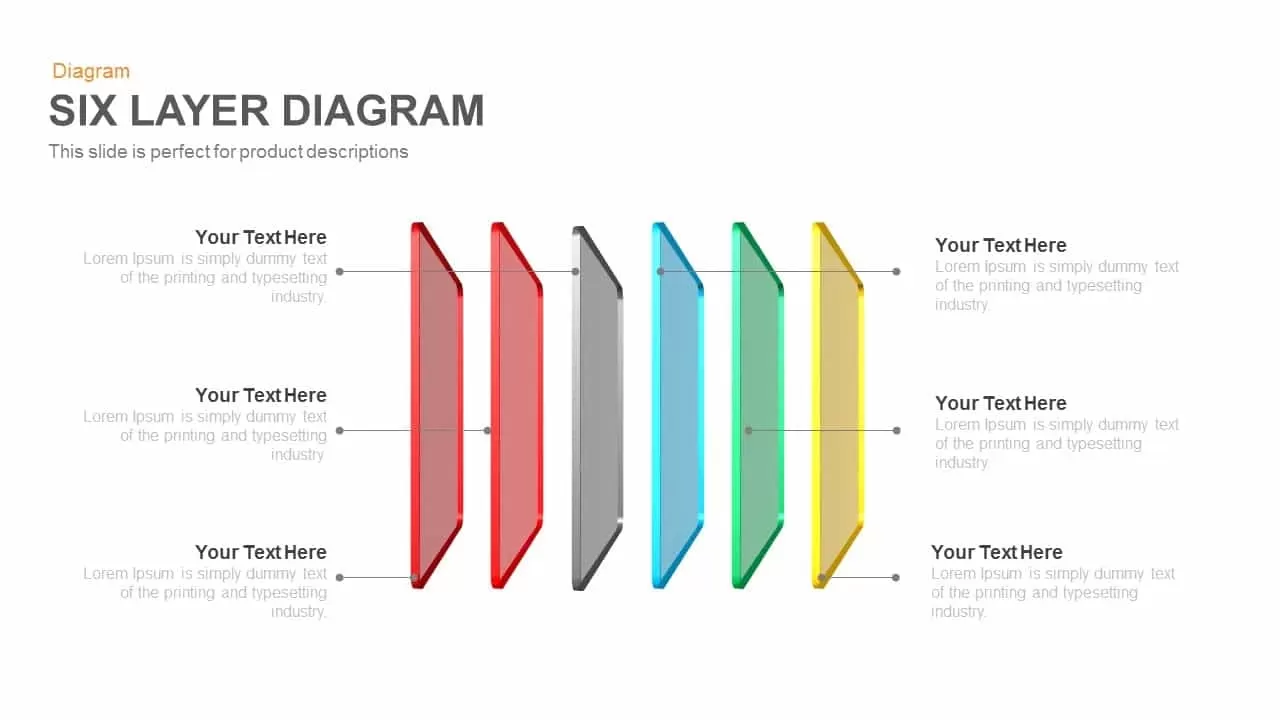
Six Layer Diagram template for PowerPoint & Google Slides
Process
Roadmap Six-Step Process Diagram Template for PowerPoint & Google Slides
Roadmap
Six Pointing Arrow Process Diagram Template for PowerPoint & Google Slides
Arrow
Six-Stage Zig-Zag Process Flow Diagram Template for PowerPoint & Google Slides
Process
Six-Part Business Idea Bulb Diagram Template for PowerPoint & Google Slides
Circular
Six-Stage Semi-Circle Diagram with Icons Template for PowerPoint & Google Slides
Circular
Six-Staged Gear Diagram Framework Template for PowerPoint & Google Slides
Process
Editable Six-Step Bubble Process Diagram Template for PowerPoint & Google Slides
Process
Six-Step Hexagon Process Diagram Template for PowerPoint & Google Slides
Process
Free Six Stage Bubble Process Diagram template for PowerPoint & Google Slides
Process
Free
Six Staged Circle Diagram template for PowerPoint & Google Slides
Circular
Six-Section Star Infographic Diagram Template for PowerPoint & Google Slides
Circular
Six Hexagon Hub-and-Spoke Diagram Template for PowerPoint & Google Slides
Process
Six-Step Two-Sided Arrow Diagram Template for PowerPoint & Google Slides
Process
Six-Step Hexagonal Diagram Slide Template for PowerPoint & Google Slides
Circular
Six-Stage Circle Process Diagram Template for PowerPoint & Google Slides
Process
Six-Step Vertical Process Diagram Template for PowerPoint & Google Slides
Process
Free Six-Stage Arrow Process Diagram Template for PowerPoint & Google Slides
Process
Free
Six-Step Linear Arrow Process Diagram Template for PowerPoint & Google Slides
Process
Six-Stage Gear Wheel Diagram Template for PowerPoint & Google Slides
Circular
Six-Step Hexagon Process Flow Diagram Template for PowerPoint & Google Slides
Process
Six-Stage Arrow Timeline Diagram Template for PowerPoint & Google Slides
Timeline
Six Stage Hexagon Process Diagram Template for PowerPoint & Google Slides
Process
Six Stage Agenda Timeline Diagram template for PowerPoint & Google Slides
Agenda
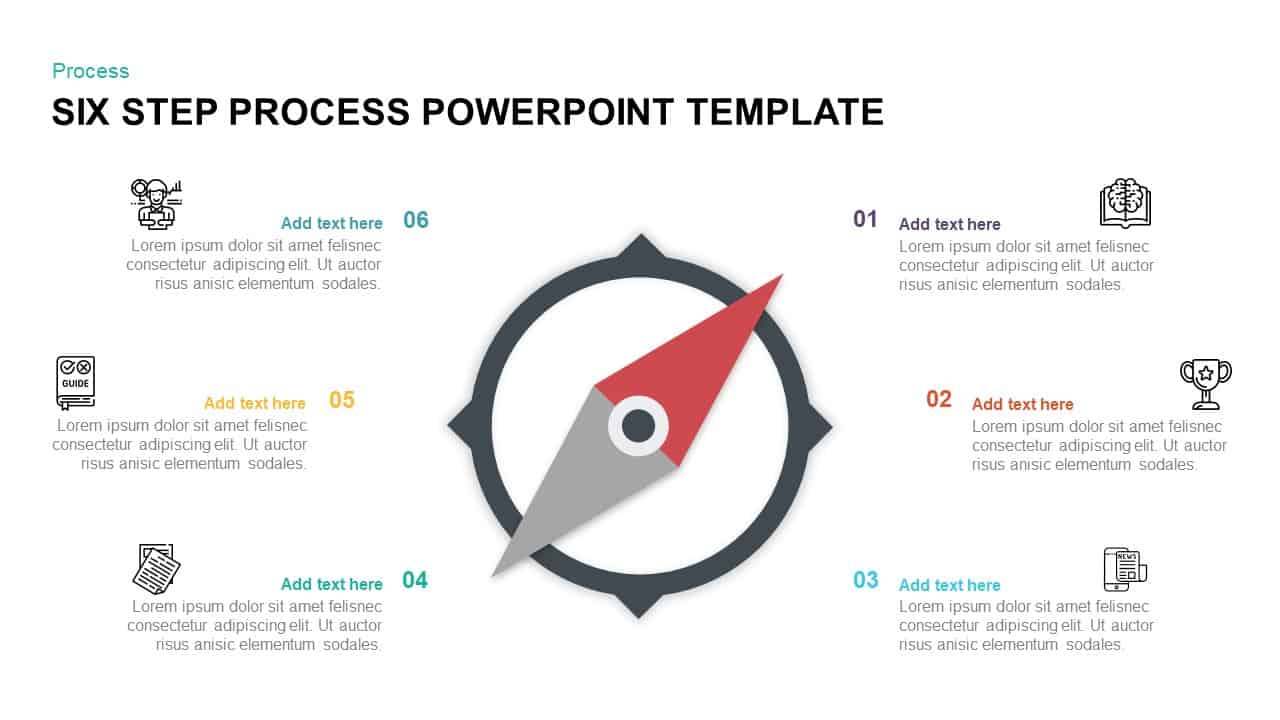
Compass-Themed Six-Step Process Diagram Template for PowerPoint & Google Slides
Process
Greiner Growth Model Six-Phase Diagram Template for PowerPoint & Google Slides
Business Models
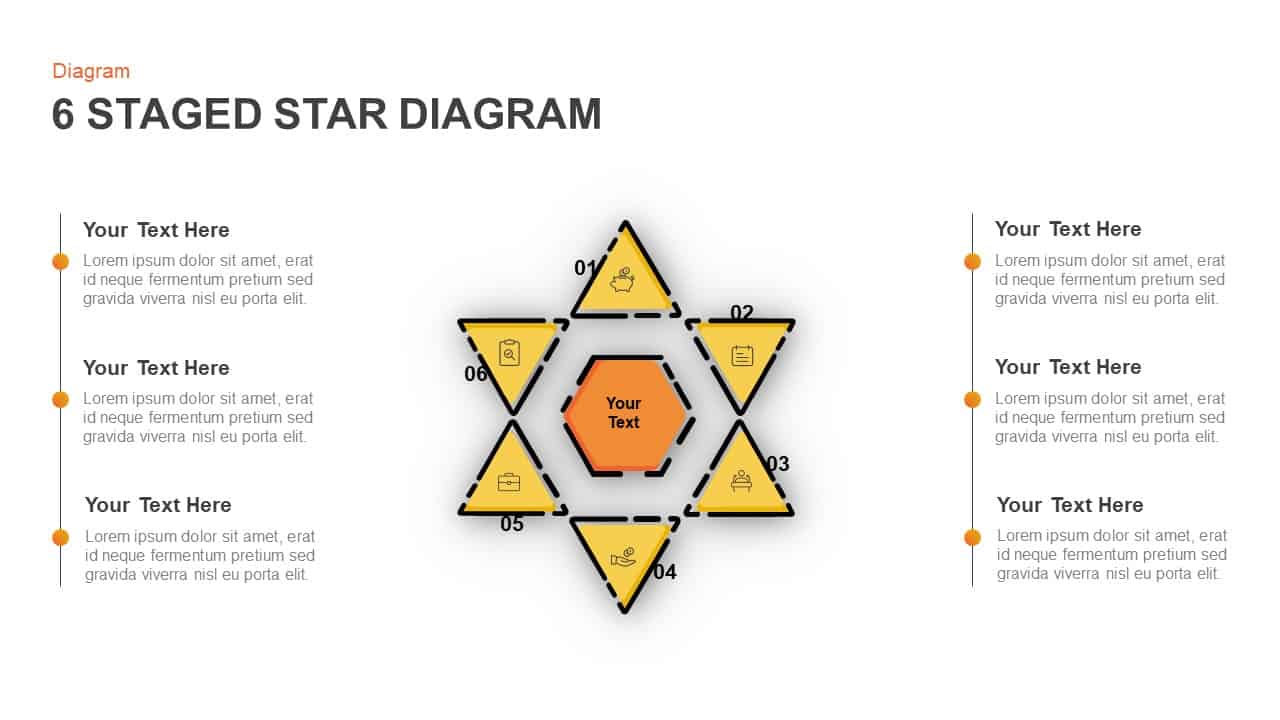
Six-Stage Star Diagram Infographic Template for PowerPoint & Google Slides
Process
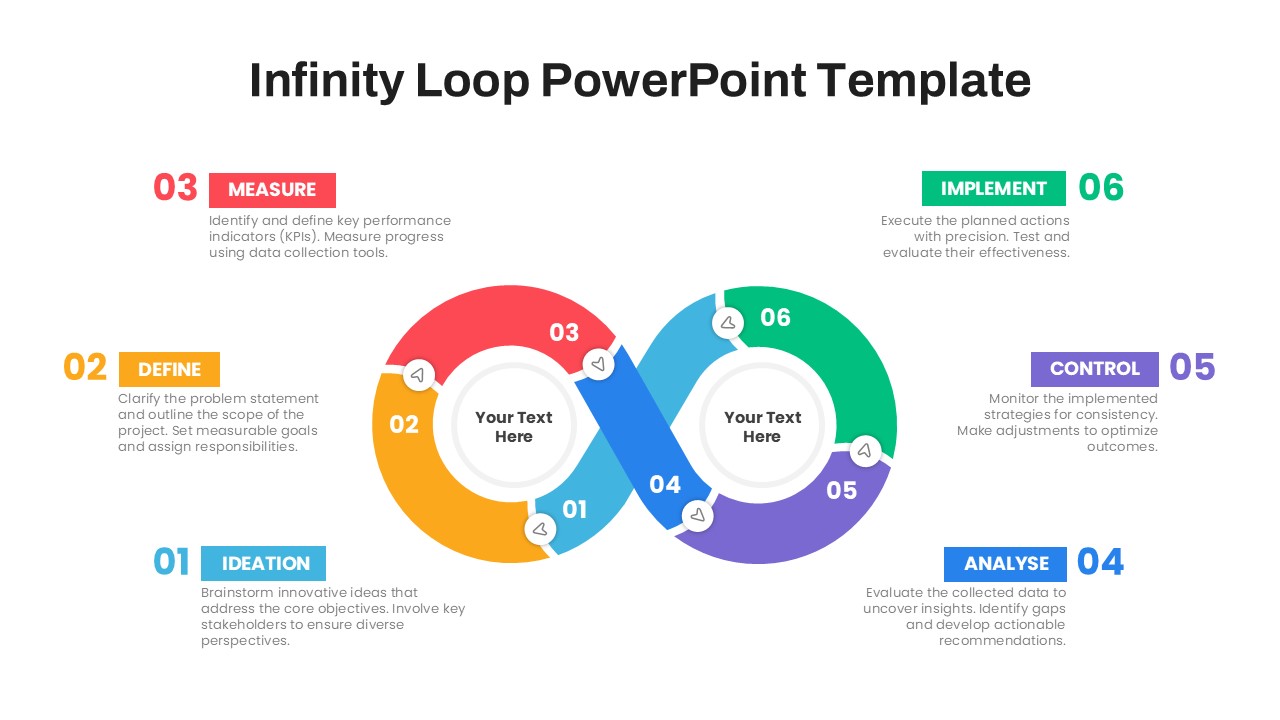
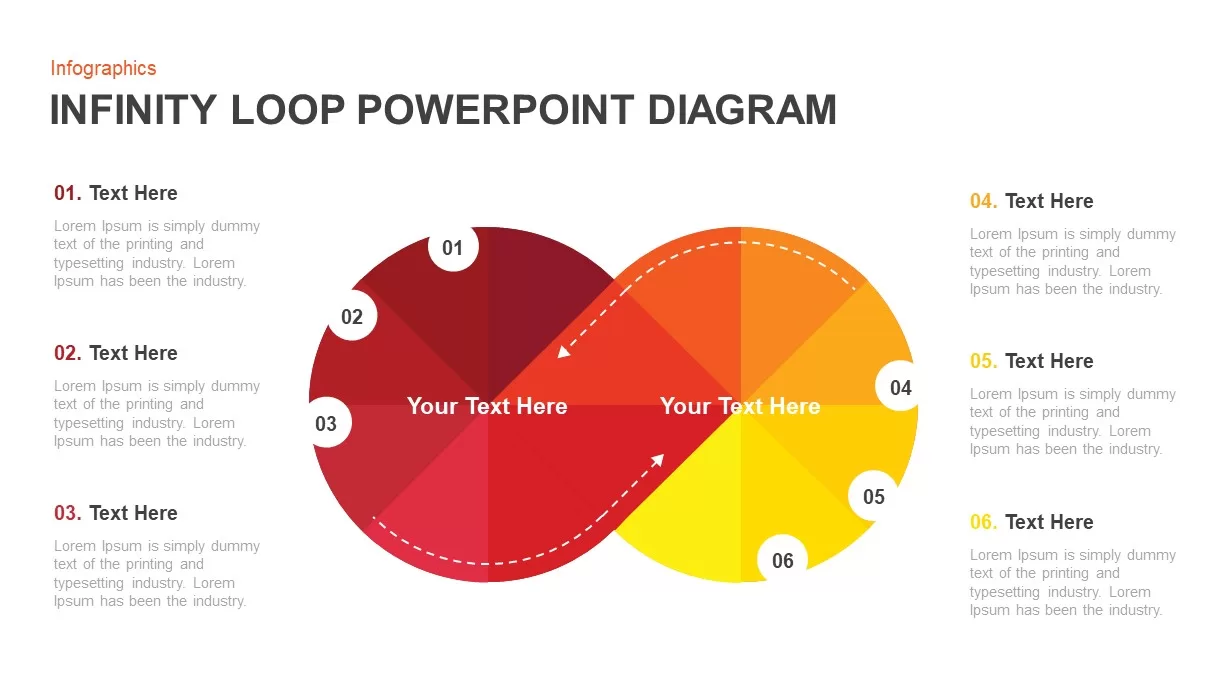
Six-Step Infinity Loop Process Diagram Template for PowerPoint & Google Slides
Process
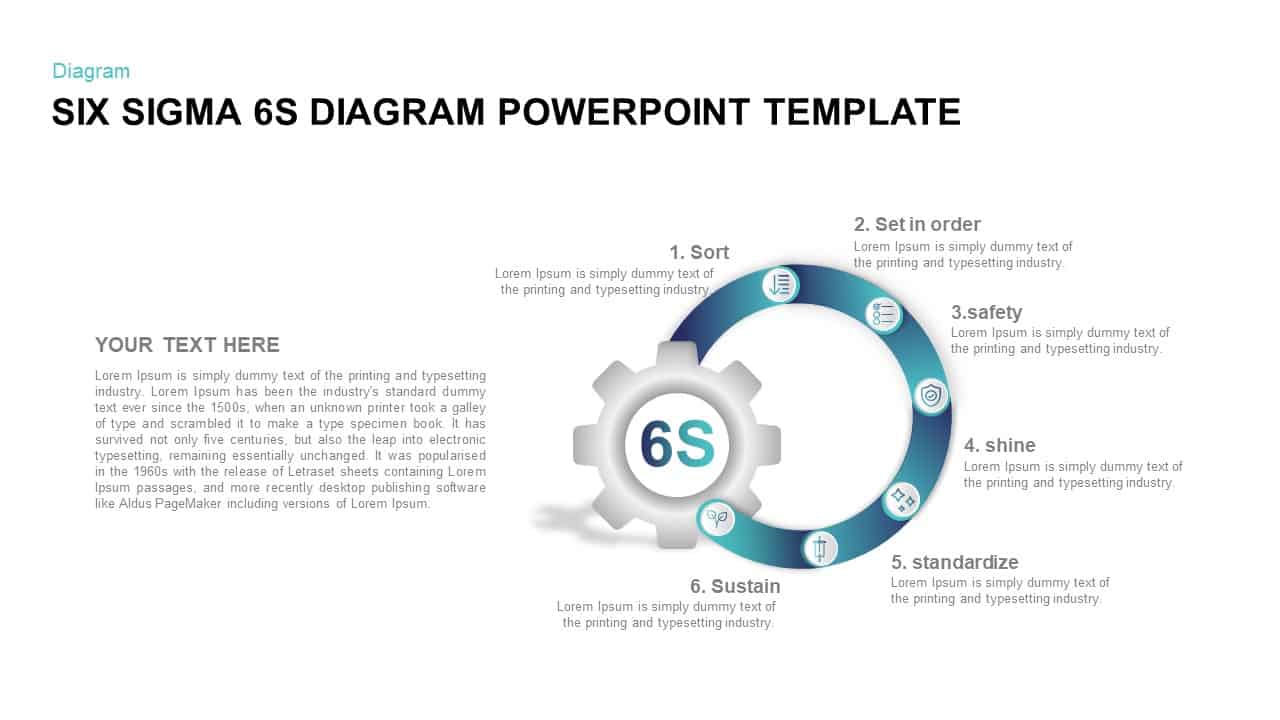
Six Sigma 6S Process Infographic Diagram Template for PowerPoint & Google Slides
Process
Six Sigma 6S Process Diagram Template for PowerPoint & Google Slides
Process
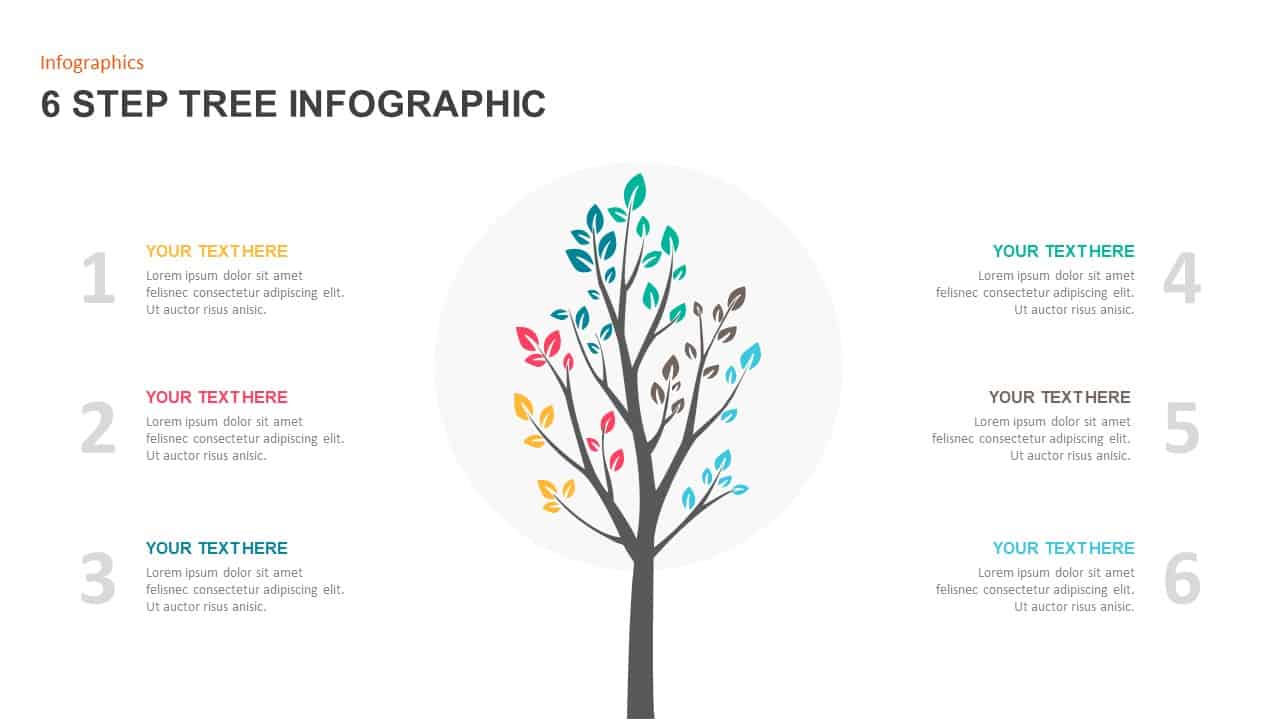
Six-Step Tree Diagram Infographic Template for PowerPoint & Google Slides
Infographics
Six-Circle Process Infographic Diagram Template for PowerPoint & Google Slides
Circular

Six-Stage Infinity Loop Diagram Template for PowerPoint & Google Slides
Process
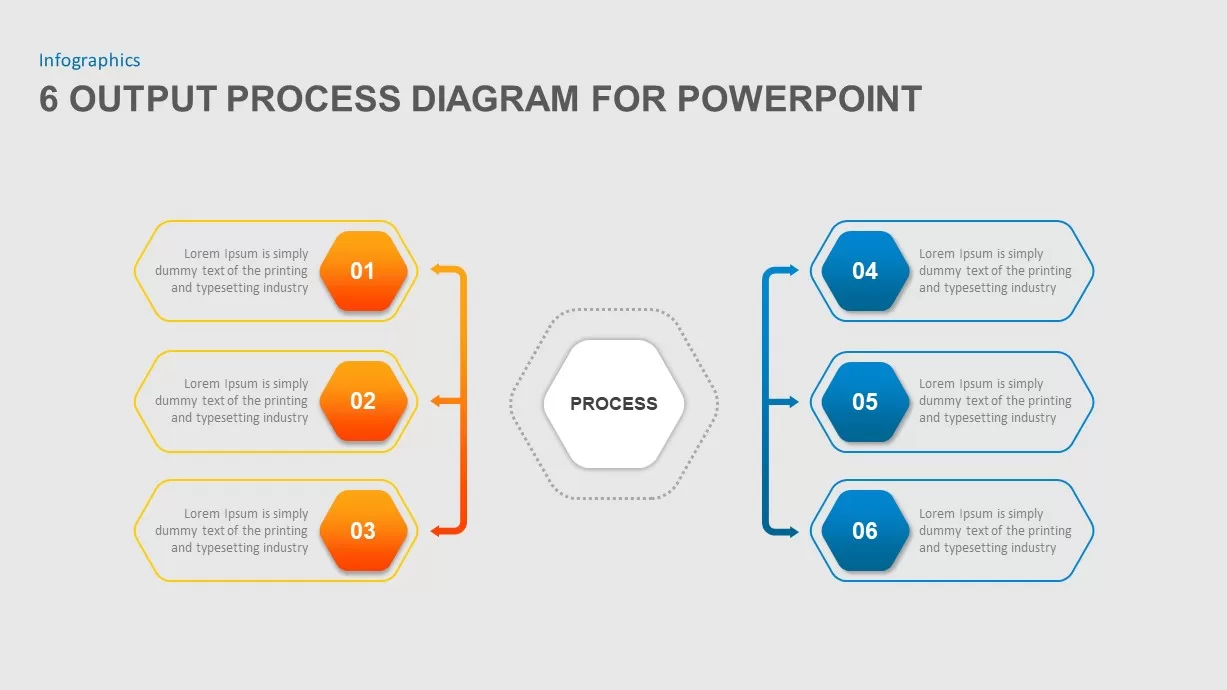
Six-Step Output Process Diagram Template for PowerPoint & Google Slides
Process
Stacked Cubes Pyramid Six-Option Diagram Template for PowerPoint & Google Slides
Pyramid
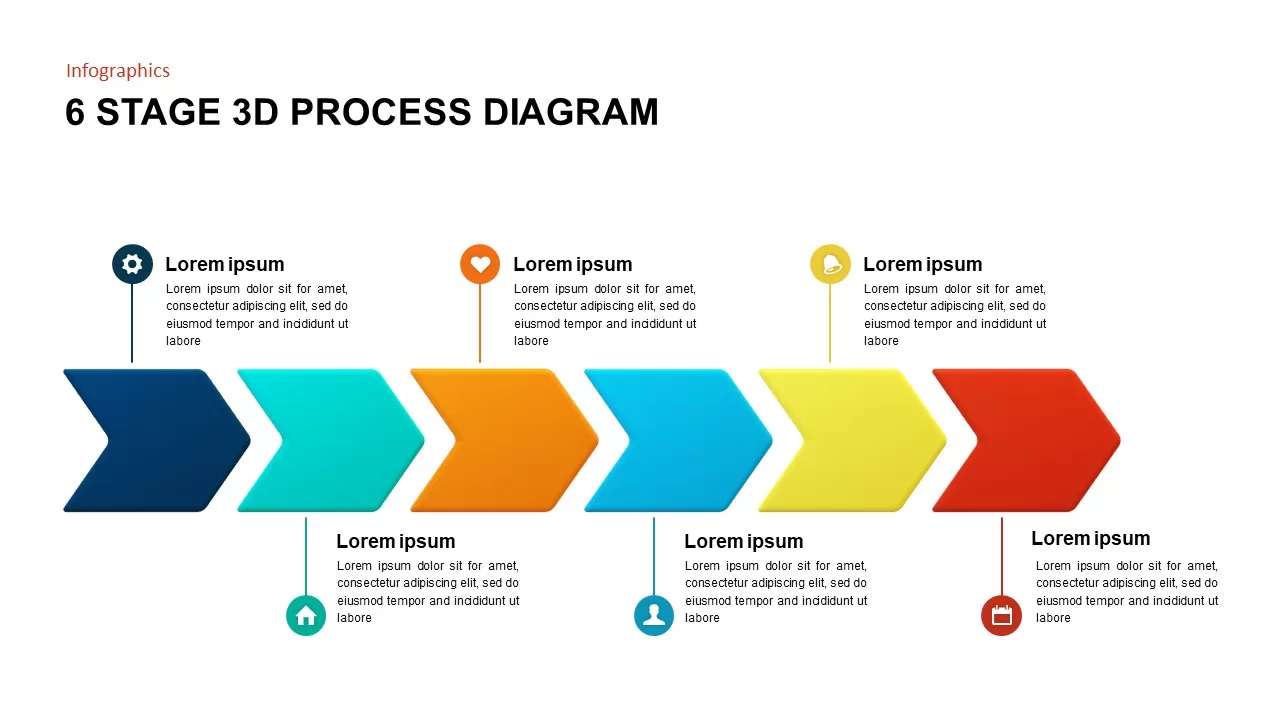
Animated Six-Stage 3D Process Diagram Template for PowerPoint & Google Slides
Arrow
Six-Piece Puzzle Diagram Template for PowerPoint & Google Slides
Process
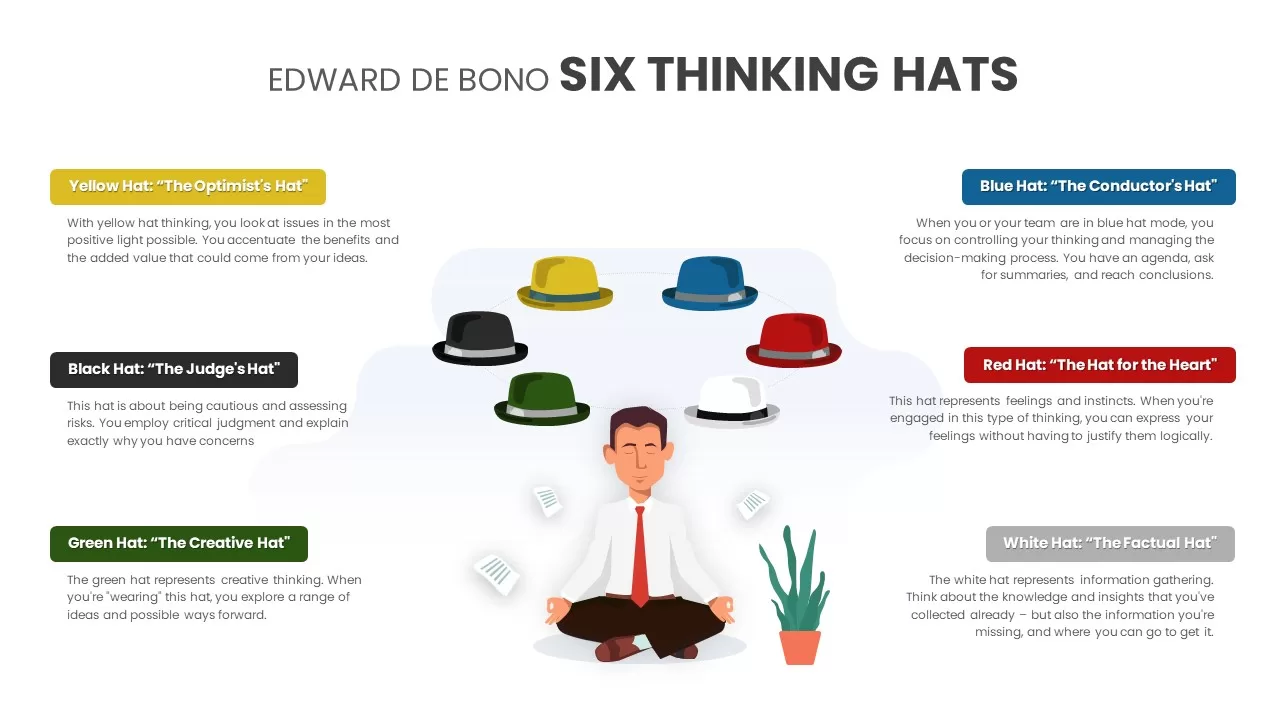
Six Thinking Hats Diagram Presentation Template for PowerPoint & Google Slides
Infographics
Six-Step Business Analysis Diagram template for PowerPoint & Google Slides
Circular
Six-Step Colorful Flywheel Diagram Template for PowerPoint & Google Slides
Circular
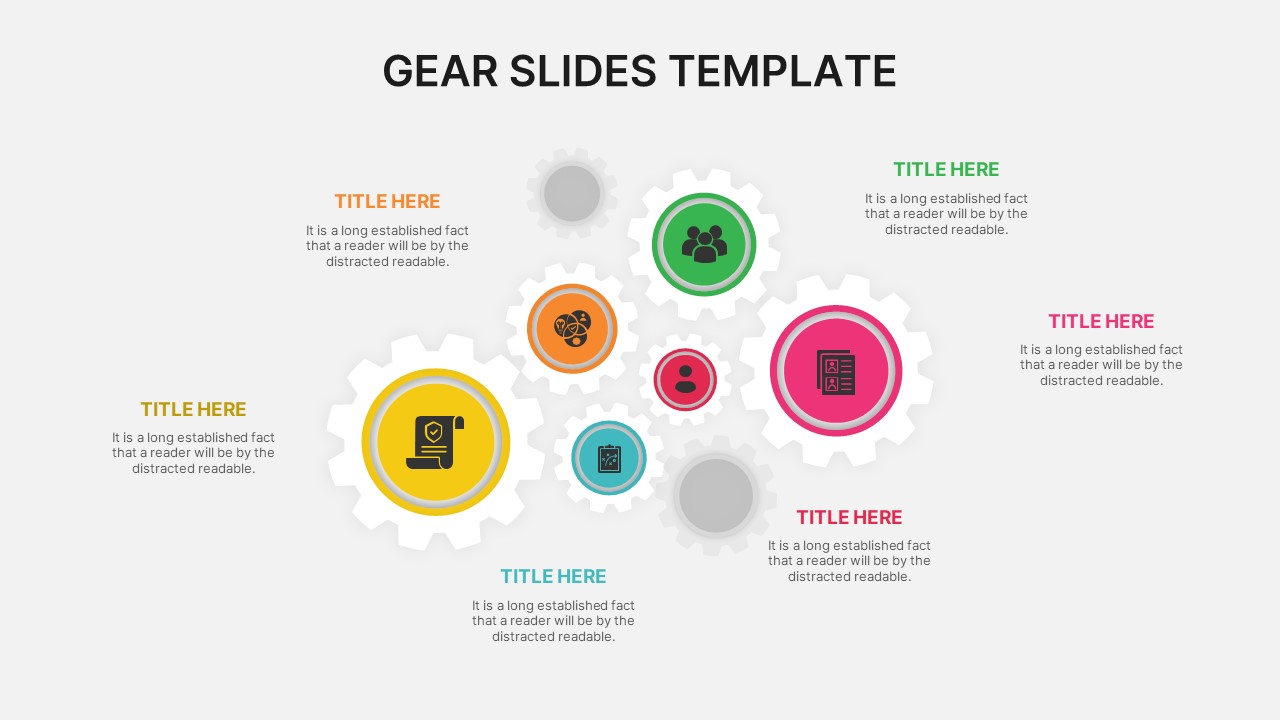
Six-Option Gear Diagram Slide Template for PowerPoint & Google Slides
Circular
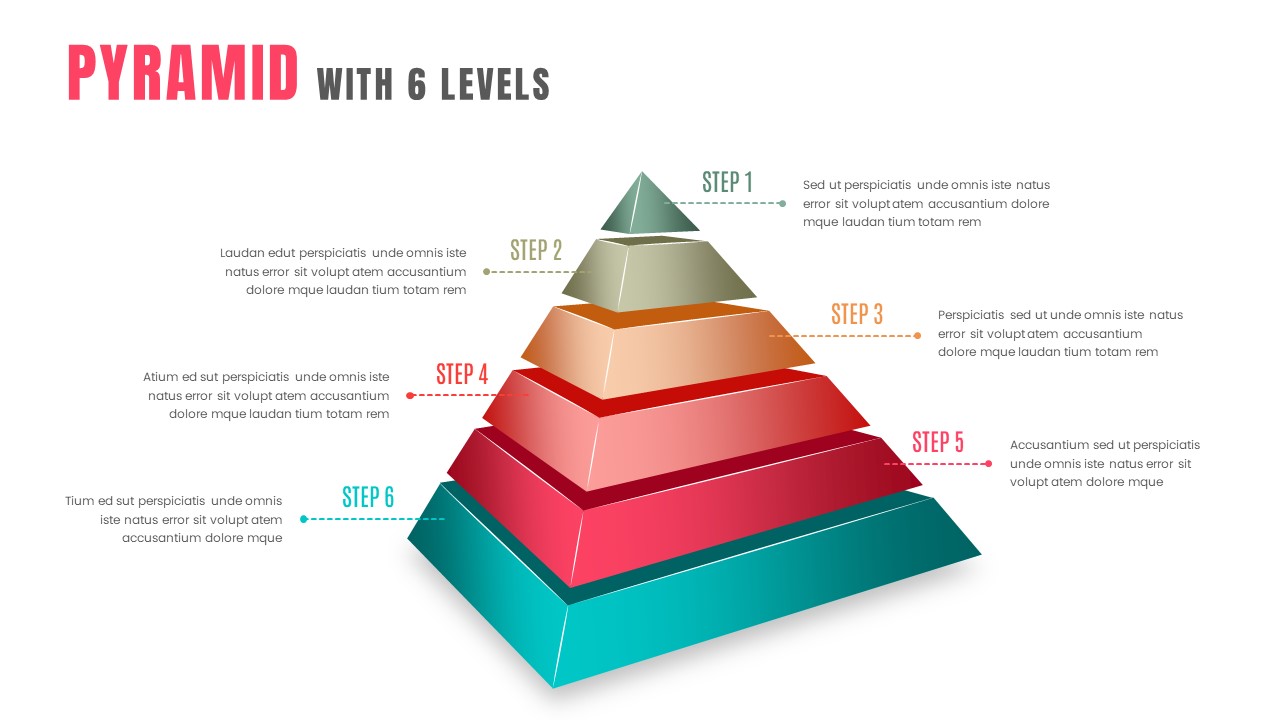
3D Six-Level Pyramid Diagram Infographic Template for PowerPoint & Google Slides
Pyramid
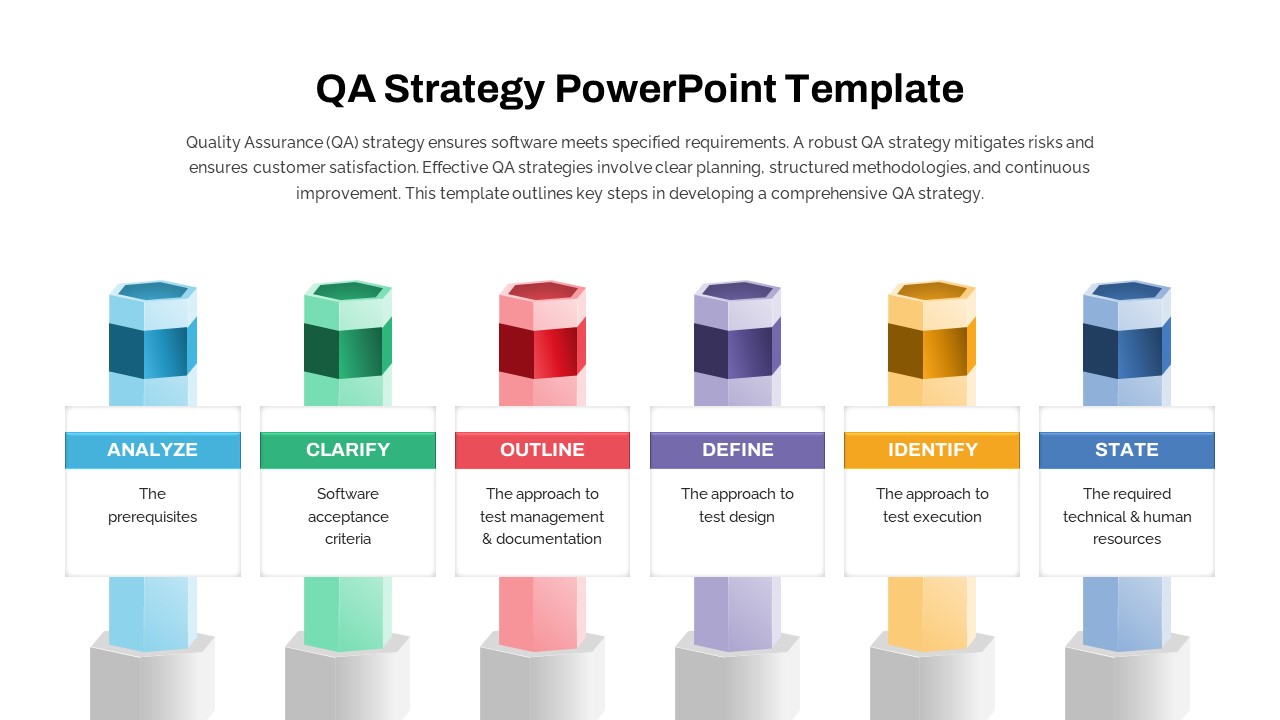
Six-Step QA Strategy Pillar Diagram Template for PowerPoint & Google Slides
Software Development
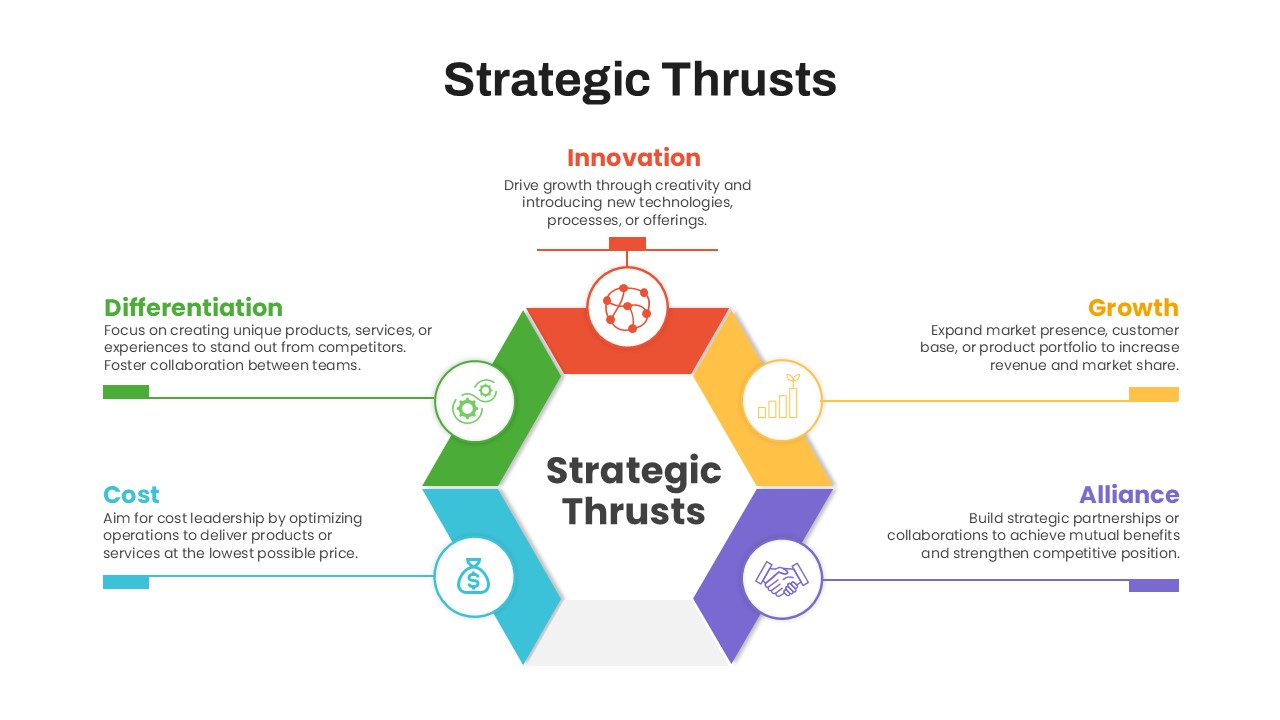
Six-Step Strategic Thrusts Diagram Slide Template for PowerPoint & Google Slides
Process
Key Findings Six-Step Diagram Template for PowerPoint & Google Slides
Business Report