Monthly Business Review Dashboard Deck Template for PowerPoint & Google Slides


12 slides. Each one handles a different part of a monthly business review. Here’s what you’re actually getting:
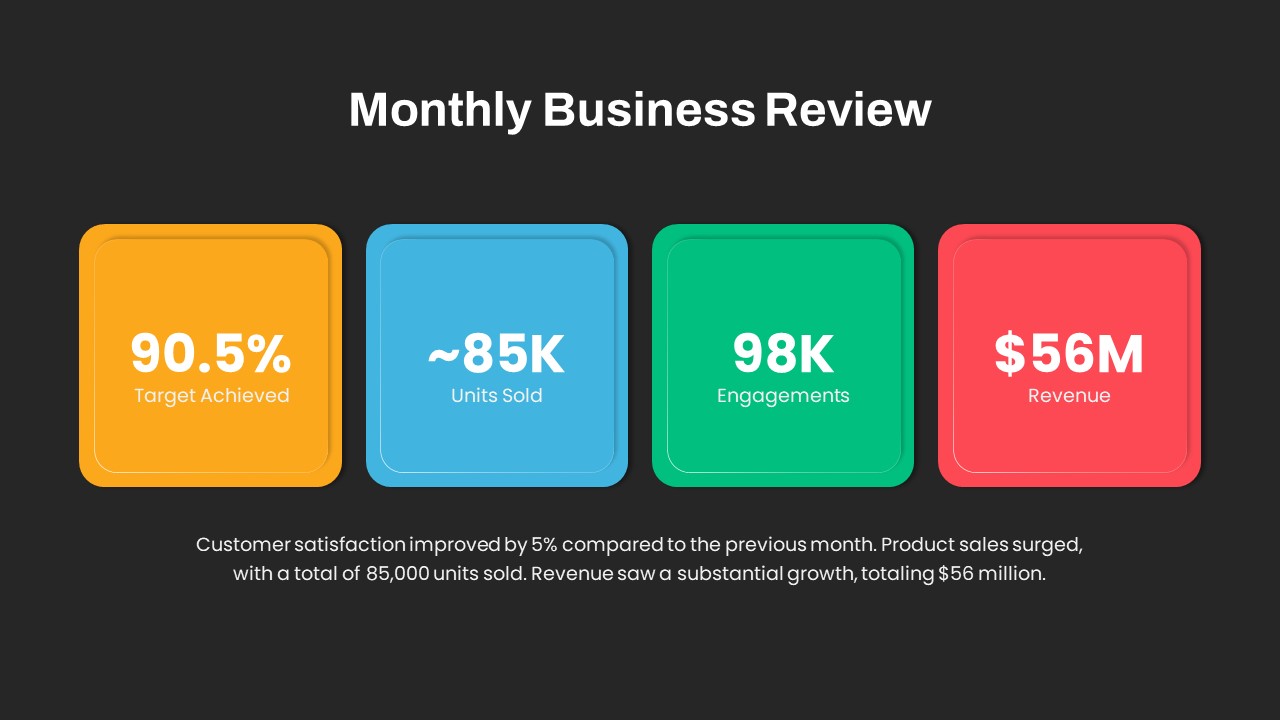
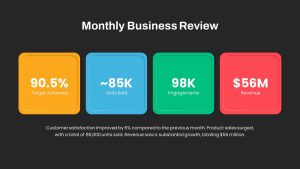
KPI summary slide with four colored metric cards (yellow, blue, green, red) showing target achievement percentage, units sold, engagements, and revenue. The default values are 90.5%, ~85K, 98K, and $56M. A summary paragraph below explains the month-over-month changes. This is your opening slide, the one that answers “how did we do this month” before anyone asks.
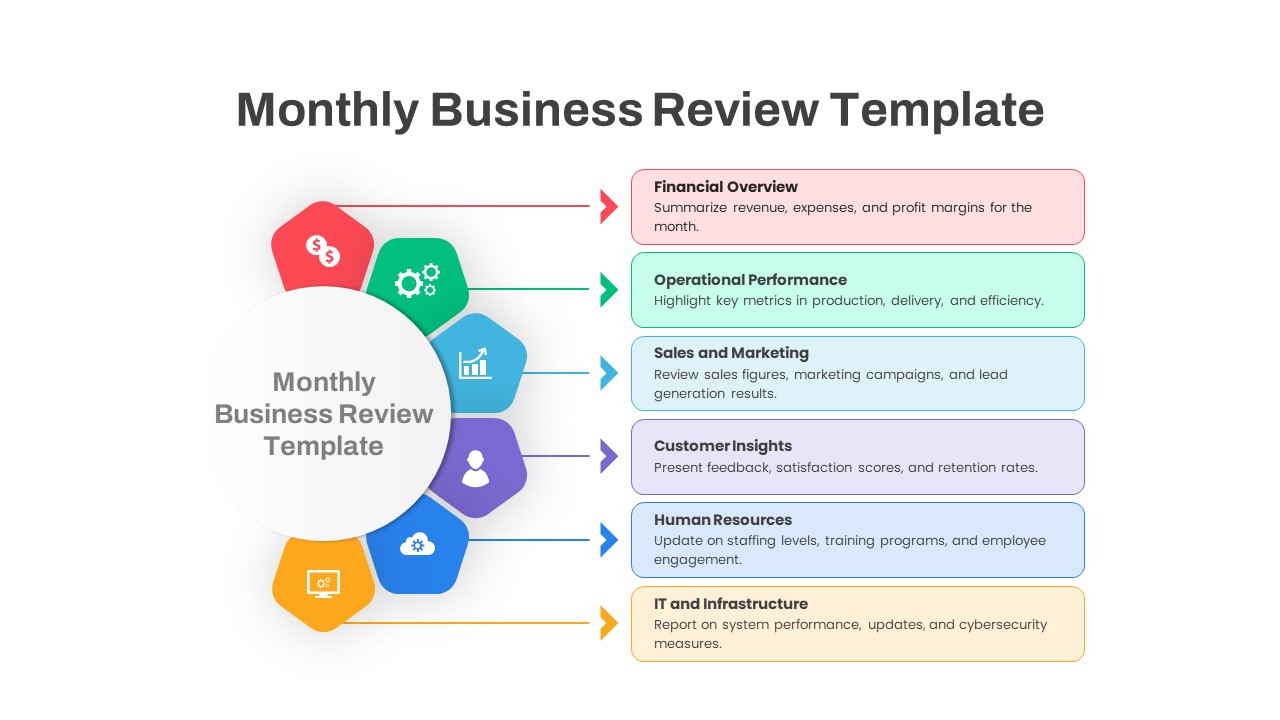
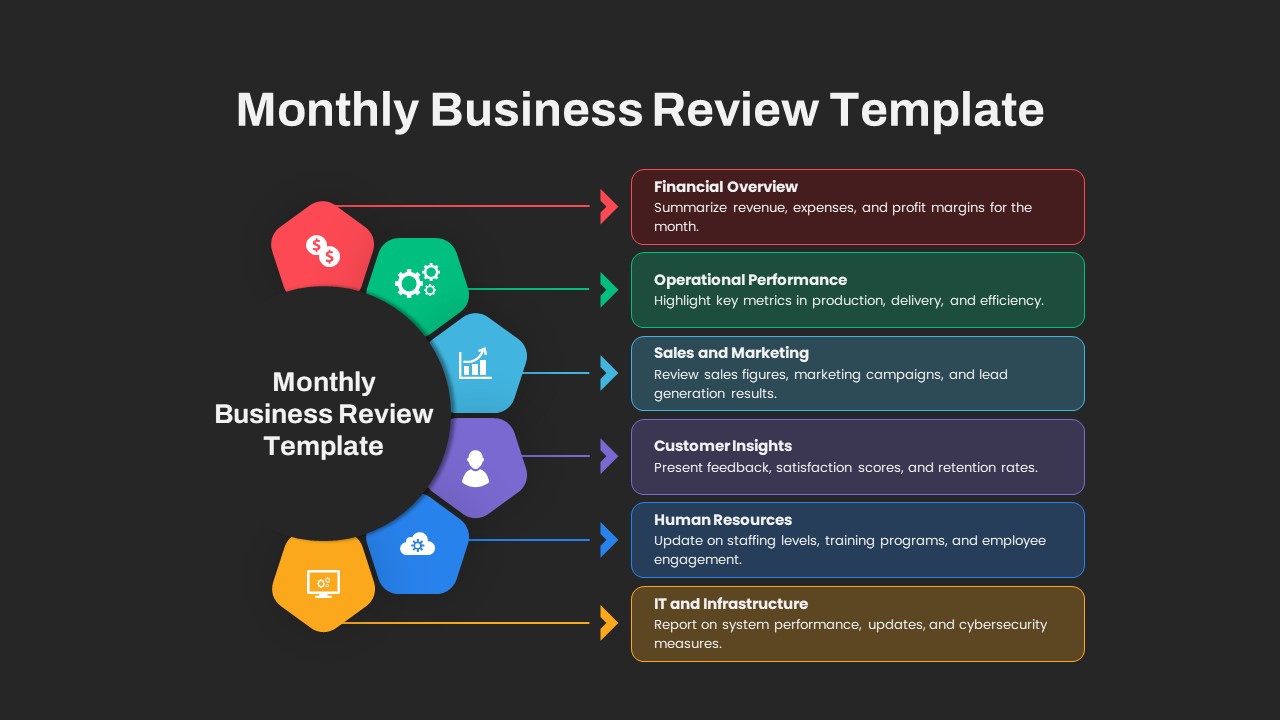
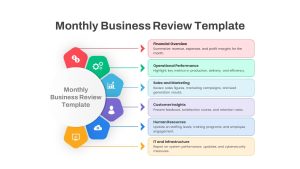
Agenda/section overview using a hub-and-spoke layout with six branches: Financial Overview, Operational Performance, Sales & Marketing, Customer Insights, Human Resources, and IT & Infrastructure. Each branch has an icon and a one-line description. Useful if your MBR covers multiple departments and you need a roadmap slide at the start.
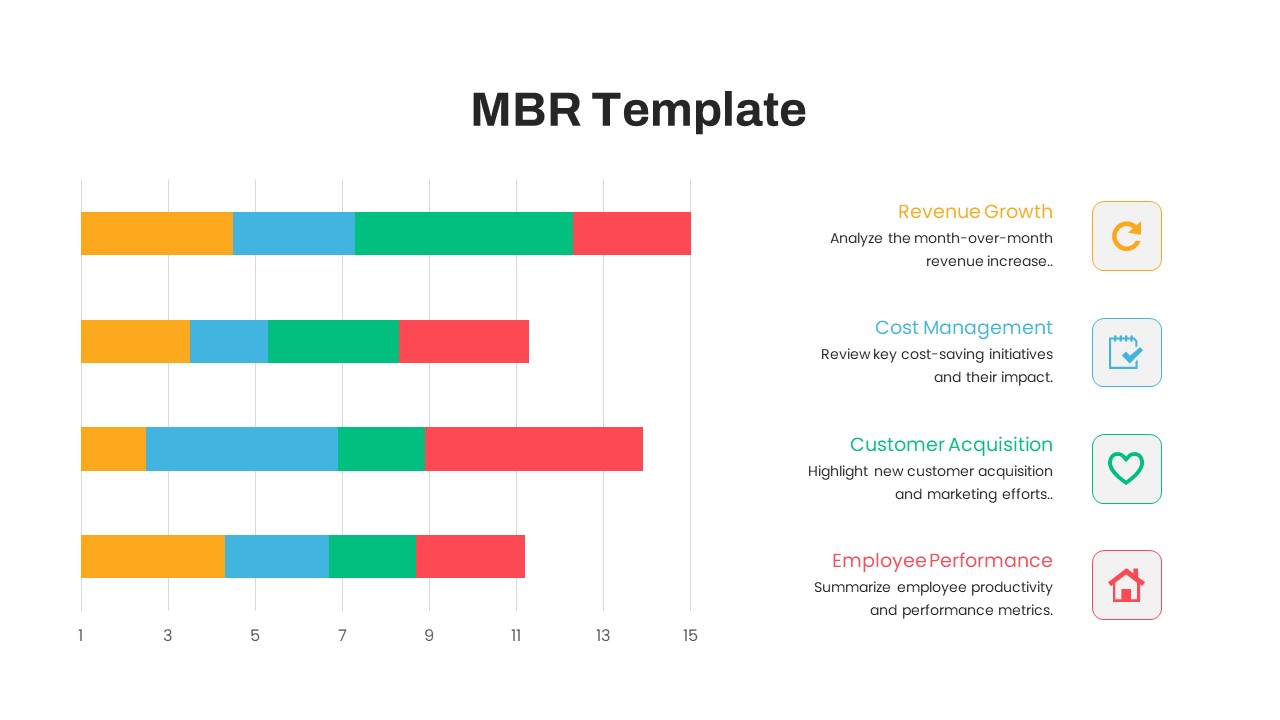
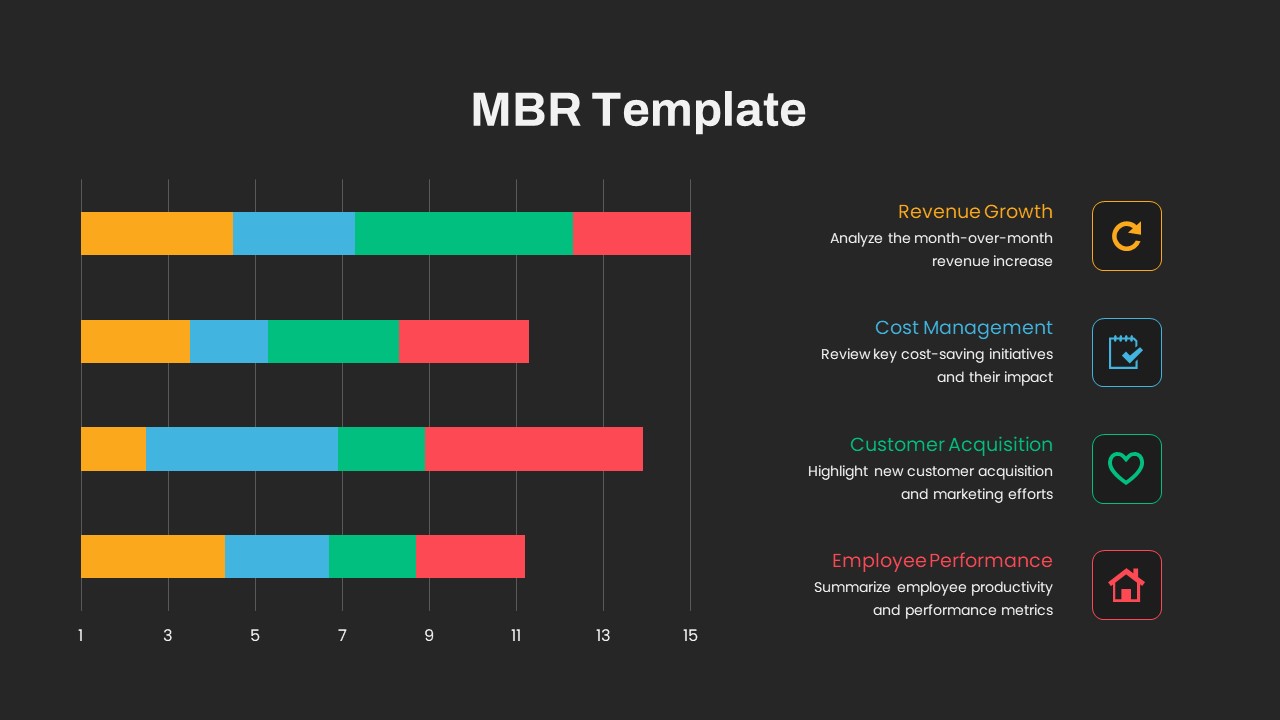
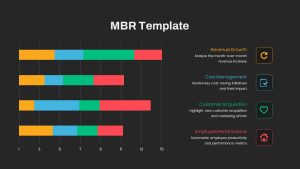
Segmented horizontal bar chart comparing four categories: Revenue Growth, Cost Management, Customer Acquisition, and Employee Performance. Each bar is broken into four color segments so you can show sub-metrics within each category.
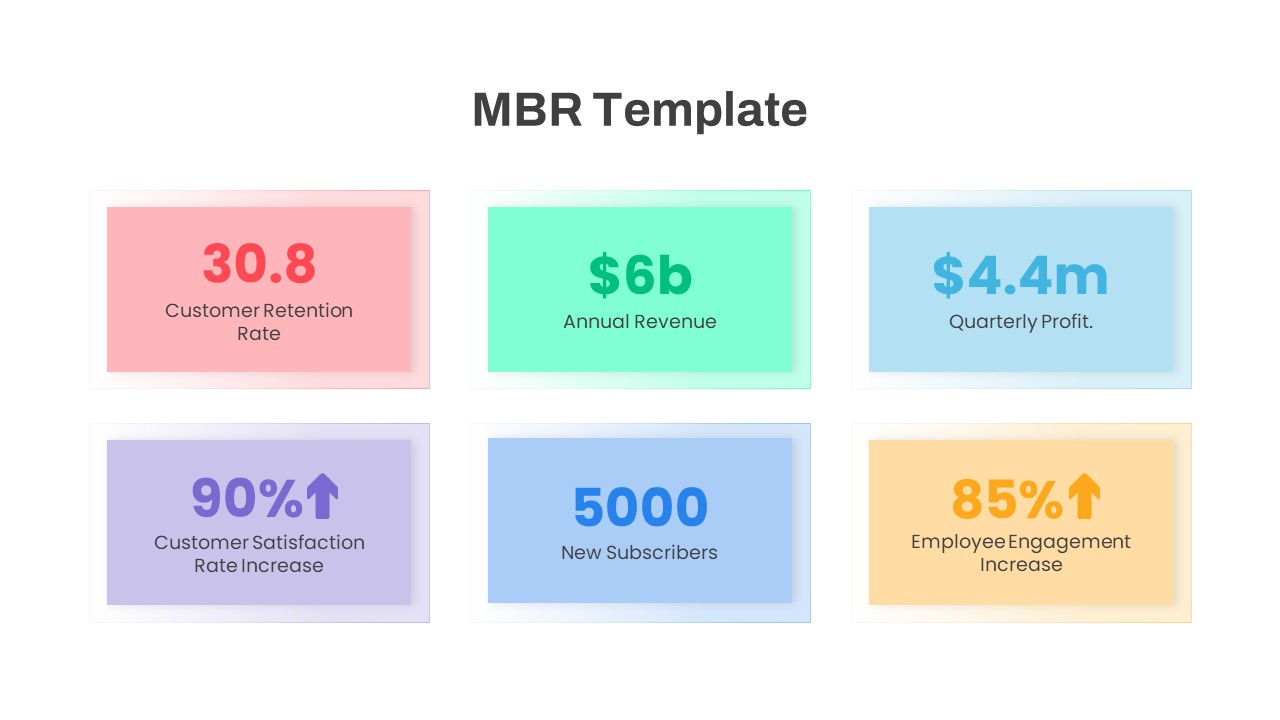
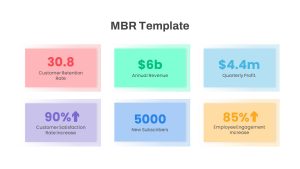
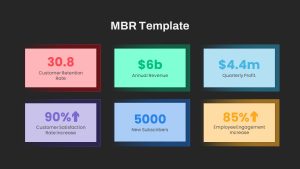
KPI cards slide with six colored tiles in a 3×2 grid. The defaults are Customer Retention Rate (30.8), Annual Revenue ($6b), Quarterly Profit ($4.4m), Customer Satisfaction Increase (90% up), New Subscribers (5000), and Employee Engagement Increase (85% up). Replace the numbers with your actuals.
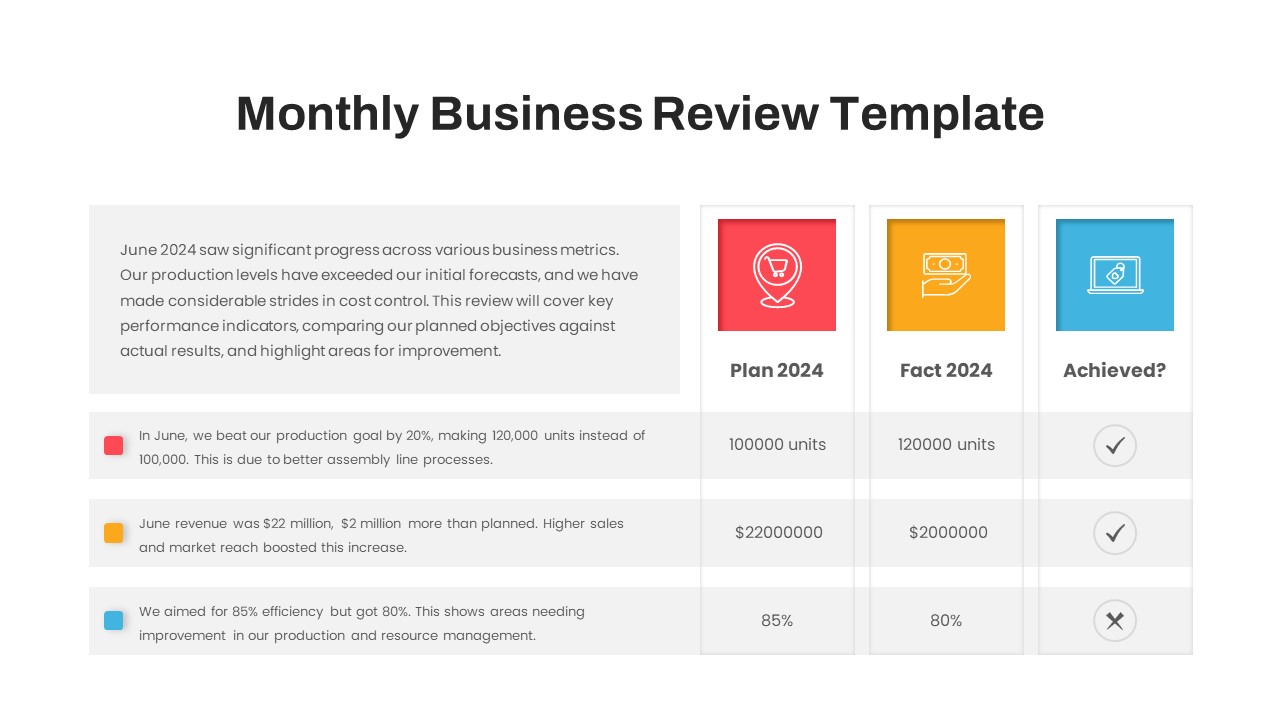
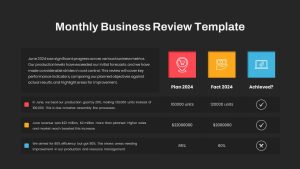
Plan vs Actual table with three columns: Plan 2024, Fact 2024, and Achieved (check or cross icon). Three rows for different objectives with descriptions, planned figures, and actual figures side by side. This is the slide that shows where you hit the target and where you didn’t.
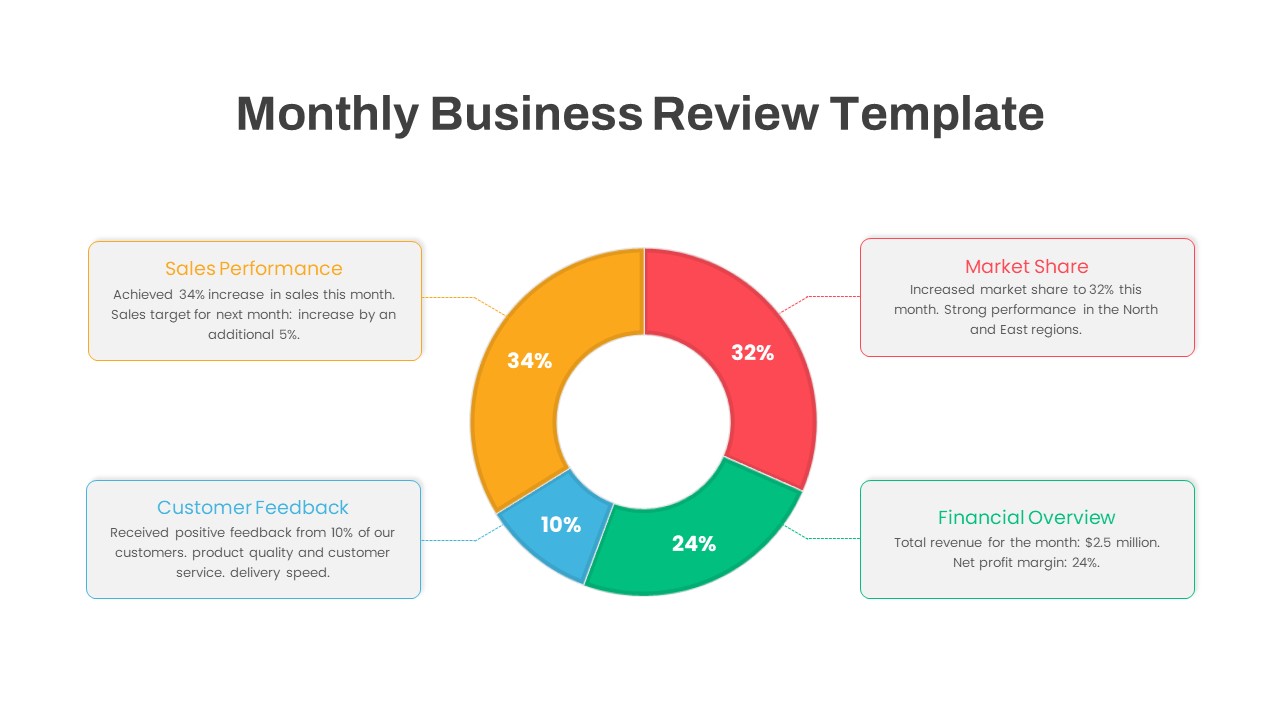
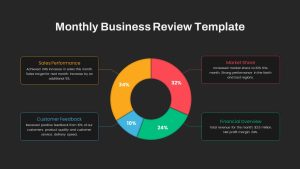
Donut chart split into four segments: Sales Performance (34%), Market Share (32%), Financial Overview (24%), Customer Feedback (10%). Each segment has a callout box with a title and short description around the chart.
All slides come in light and dark versions. 16:9 and 4:3. Editable in PowerPoint and Google Slides.
Running a Monthly Business Review with This Deck
The typical MBR meeting follows a pattern: open with the numbers, walk through each department, compare plan vs actual, then discuss what needs to change next month. This deck is structured around that exact flow.
Start with the KPI summary to set context. Use the hub-and-spoke agenda to outline what the review will cover. Move into the bar charts and KPI cards for department-level data. Hit the plan vs actual table for accountability. Close with the donut chart for a high-level snapshot.
Operations managers running these meetings every month will save a few hours per cycle just by having the structure ready. Swap in your real numbers from whatever reporting tool you use, update the text, and the deck is ready for the meeting.
Login to download this file

Item ID
SB04320
Related Templates

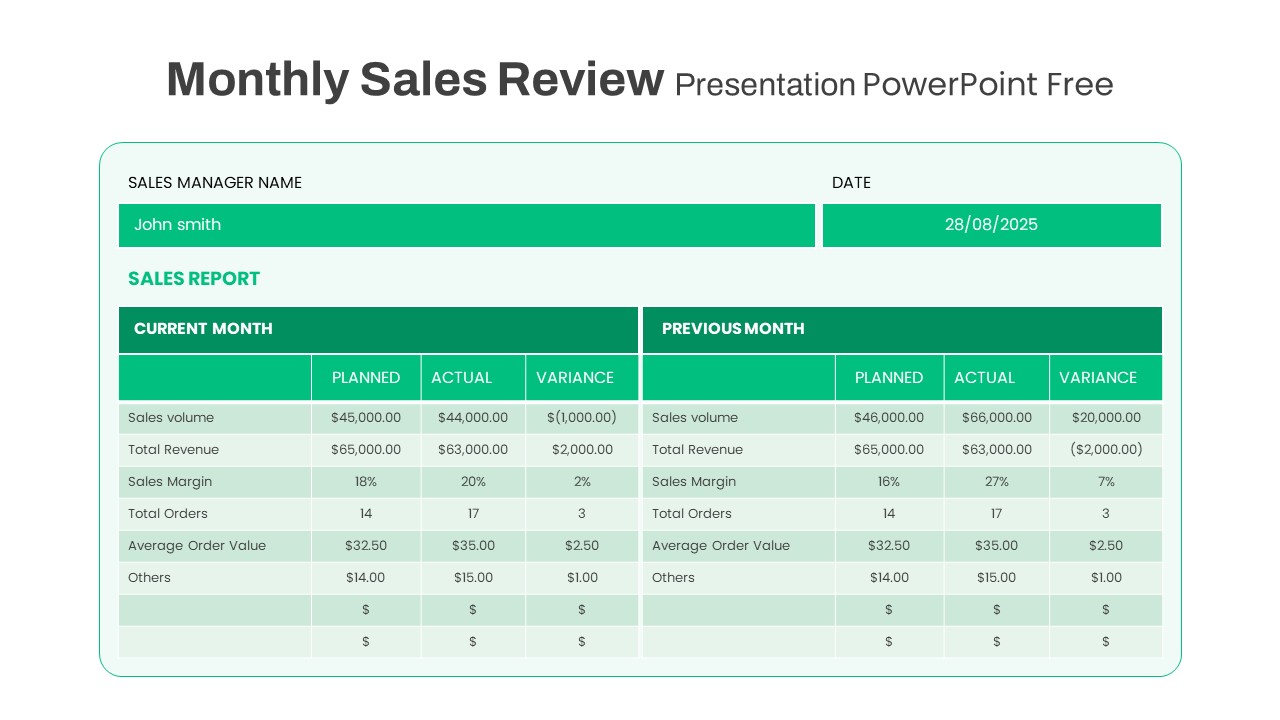
Free Monthly Sales Review template for PowerPoint & Google Slides
Business Report
Free
Monthly Sales Performance Dashboard Template for PowerPoint & Google Slides
Charts
Free Quarterly Business Review Dashboard Template for PowerPoint & Google Slides
Business
Free
Quarterly Business Review Dashboard Template for PowerPoint & Google Slides
Pitch Deck
End of Year Review Dashboard Template for PowerPoint & Google Slides
Business Report
Business Review Deck with Market Updates Template for PowerPoint & Google Slides
Company Profile
Free Monthly Report PowerPoint Template for PowerPoint & Google Slides
Business Report
Free

Monthly Reports Bar Chart template for PowerPoint & Google Slides
Bar/Column
Monthly Calendar Infographic Scheduling Template for PowerPoint & Google Slides
Agenda

2023 Calendar Monthly Overview template for PowerPoint & Google Slides
Business
Monthly Recurring Revenue KPI Bar Chart Template for PowerPoint & Google Slides
Bar/Column
Editable Monthly Timeline Infographic Template for PowerPoint & Google Slides
Timeline
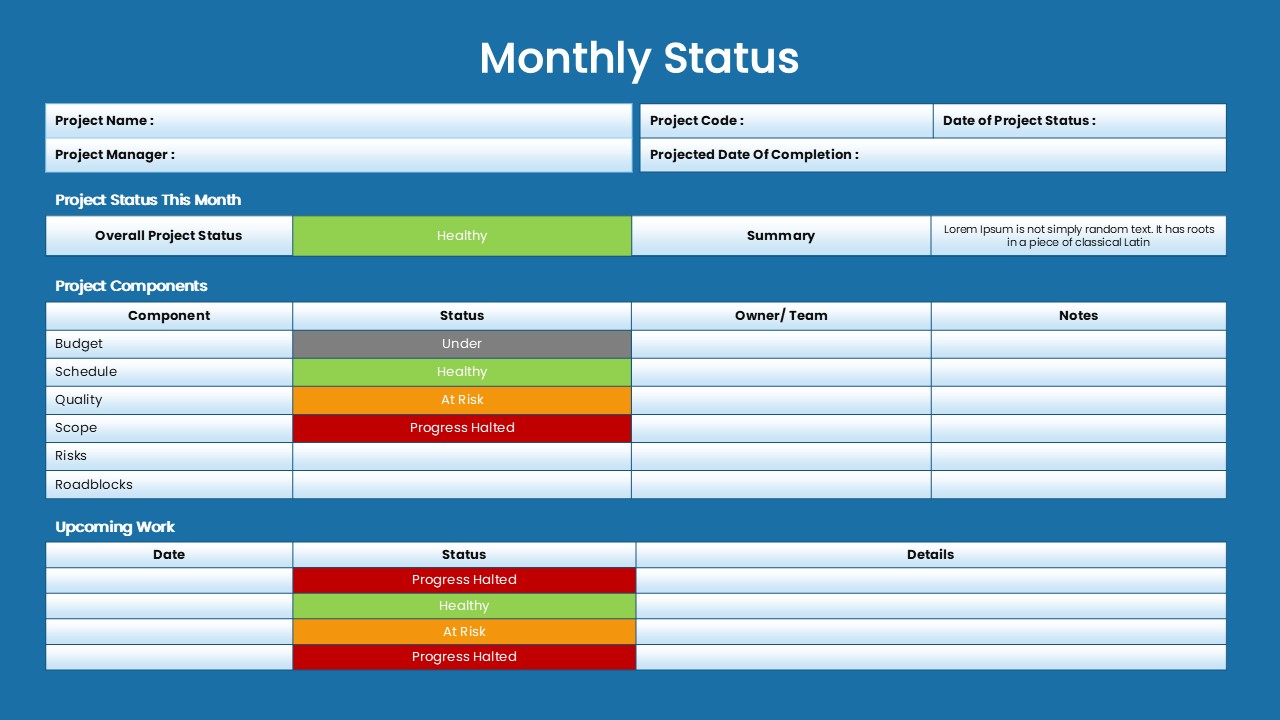
Monthly Status Report Template for PowerPoint & Google Slides
Project Status
Redesigned Monthly Calendar Event Infographic for PowerPoint & Google Slides
Agenda
Annual Business Review Timeline Template for PowerPoint & Google Slides
Timeline
Free Business Review Comparison Slide for PowerPoint & Google Slides
Business Report
Free
Business Dashboard Analytics & KPIs Template for PowerPoint & Google Slides
Bar/Column
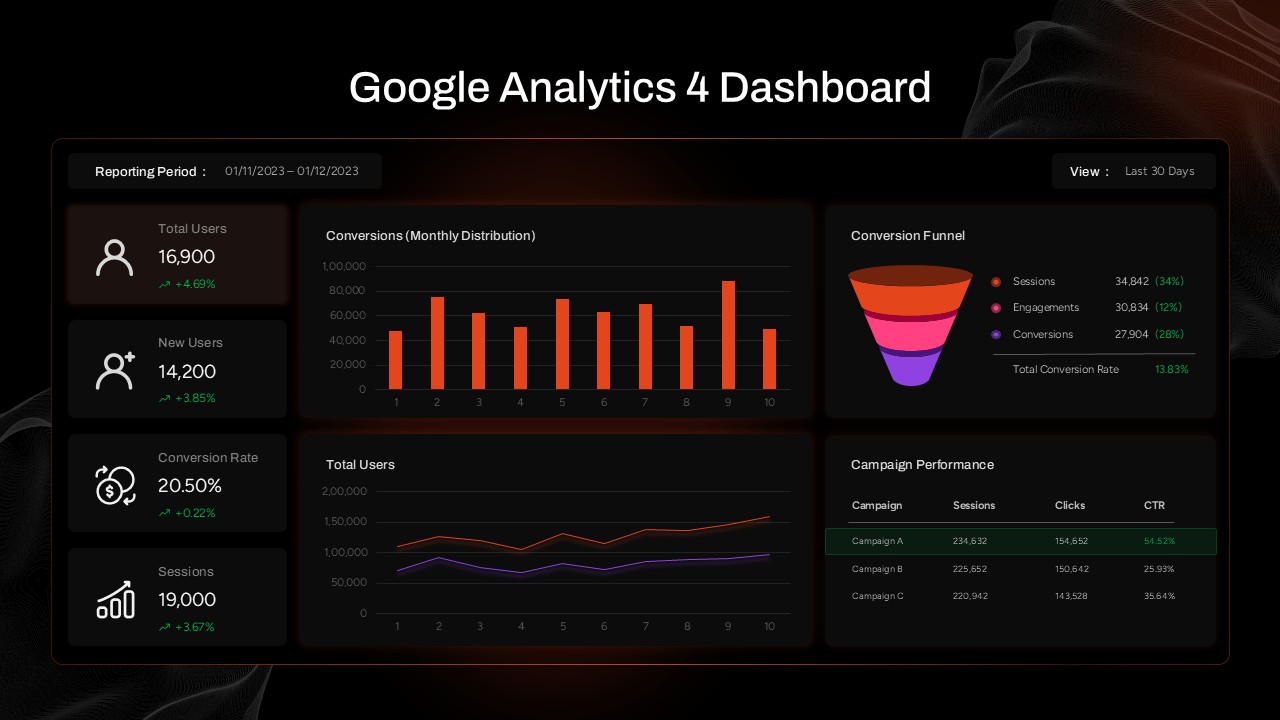
Google Analytics 4 (GA4) Dashboard Template for PowerPoint & Google Slides
Digital Marketing
Financial Review template for PowerPoint & Google Slides
Finance
Clean Four-Section Review Diagram Template for PowerPoint & Google Slides
Agenda
Performance Review Process Management Cycle template for PowerPoint & Google Slides
Employee Performance
Performance Review Process Steps Template for PowerPoint & Google Slides
Employee Performance
Performance Review Progress Management Template for PowerPoint & Google Slides
Process
Professional Book Review Infographic Template for PowerPoint & Google Slides
Business
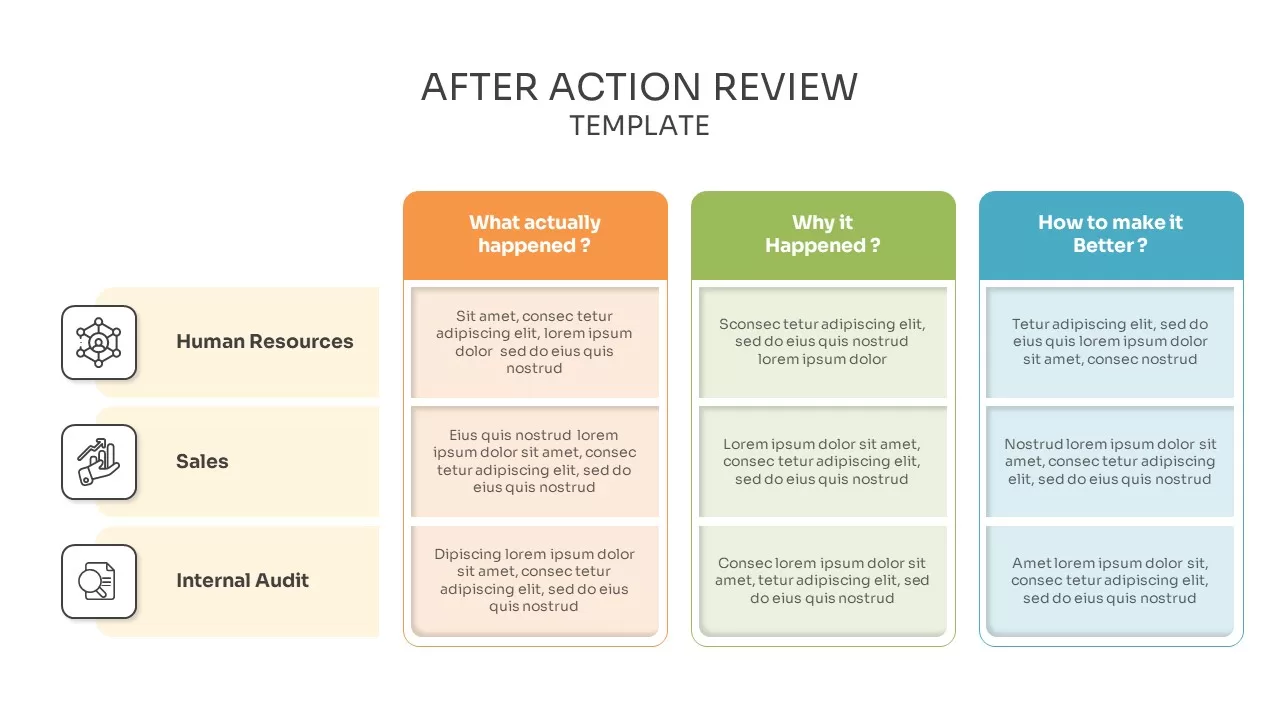
After Action Review Infographic Template for PowerPoint & Google Slides
Process
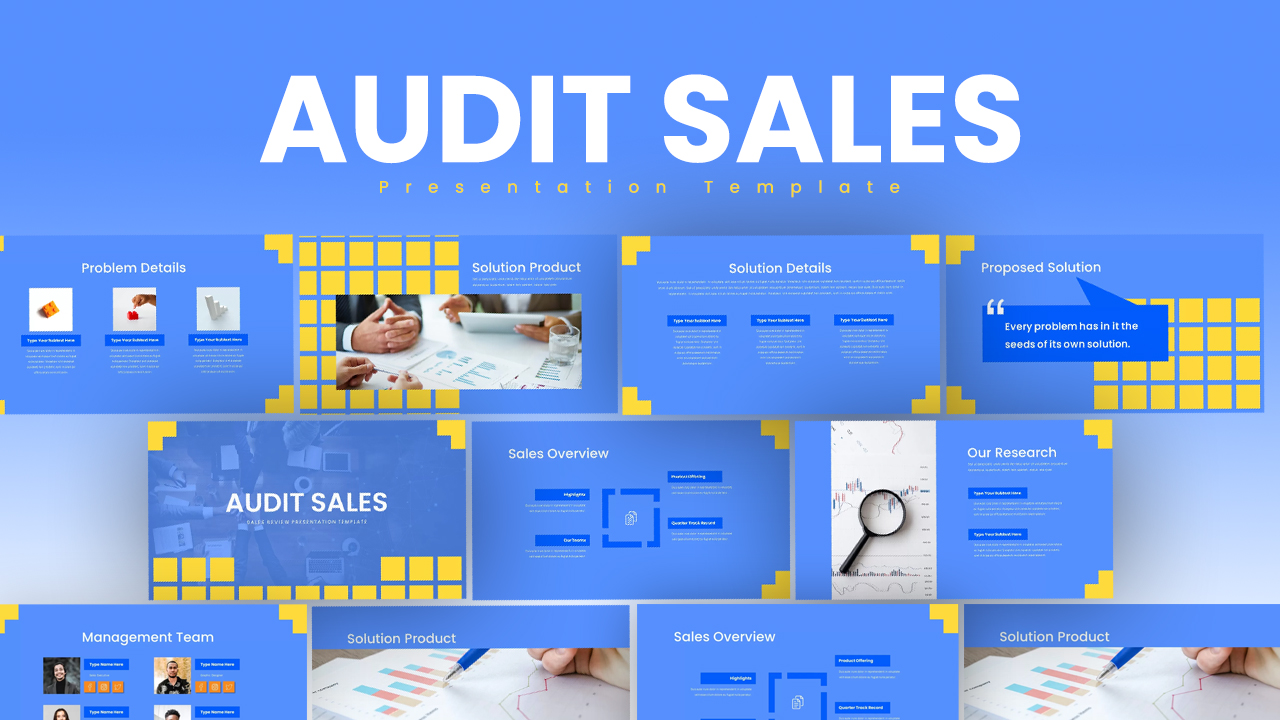
Audit Sales Review Presentation Template for PowerPoint & Google Slides
Decks
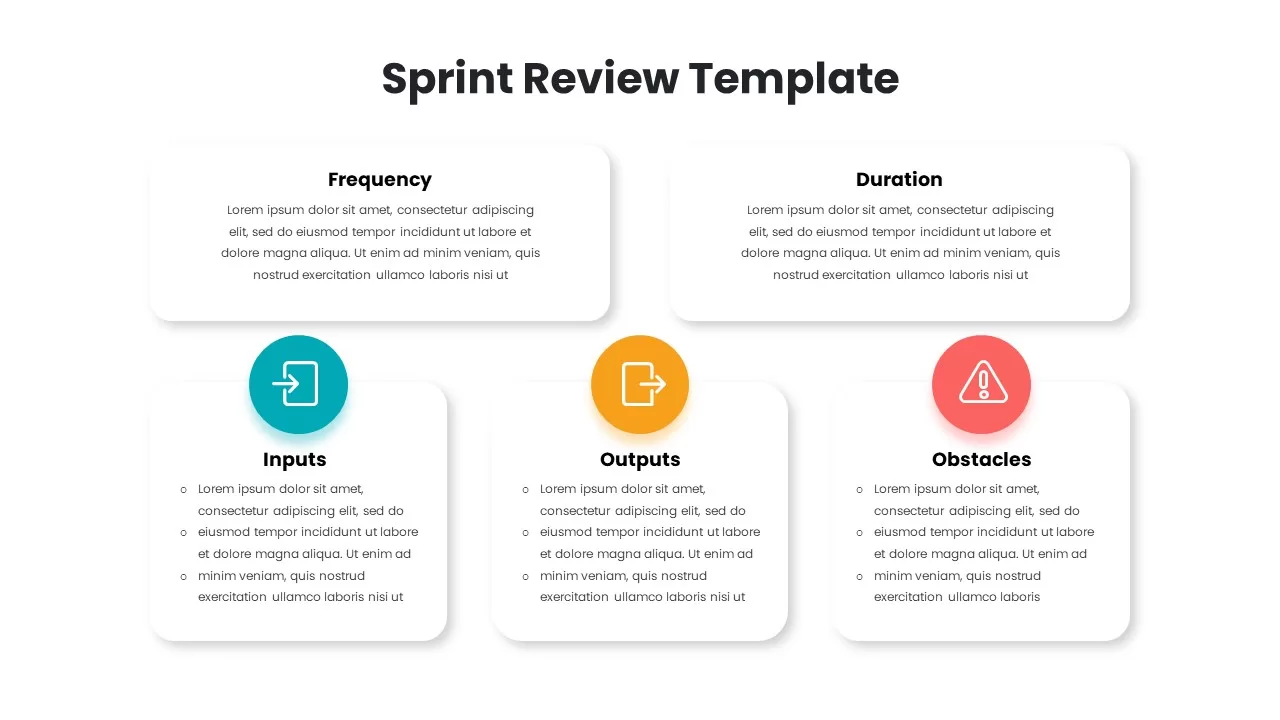
Sprint Review Process Infographics Pack Template for PowerPoint & Google Slides
Infographics
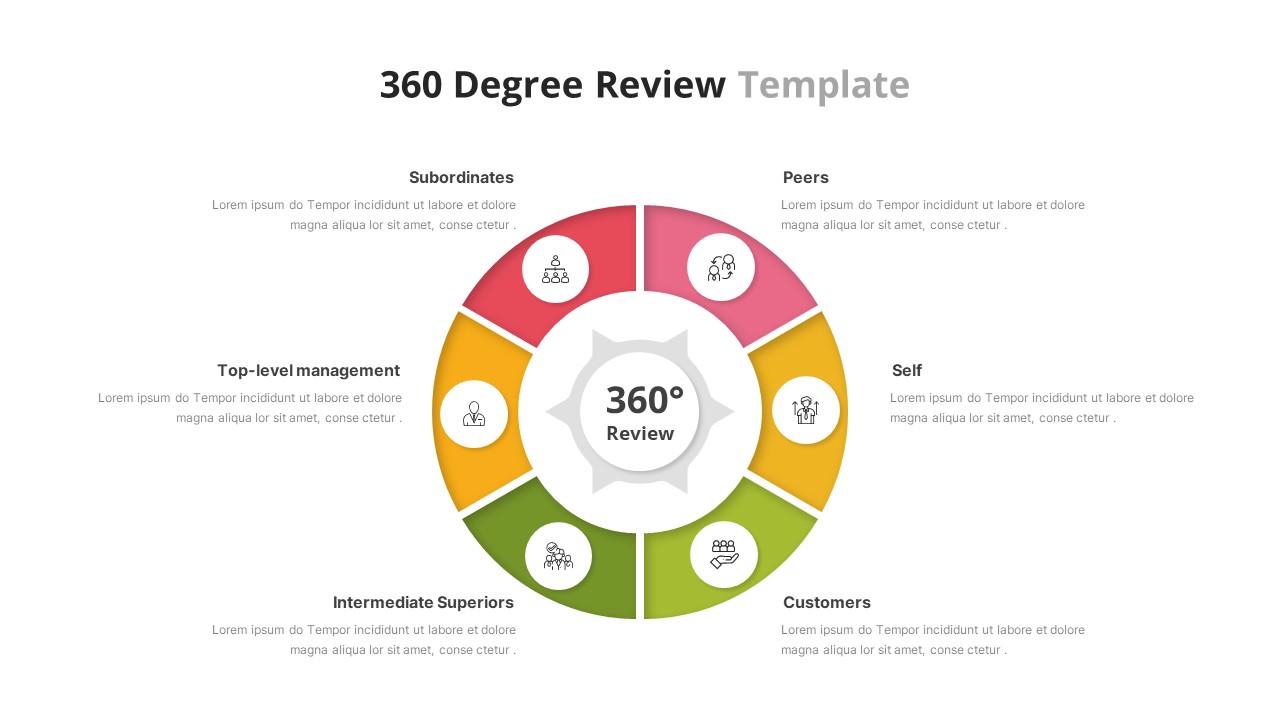
360 Degree Review Template for PowerPoint & Google Slides
Employee Performance
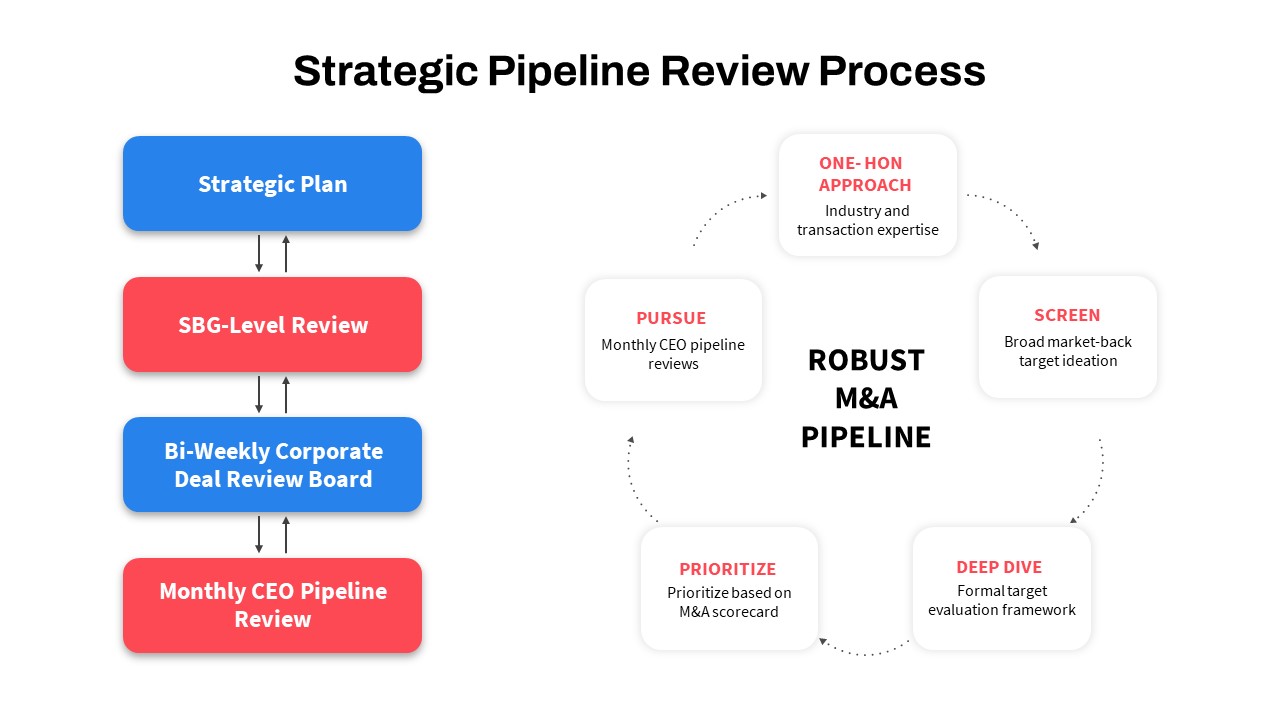
Strategic Pipeline Review Diagram Template for PowerPoint & Google Slides
Business Strategy
Quarterly Sales Review Bar Chart Template for PowerPoint & Google Slides
Bar/Column
Performance Review template for PowerPoint & Google Slides
Employee Performance
Sprint Review Meeting Agenda Table Template for PowerPoint & Google Slides
Agenda
Free Stylized Book Review Layout for PowerPoint & Google Slides
Company Profile
Free
Year in Review KPI Highlights Slide for PowerPoint & Google Slides
Business Report
Plan Do Review (PDR) for PowerPoint & Google Slides
Process
Free KPI Dashboard PowerPoint Template for PowerPoint & Google Slides
Charts
Free

Dynamic Data Dashboard Infographic Template for PowerPoint & Google Slides
Bar/Column
Product Usage Analytics Dashboard Chart Template for PowerPoint & Google Slides
Bar/Column
Data Analytics Dashboard Design template for PowerPoint & Google Slides
Bar/Column

Efficiency KPI Dashboard Metaphor Template for PowerPoint & Google Slides
Infographics

Professional Team Efficiency Dashboard Template for PowerPoint & Google Slides
Business Report
Project Management Dashboard Template for PowerPoint & Google Slides
Project
Website Performance Dashboard template for PowerPoint & Google Slides
Charts
Sales Performance Dashboard template for PowerPoint & Google Slides
Business Report
Immigration Data Dashboard Template for PowerPoint & Google Slides
Bar/Column
Employee Skill Analysis Dashboard Template for PowerPoint & Google Slides
Employee Performance
Sales Growth Dashboard: KPI Gauge & Line Template for PowerPoint & Google Slides
Revenue
Social Media Performance Dashboard Template for PowerPoint & Google Slides
Bar/Column
Net Promoter Score Dashboard Template for PowerPoint & Google Slides
Customer Experience
Performance KPI Dashboard Slide Template for PowerPoint & Google Slides
Business Report
Bull and Bear Stock Market Dashboard Template for PowerPoint & Google Slides
Infographics
KPI Dashboard template for PowerPoint & Google Slides
Business Report
KPI Dashboard Overview template for PowerPoint & Google Slides
Finance
KPI Dashboard Data Overview Slide Template for PowerPoint & Google Slides
Bar/Column
Professional Nurse Infographic Dashboard Template for PowerPoint & Google Slides
Nursing
Interactive Benchmarking Gauge Dashboard Template for PowerPoint & Google Slides
Pie/Donut
Heat Map Risk Matrix Dashboard Template for PowerPoint & Google Slides
Comparison Chart
Project Status Dashboard with Metrics Template for PowerPoint & Google Slides
Project Status
Colorful Project Status Dashboard Template for PowerPoint & Google Slides
Project Status
Weekly Update Schedule Dashboard Template for PowerPoint & Google Slides
Agenda
Project Status Dashboard Template for PowerPoint & Google Slides
Project Status
Weekly Status Report Dashboard Template for PowerPoint & Google Slides
HR
Free Metro UI Dashboard Infographic Template for PowerPoint & Google Slides
Business Report
Free
Website Performance Monitoring Dashboard Template for PowerPoint & Google Slides
Business Report
One Pager Project Status Dashboard Template for PowerPoint & Google Slides
Project Status
One Pager Annual Report Dashboard Template for PowerPoint & Google Slides
Business Report
Social Media Analytics Dashboard Template for PowerPoint & Google Slides
Digital Marketing
Social Media Statistics 2023 Dashboard Template for PowerPoint & Google Slides
Comparison
Mastodon Metrics Infographic Dashboard Template for PowerPoint & Google Slides
Business Report
Soccer Match Stats Dashboard Slide Template for PowerPoint & Google Slides
Graphics
Employee Satisfaction Survey Dashboard Template for PowerPoint & Google Slides
Employee Performance
Customer Satisfaction KPI Dashboard Template for PowerPoint & Google Slides
Customer Experience
Weekly Project Status Dashboard Template for PowerPoint & Google Slides
Project Status
Freight Logistics Dashboard Infographic Template for PowerPoint & Google Slides
Comparison Chart
Cost Cutting Savings Dashboard Template for PowerPoint & Google Slides
Pie/Donut
Macroeconomic Indicators Dashboard Template for PowerPoint & Google Slides
PEST
Michigan County Map with KPI Dashboard Template for PowerPoint & Google Slides
World Maps
Quarterly Financial Summary Dashboard Template for PowerPoint & Google Slides
Business Report
Banking Financial Overview Dashboard Template for PowerPoint & Google Slides
Finance
DevOps KPI Dashboard Performance Metrics Template for PowerPoint & Google Slides
Software Development
Purchasing KPI Metrics Dashboard Template for PowerPoint & Google Slides
Business Report
Inventory Management Dashboard Template for PowerPoint & Google Slides
Process
Digital Marketing KPIs Dashboard Dark Template for PowerPoint & Google Slides
Business Report
Employee Performance Metrics Dashboard Template for PowerPoint & Google Slides
Employee Performance
Turnover Analysis Dashboard Template for PowerPoint & Google Slides
Employee Performance
Project Tracking Dashboard Table Template for PowerPoint & Google Slides
Project Status
Electronic Health Records Dashboard template for PowerPoint & Google Slides
Health
Customer Interview Insights Dashboard Template for PowerPoint & Google Slides
Customer Experience
Account Overview Dashboard template for PowerPoint & Google Slides
Business
Project Status Dashboard Report Template for PowerPoint & Google Slides
Project Status
Project Status Update Dashboard Table Template for PowerPoint & Google Slides
Project Status
Cohort Analysis Retention Dashboard Template for PowerPoint & Google Slides
Comparison Chart
Project Status Dashboard Template for PowerPoint & Google Slides
Project Status
Dashboard Project Status Template for PowerPoint & Google Slides
Project Status
Project Status Template Dashboard with Gauge for PowerPoint & Google Slides
Project Status
Project Status Dashboard with RAG Legend Template for PowerPoint & Google Slides
Project Status
Construction Project Dashboard Template for PowerPoint & Google Slides
Project
Employee Headcount Dashboard Report Template for PowerPoint & Google Slides
Employee Performance
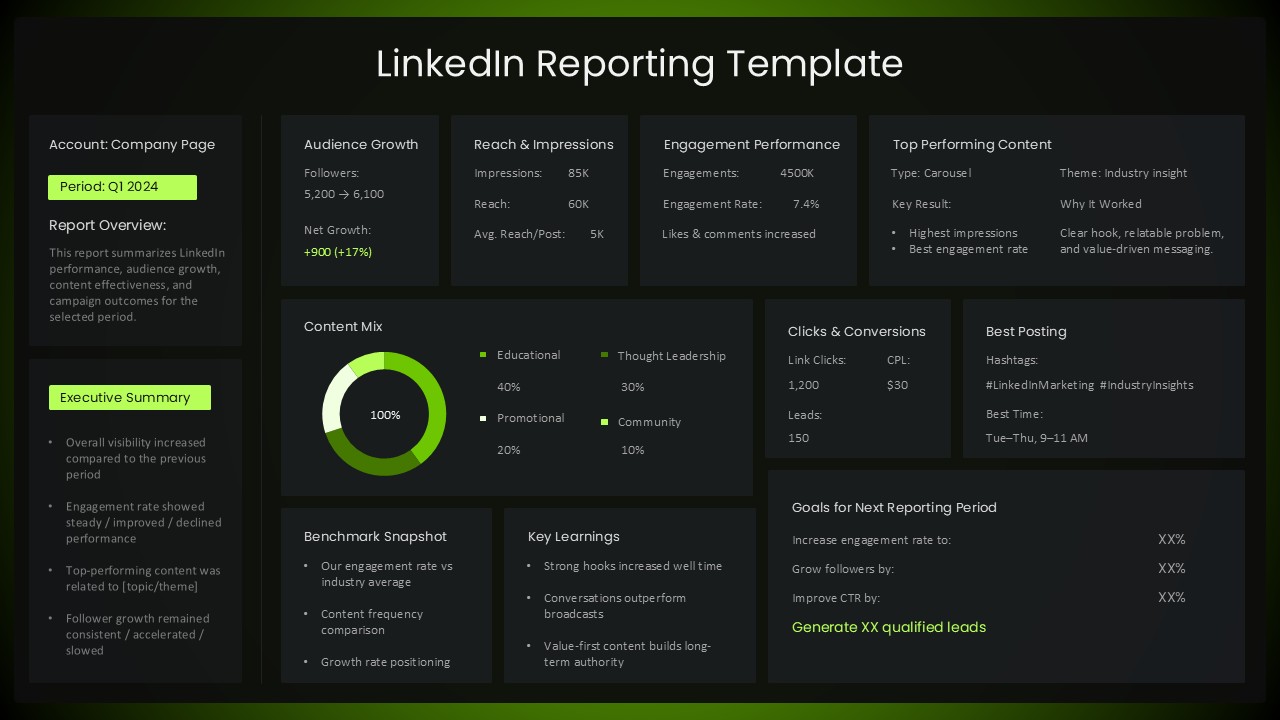
LinkedIn Performance Reporting Dashboard Template for PowerPoint & Google Slides
Digital Marketing
4DX Scoreboard KPI Gauge Dashboard Template for PowerPoint & Google Slides
Business Strategy