Liquidity Ratios Infographic Slide Template for PowerPoint & Google Slides


Description
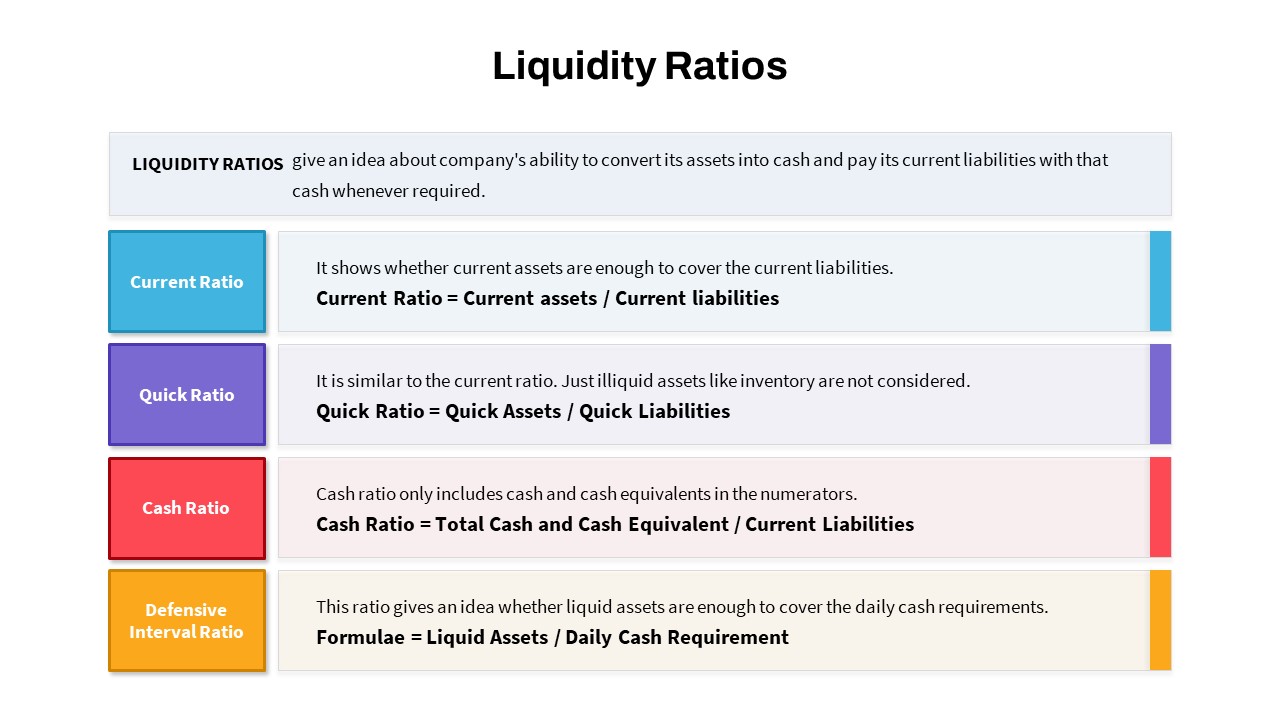
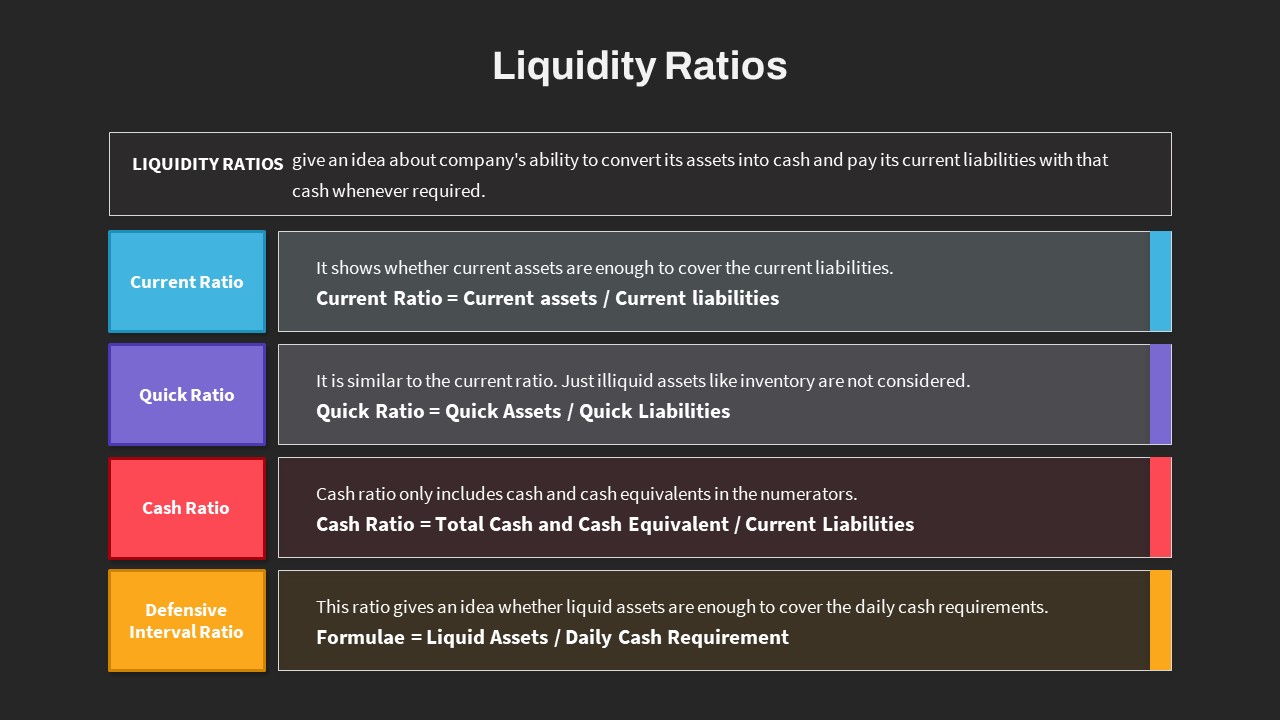
Enhance your financial presentations with this comprehensive liquidity ratios infographic slide. Designed to clarify a company’s short-term financial strength, it illustrates four key metrics—Current Ratio, Quick Ratio, Cash Ratio, and Defensive Interval Ratio—alongside concise formulas and explanations. Each ratio appears in a distinct, color-coded panel (blue, purple, red, and orange) with bold headings and clear text blocks, ensuring audiences can quickly grasp both definition and calculation. A clean title bar and introductory definition box at the top provide essential context, while the balanced alignment and generous white space deliver a polished, professional look.
This fully editable slide leverages vector shapes, custom fonts, and intuitive placeholders that let you adjust data points, swap color schemes, or reposition elements in seconds. Whether you need to match corporate branding or update formulas for specific reporting periods, this asset maintains clarity and consistency without sacrificing resolution. Optimized for both PowerPoint and Google Slides, it streamlines collaboration and eliminates formatting issues across platforms, ensuring your ratio analysis always looks its best.
Who is it for
Finance professionals, accountants, CFOs, and business analysts will benefit most from this liquidity ratios slide when presenting financial health assessments, cash-flow analyses, or credit evaluations. Investment bankers, financial consultants, and MBA students can also leverage its structured design for boardroom reports, classroom lectures, or strategic workshops.
Other Uses
Beyond traditional liquidity analysis, this versatile infographic can illustrate KPI comparisons, ratio benchmarking in industry reports, or financial dashboard summaries. It also adapts well for training sessions, investor pitches, or academic case studies, enabling presenters to convey complex financial data with clarity and impact.
Login to download this file

Item ID
SB04178
Related Templates

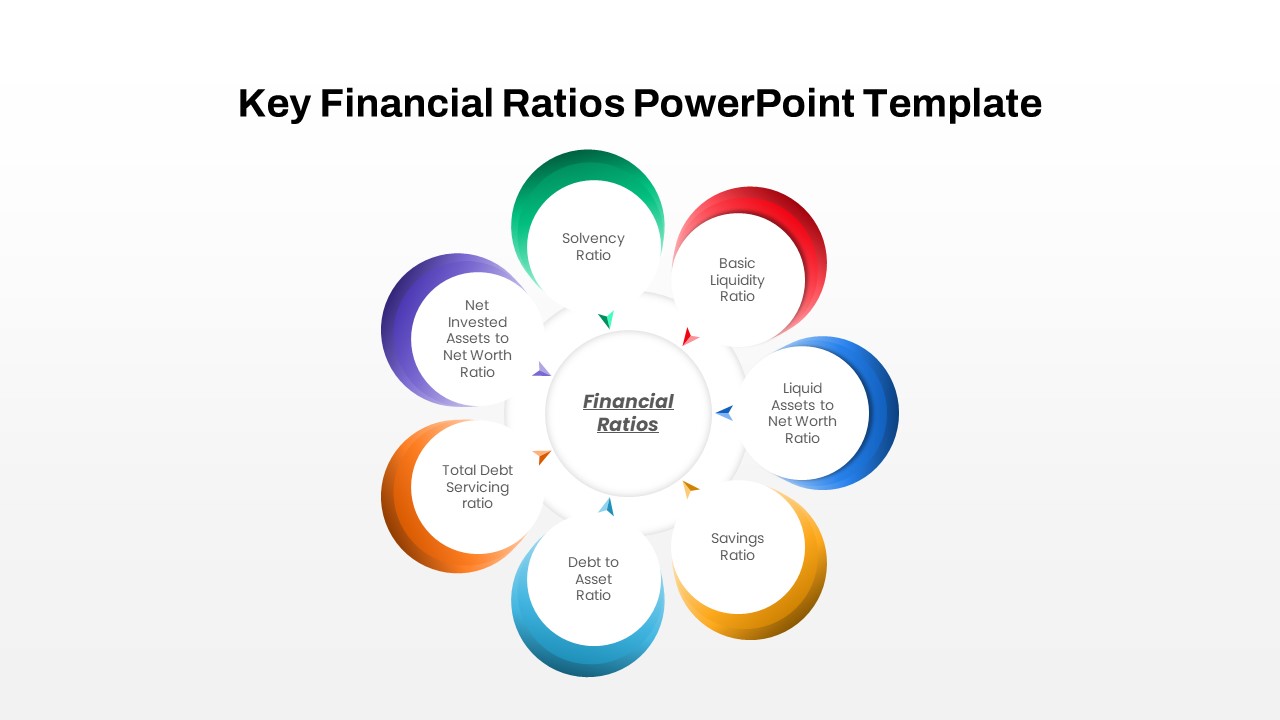
Circular Financial Ratios Infographic Template for PowerPoint & Google Slides
Finance
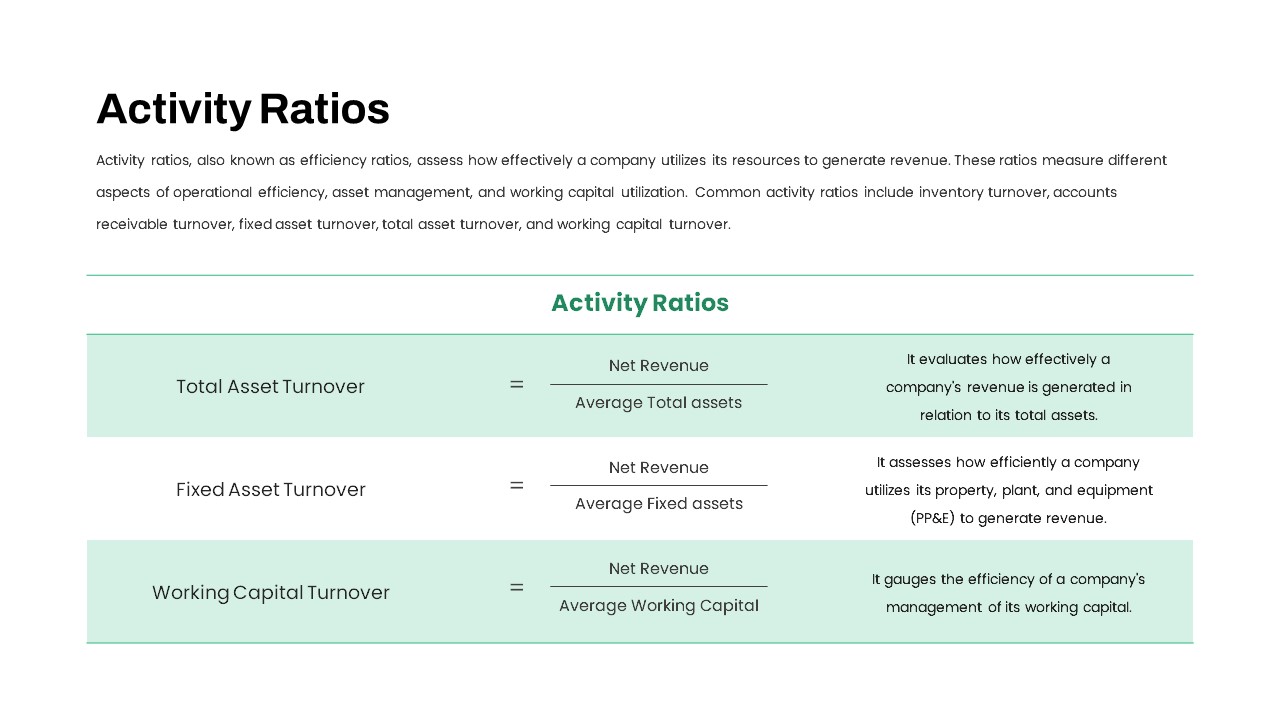
Activity Ratios Formula Table Slide Template for PowerPoint & Google Slides
Comparison Chart
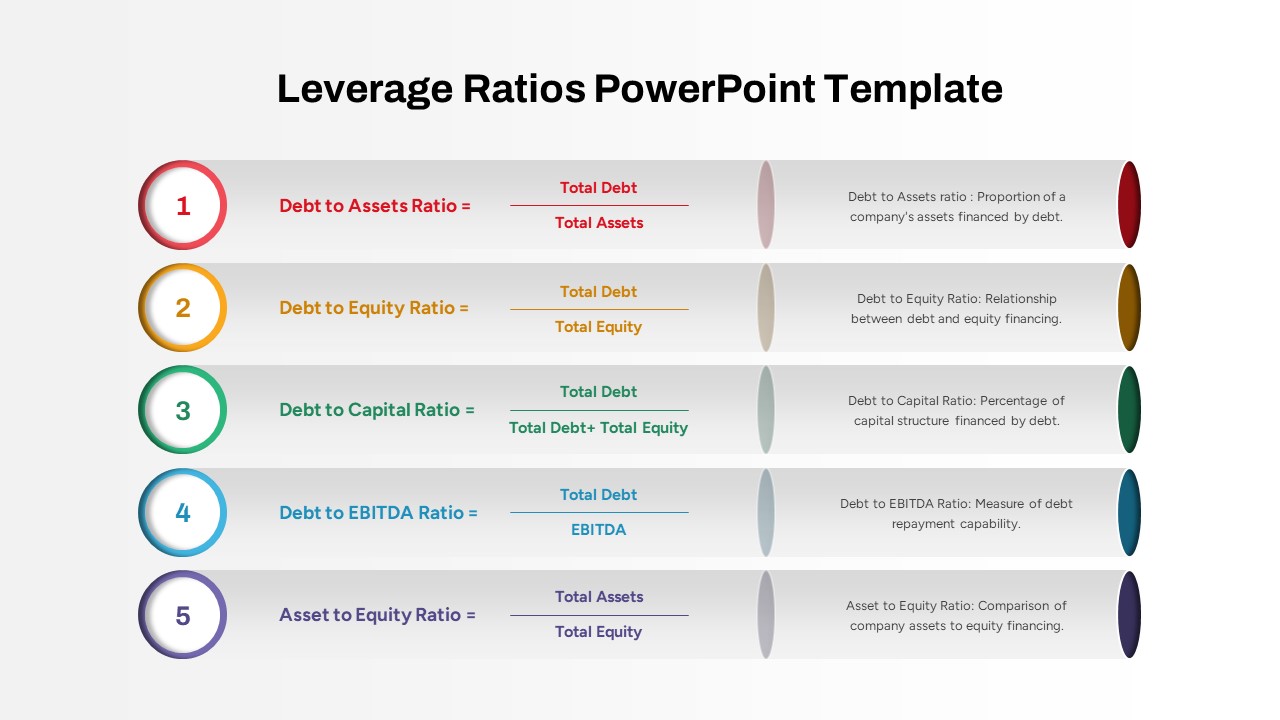
Five Key Leverage Ratios Overview Template for PowerPoint & Google Slides
Finance
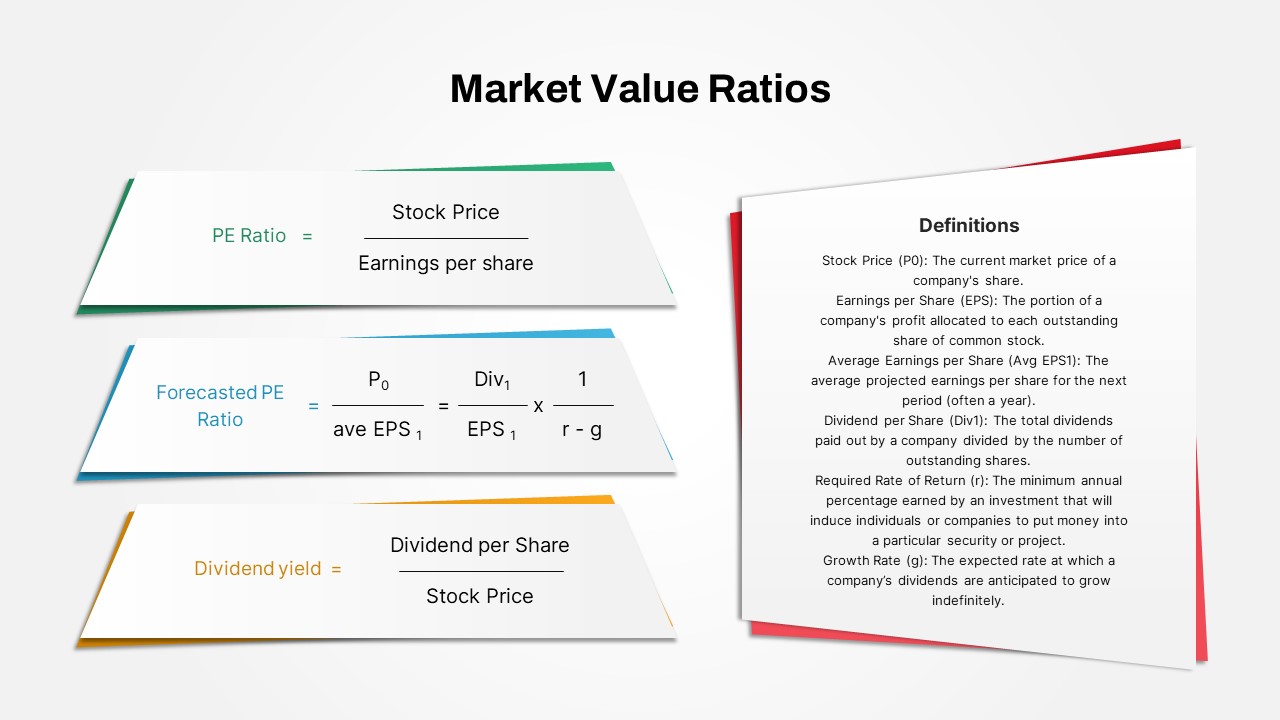
Market Value Ratios Formula Overview Template for PowerPoint & Google Slides
Business Report
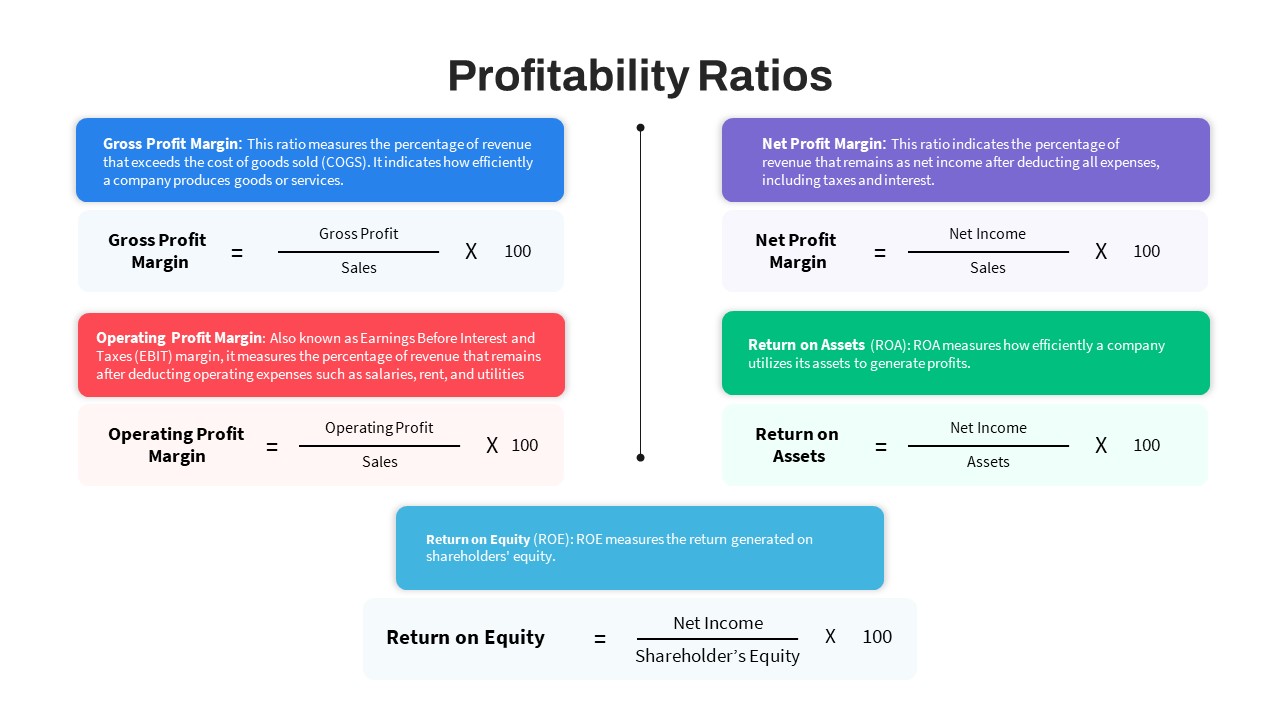
Profitability Ratios Formula Overview Template for PowerPoint & Google Slides
Revenue
Five 3D Growth Arrow Infographic Slide Template for PowerPoint & Google Slides
Arrow

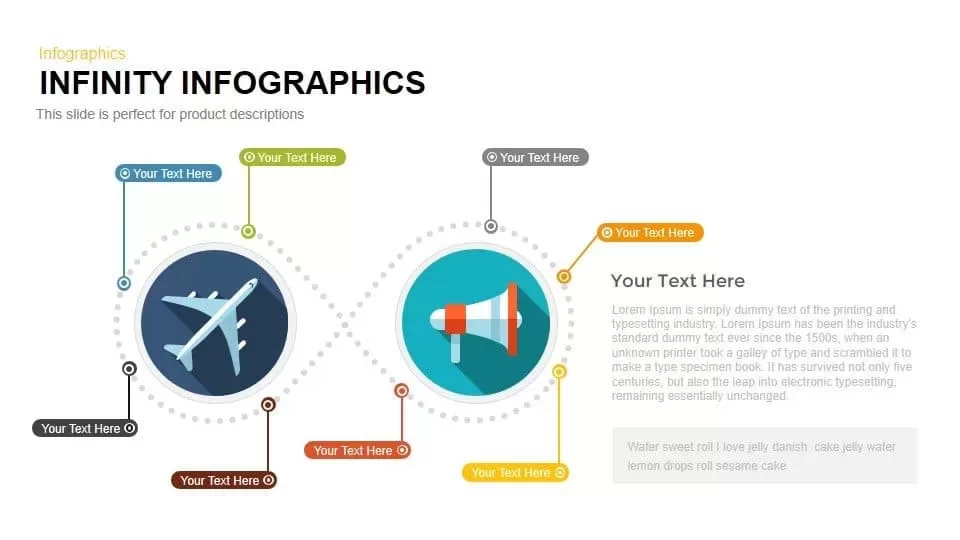
Looped Infinity Infographic Slide Template for PowerPoint & Google Slides
Process
Key Metaphor Infographic Slide Template for PowerPoint & Google Slides
Process
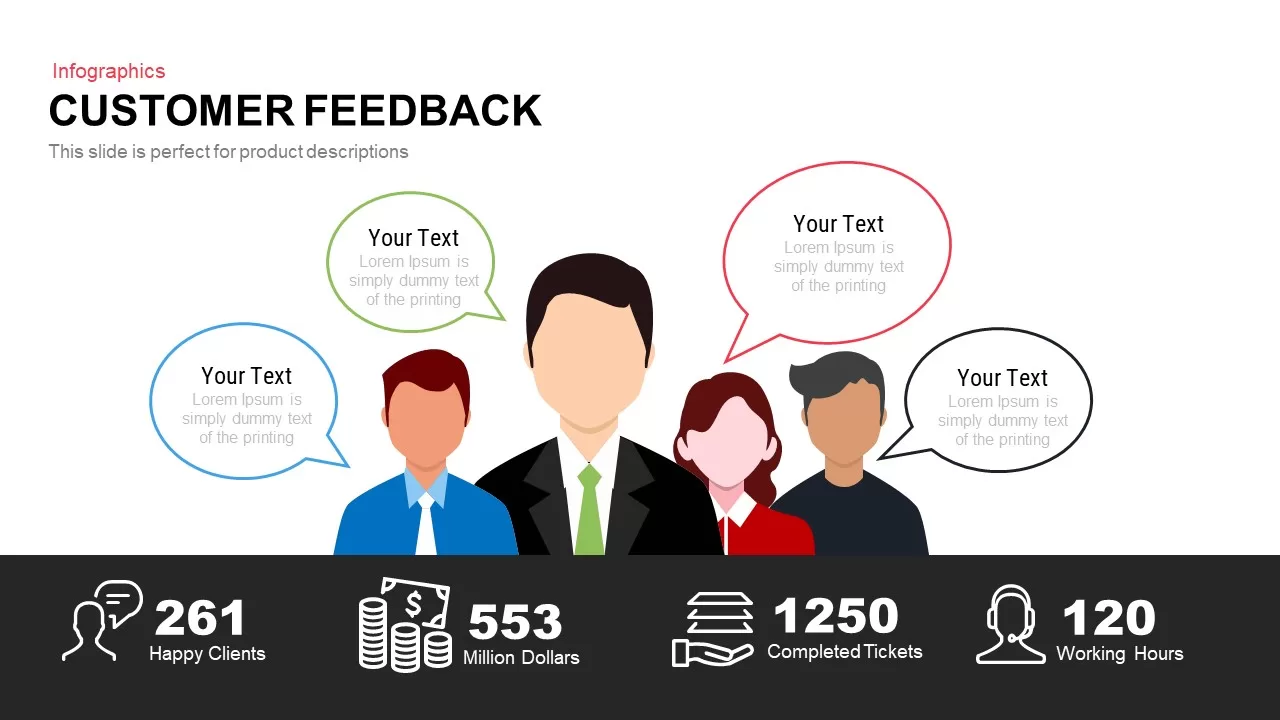
Customer Feedback Infographic Slide Template for PowerPoint & Google Slides
Customer Experience
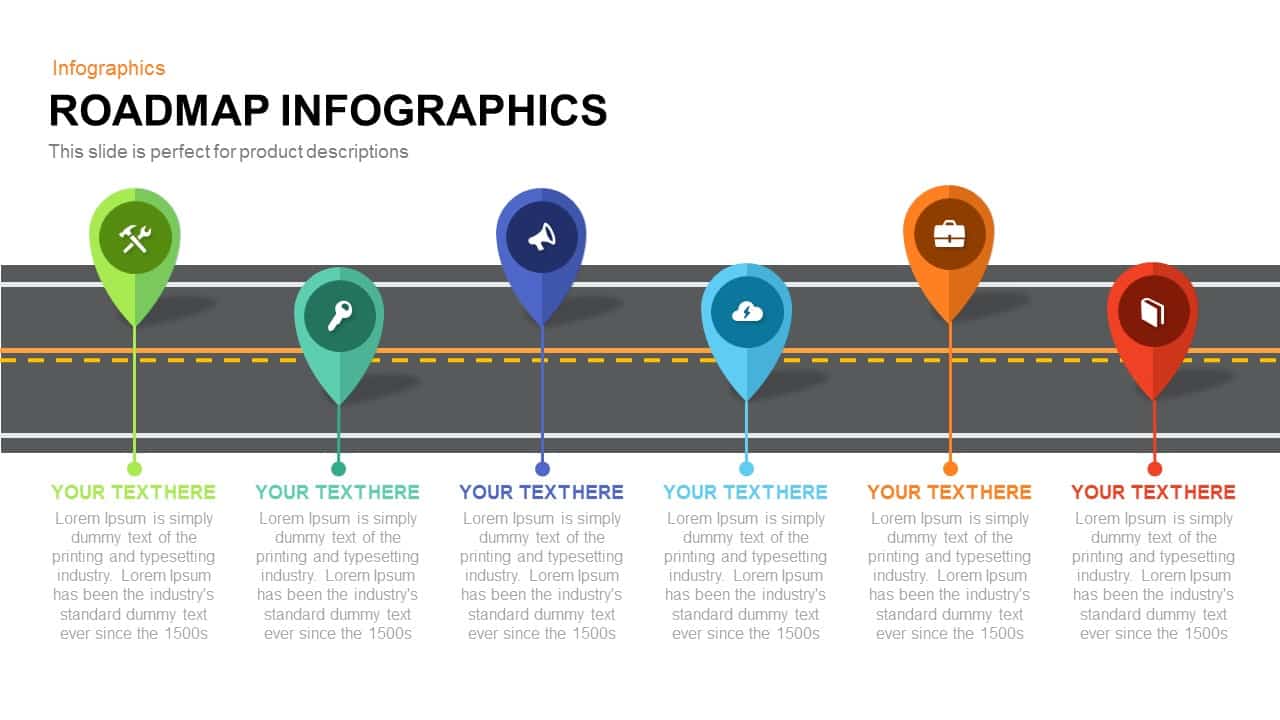
Roadmap Infographic Timeline Slide Template for PowerPoint & Google Slides
Roadmap
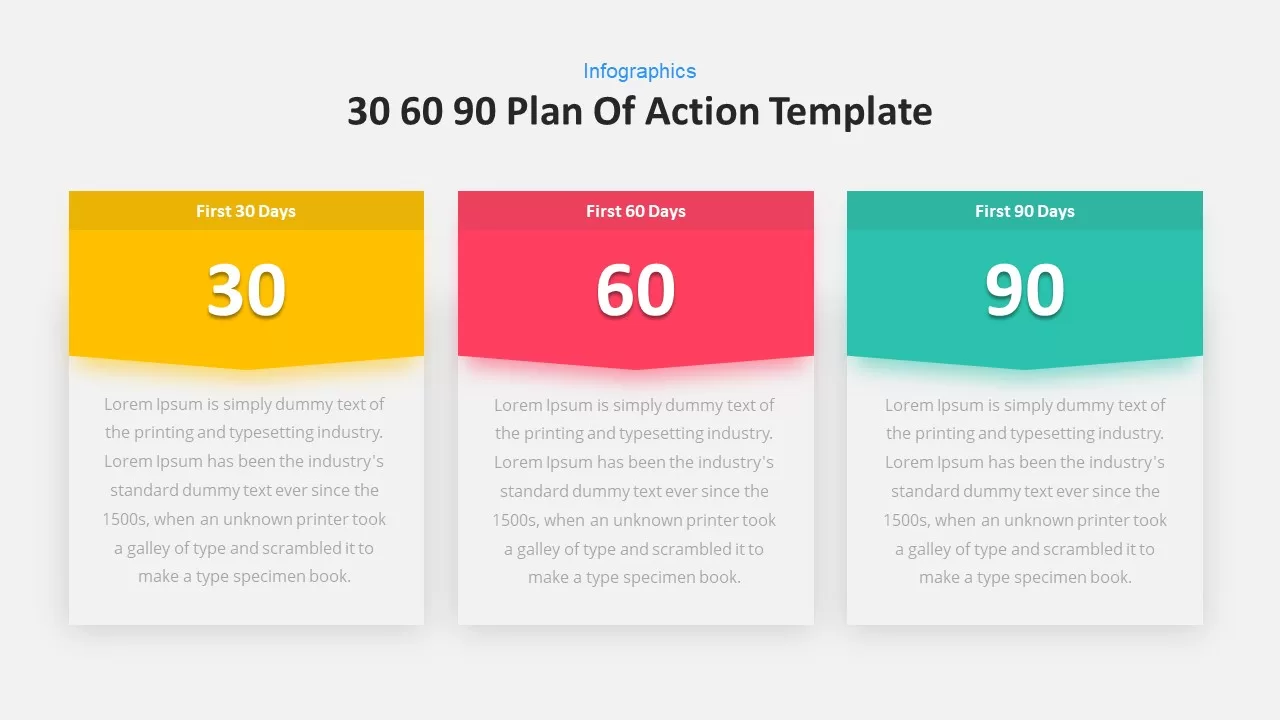
30 60 90-Day Plan Infographic Slide Template for PowerPoint & Google Slides
Business
Arrow Timeline Infographic Slide Template for PowerPoint & Google Slides
Timeline
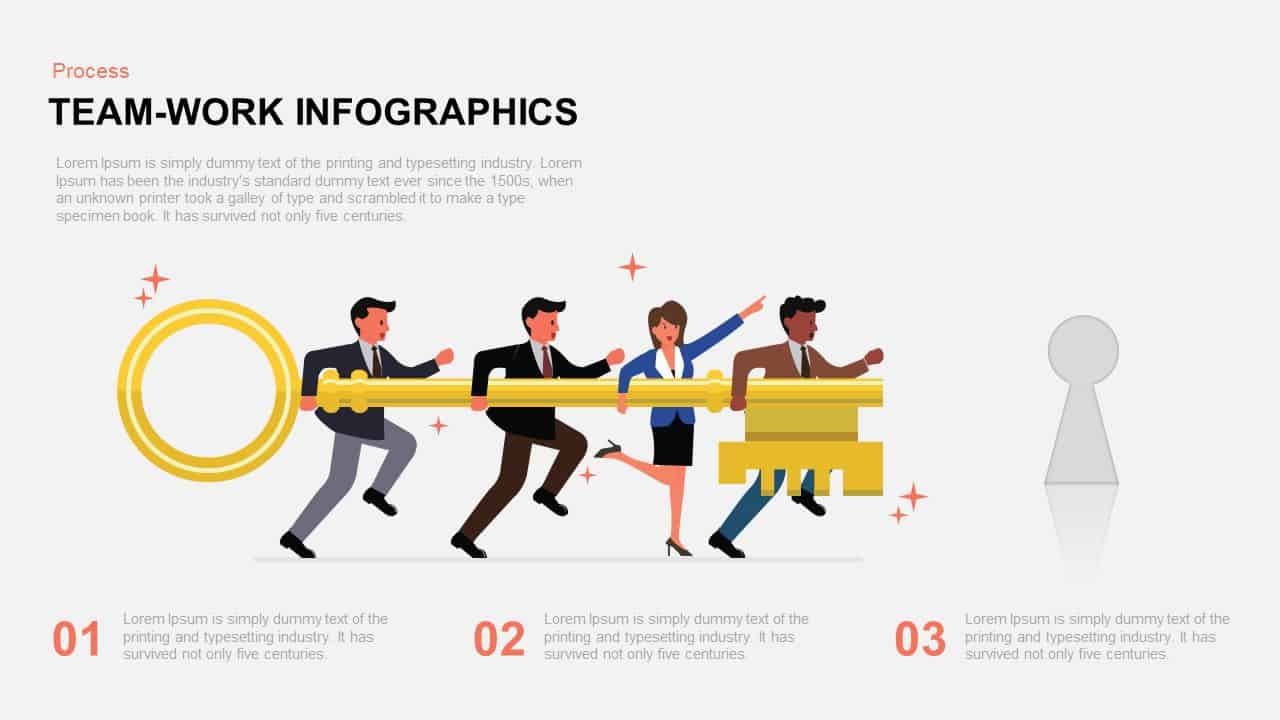
Teamwork Key Infographic Slide Template for PowerPoint & Google Slides
Process
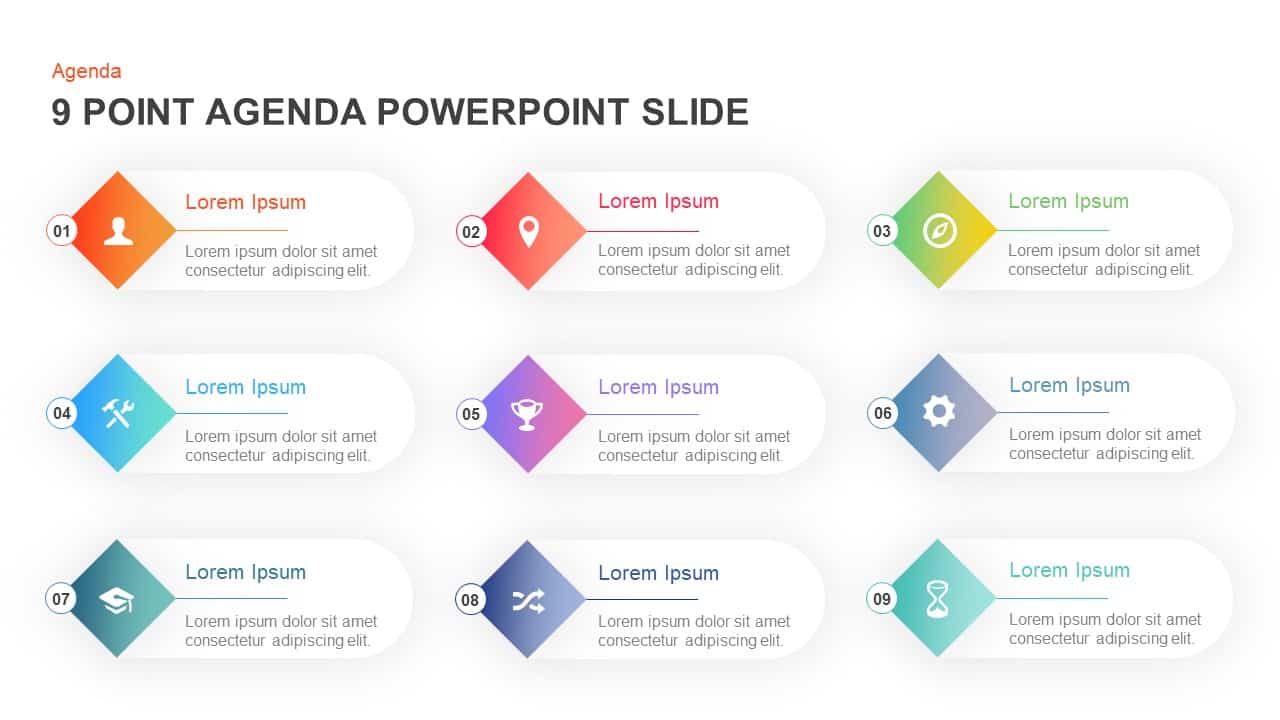
Nine-Point Agenda Infographic Slide Template for PowerPoint & Google Slides
Agenda
Five-Step Growth Infographic Slide Template for PowerPoint & Google Slides
Process
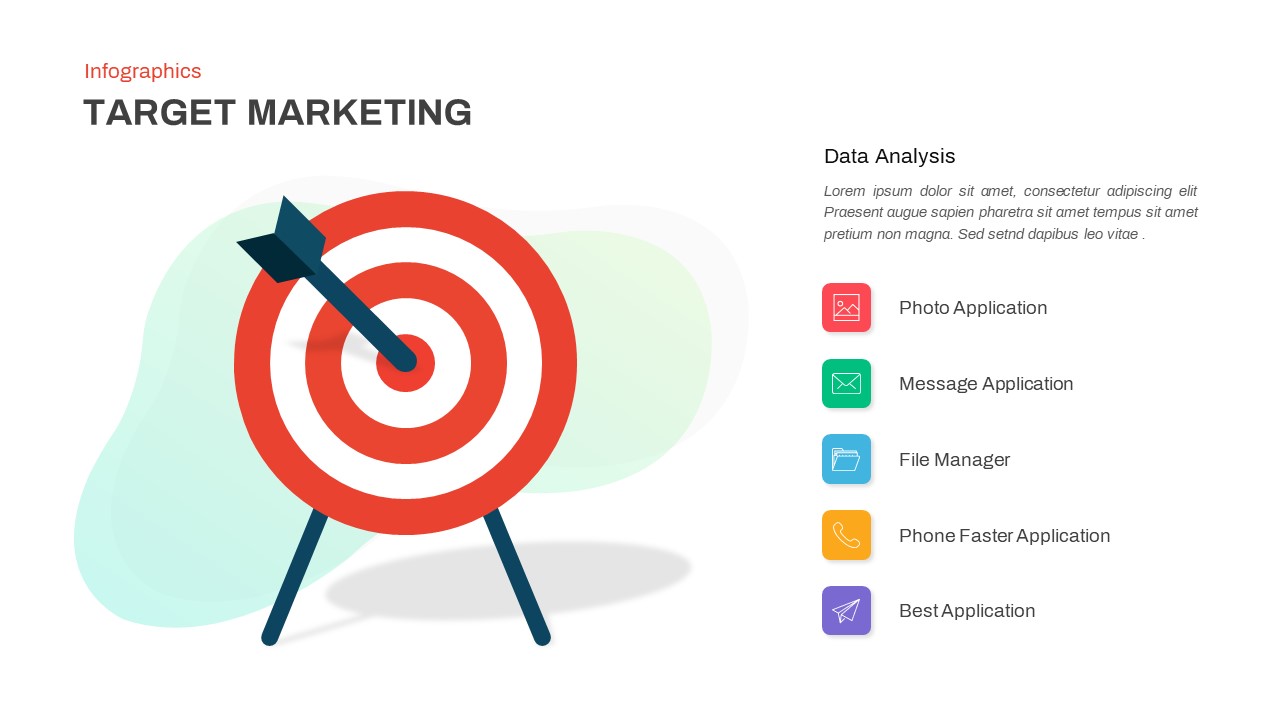
Target Marketing Infographic Slide Pack Template for PowerPoint & Google Slides
Infographics
5 Stage Timeline Infographic Slide Template for PowerPoint & Google Slides
Timeline
Two-Column Comparison Infographic Slide Template for PowerPoint & Google Slides
Comparison

Team Achievements Infographic Slide Template for PowerPoint & Google Slides
Accomplishment
Shape Loop Four-Step Infographic Slide Template for PowerPoint & Google Slides
Process
Four-Stage Agenda Infographic Slide Template for PowerPoint & Google Slides
Agenda
5-Stage Timeline Infographic Slide Template for PowerPoint & Google Slides
Timeline
Four Step Process Infographic Slide Template for PowerPoint & Google Slides
Process
Target Goals Infographic Slide Template for PowerPoint & Google Slides
Goals
Mind Map Infographic Slide Template for PowerPoint & Google Slides
Mind Maps

Bulb Idea Concept Infographic Slide Template for PowerPoint & Google Slides
Process
Table of Contents Infographic Slide template for PowerPoint & Google Slides
Agenda
Multi-Style Flow Infographic Slide template for PowerPoint & Google Slides
Process
North America Map Infographic Slide Template for PowerPoint & Google Slides
World Maps
Modular Block Infographic Slide Template for PowerPoint & Google Slides
Infographics
Colorful Block Infographic Metrics Slide Template for PowerPoint & Google Slides
Infographics
Professional Drone Infographic Slide Template for PowerPoint & Google Slides
Infographics
Key Takeaway Slide Infographic Template for PowerPoint & Google Slides
Process
Key Takeaway Infographic Slide Deck Template for PowerPoint & Google Slides
Process
Key Takeaway Keyhole Infographic Slide Template for PowerPoint & Google Slides
Process
Animated 3D Dice Infographic Slide Template for PowerPoint & Google Slides
Process
Core Values Infographic Slide Template for PowerPoint & Google Slides
Comparison
8-Bell Curve Infographic Slide Template for PowerPoint & Google Slides
Comparison Chart
LinkedIn Metrics Infographic Slide Template for PowerPoint & Google Slides
Digital Marketing
Instagram Infographic Metrics Slide Template for PowerPoint & Google Slides
Marketing
Bow and Arrow Goal Infographic Slide Template for PowerPoint & Google Slides
Goals
Triangle Infographic Slide Collection Template for PowerPoint & Google Slides
Decks

Free Colorful Infographic Slide Pack Template for PowerPoint & Google Slides
Roadmap
Free
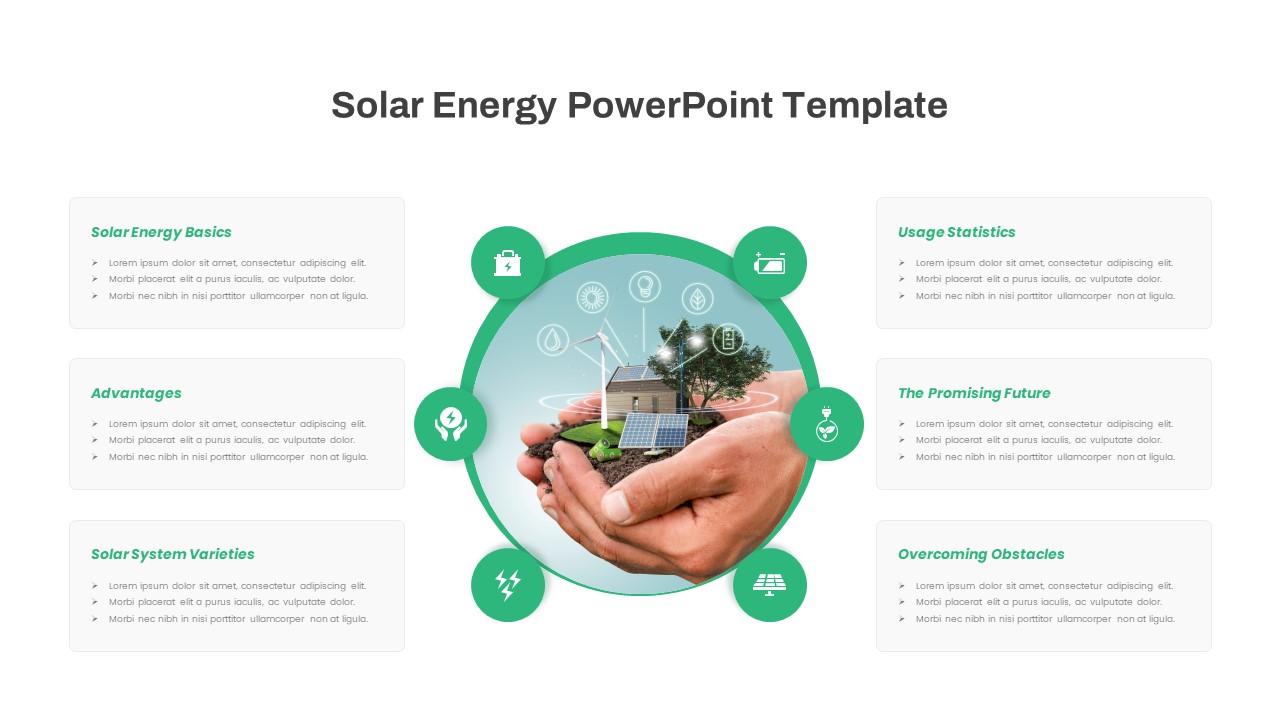
Free Solar Energy Infographic Slide Template for PowerPoint & Google Slides
Circular
Free
Free Multi-Step Funnel Infographic Slide Pack Template for PowerPoint & Google Slides
Funnel
Free
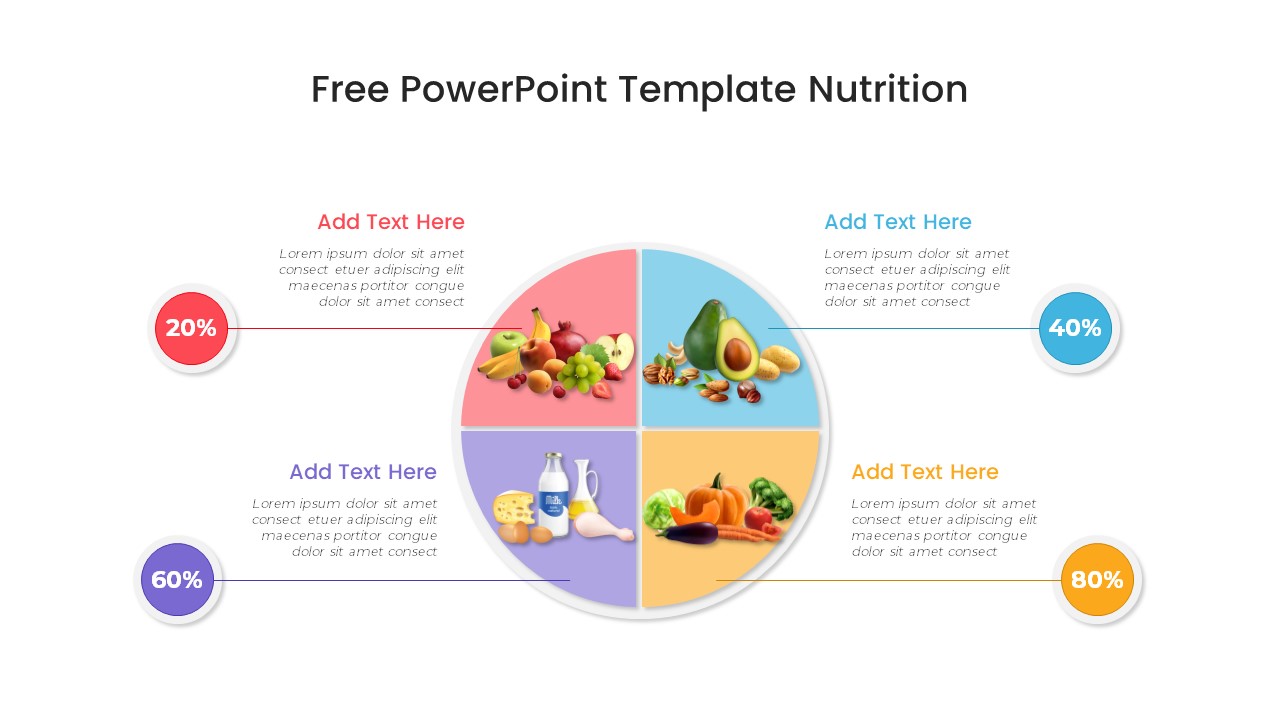
Free Nutrition Infographic Slide Template for PowerPoint & Google Slides
Health
Free
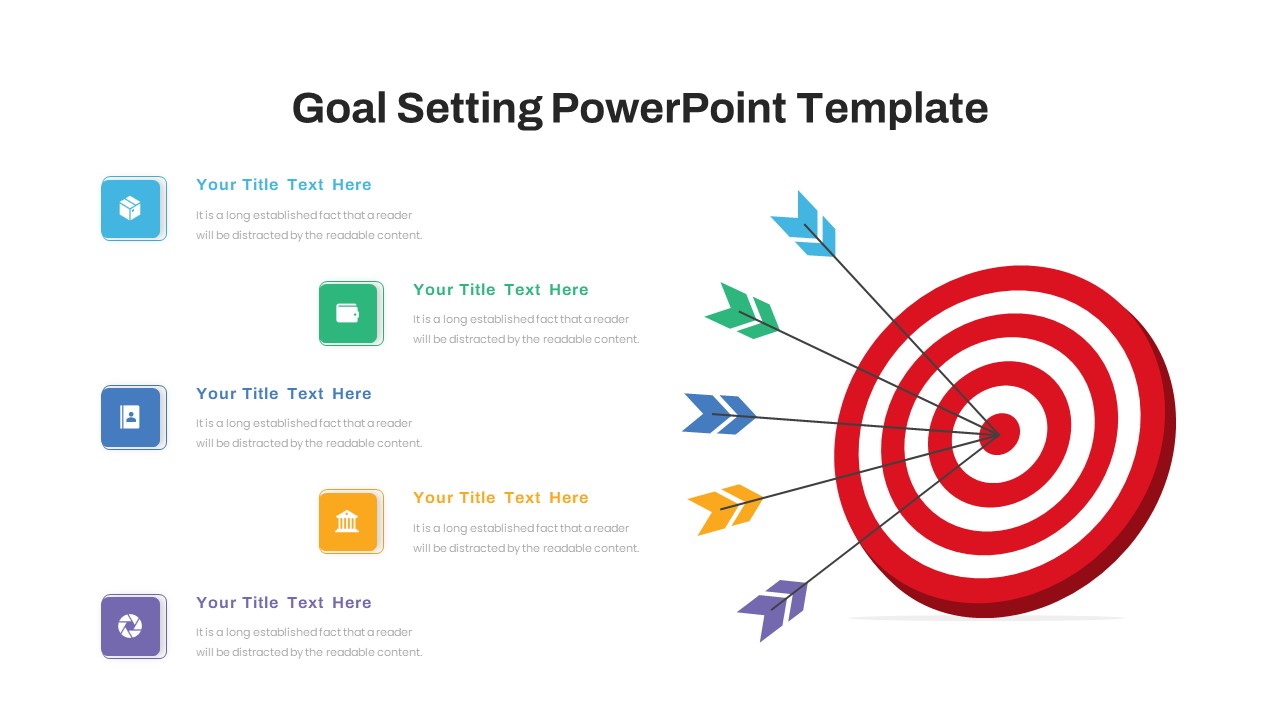
Free Goal Setting Target Infographic Slide Template for PowerPoint & Google Slides
Goals
Free
Editable Ireland Map Infographic Slide Template for PowerPoint & Google Slides
World Maps
Free
HIV AIDS Infographic Diagram Slide Deck Template for PowerPoint & Google Slides
Graphics
Free Online Shopping 3-Slide Infographic Template for PowerPoint & Google Slides
Digital Marketing
Free
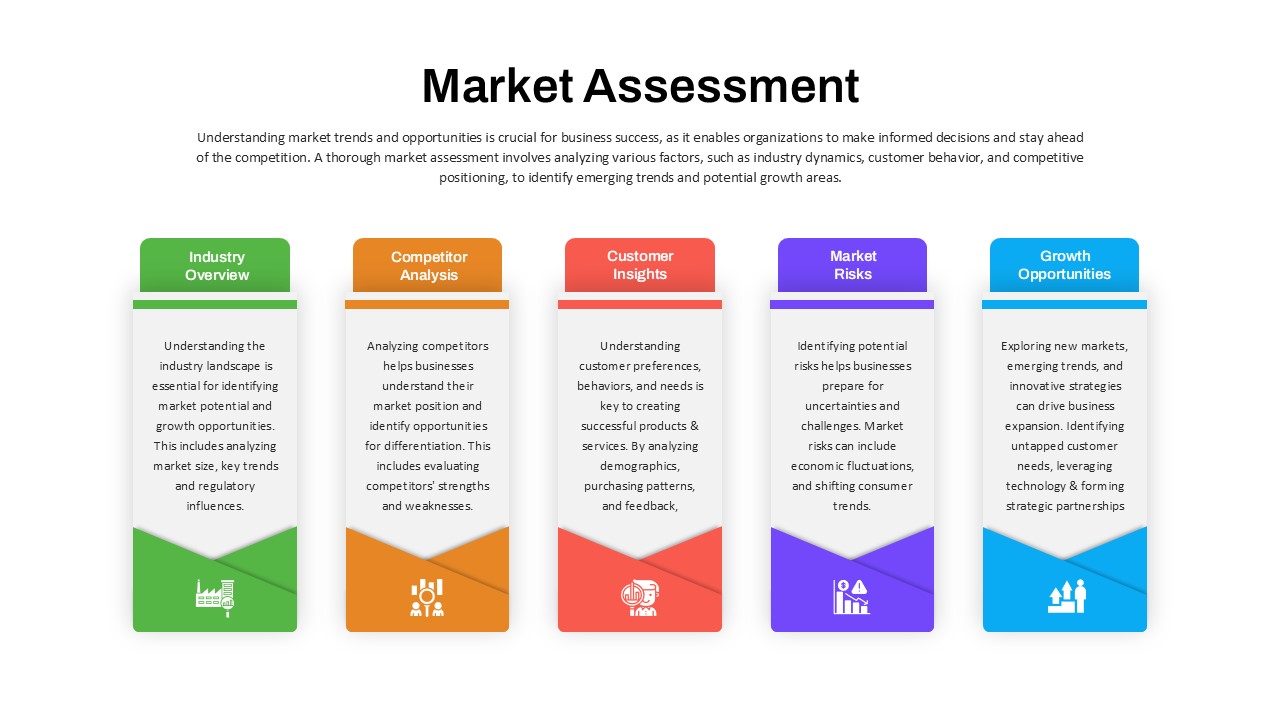
Market Assessment Infographic Slide Template for PowerPoint & Google Slides
Process
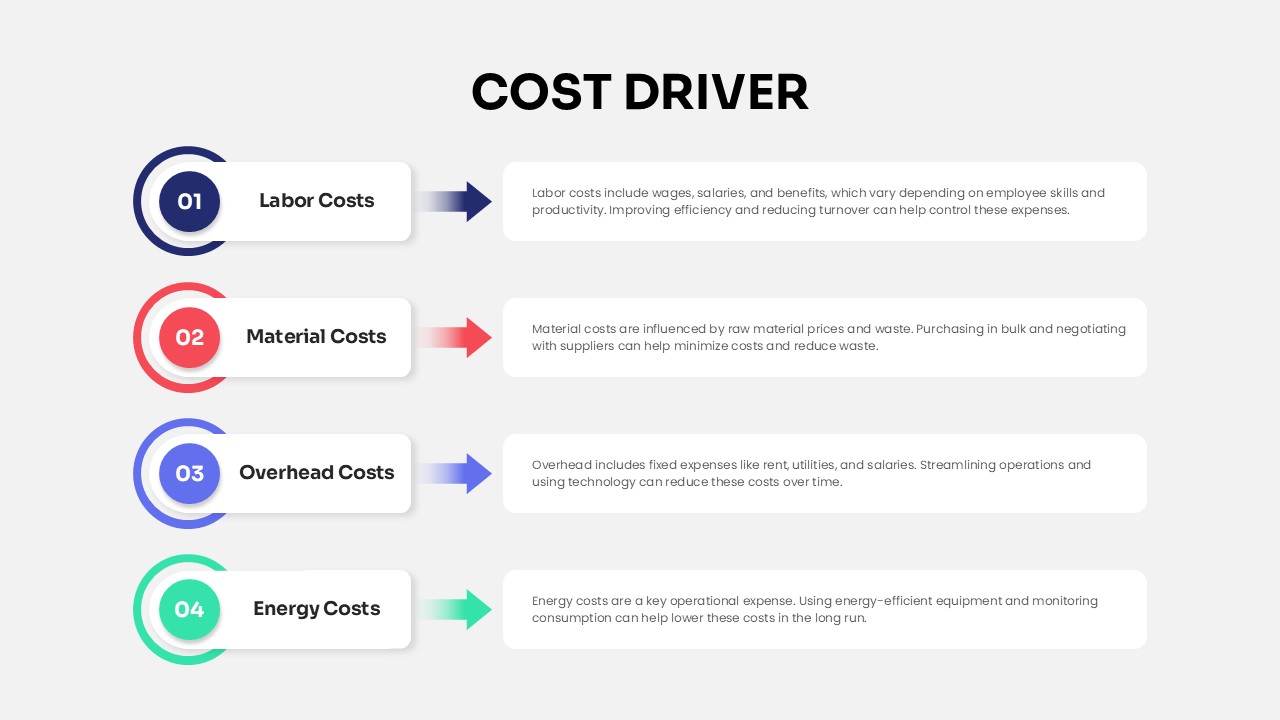
Cost Driver Infographic Slide Pack Template for PowerPoint & Google Slides
Process
Community Building Infographic Slide Template for PowerPoint & Google Slides
Leadership
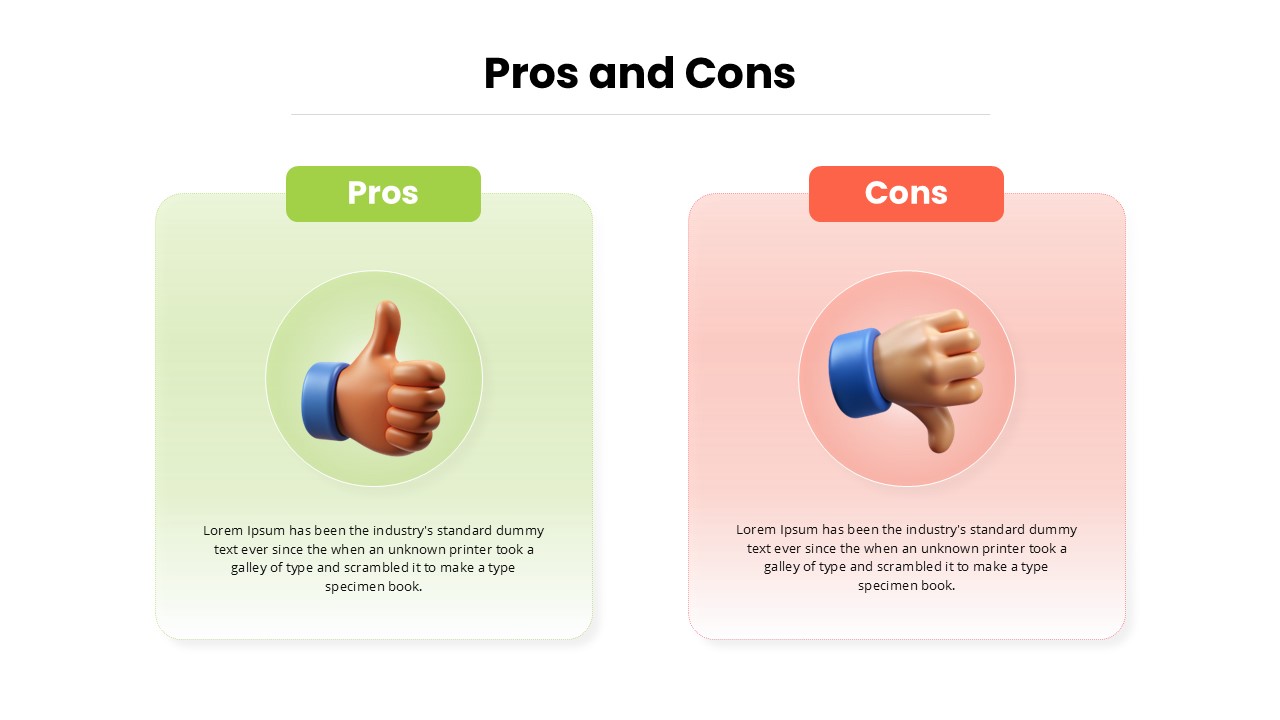
Pros and Cons Infographic Slide Pack Template for PowerPoint & Google Slides
Comparison
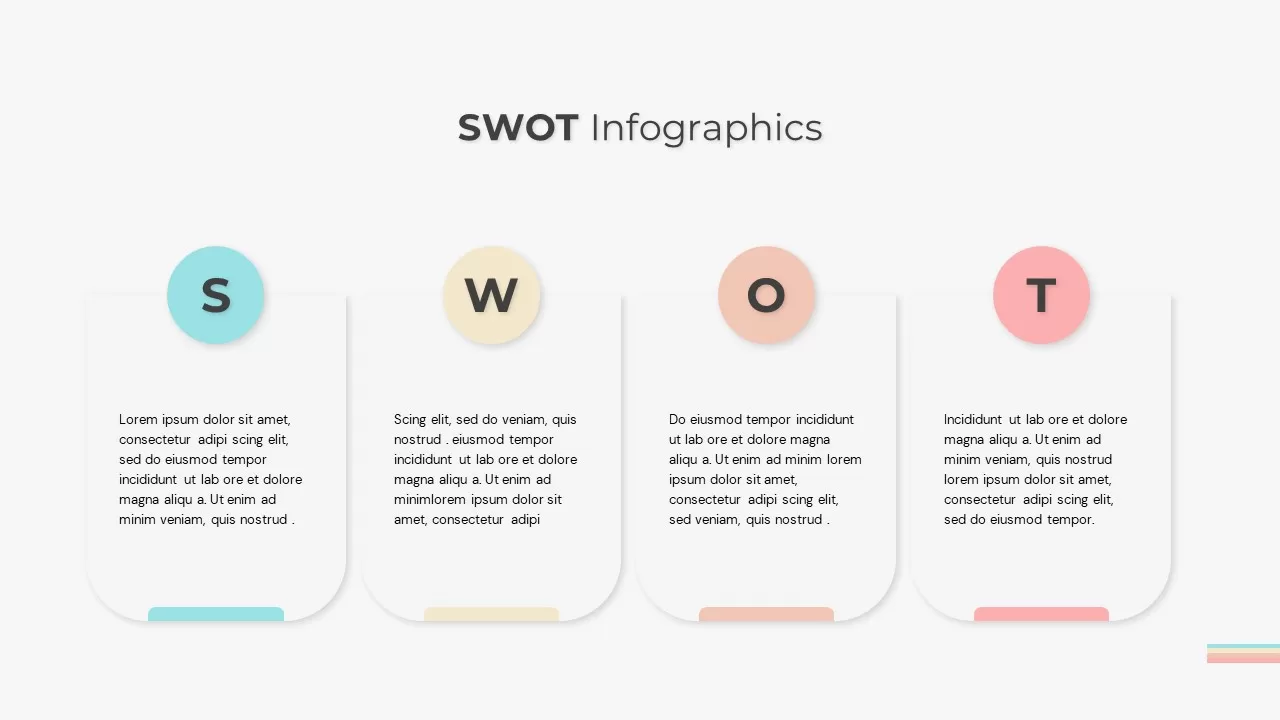
SWOT Analysis Infographic Slide for PowerPoint & Google Slides
SWOT
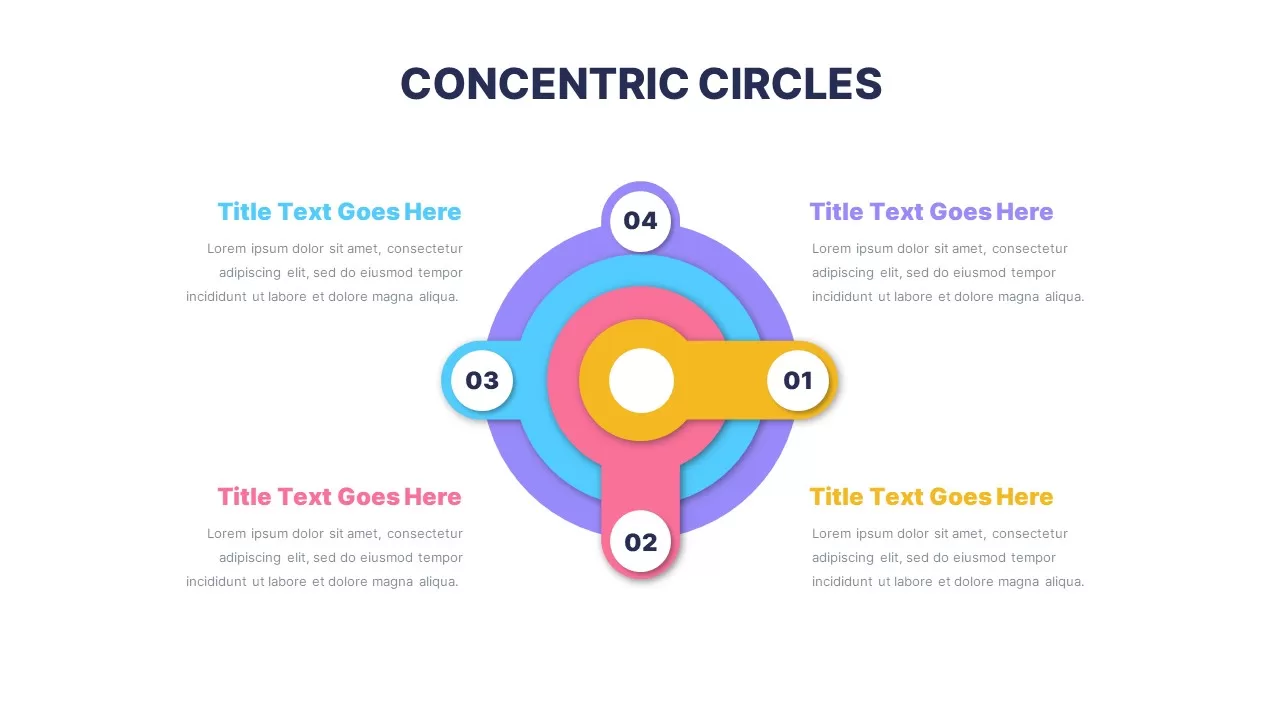
Colorful Concentric Circles Infographic Slide for PowerPoint & Google Slides
Process
Free Infographic Statistics Dashboard Slide for PowerPoint & Google Slides
Bar/Column
Free
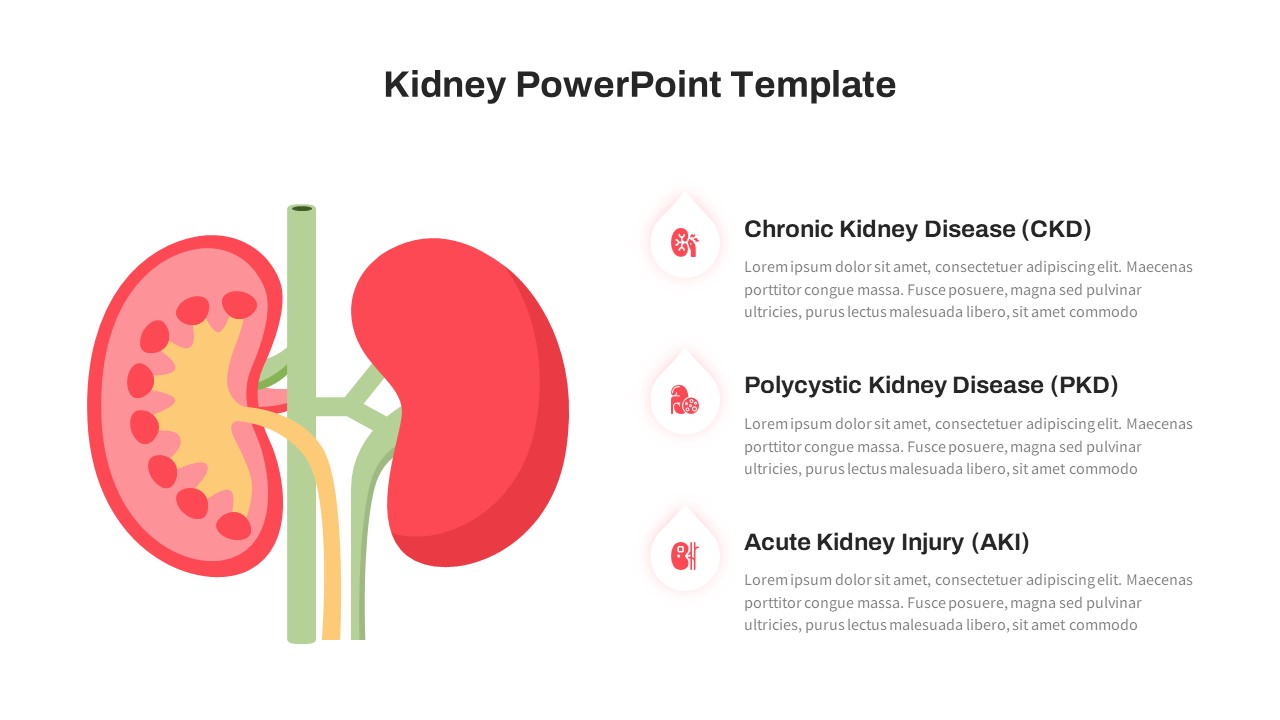
Kidney Disease Infographic Slide for PowerPoint & Google Slides
Health
Google Ads Optimization & Performance Infographic Template for PowerPoint & Google Slides
Digital Marketing
SQ3R Study Strategy Infographic Slides Template for PowerPoint & Google Slides
Business Strategy
Six Double Diamond Infographic Slides Template for PowerPoint & Google Slides
Process

Sales Process Infographic Slides Pack Template for PowerPoint & Google Slides
Process
Casino/Poker Chips Infographic Slides template for PowerPoint & Google Slides
Business Strategy
Agenda Infographic Pack of 2 Slides Template for PowerPoint & Google Slides
Agenda
Quad Chart Infographic Pack of 8 Slides Template for PowerPoint & Google Slides
Comparison Chart
Four Options Infographic Slides Template for PowerPoint & Google Slides
Comparison
Game Plan Infographic Slides Pack Template for PowerPoint & Google Slides
Infographics
Teamwork PowerPoint Infographic Template for PowerPoint & Google Slides
Leadership
Kite Infographic PowerPoint Template for PowerPoint & Google Slides
Process
Cladogram Infographic Di Template for PowerPoint & Google Slides Template
Decision Tree
Workflow PowerPoint Process infographic for PowerPoint & Google Slides
Process
Free Infographic Deck PowerPoint Pack for PowerPoint & Google Slides
Infographics
Free
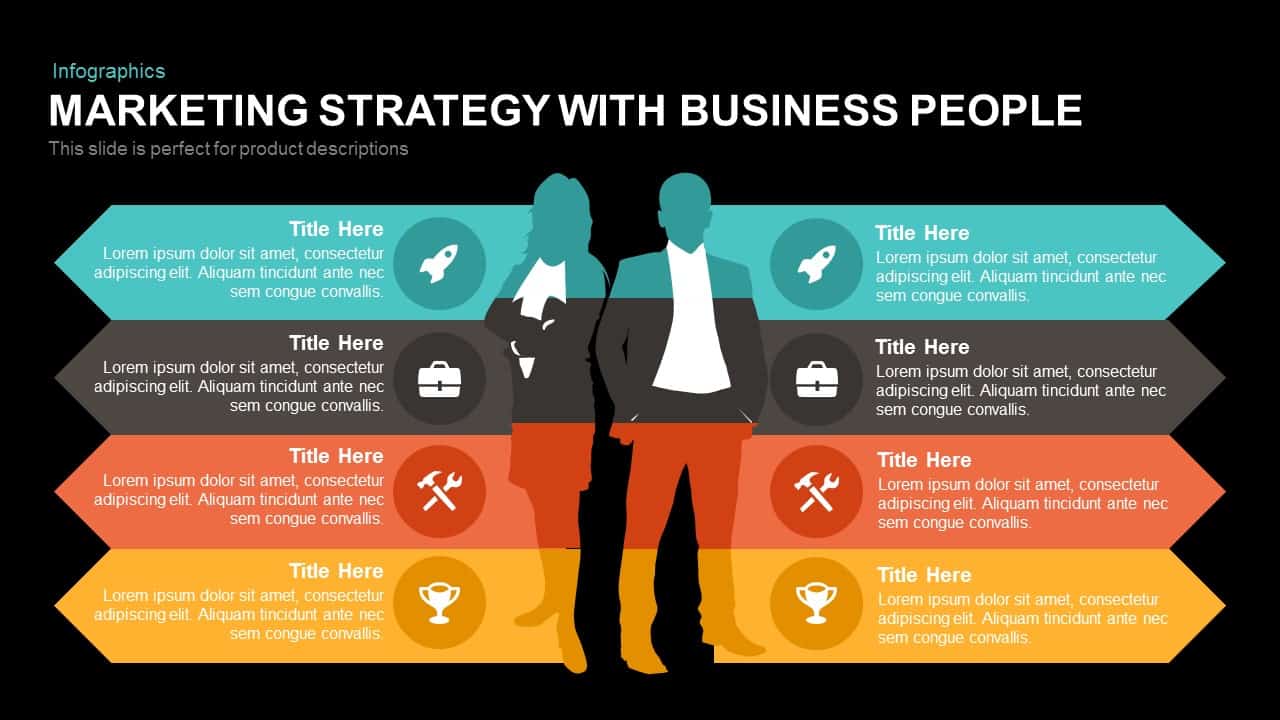
Marketing Strategy Arrow Infographic Template for PowerPoint & Google Slides
Comparison

A/B Testing Comparison Infographic template for PowerPoint & Google Slides
Comparison
Five-Stage Growth Arrow Infographic Template for PowerPoint & Google Slides
Arrow
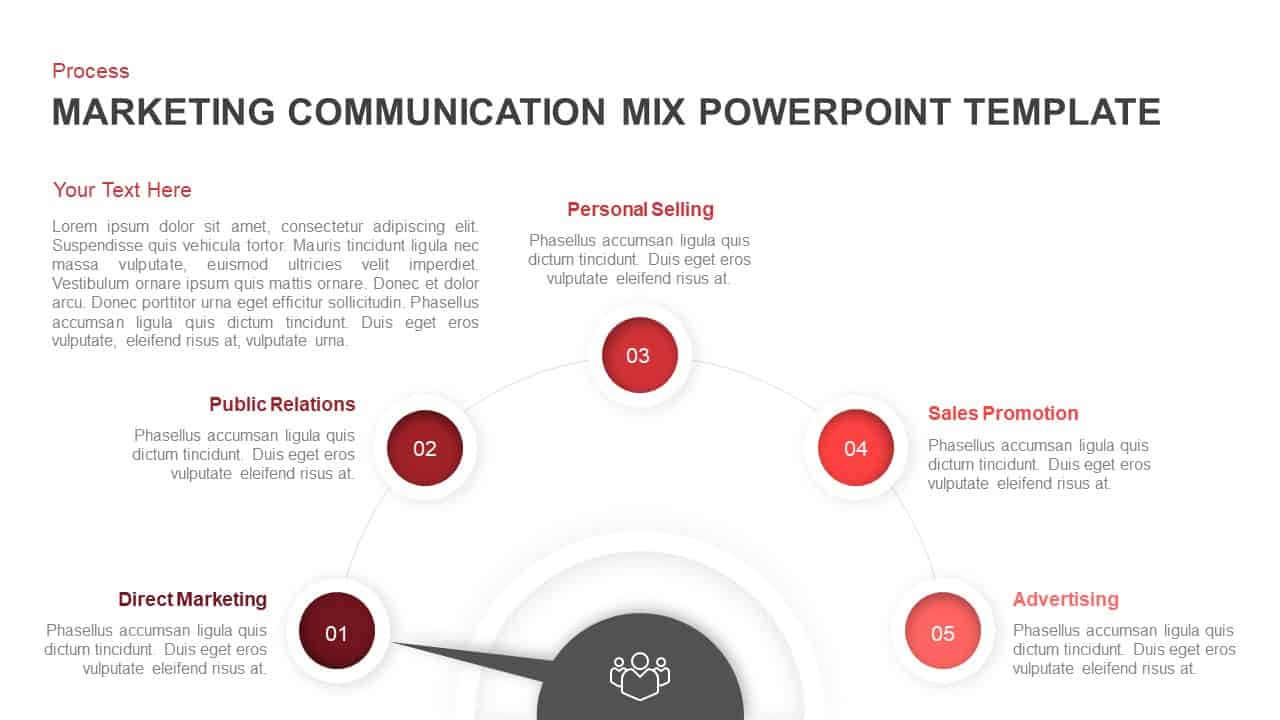
Marketing Communication Mix Infographic Template for PowerPoint & Google Slides
Marketing
Plant Growth Lifecycle Infographic Template for PowerPoint & Google Slides
Process
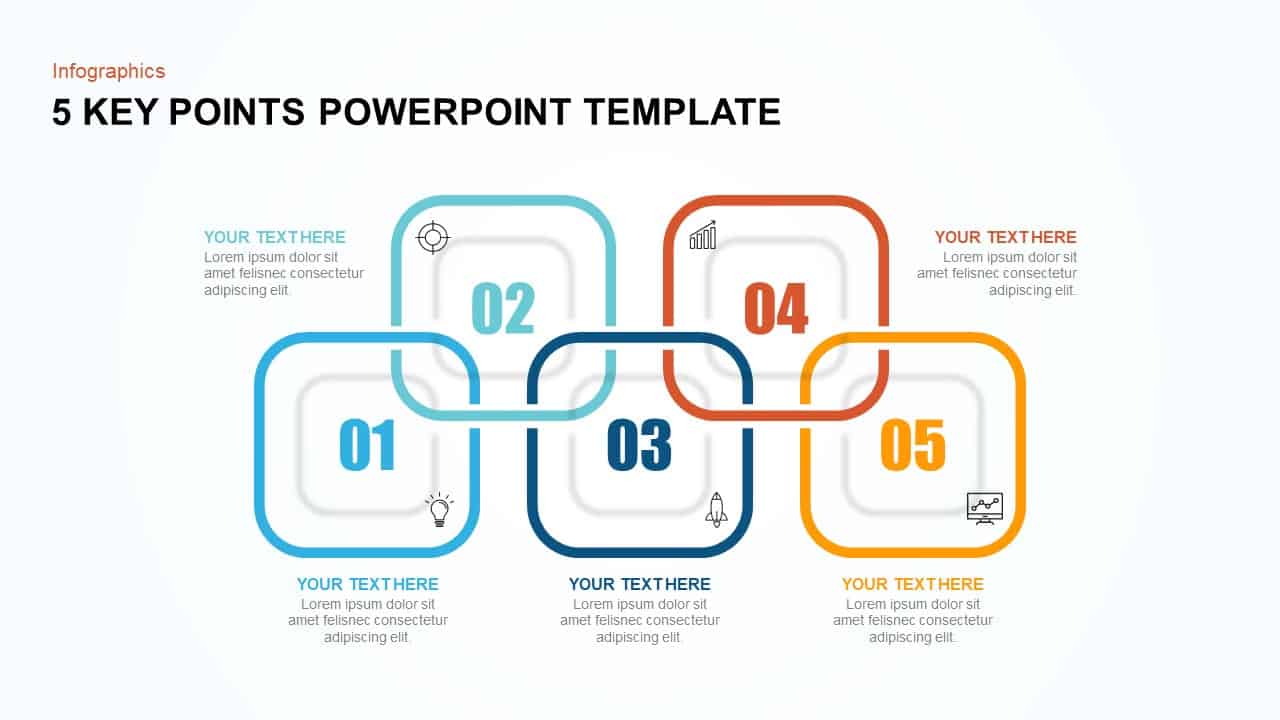
5 Key Points Infographic Diagram Template for PowerPoint & Google Slides
Process
Circular Three-Step Infographic Diagram Template for PowerPoint & Google Slides
Circular
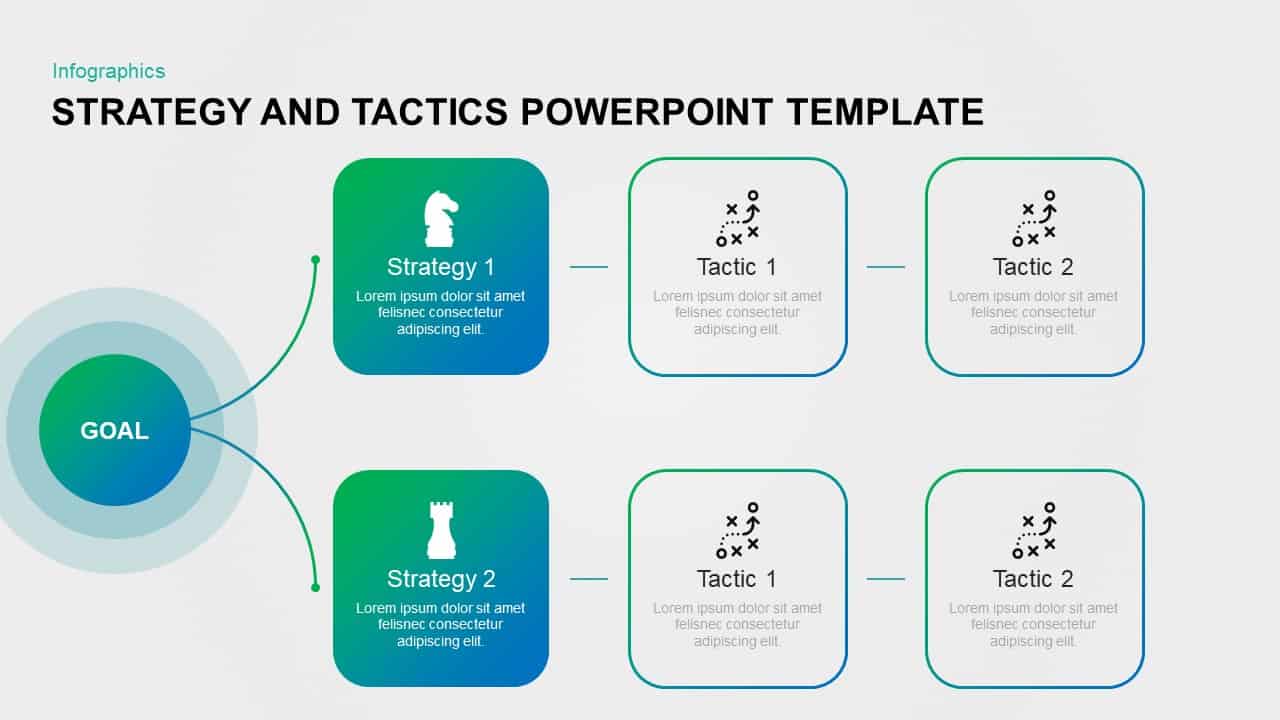
Strategy and Tactics Infographic Template for PowerPoint & Google Slides
Process
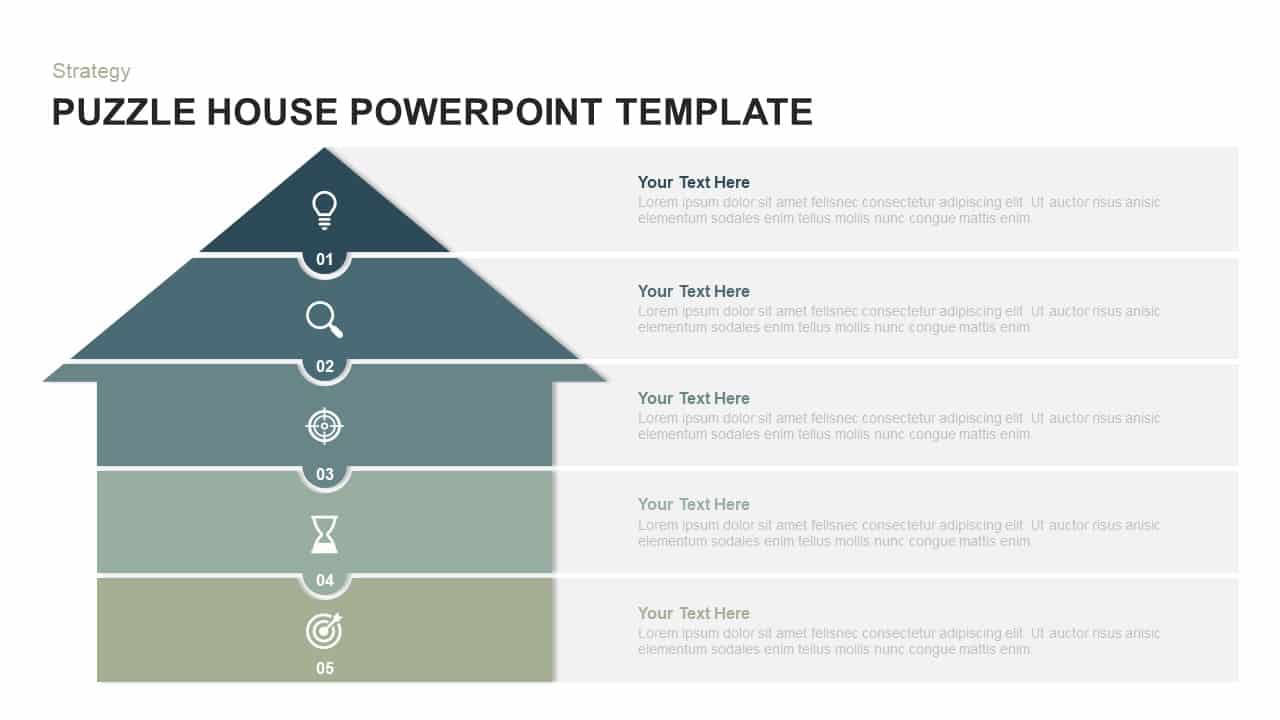
Five-Level Puzzle House Infographic Template for PowerPoint & Google Slides
Pyramid
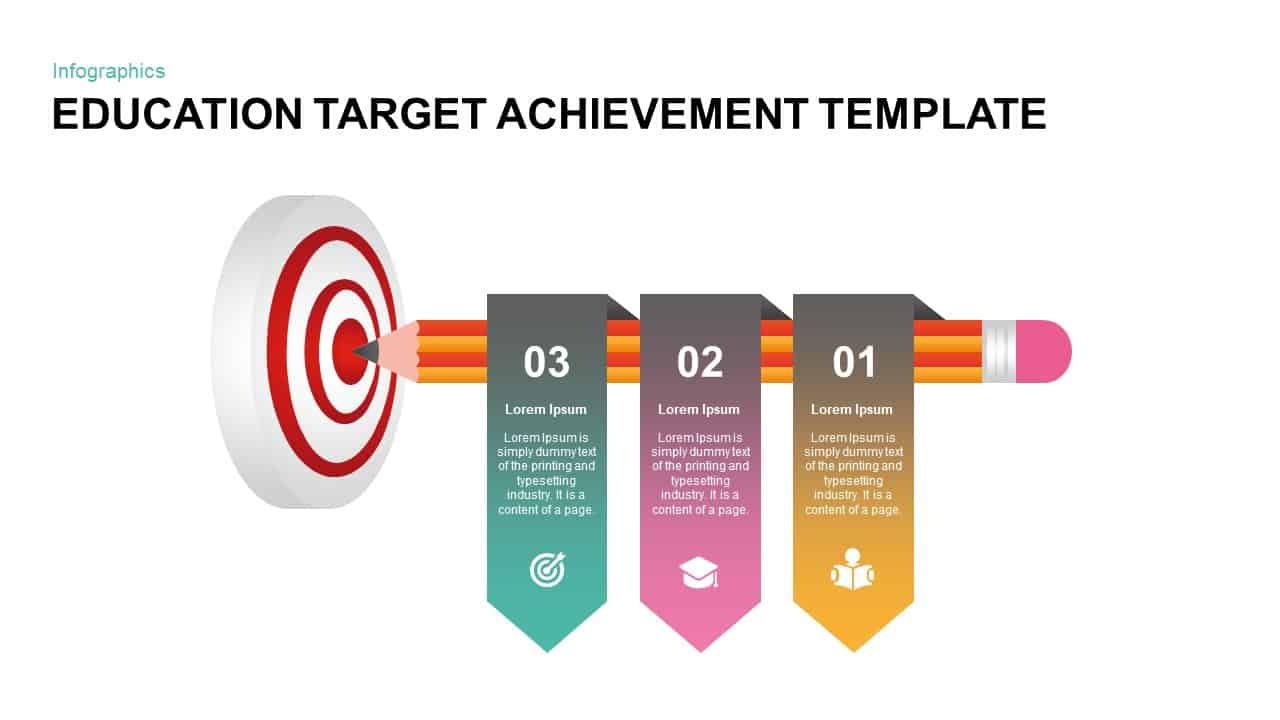
Education Target Achievement Infographic Template for PowerPoint & Google Slides
Goals
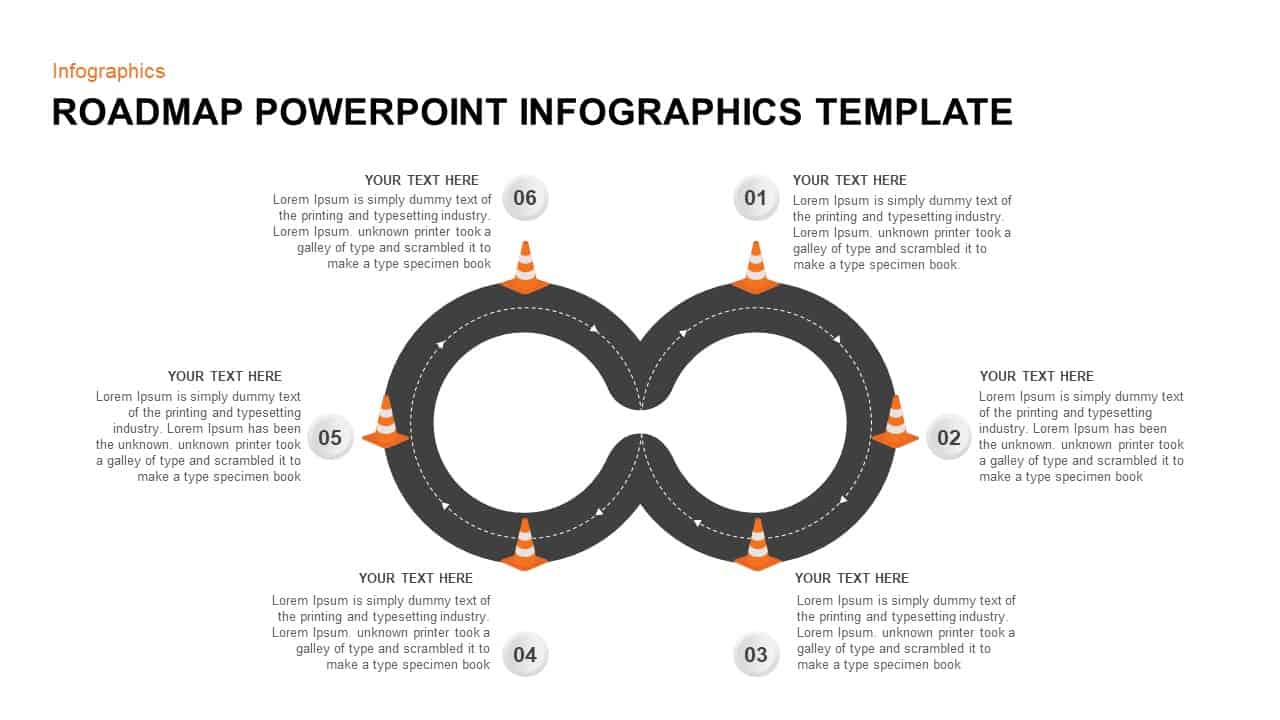
Six-Step Roadmap Infographic Template for PowerPoint & Google Slides
Roadmap
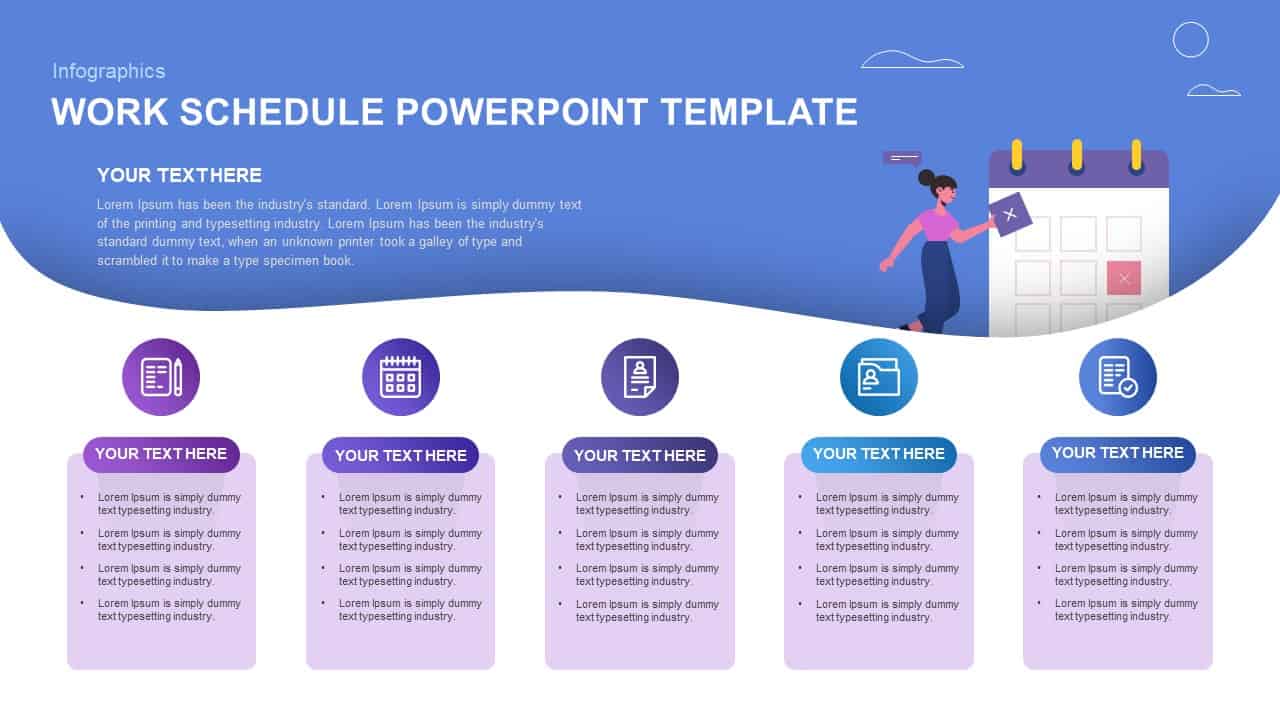
Work Schedule Agenda Infographic Template for PowerPoint & Google Slides
Agenda
Four-Stage Funnel Diagram Infographic Template for PowerPoint & Google Slides
Funnel
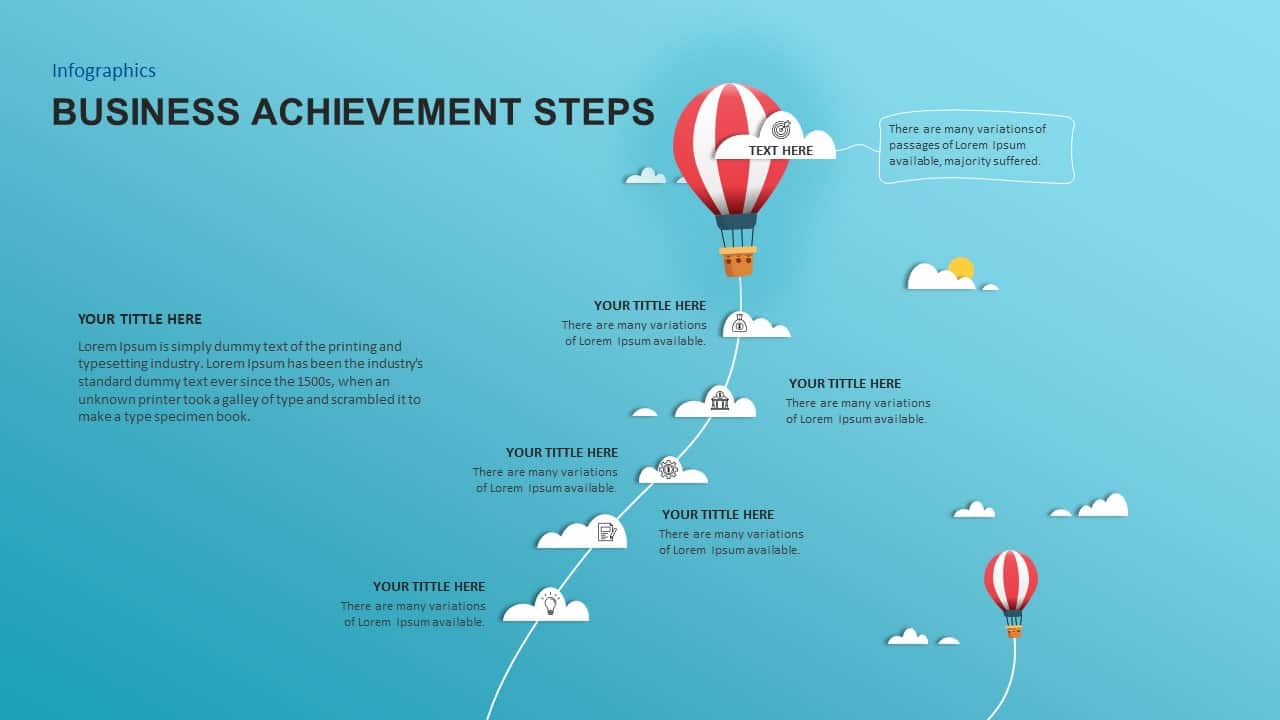
Business Achievement Steps Infographic template for PowerPoint & Google Slides
Process
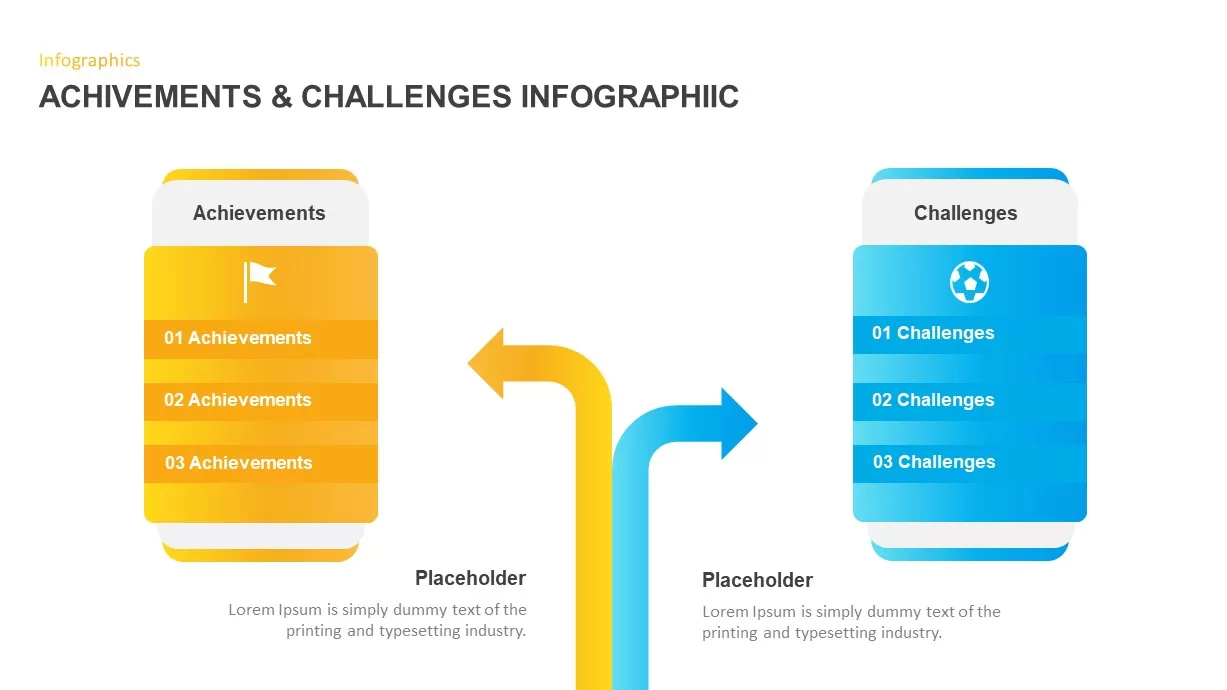
Achievements and Challenges Comparative Infographic Template for PowerPoint & Google Slides
Opportunities Challenges
Idea Brain Concept Infographic Template for PowerPoint & Google Slides
Business Proposal
Six-Stage Road Map Infographic Timeline Template for PowerPoint & Google Slides
Roadmap
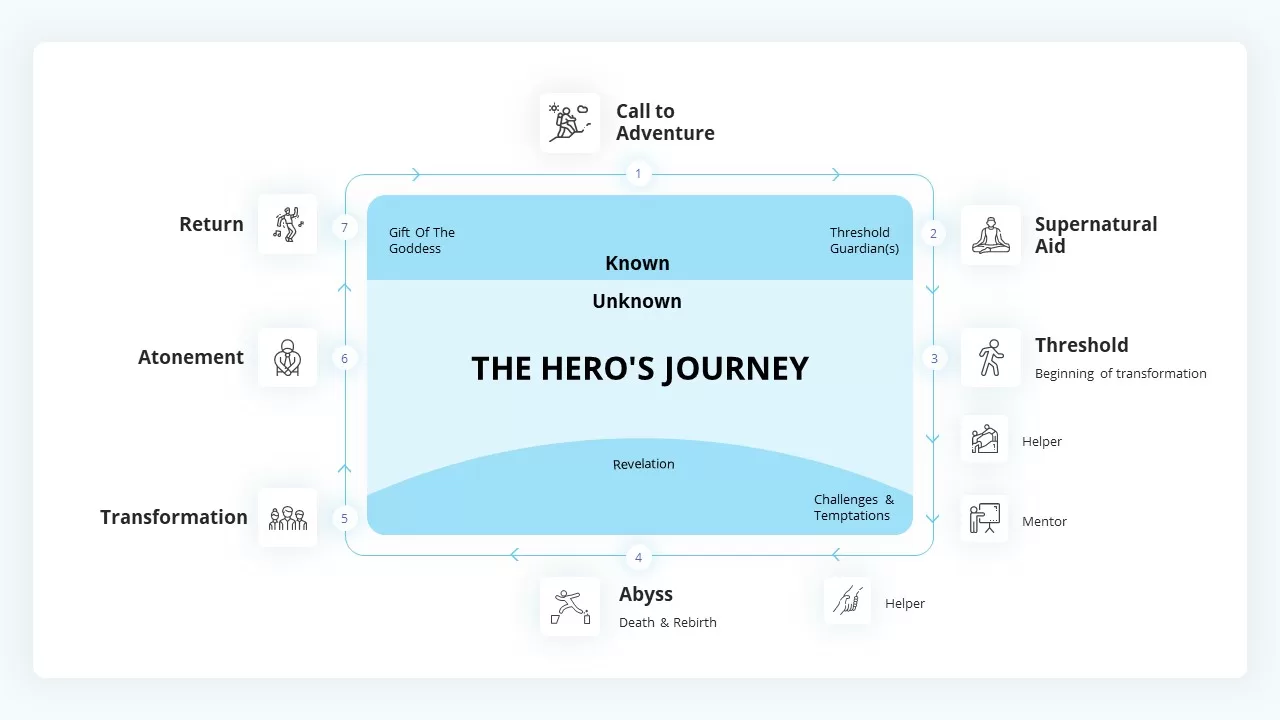
The Hero’s Journey Infographic Framework Template for PowerPoint & Google Slides
Customer Journey
30-60-90 Day Donut Chart Plan Infographic Template for PowerPoint & Google Slides
Timeline
Editable World Map Callout Infographic Template for PowerPoint & Google Slides
World Maps
Traffic Light Infographic Pack Template for PowerPoint & Google Slides
Pitch Deck
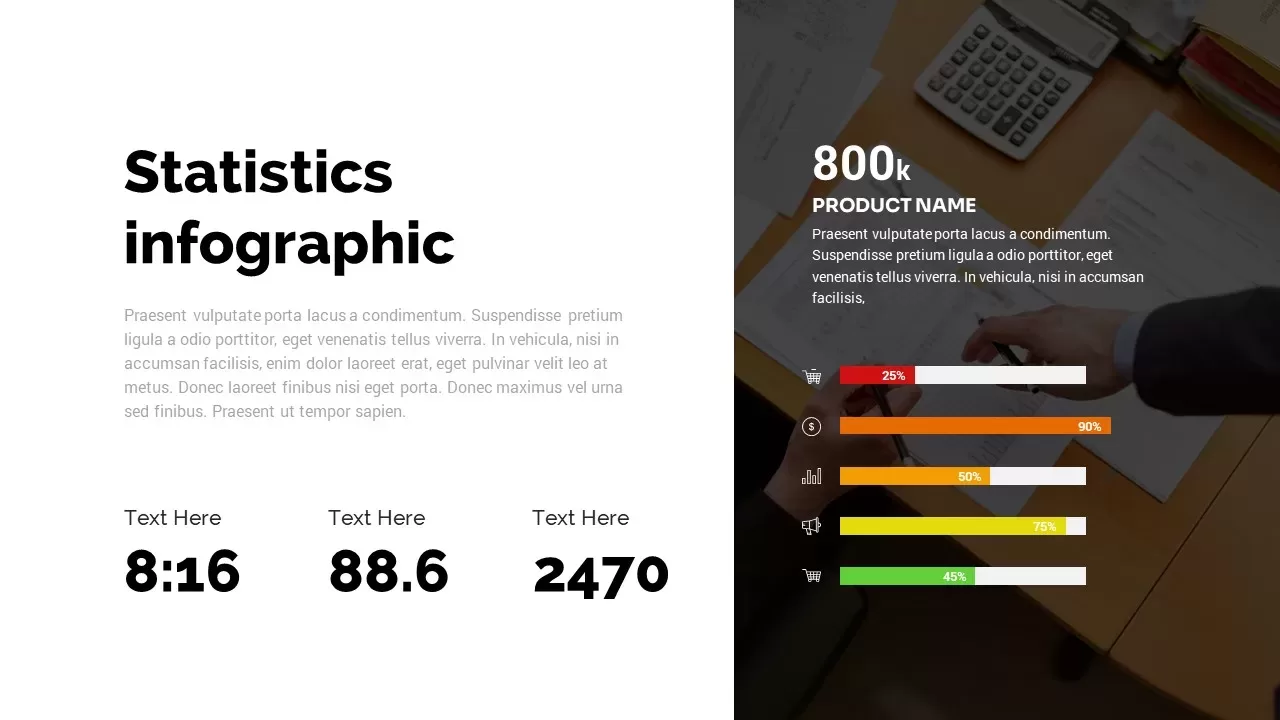
Statistics Infographic Template for PowerPoint & Google Slides
Bar/Column
Editable Monthly Timeline Infographic Template for PowerPoint & Google Slides
Timeline
Four-Step Content Audit Infographic Template for PowerPoint & Google Slides
Process
Animated Water Drop Ripple Infographic Template for PowerPoint & Google Slides
Graphics
Six Colorful Gear Shapes Infographic Template for PowerPoint & Google Slides
Process
Free
European Union Map Infographic Template for PowerPoint & Google Slides
World Maps
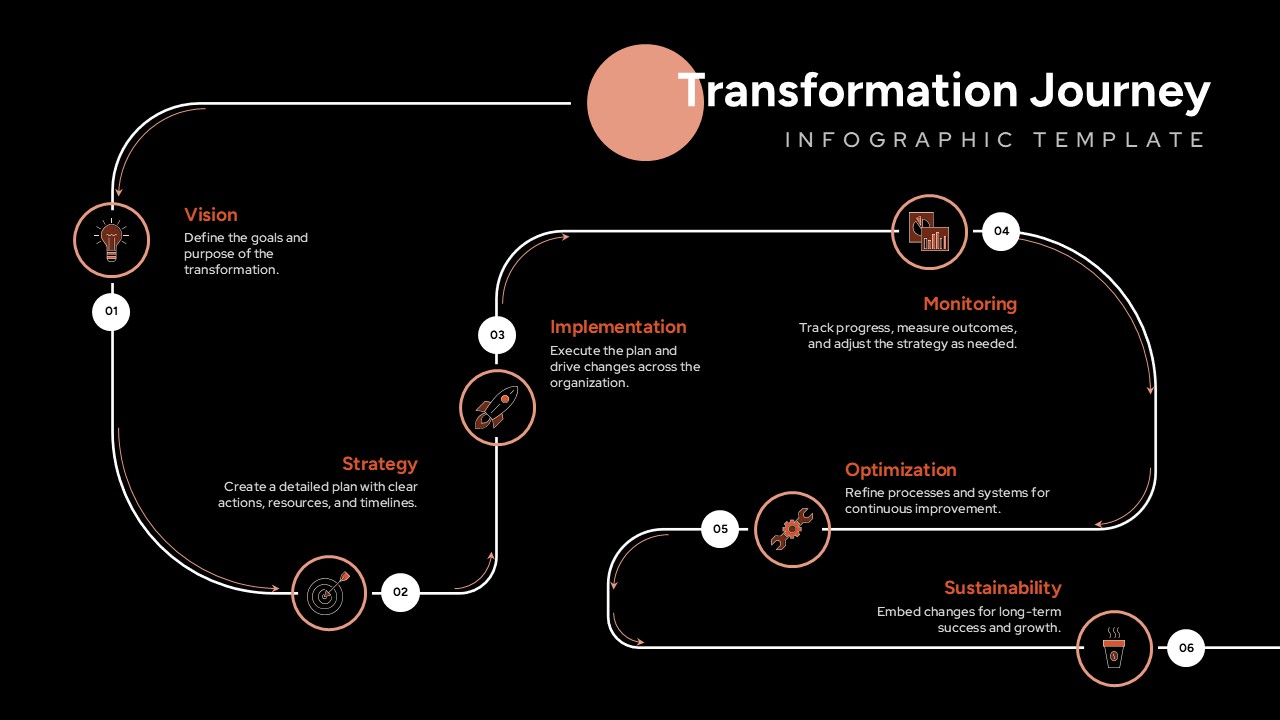
Transformation Journey Infographic Template for PowerPoint & Google Slides
Process