Line Graph Analysis template for PowerPoint & Google Slides


Description
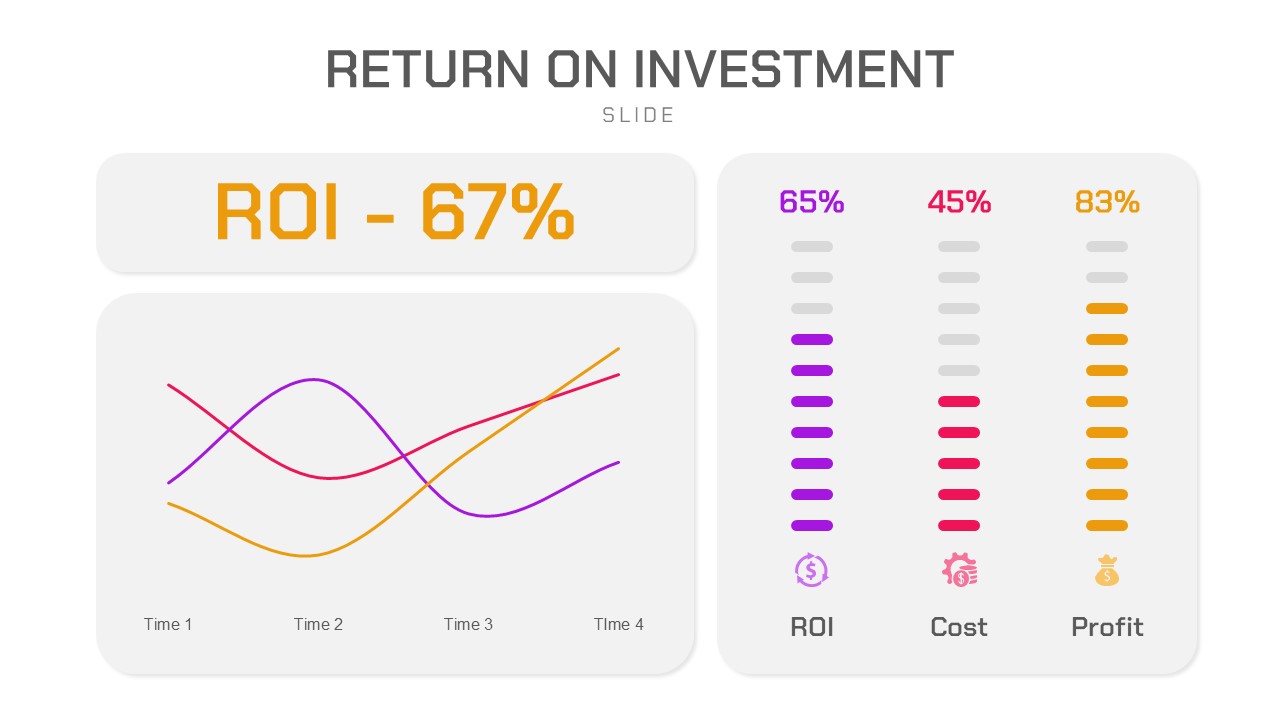
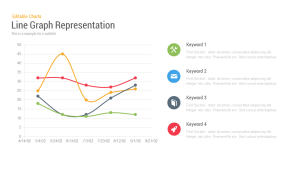
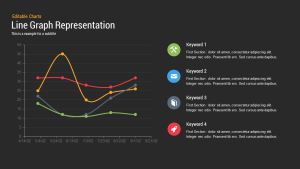
Visualize multi-variable performance trends with this clean, dark-themed Line Graph Analysis template. The left panel showcases a multi-line graph plotting data over ten intervals, each line in a distinct color (yellow, red, blue, green) for immediate visual separation. On the right, four corresponding color-coded keyword blocks summarize each dataset with iconography and placeholder descriptions—ideal for explaining fluctuations, KPIs, or comparisons. The chart’s dark background enhances legibility, while the simple layout focuses attention on data interpretation. Easily customizable, this slide helps you present business metrics, financial reports, or user behavior insights clearly and professionally on PowerPoint and Google Slides.
Who is it for
This template suits data analysts, business consultants, financial officers, and marketing strategists who need to present comparative line trends efficiently. Educators and researchers can use it to display experimental or historical data, while project managers can illustrate timelines or metric changes across phases.
Other Uses
Repurpose this layout for customer satisfaction tracking, website performance reviews, or budget variance analysis. Replace icons and labels to convert it into a project milestone tracker, product growth report, or multivariate process comparison. The flexible color-coded legends ensure clear storytelling across industries.
Login to download this file

Item ID
SB00059
Related Templates

Multi-Series Curved Line Graph Analytics Template for PowerPoint & Google Slides
Comparison Chart
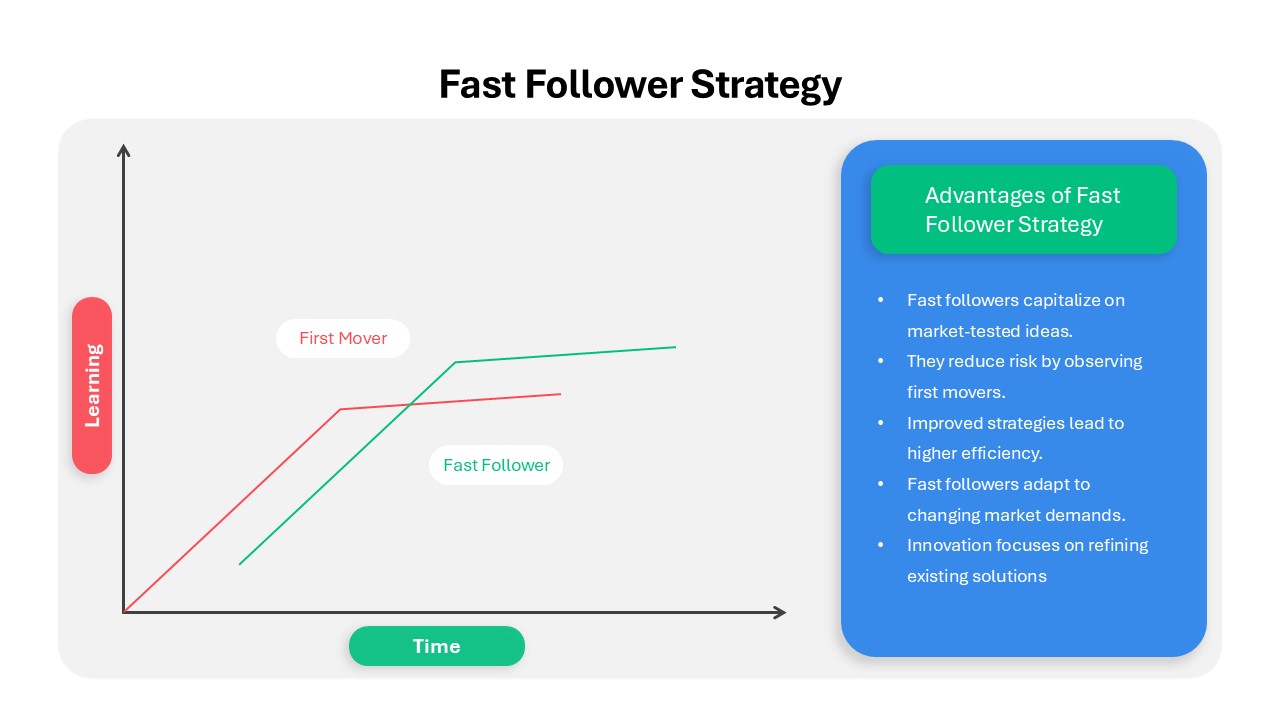
Fast Follower Strategy Line Graph Template for PowerPoint & Google Slides
Comparison Chart
Curved Line Graph for PowerPoint & Google Slides
Timeline

Line Chart Analysis template for PowerPoint & Google Slides
Charts
Dynamic Financial Analysis Line Chart Template for PowerPoint & Google Slides
Finance
Circle Graph Data Visualization Template for PowerPoint & Google Slides
Circular

3D Bar Graph Infographic Template for PowerPoint & Google Slides
Bar/Column

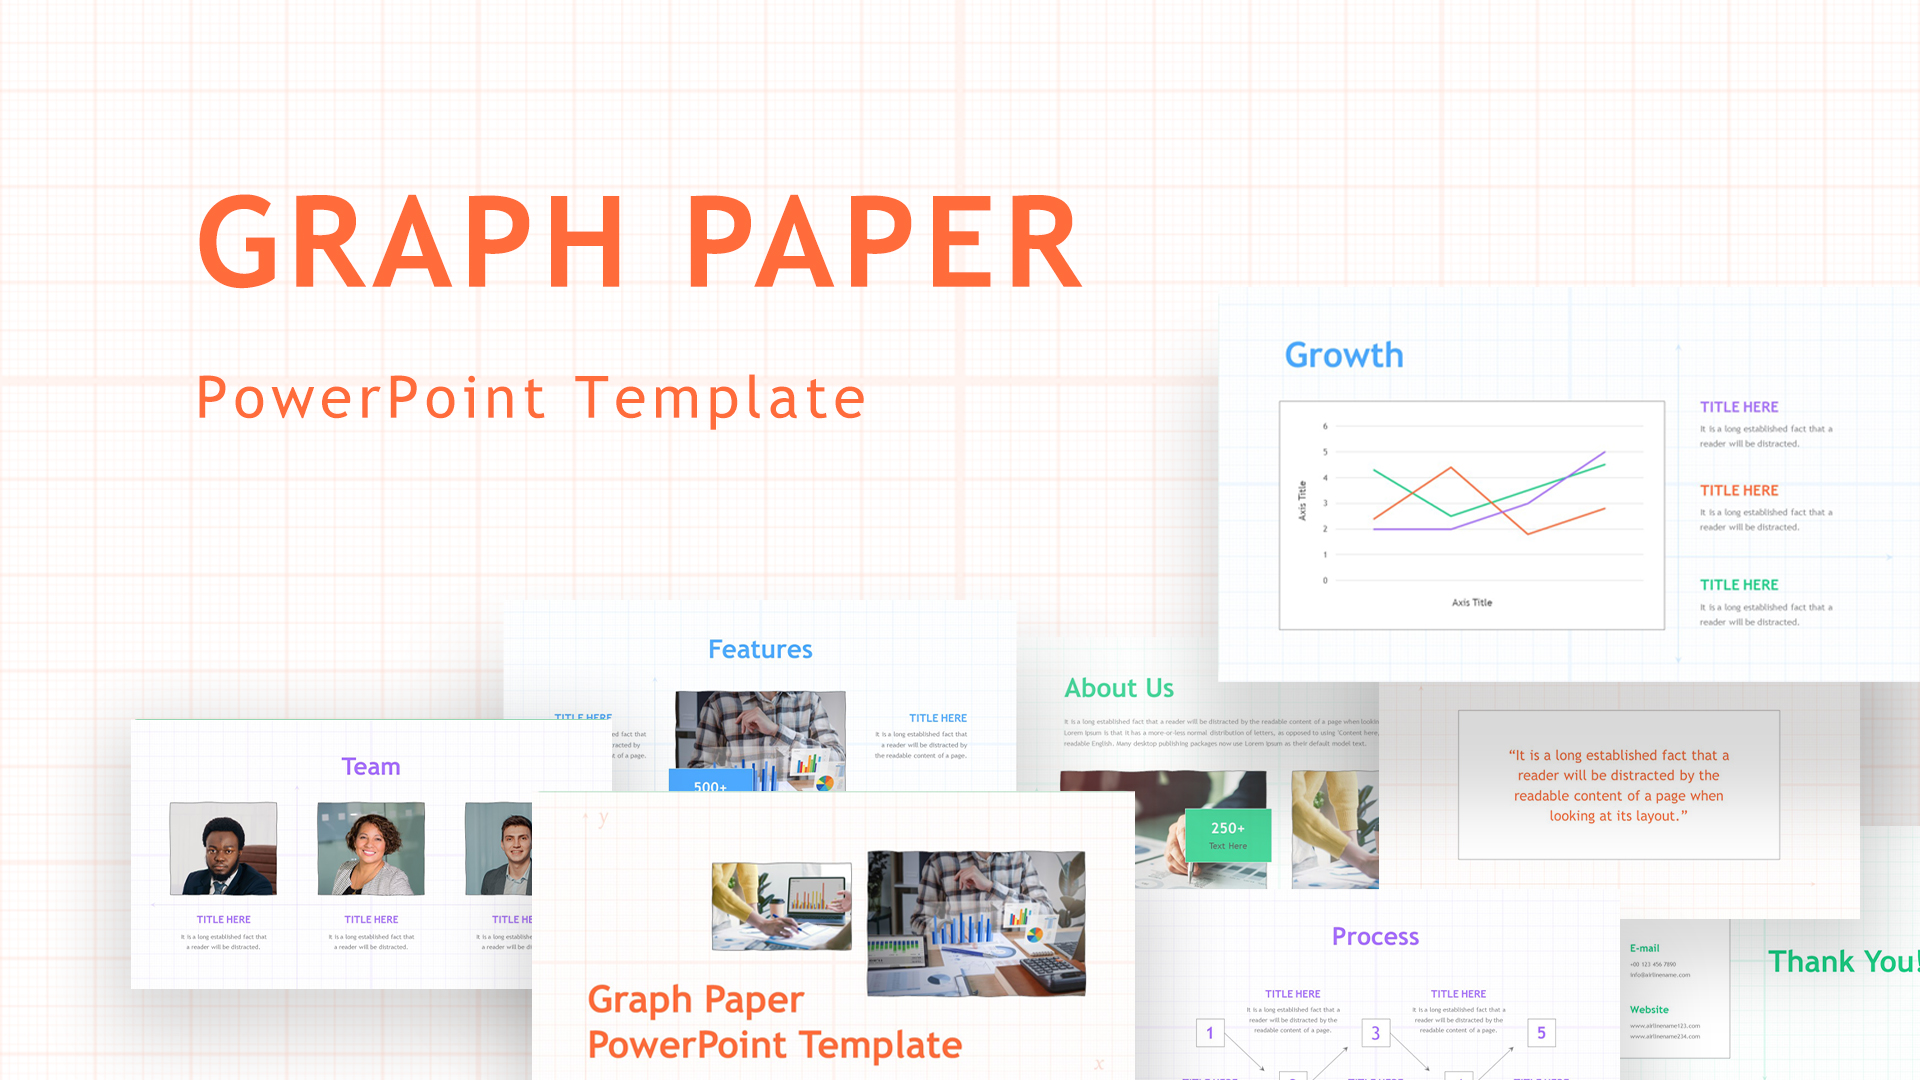
Graph Paper Background Presentation Template for PowerPoint & Google Slides
Company Profile
Blank Bar Graph Template for PowerPoint & Google Slides
Bar/Column
Progress Bar Graph Layout Design for PowerPoint & Google Slides
Charts
Five Options Business Bar Graph for PowerPoint & Google Slides
Business Report

Application Revenue Line Chart KPI Template for PowerPoint & Google Slides
Revenue
Sales Growth Dashboard: KPI Gauge & Line Template for PowerPoint & Google Slides
Revenue
Combination Bar and Line Chart Template for PowerPoint & Google Slides
Bar/Column
Editable Multi-Series Peak Line Chart Template for PowerPoint & Google Slides
Comparison Chart
Arrow Line Chart Template for PowerPoint & Google Slides
Comparison Chart
Data Over Time Line Chart template for PowerPoint & Google Slides
Charts
Growth Curve Line Chart Visualization Template for PowerPoint & Google Slides
Charts
Evolution Line Chart with Milestones Template for PowerPoint & Google Slides
Timeline
Multiple Line Chart Comparison Template for PowerPoint & Google Slides
Comparison Chart
Multi-Series Line Chart with Icons Template for PowerPoint & Google Slides
Comparison Chart
Interactive Jump Line Data Chart Template for PowerPoint & Google Slides
Comparison Chart
Skimming Pricing Strategy Line Chart Template for PowerPoint & Google Slides
Business Strategy
Creative Clothing Line Presentation Template for PowerPoint & Google Slides
Pitch Deck
3Ps Triple Bottom Line Venn Diagram Template for PowerPoint & Google Slides
Circular
4 People Racing to Finish Line Template for PowerPoint & Google Slides
Accomplishment
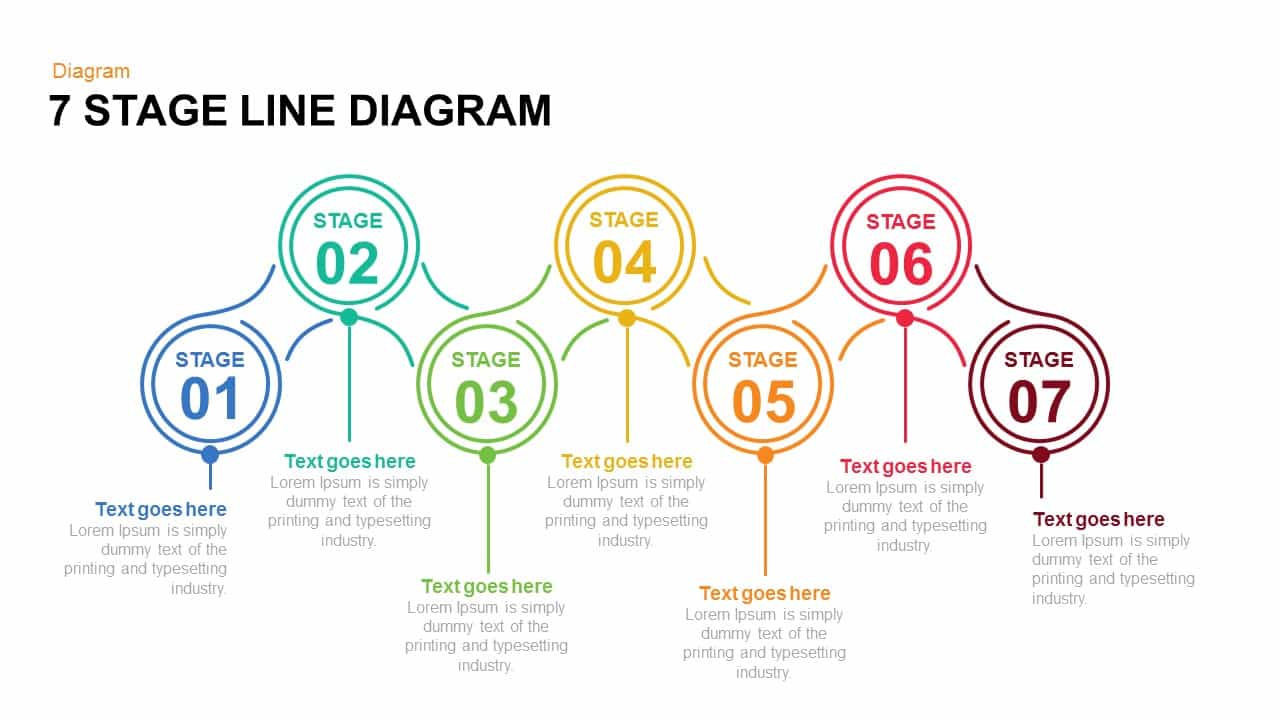
7 and 6 Stage Line Diagram Overview for PowerPoint & Google Slides
Infographics
Five and Six Step Line Linear Stage Diagram for PowerPoint & Google Slides
Infographics
3D Line Chart for PowerPoint & Google Slides
Charts
Data-Driven Line Chart Diagram Template for PowerPoint
Comparison Chart
PEST Analysis PowerPoint Template for PowerPoint & Google Slides
Business Strategy
Donut Split Analysis template for PowerPoint & Google Slides
Pie/Donut
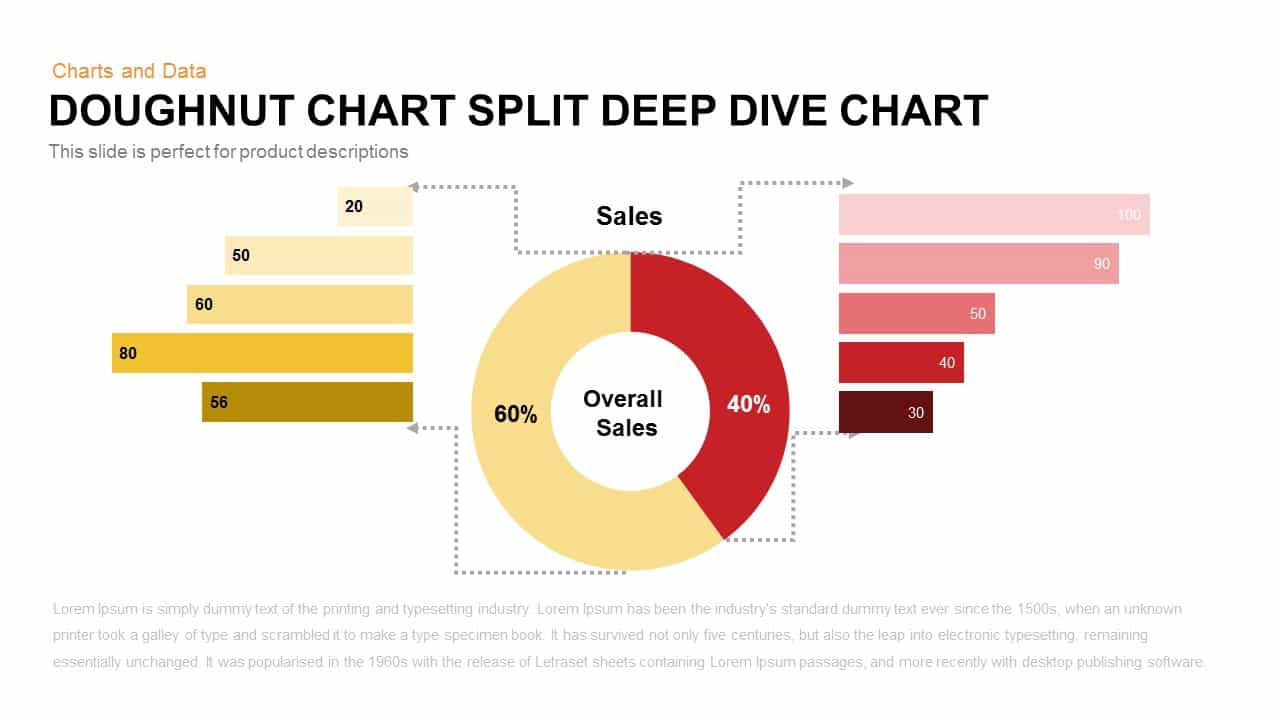
Split Doughnut Deep Dive Sales Analysis Template for PowerPoint & Google Slides
Pie/Donut
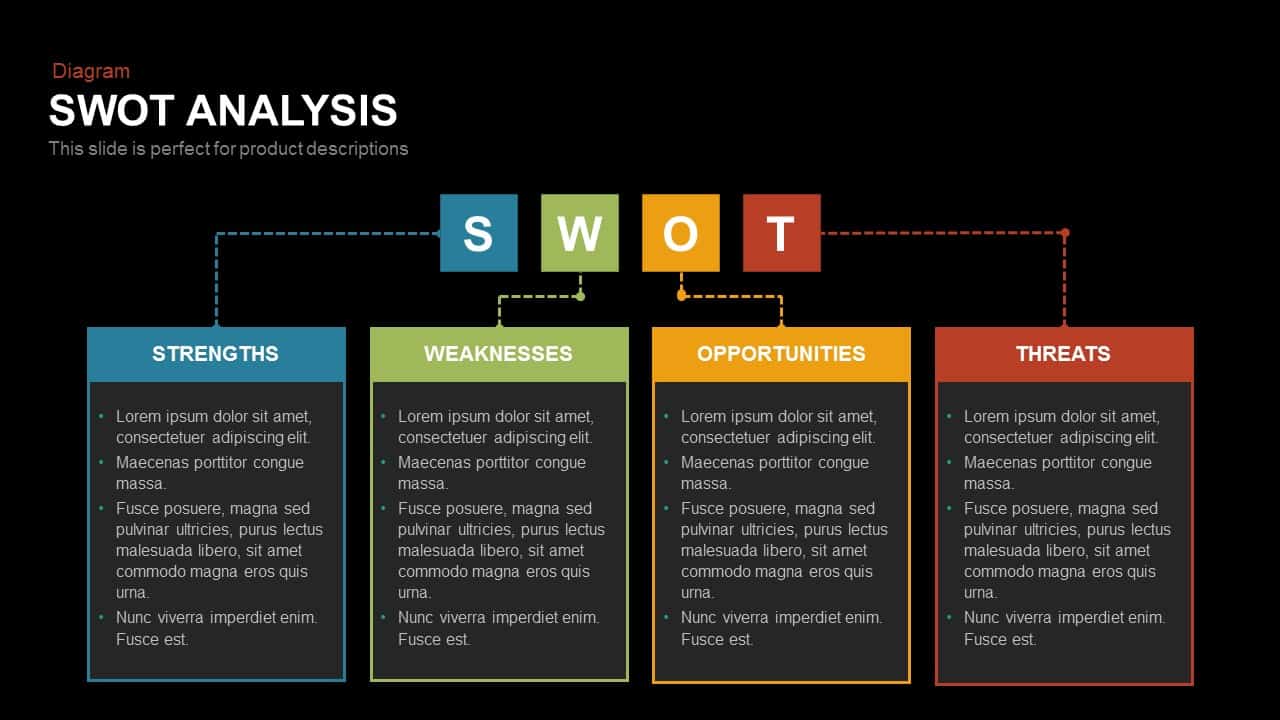
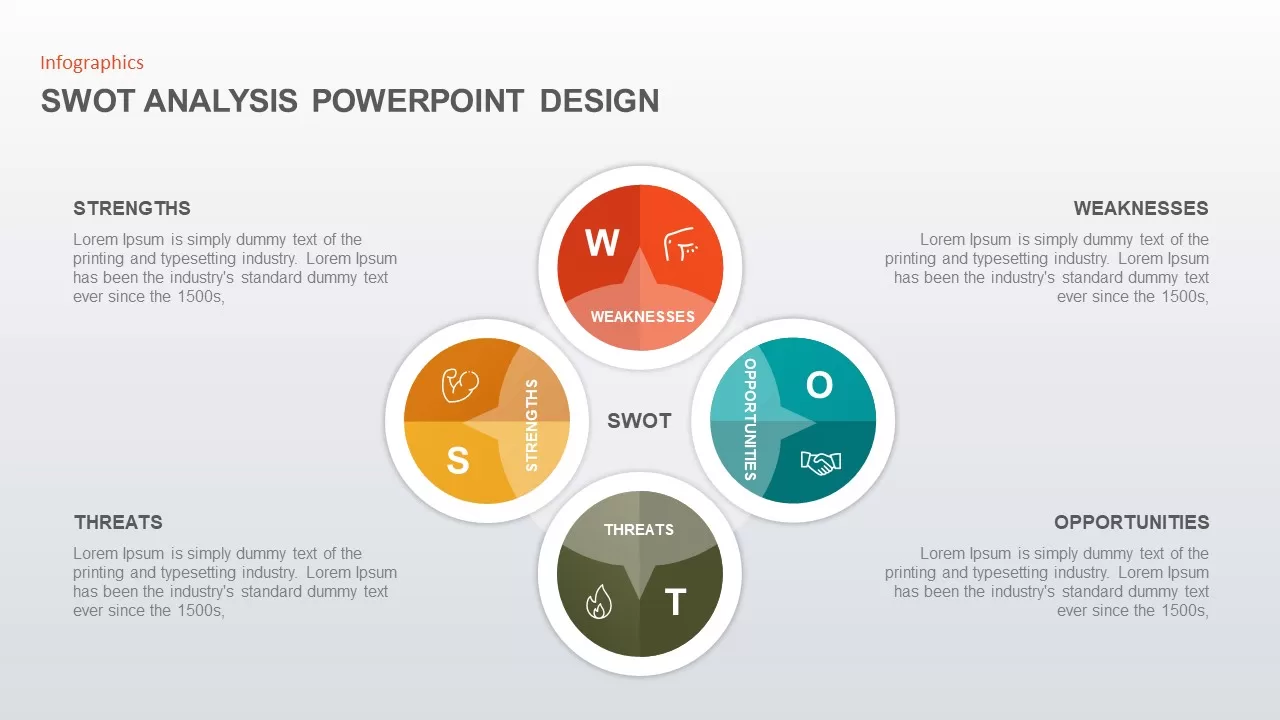
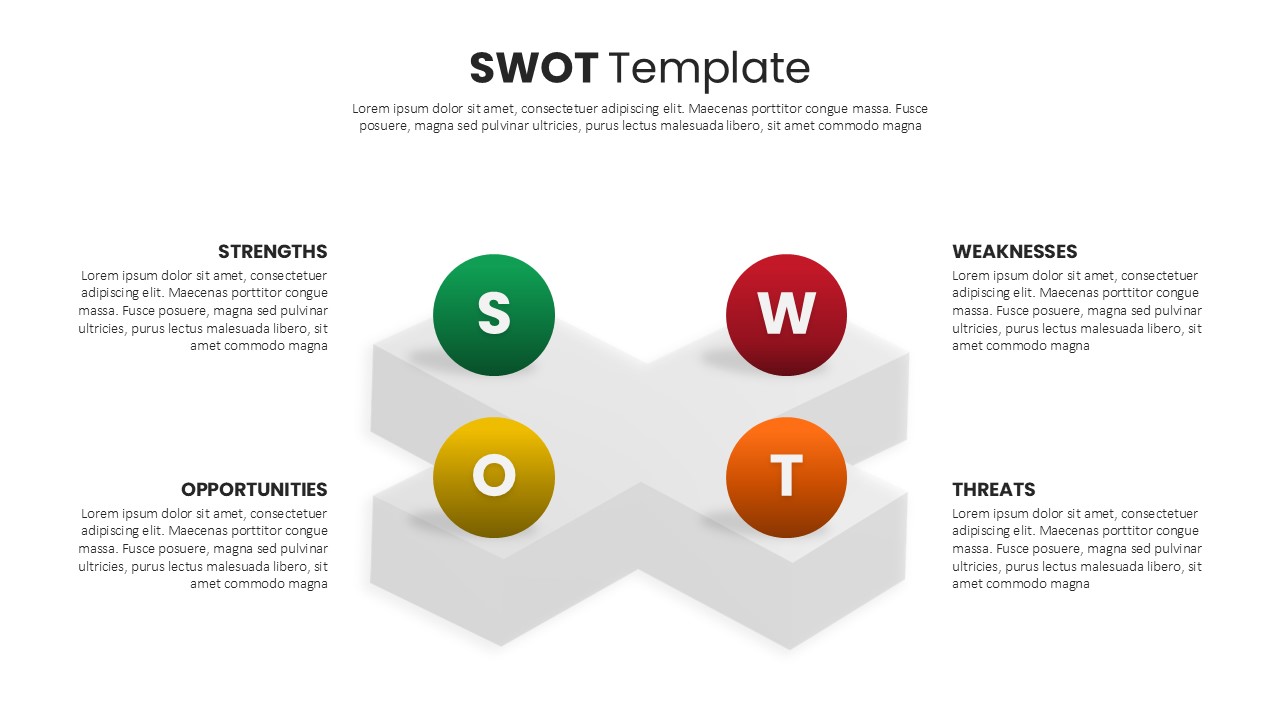
SWOT Analysis template for PowerPoint & Google Slides
SWOT
Free SWOT Analysis template for PowerPoint & Google Slides
SWOT
Free
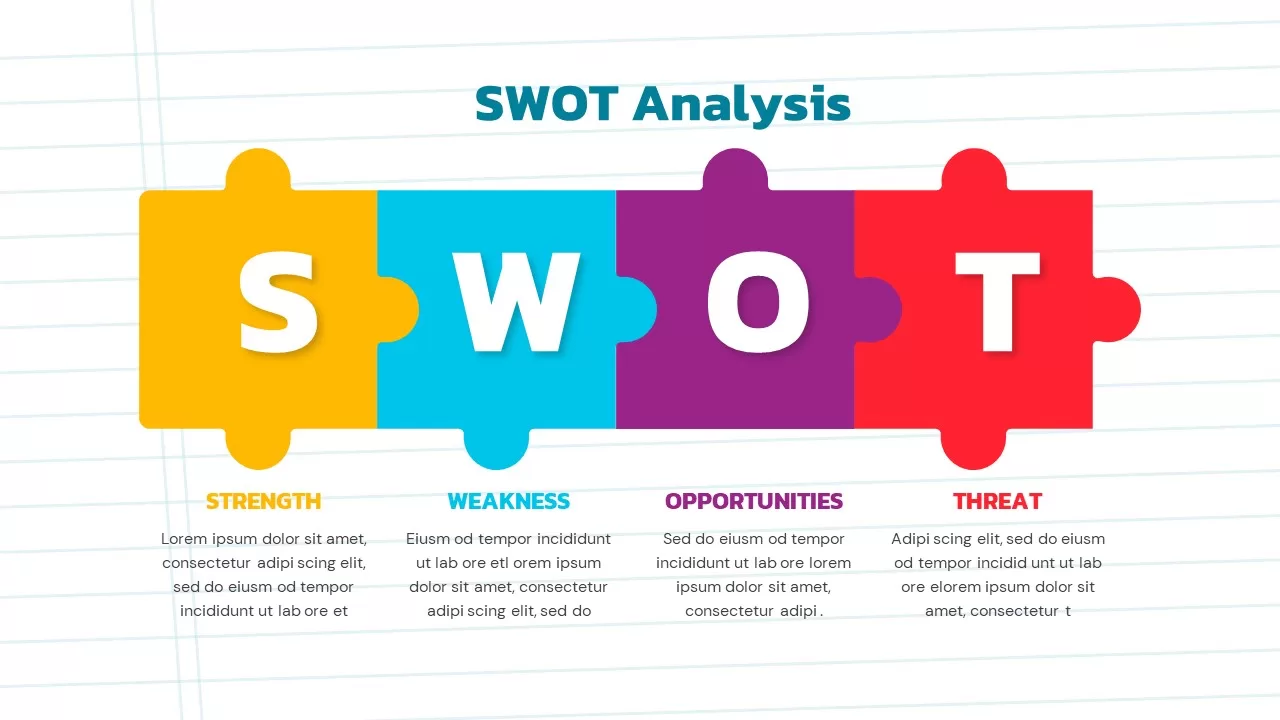
Puzzle-Style SWOT Analysis Table Diagram Template for PowerPoint & Google Slides
SWOT
PEST Analysis Circular Diagram Template for PowerPoint & Google Slides
PEST
PESTLE Analysis Table Layout Diagram Template for PowerPoint & Google Slides
PEST
SWOT Analysis Gear Diagram Slide Template for PowerPoint & Google Slides
SWOT
Cluster Analysis Infographic Diagram Template for PowerPoint & Google Slides
Business
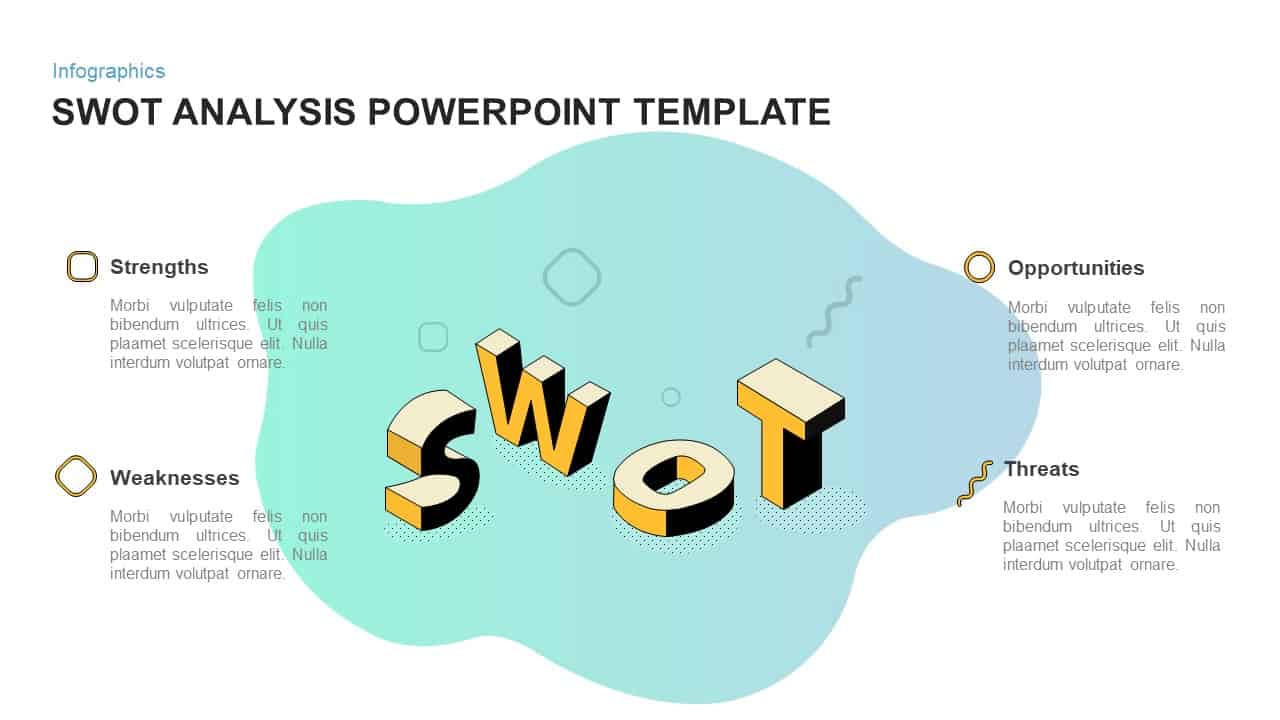
3D Blob SWOT Analysis Infographic Template for PowerPoint & Google Slides
SWOT
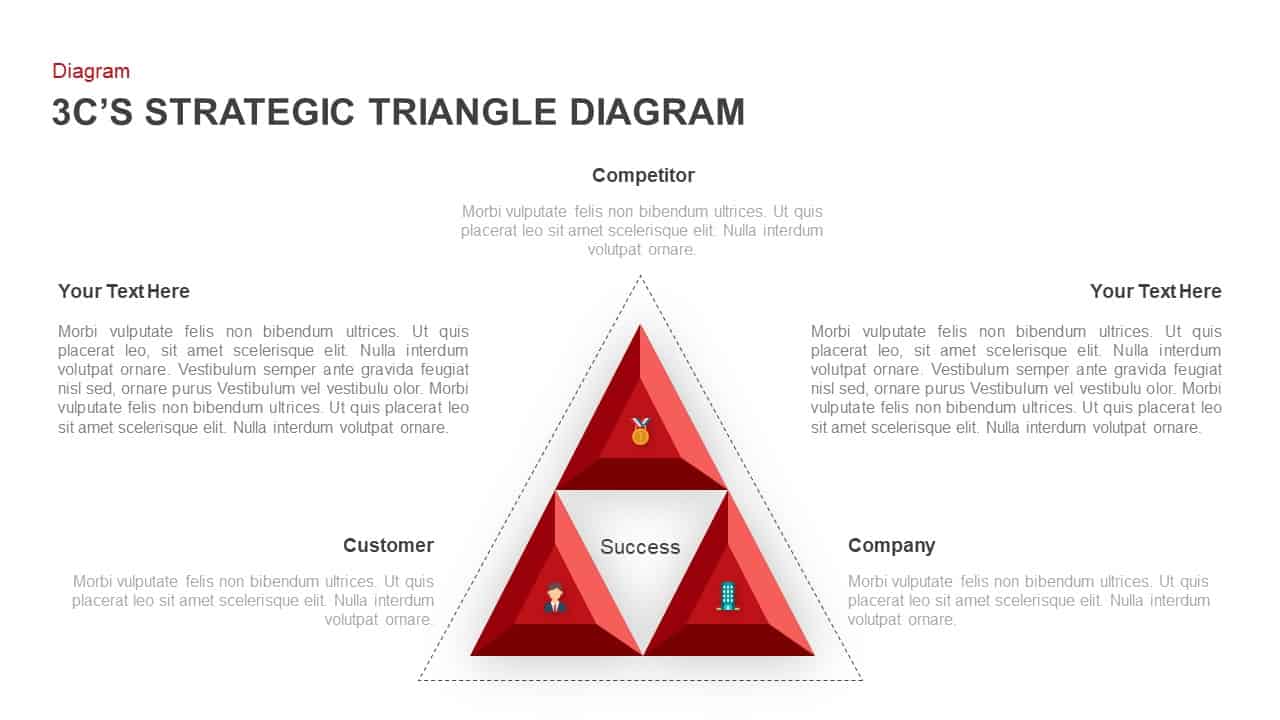
3C Strategic Triangle Analysis Template for PowerPoint & Google Slides
Competitor Analysis
Business Target Analysis Diagram Template for PowerPoint & Google Slides
Circular
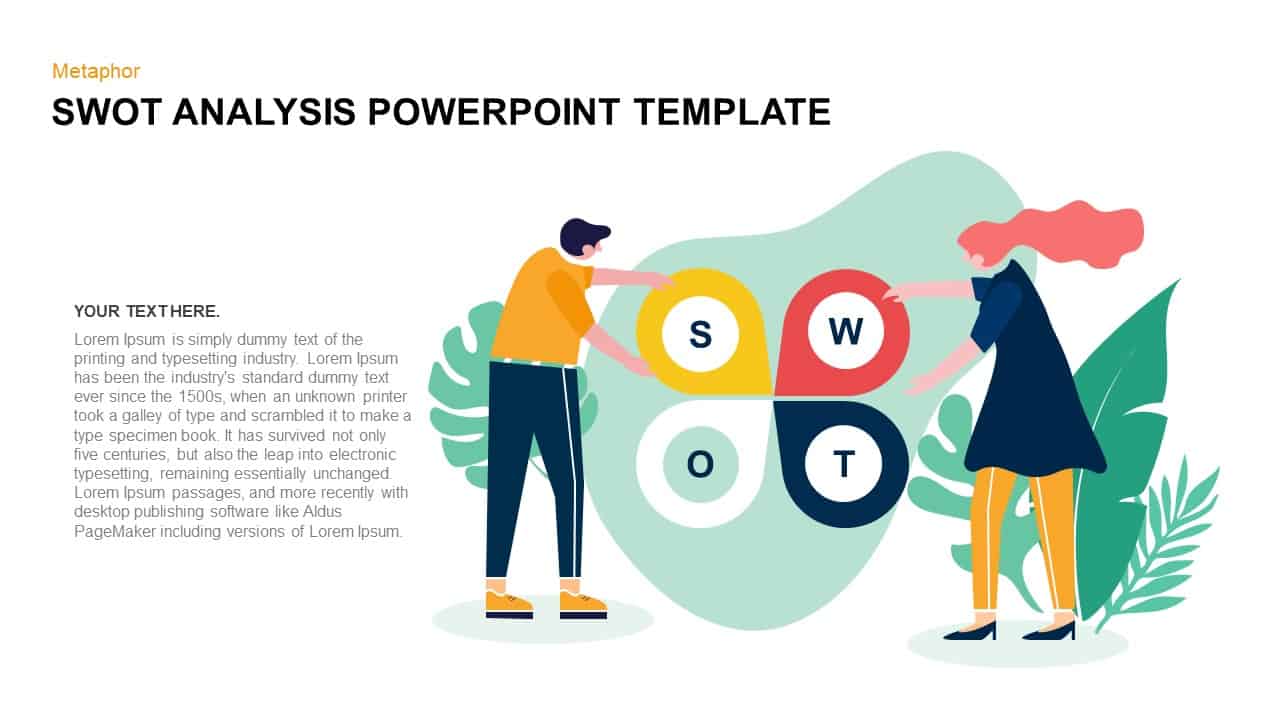
SWOT Analysis Metaphor Illustration Template for PowerPoint & Google Slides
SWOT

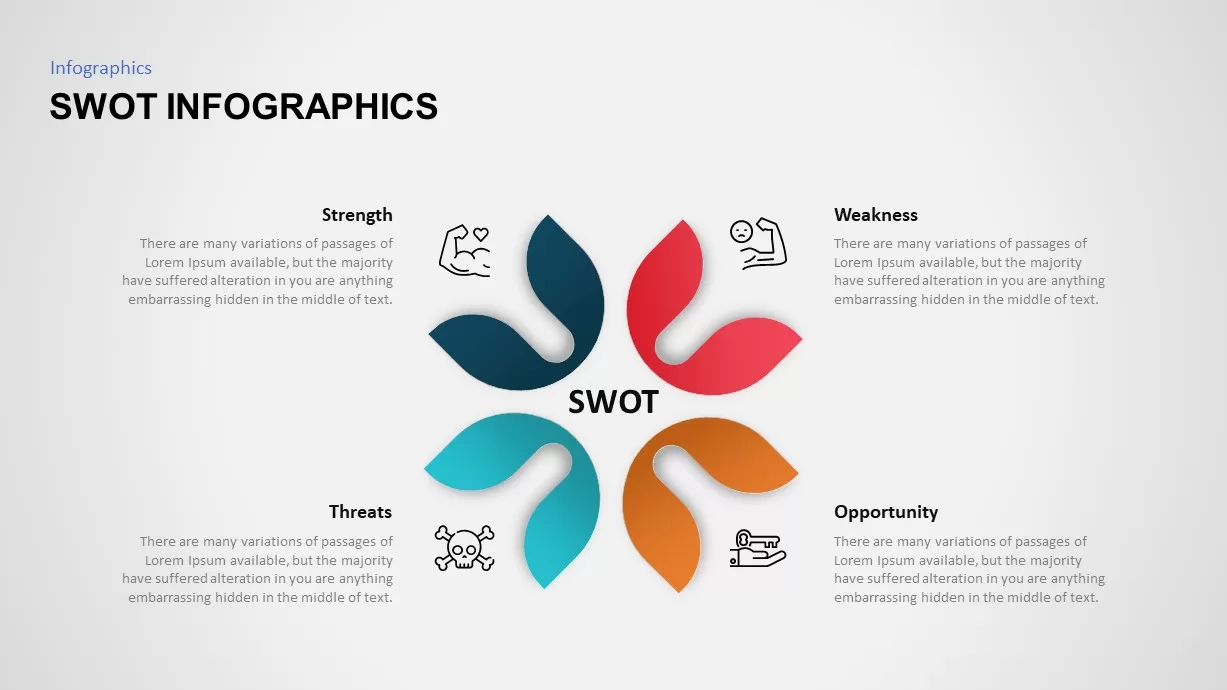
SWOT Analysis Petal Infographic Template for PowerPoint & Google Slides
SWOT
Break-Even Analysis template for PowerPoint & Google Slides
Process
Root Cause Analysis PowerPoint & Google Slides Template for Presentations
Business Strategy
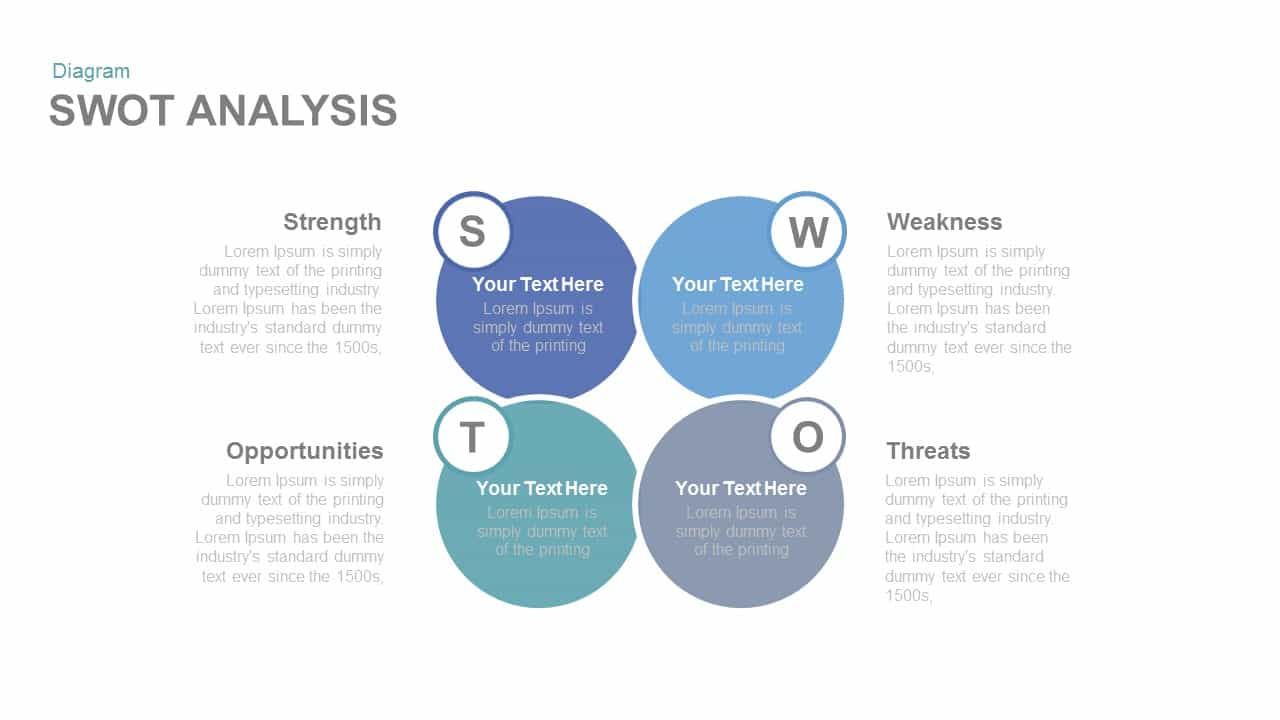
SWOT Analysis Circular Infographic Template for PowerPoint & Google Slides
SWOT
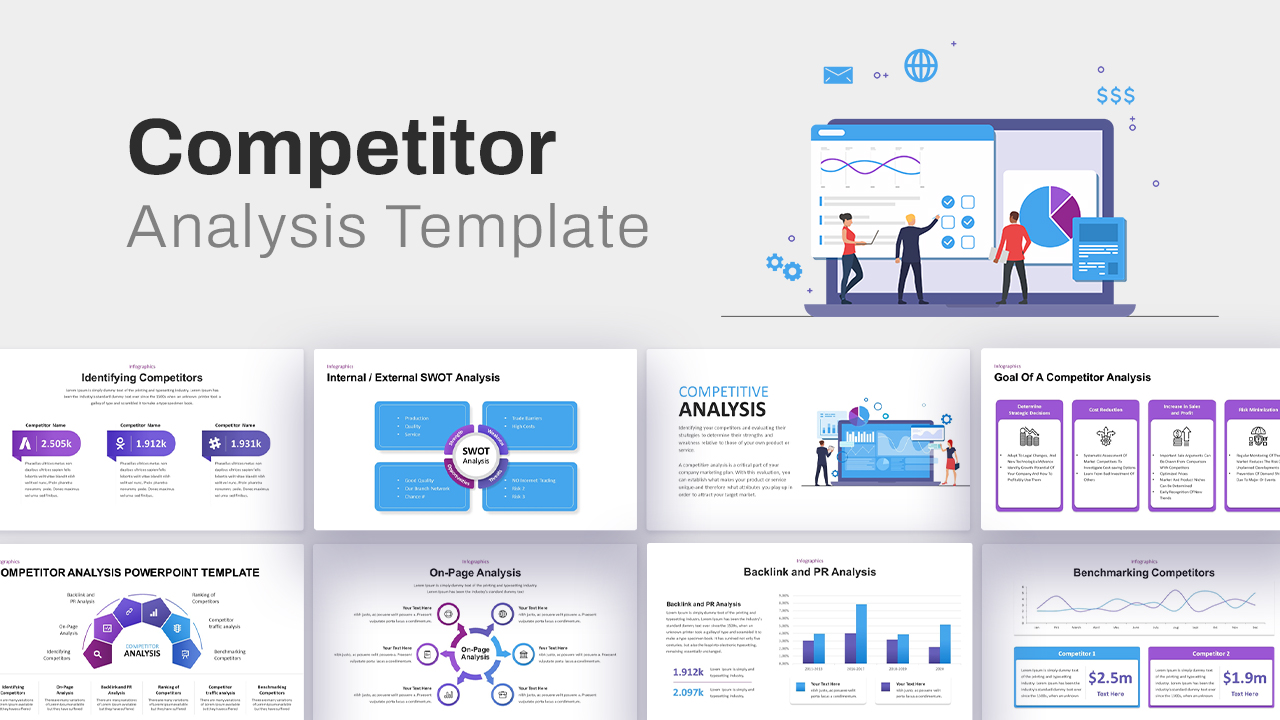
Comprehensive Competitor Analysis Template for PowerPoint & Google Slides
Competitor Analysis
Business Case Deck with Market Analysis Template for PowerPoint & Google Slides
Business Report
Sky and Tree Root Cause Analysis Deck Template for PowerPoint & Google Slides
Opportunities Challenges
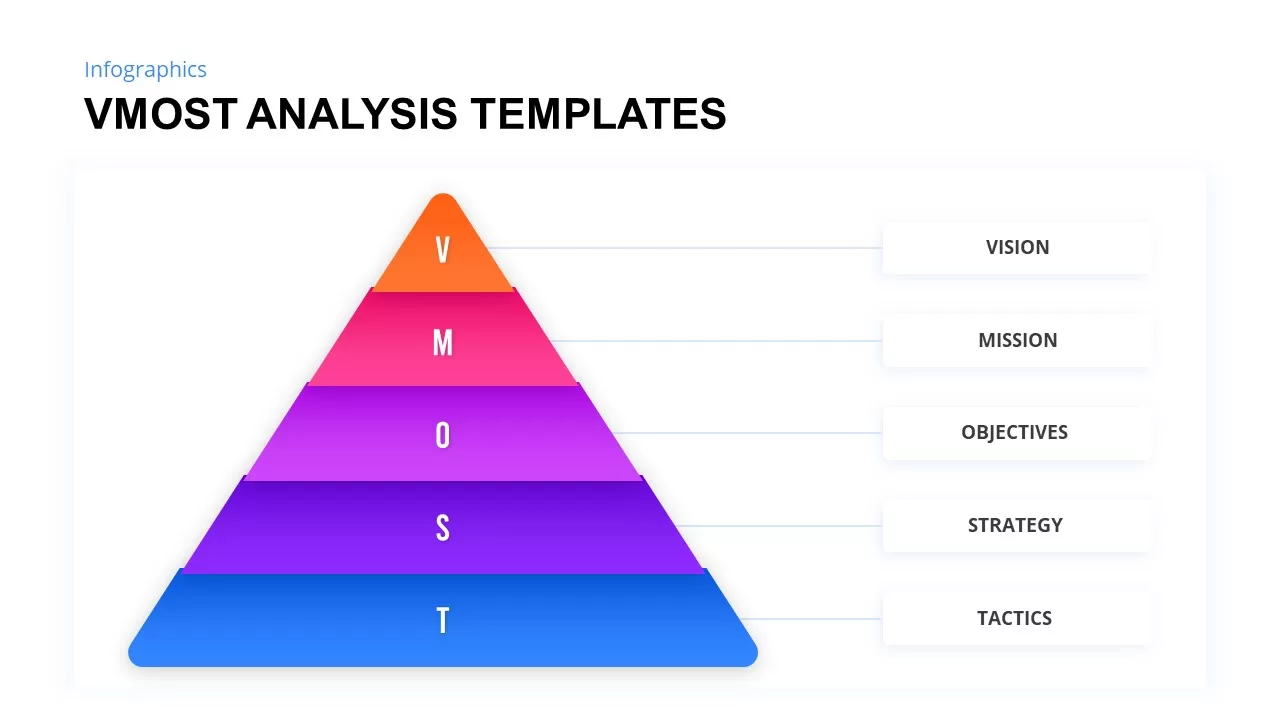
VMOST Analysis Template for PowerPoint & Google Slides
Business Strategy
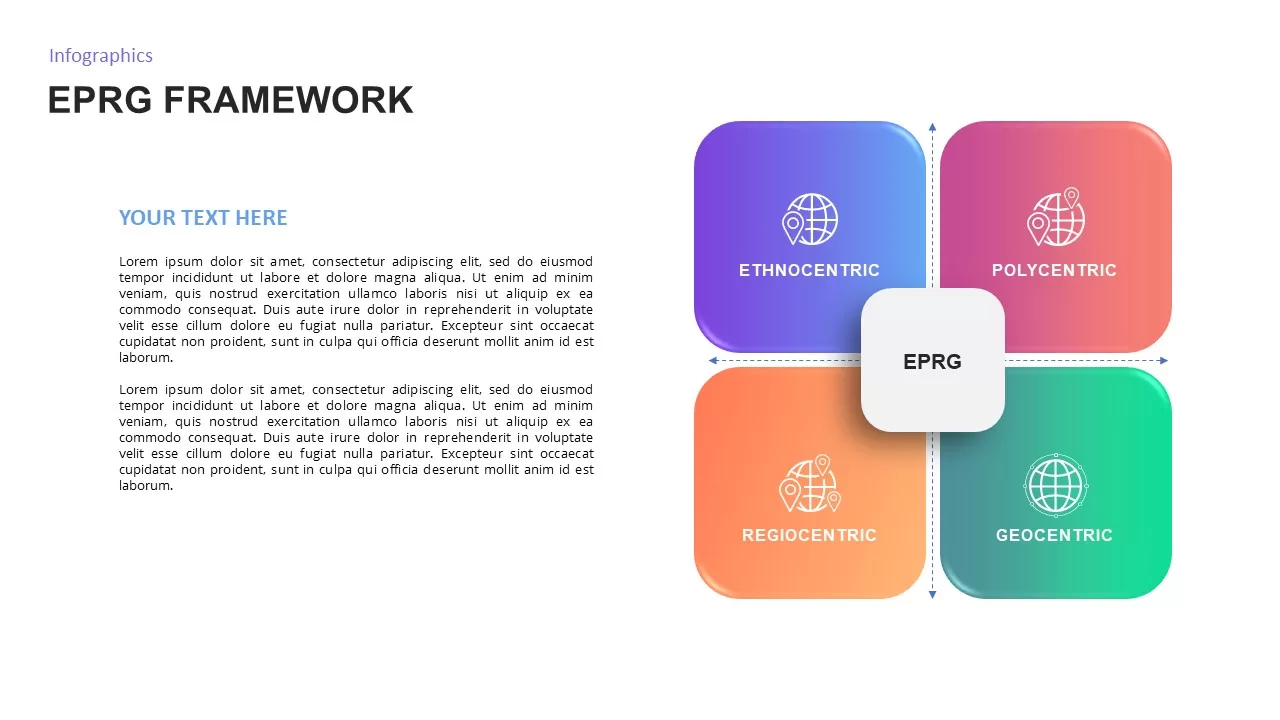
EPRG Framework Analysis template for PowerPoint & Google Slides
Business Strategy
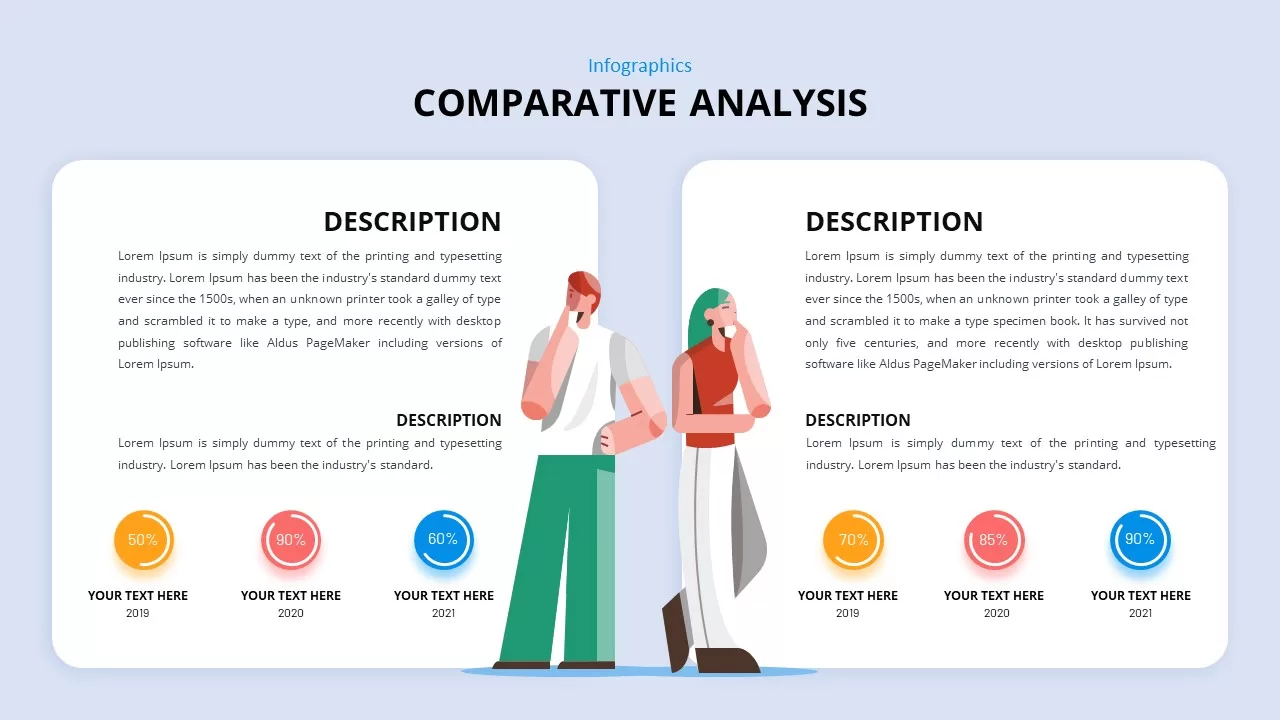
Comparative Analysis Template for PowerPoint & Google Slides
Comparison
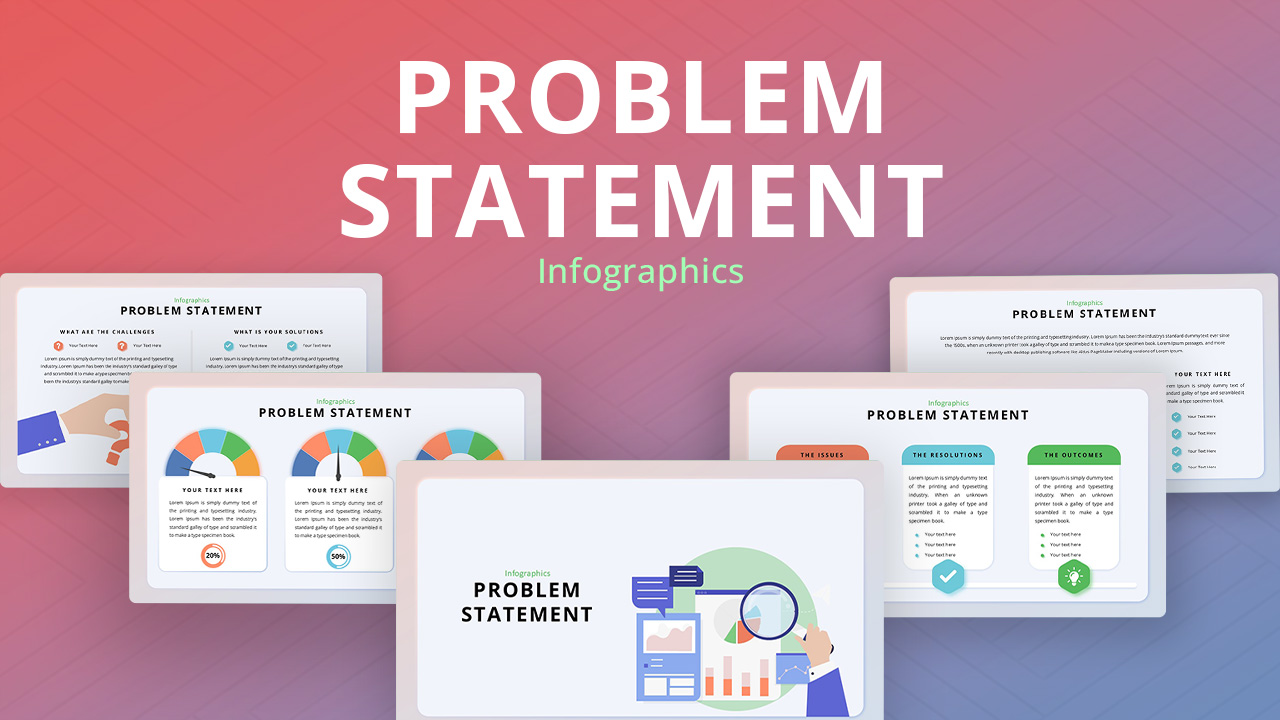
Problem Statement Analysis template for PowerPoint & Google Slides
Business Strategy
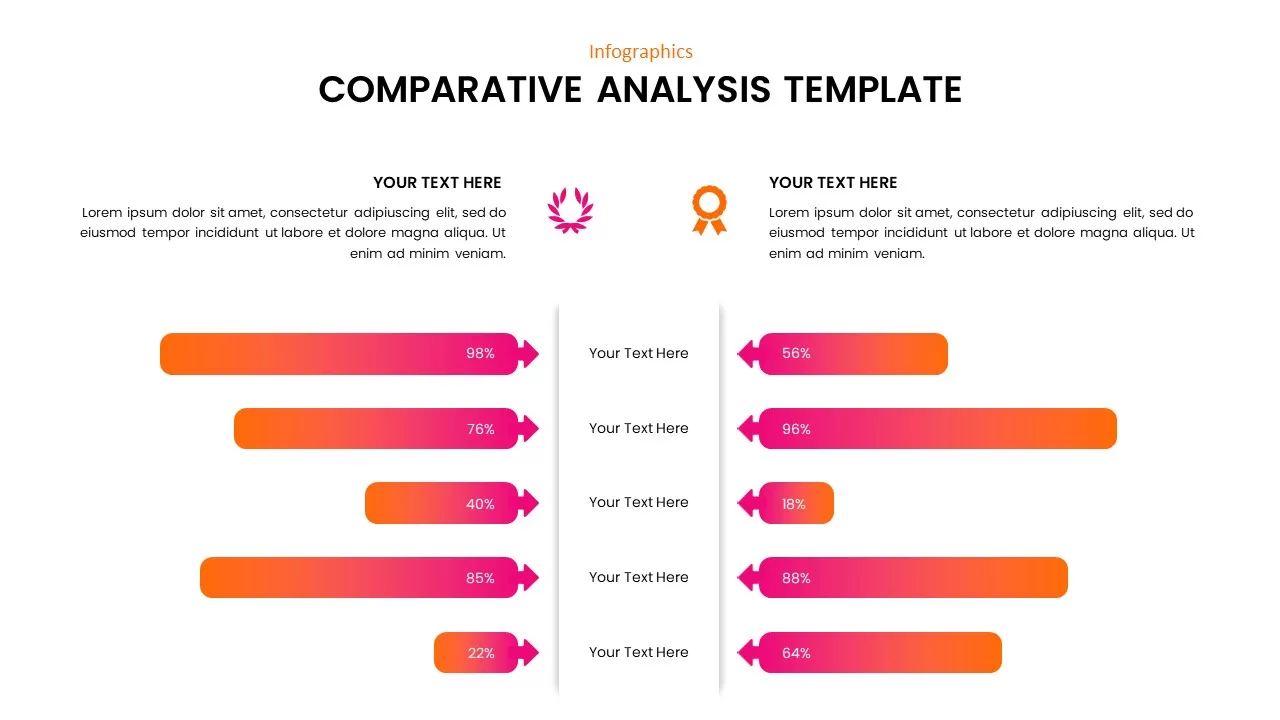
Comparative Analysis template for PowerPoint & Google Slides
Business Report
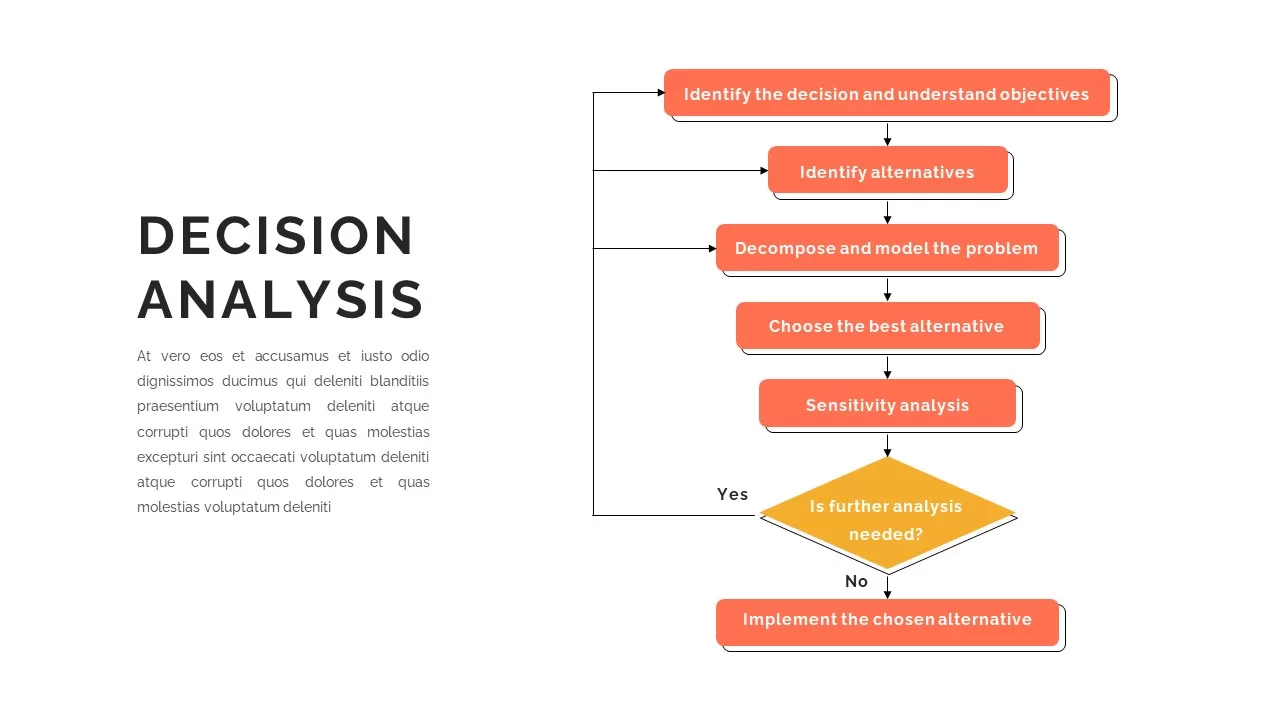
Decision Analysis Process Flowchart Template for PowerPoint & Google Slides
Flow Charts
Root Cause Analysis Infographic Pack Template for PowerPoint & Google Slides
Process
SWOT Analysis Visual Overview template for PowerPoint & Google Slides
Business Strategy
SWOT Analysis Quadrant template for PowerPoint & Google Slides
Business Strategy
Free SWOT Analysis Overview template for PowerPoint & Google Slides
SWOT
Free
SWOT Analysis template for PowerPoint & Google Slides
SWOT
Puzzle Piece SWOT Analysis Diagram Template for PowerPoint & Google Slides
Opportunities Challenges
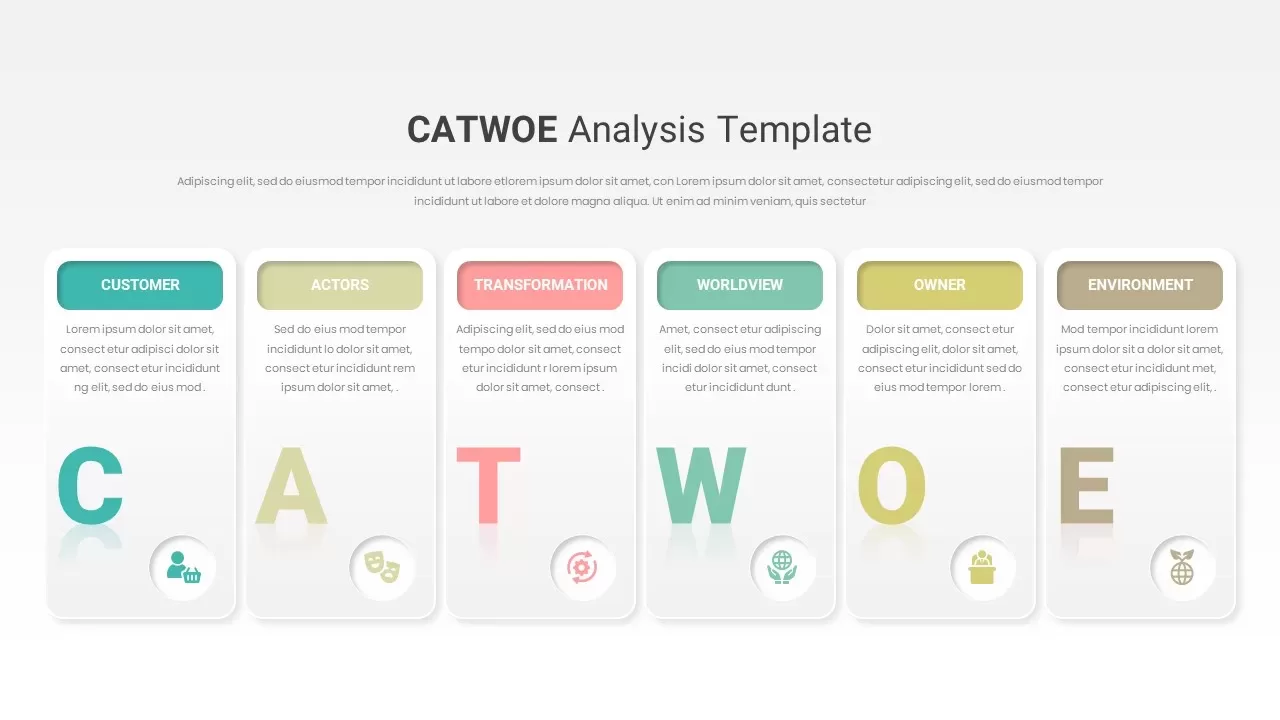
CATWOE Analysis Template for PowerPoint & Google Slides
Process
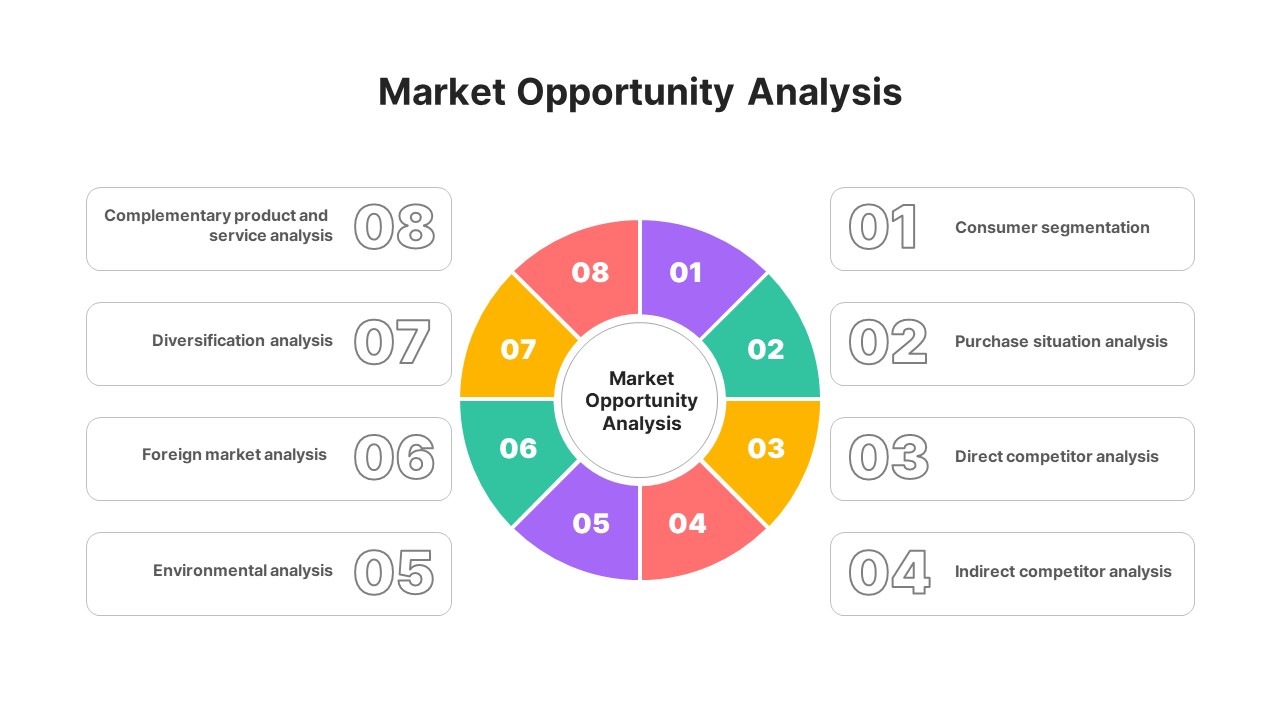
Market Opportunity Analysis Wheel template for PowerPoint & Google Slides
Business Strategy
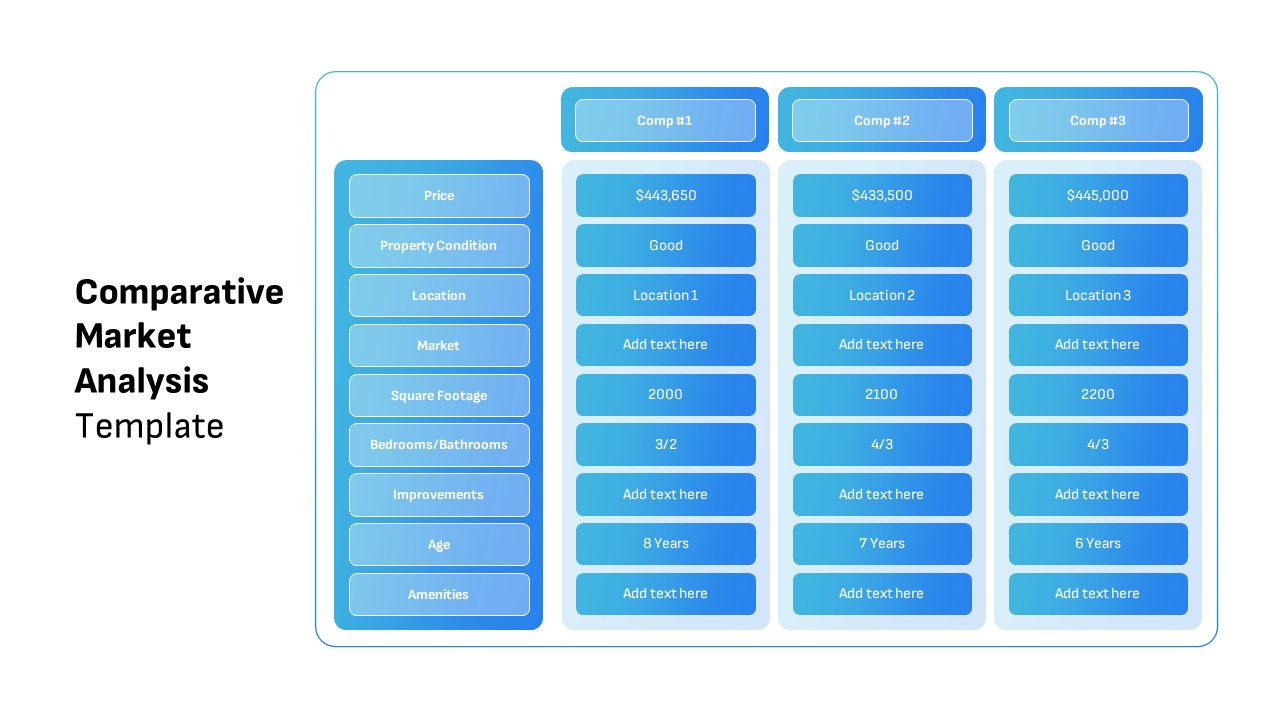
Comparative Market Analysis Template for PowerPoint & Google Slides
Comparison
Return on Investment (ROI) Analysis template for PowerPoint & Google Slides
Business Report
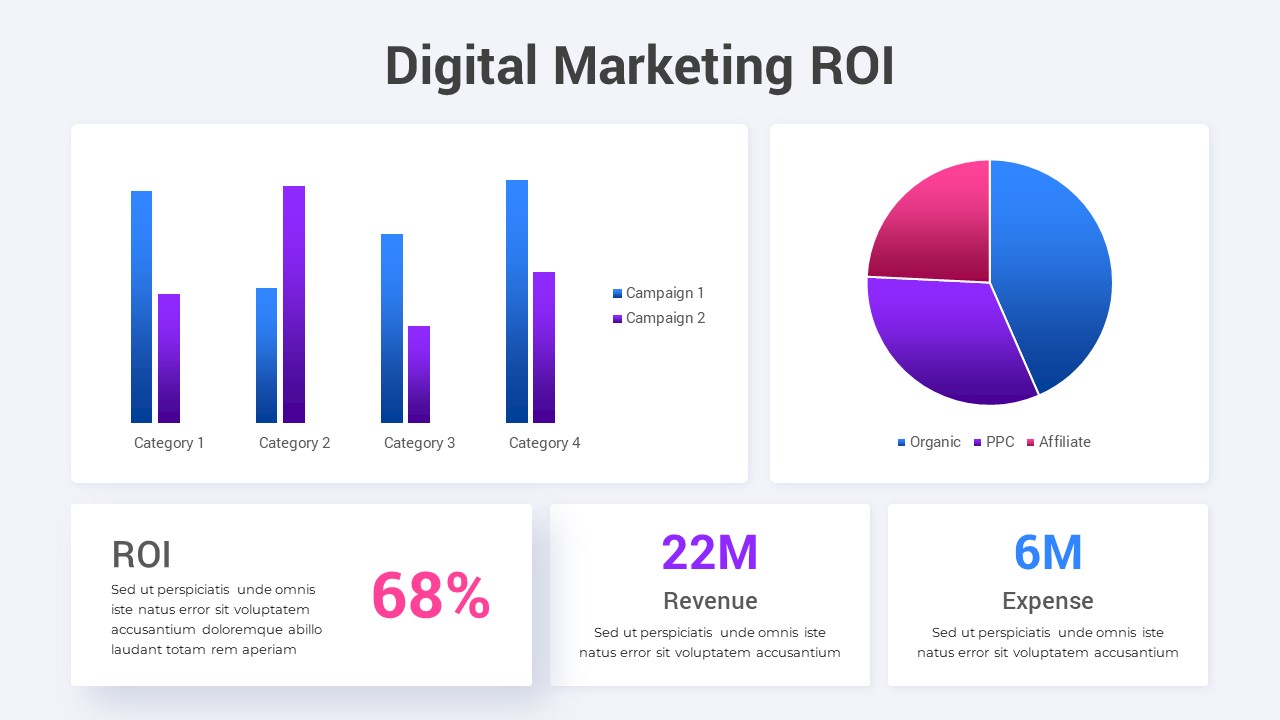
Digital Marketing ROI Analysis template for PowerPoint & Google Slides
Digital Marketing
Risk Pyramid Hierarchy Analysis Template for PowerPoint & Google Slides
Pyramid
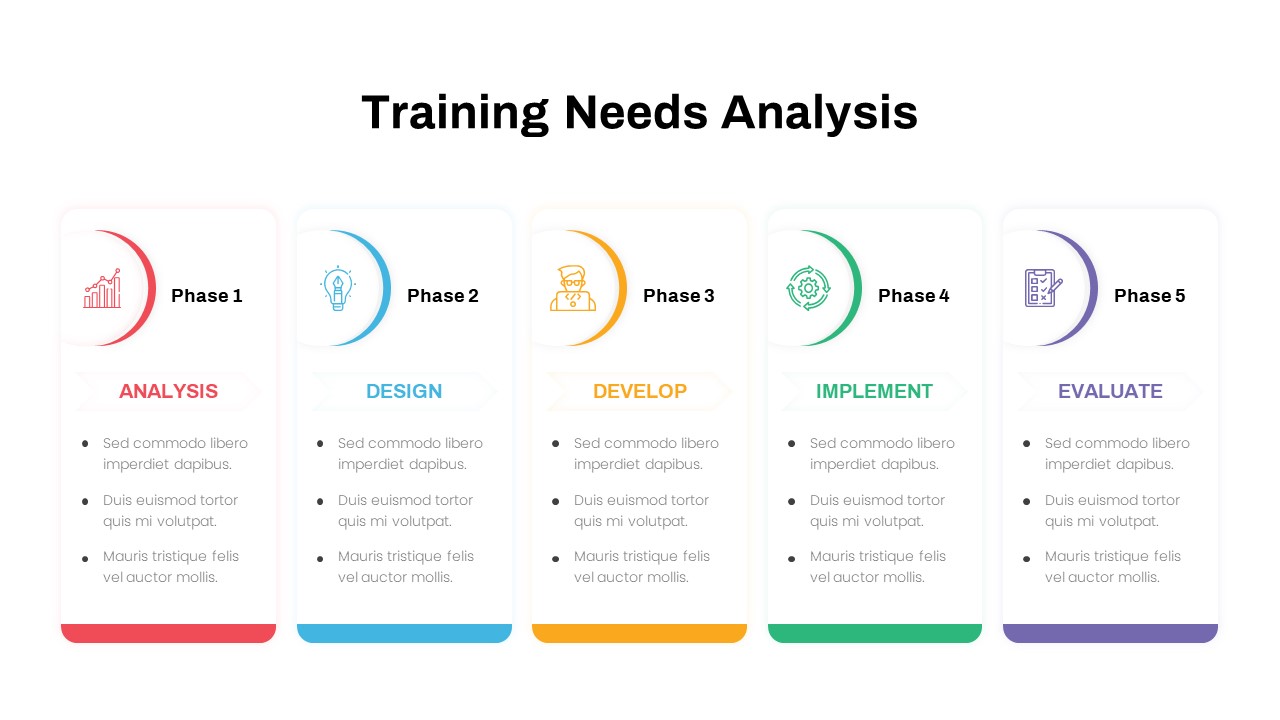
Training Needs Analysis Process Template for PowerPoint & Google Slides
Employee Performance
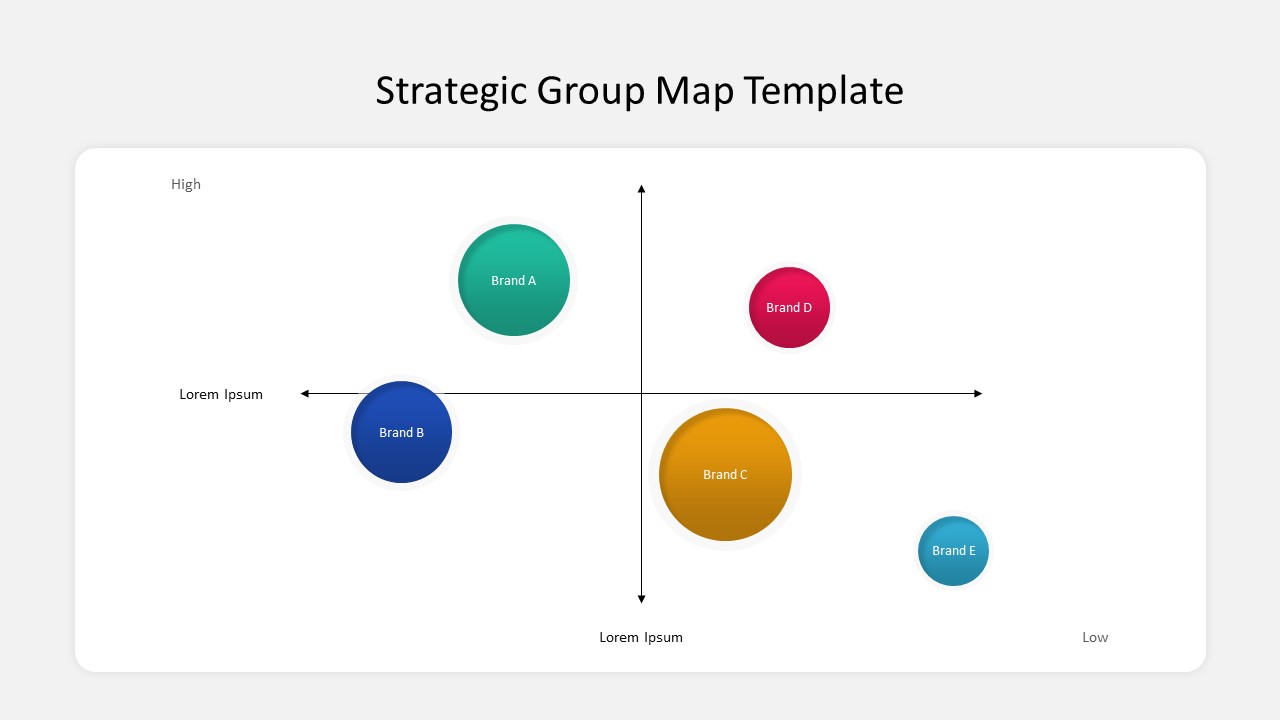
Business Strategic Group Map Analysis Template for PowerPoint & Google Slides
Competitor Analysis
Free
Four Quadrant Scatter Chart Analysis Template for PowerPoint & Google Slides
Comparison Chart
Experience Curve Analysis Diagram Template for PowerPoint & Google Slides
Business Strategy
Neon Dark Stock Market Analysis Template for PowerPoint & Google Slides
Pitch Deck
Free
Free Competitor Analysis Matrix Template for PowerPoint & Google Slides
Competitor Analysis
Free
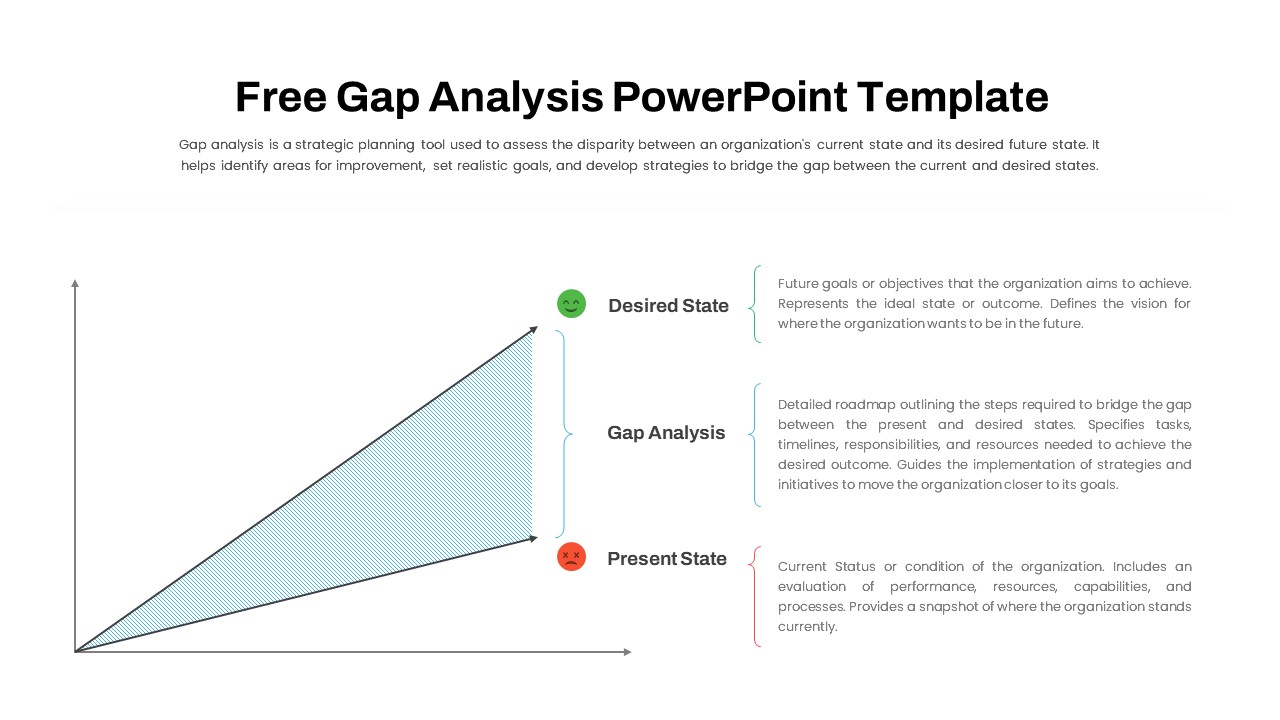
Free Comprehensive Gap Analysis Framework Template for PowerPoint & Google Slides
Opportunities Challenges
Free
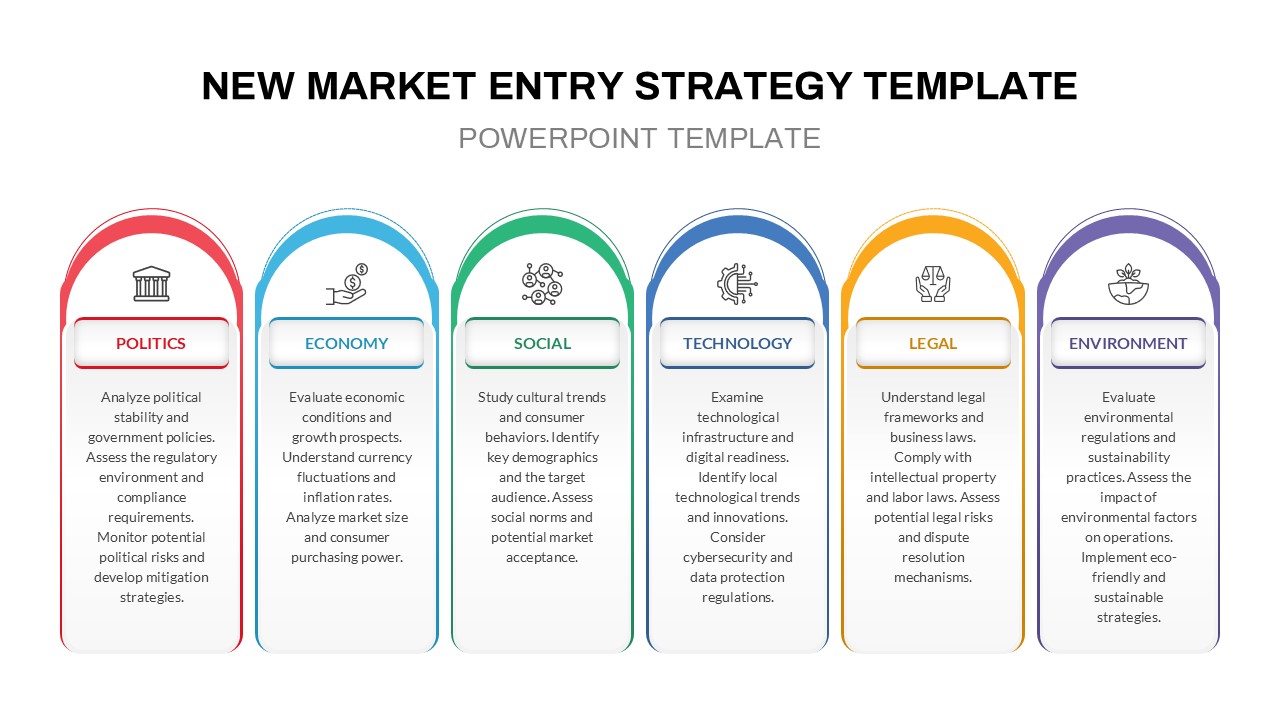
PESTLE Analysis for Market Entry Template for PowerPoint & Google Slides
PEST
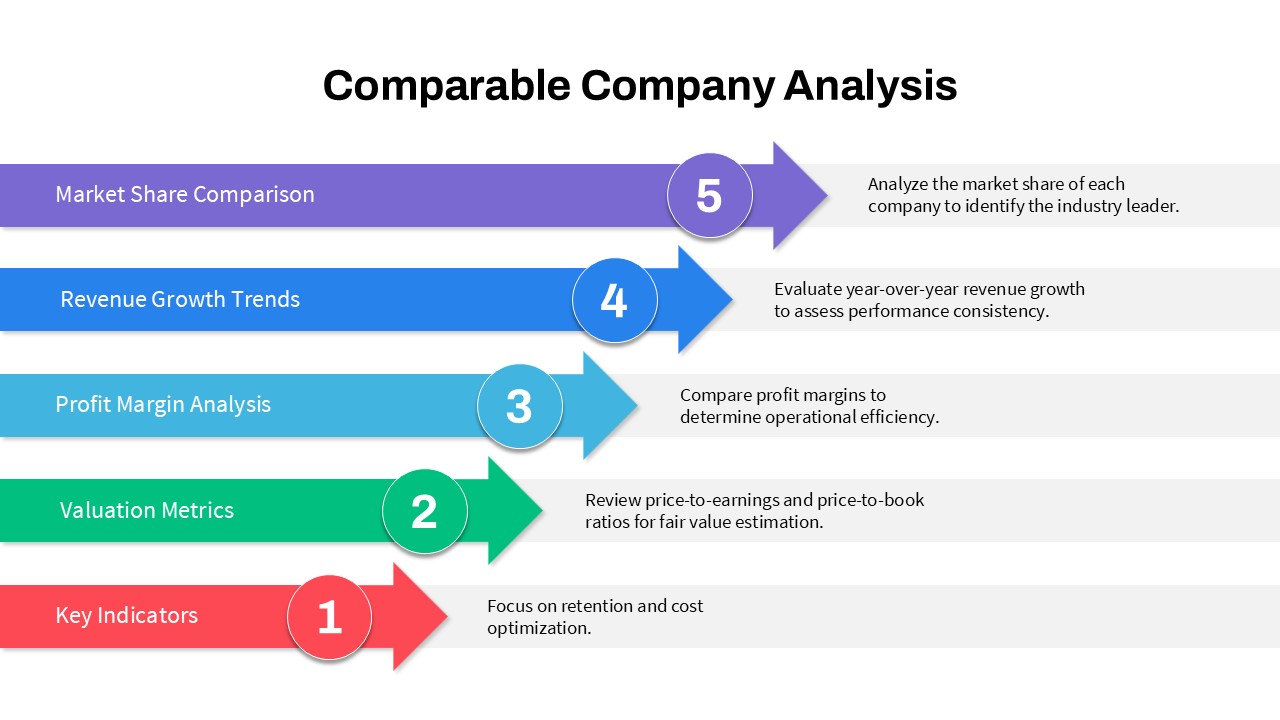
5-Step Comparable Company Analysis Template for PowerPoint & Google Slides
Arrow
Data Analysis Bar Chart with Insights Template for PowerPoint & Google Slides
Bar/Column
Free
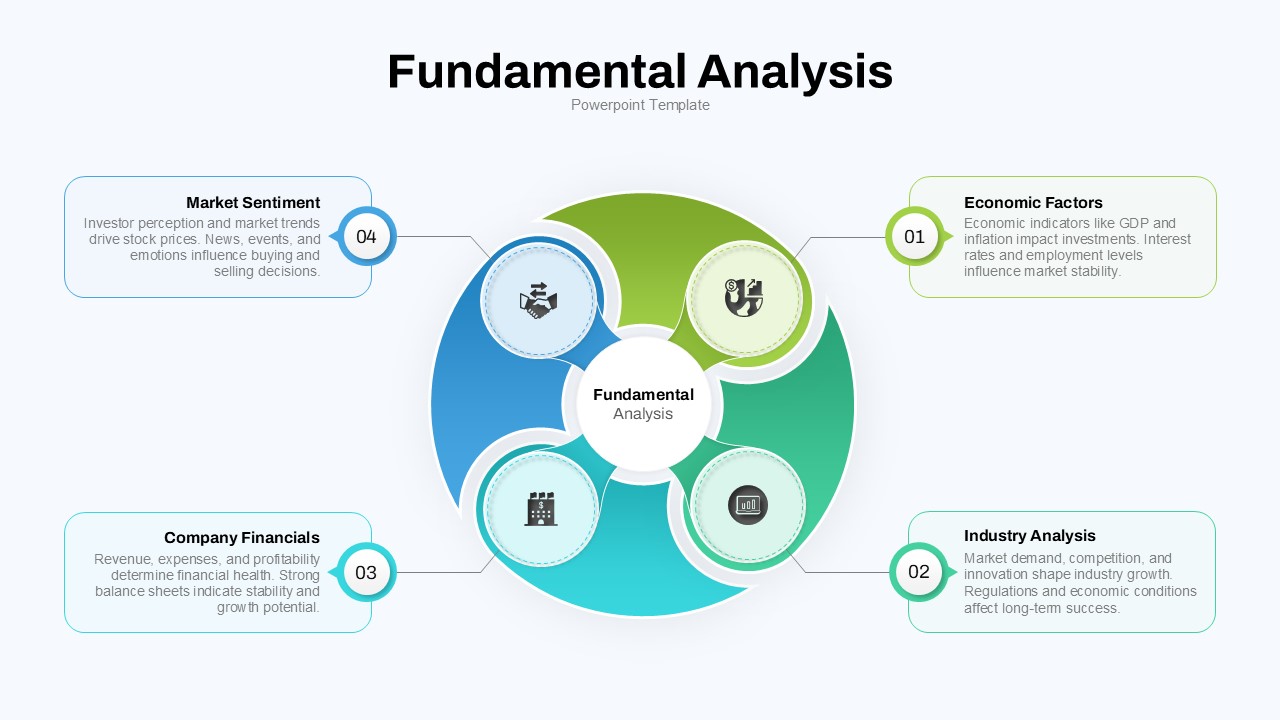
Fundamental Analysis Circular Diagram Template for PowerPoint & Google Slides
Circular
Cultural Web Analysis Circular Diagram Template for PowerPoint & Google Slides
Circular
Marketing SWOT Analysis Slide Template for PowerPoint & Google Slides
SWOT
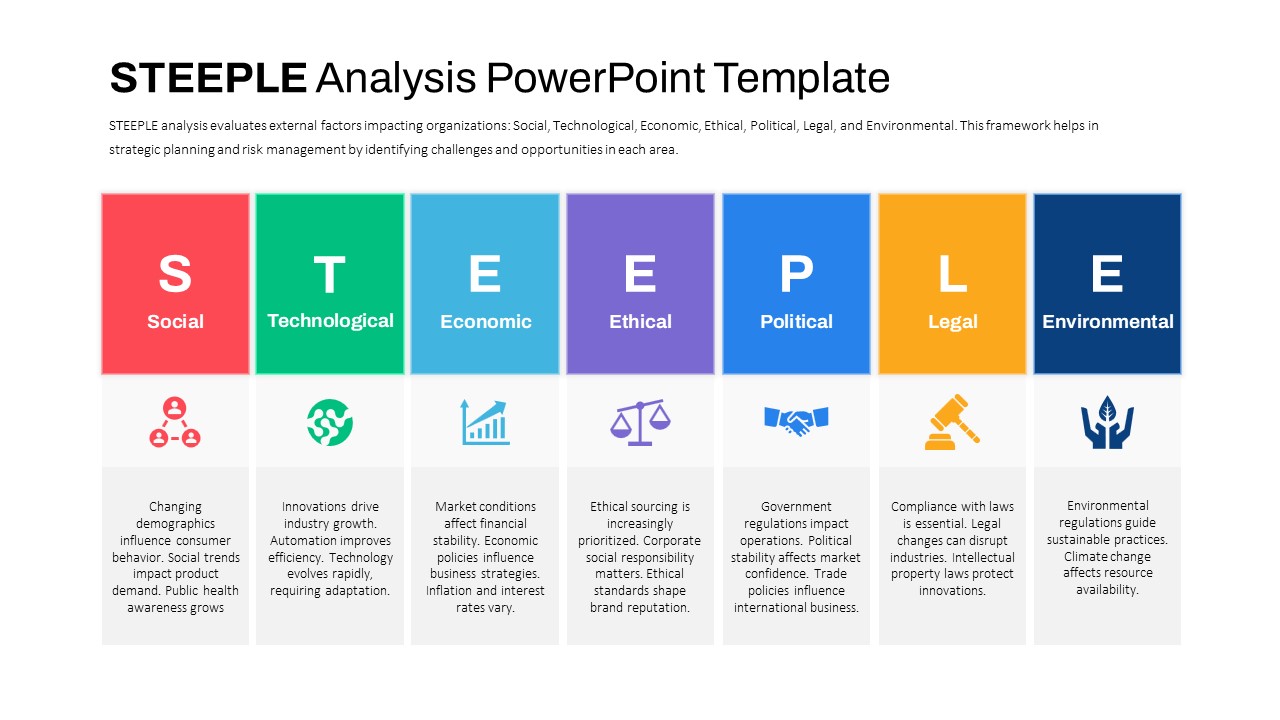
STEEPLE Analysis framework template for PowerPoint & Google Slides
Business Strategy
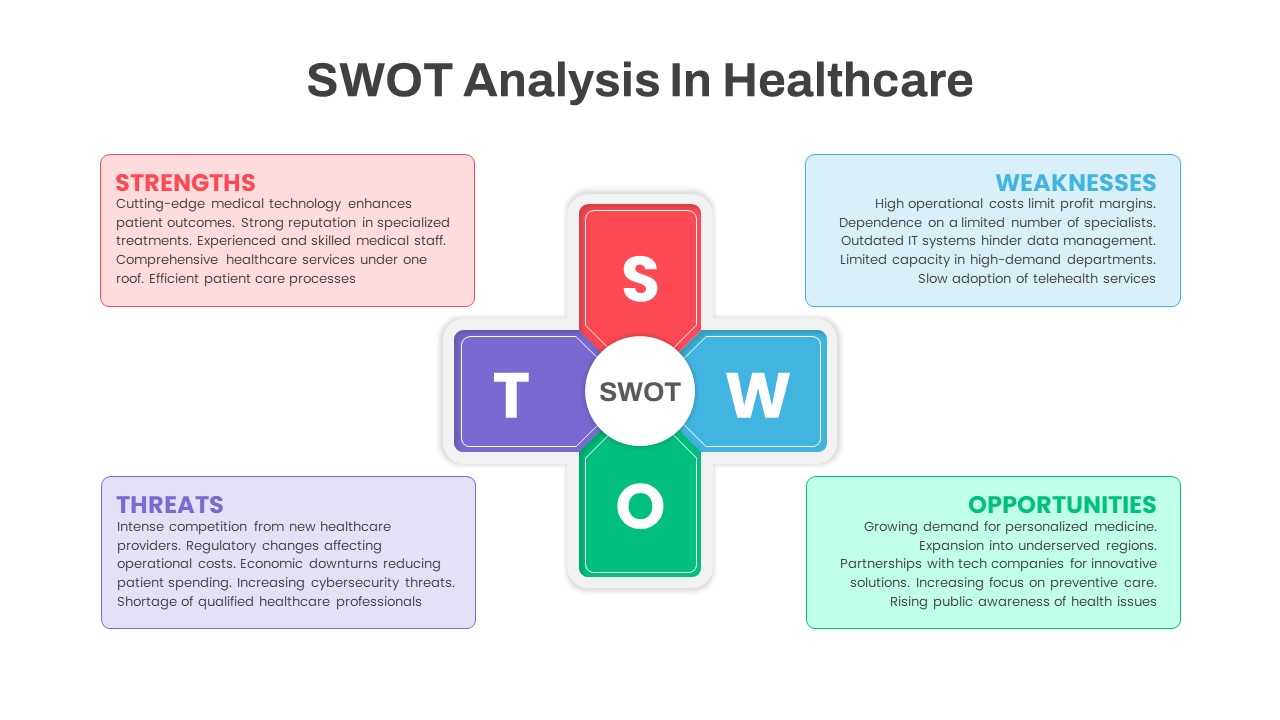
SWOT Analysis in Healthcare template for PowerPoint & Google Slides
SWOT
Two-Box Analysis & Target Comparison Template for PowerPoint & Google Slides
Comparison
Category Analysis Comparison Infographic Template for PowerPoint & Google Slides
Comparison
Turnover Analysis Dashboard Template for PowerPoint & Google Slides
Employee Performance
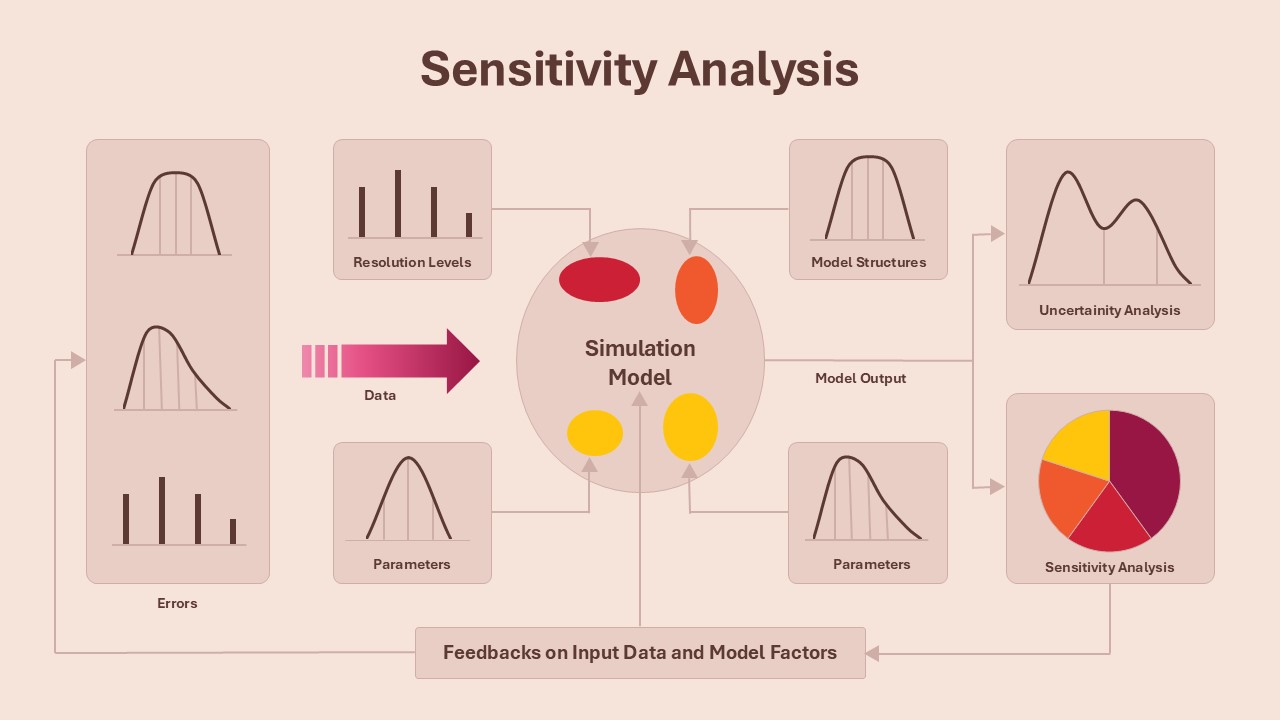
Sensitivity Analysis Framework template for PowerPoint & Google Slides
Business Strategy
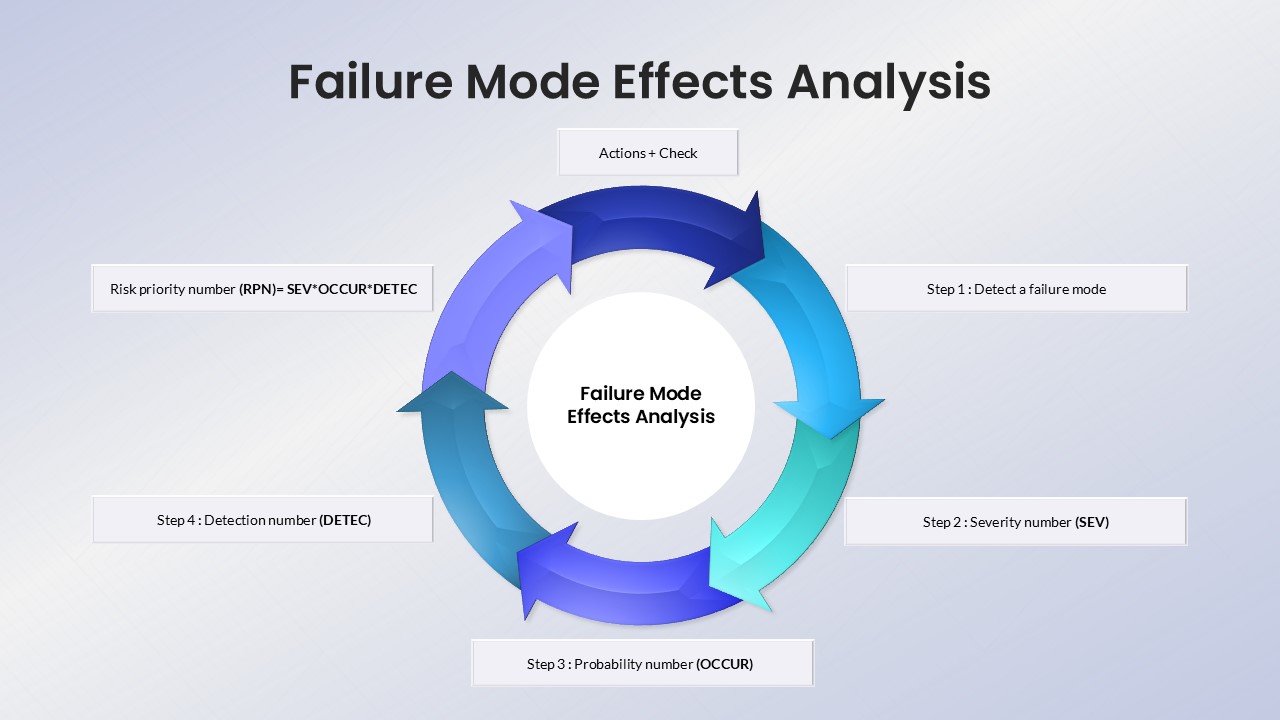
Failure Mode Effects Analysis (FMEA) Slide Template for PowerPoint & Google Slides
Process
Colorful SWOT Analysis Quadrant Template for PowerPoint & Google Slides
SWOT
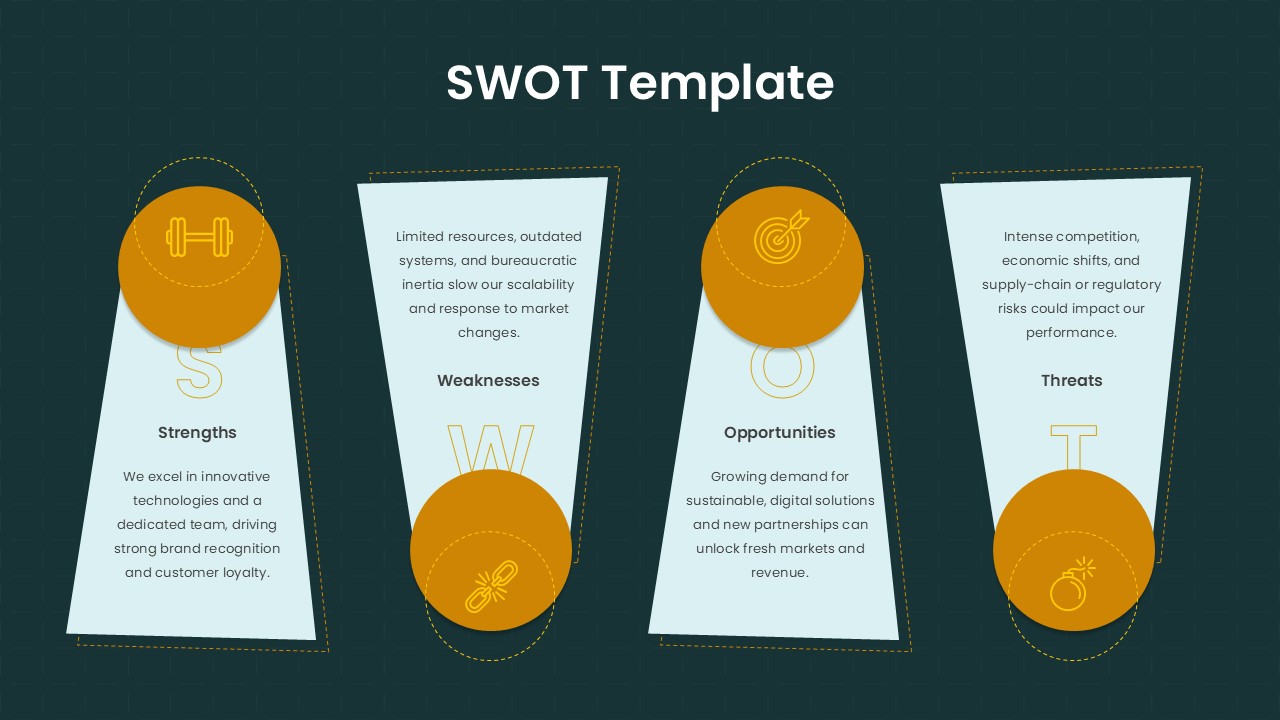
Trapezoid SWOT Analysis Template for PowerPoint & Google Slides
SWOT
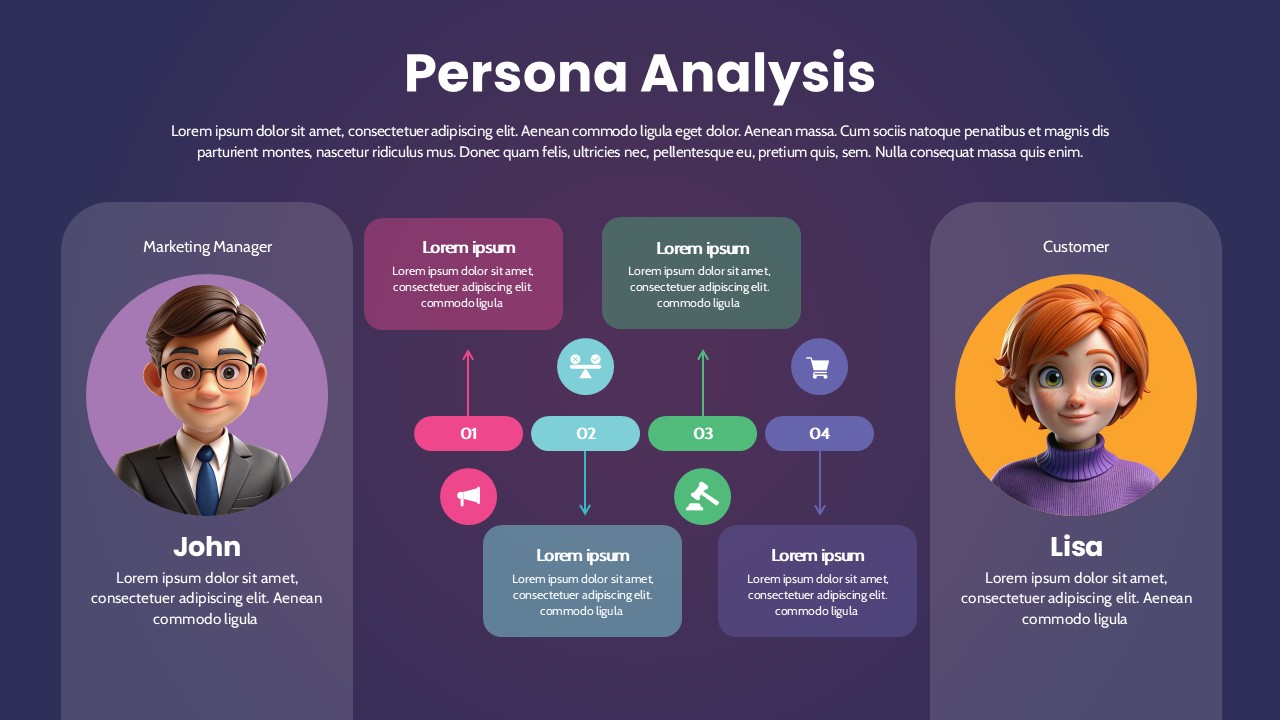
Persona Analysis Template for PowerPoint & Google Slides
Infographics
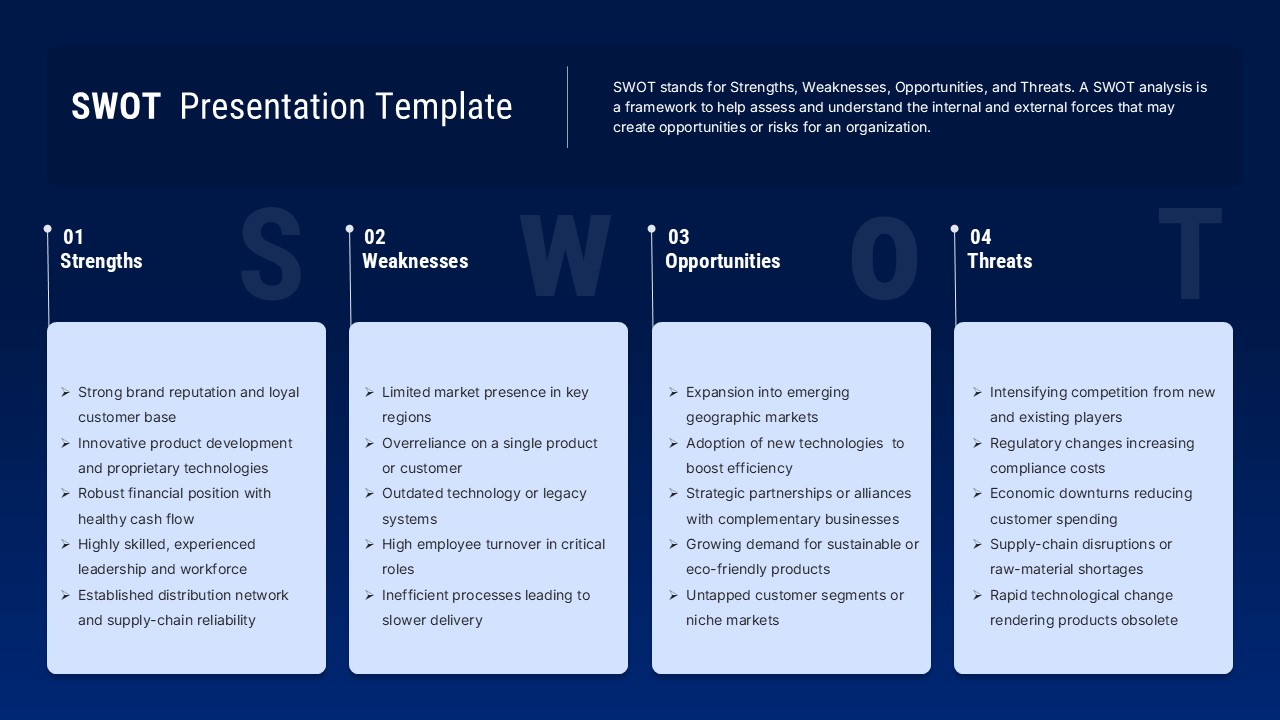
Blue SWOT Analysis Presentation Template for PowerPoint & Google Slides
SWOT
Cohort Analysis Retention Dashboard Template for PowerPoint & Google Slides
Comparison Chart
Blank SWOT Analysis Template for PowerPoint & Google Slides
SWOT
3D Quadrant SWOT Analysis Template for PowerPoint & Google Slides
SWOT
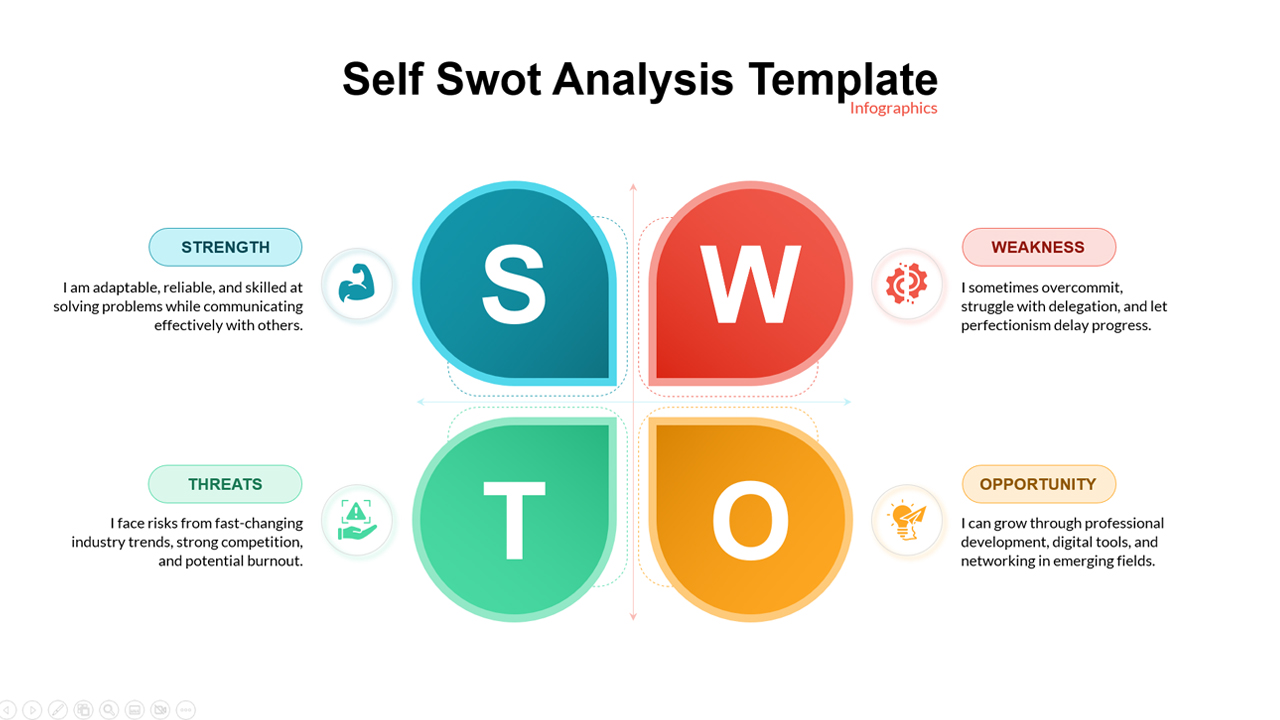
Self SWOT Analysis Template for PowerPoint & Google Slides
SWOT
Data Gap Analysis Template for PowerPoint & Google Slides
Business
Financial Gap Analysis Framework Template for PowerPoint & Google Slides
Finance
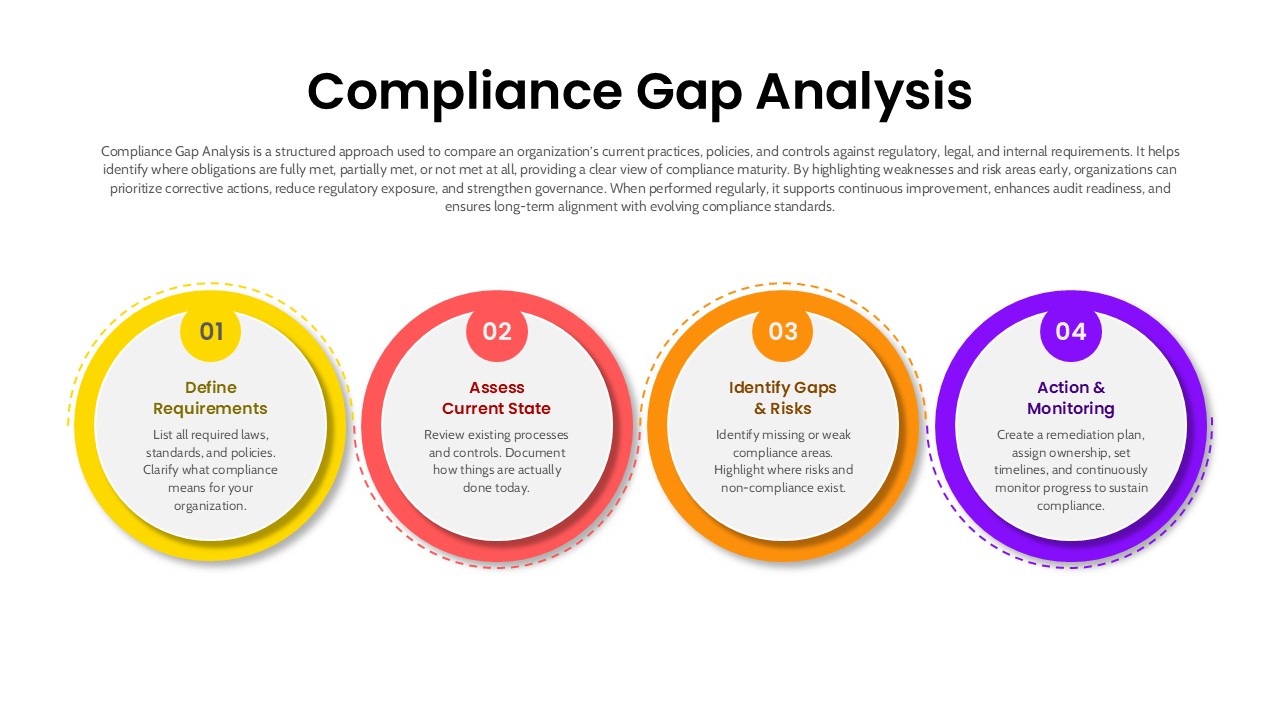
4 Step Compliance Gap Analysis Process Template for PowerPoint & Google Slides
Risk Management