Funnel Diagram Representations PowerPoint and Keynote Template
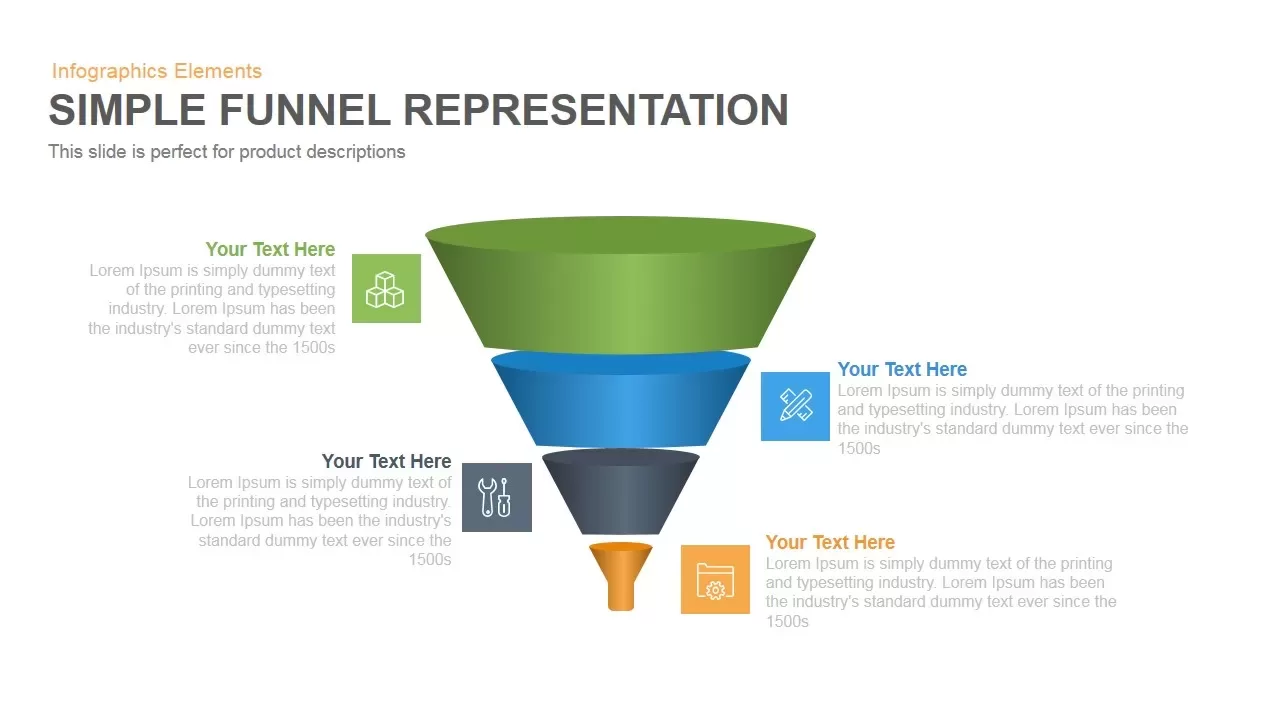
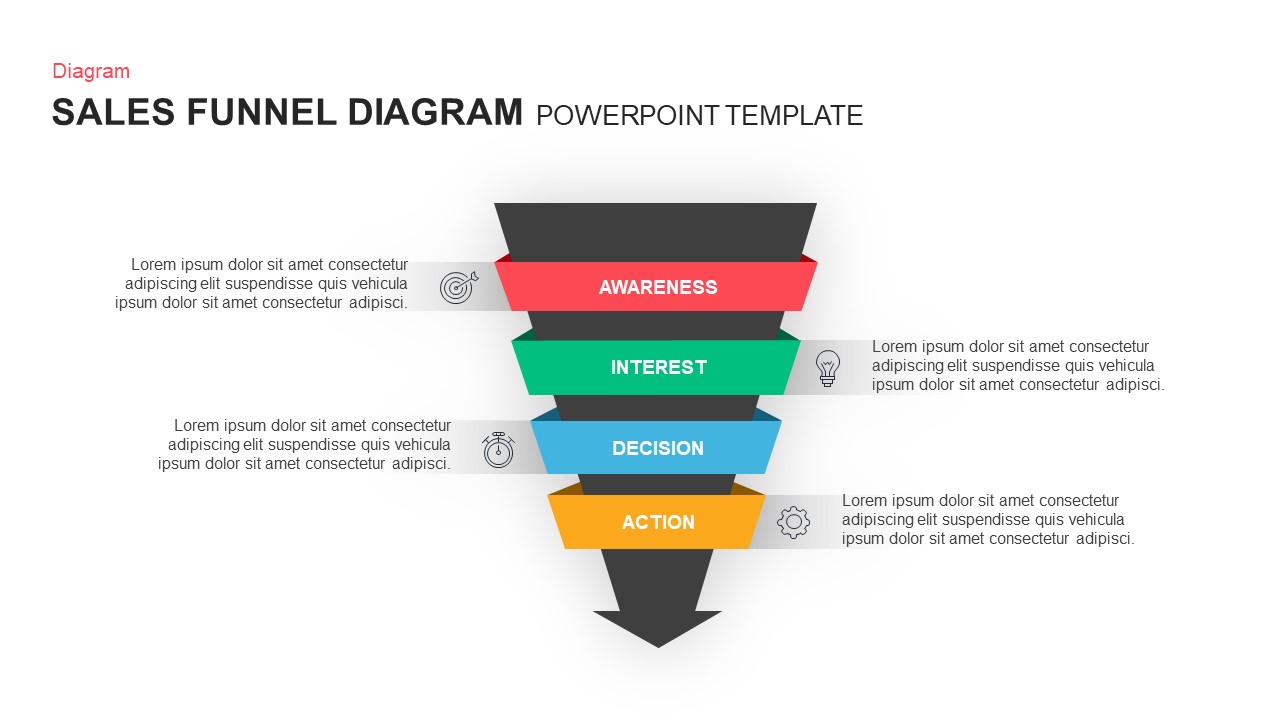
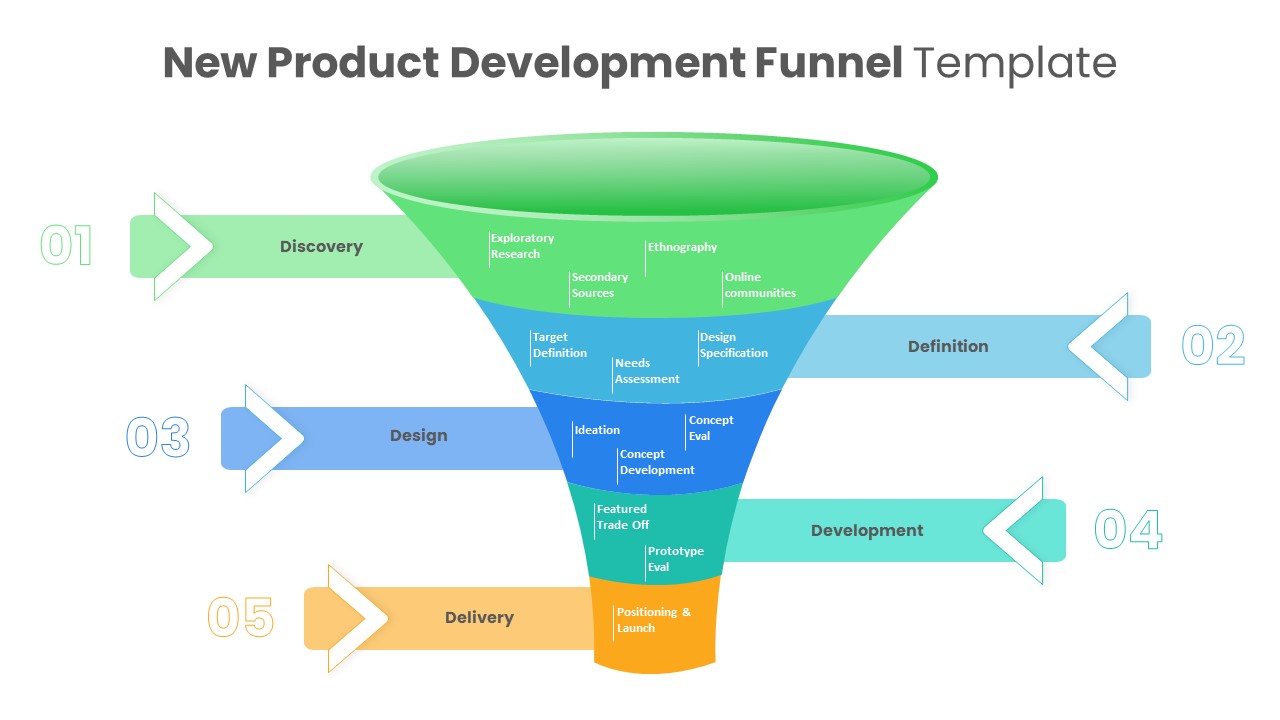
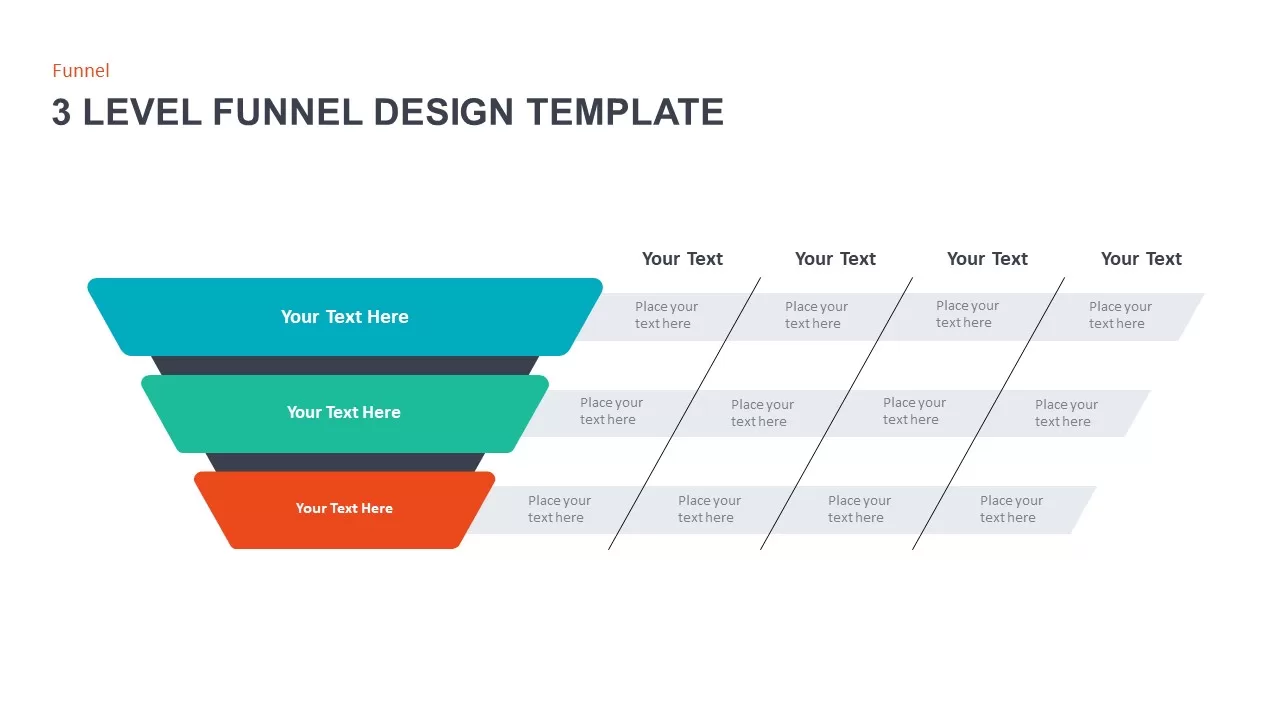
Funnel Diagram Representations Powerpoint and Keynote template have two variations of funnel representation this slide is designed in both PowerPoint and keynote with dark and light variations.
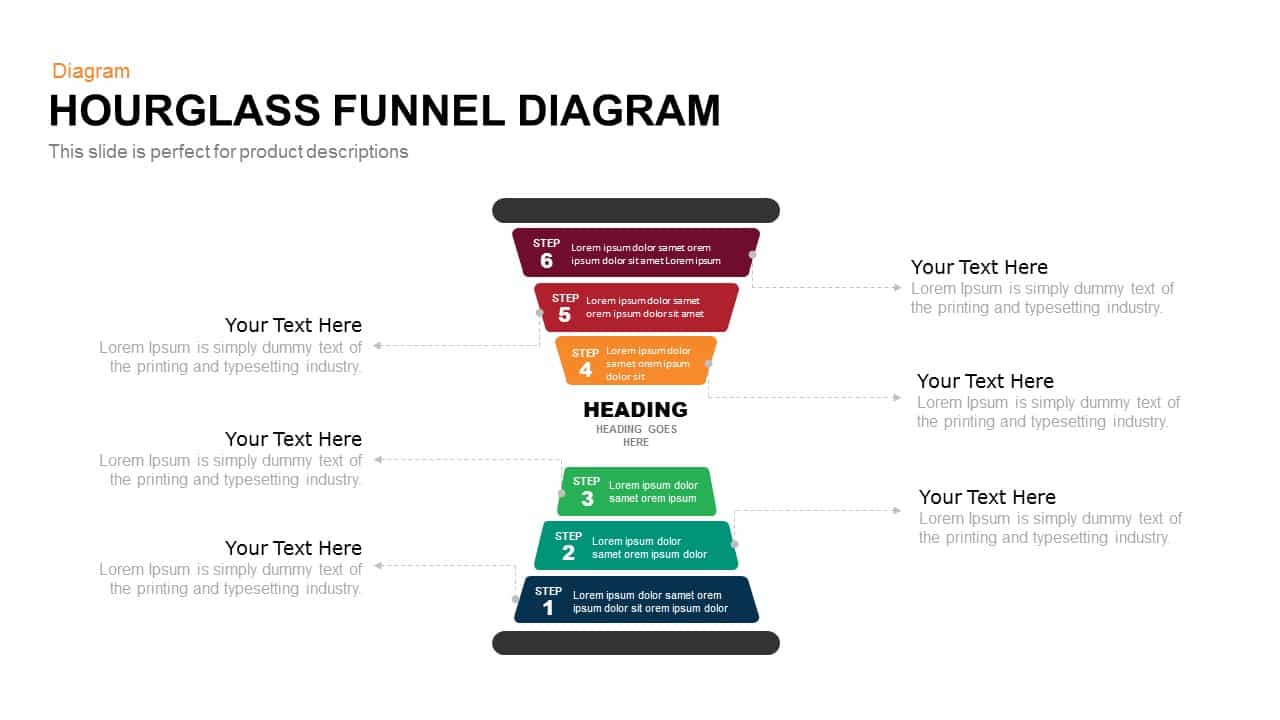
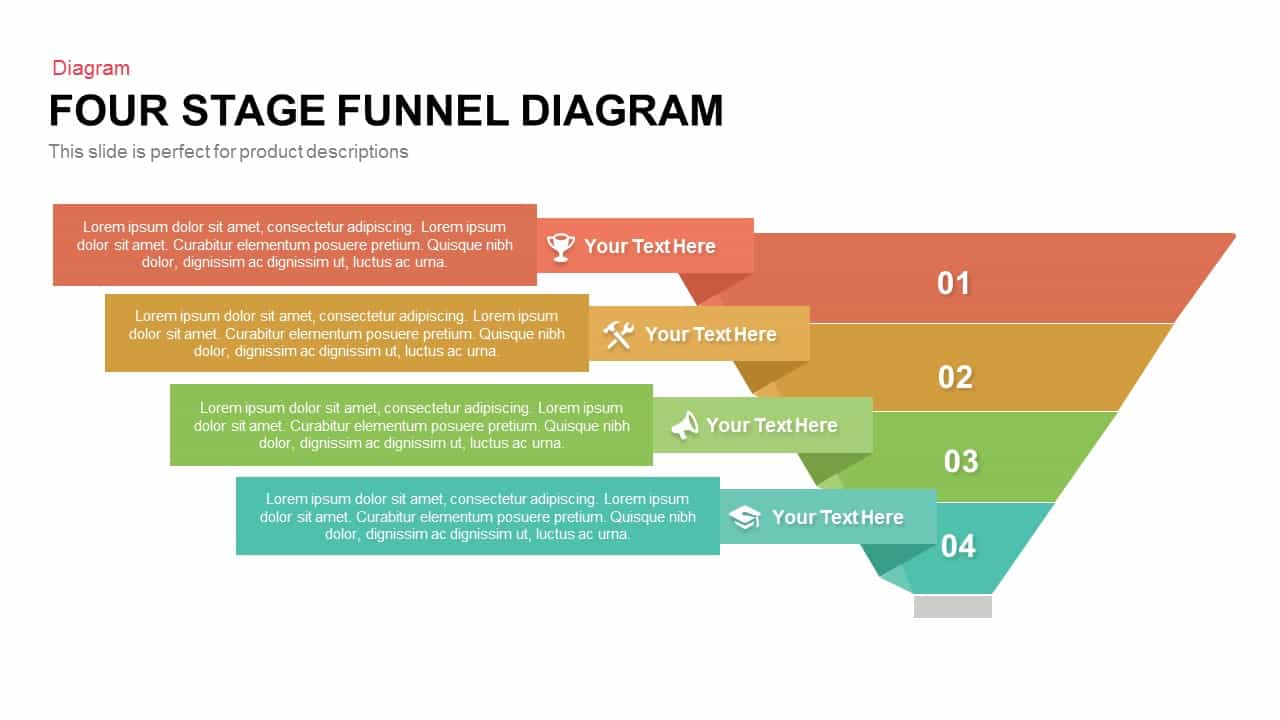
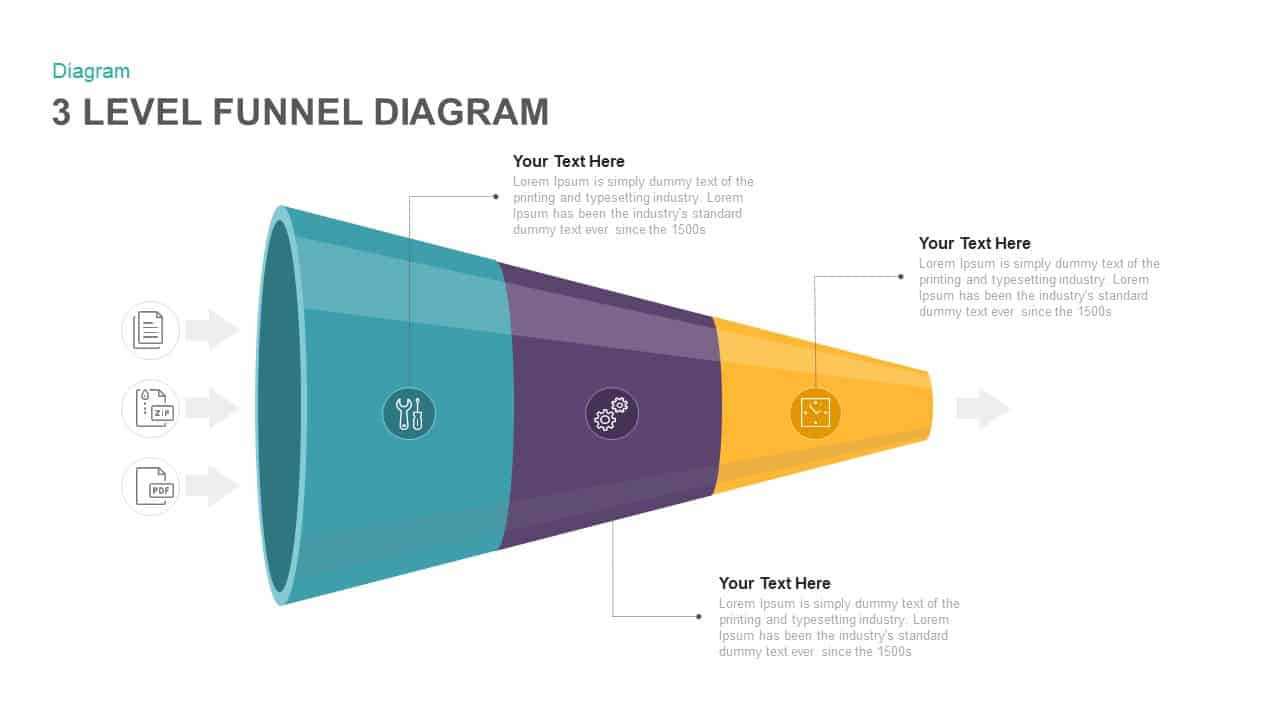
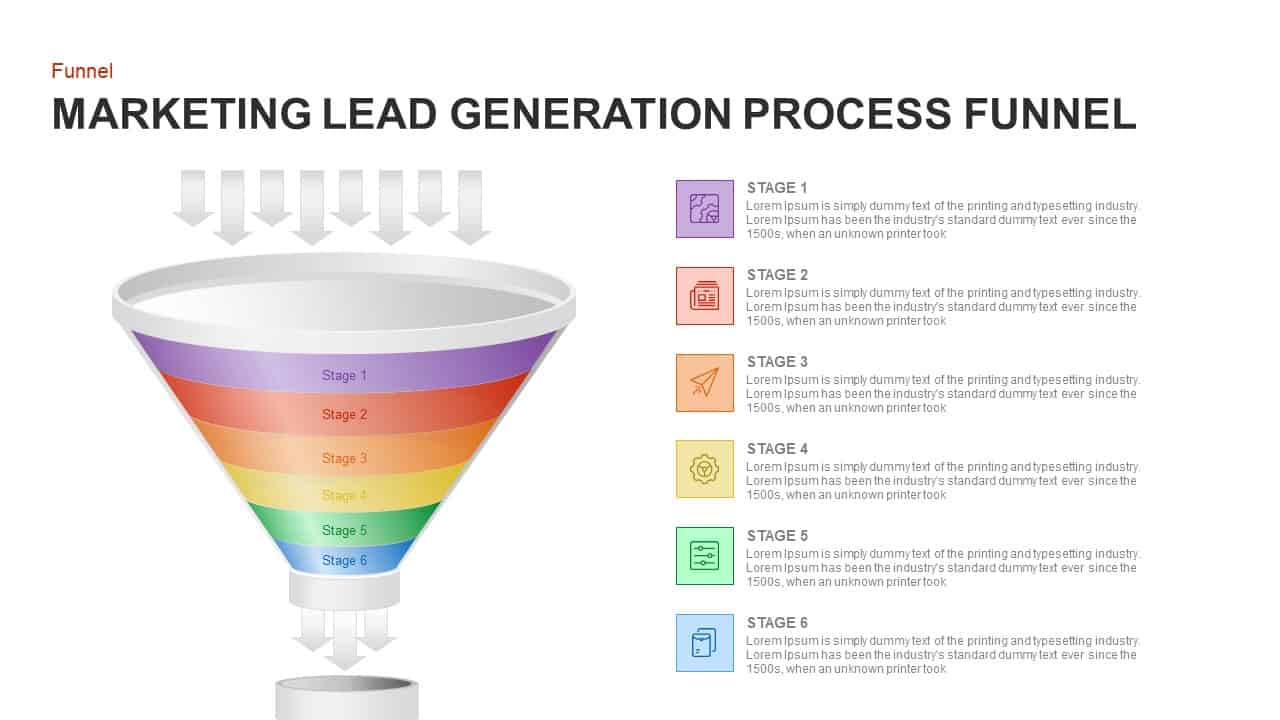
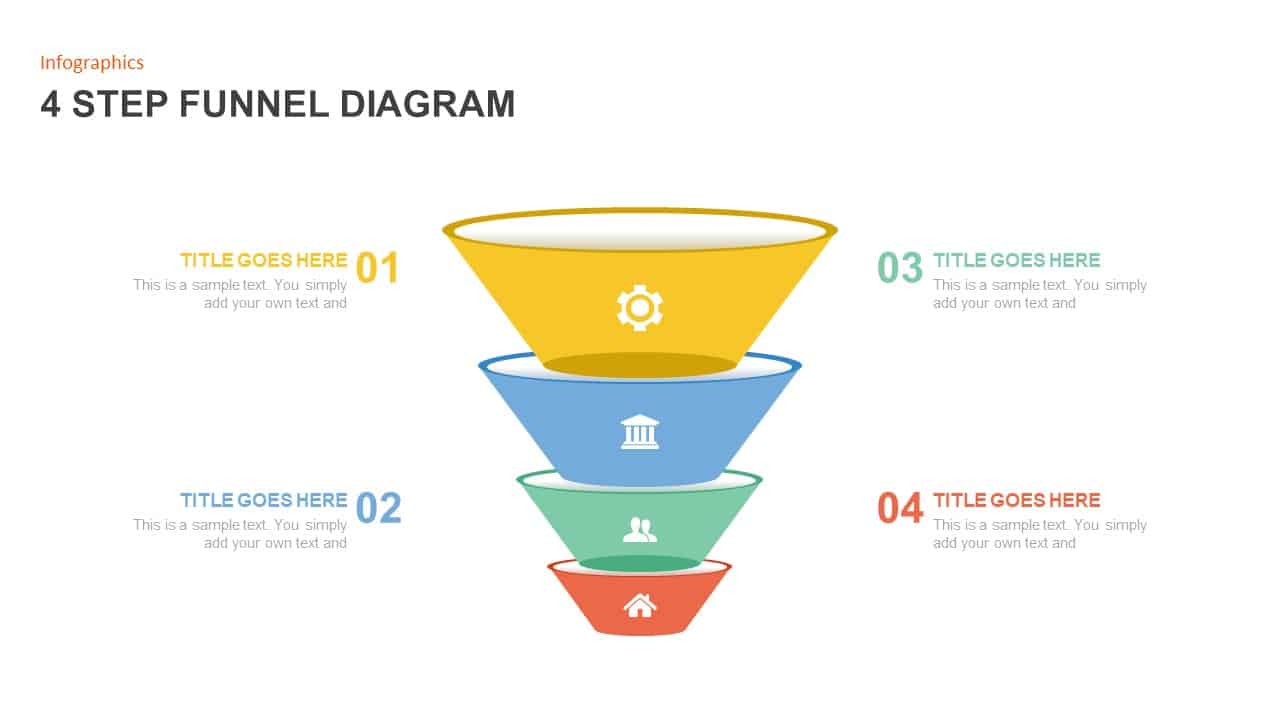
Funnel diagram representations PowerPoint and keynote template contains four slides that help users to make professional presentations. A funnel diagram is a tool for analyzing marketing, sales, and lead generation. It is also applicable in the presentation like target marketing where the goal is progressively narrow down. The funnel diagram template is capable to display how large number becomes the essence by the process. The funnel representation PowerPoint is a peculiar funnel design, it can be used for generic representations and pass several valuable concepts to the audiences. The users can illustrate the presentation topics on the first and second slides and their detailed descriptions on the third and fourth slides.
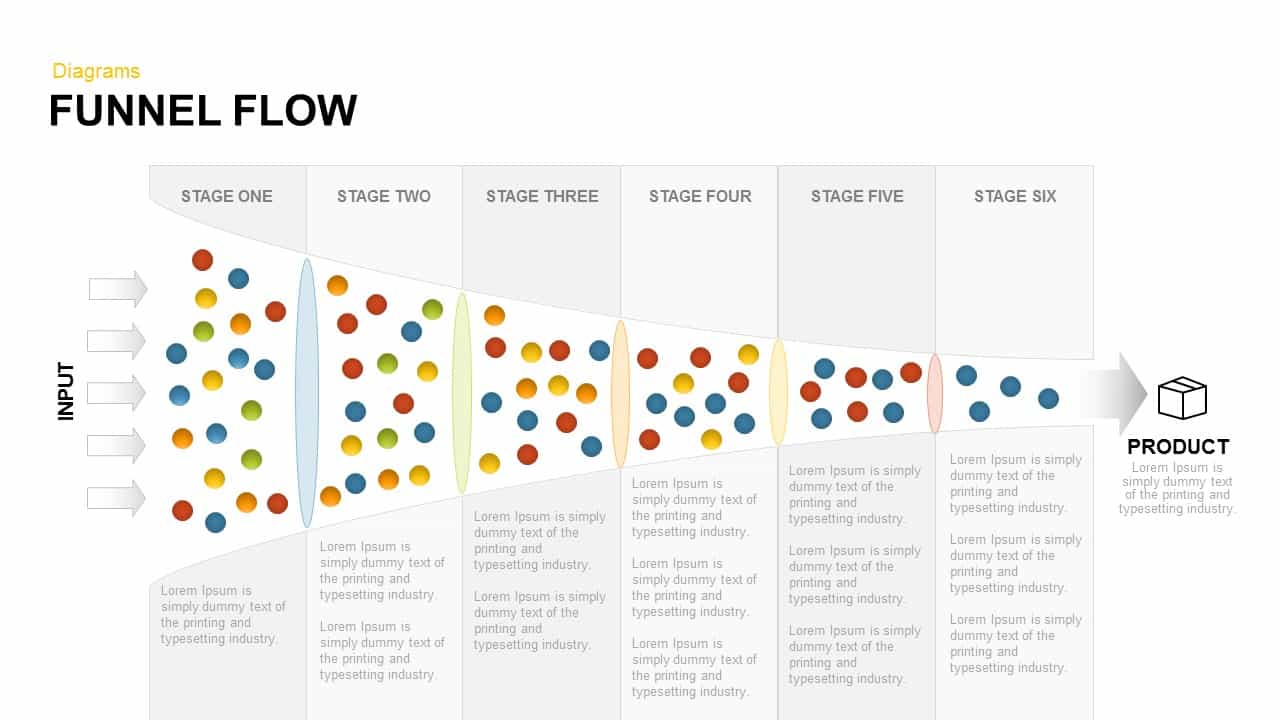
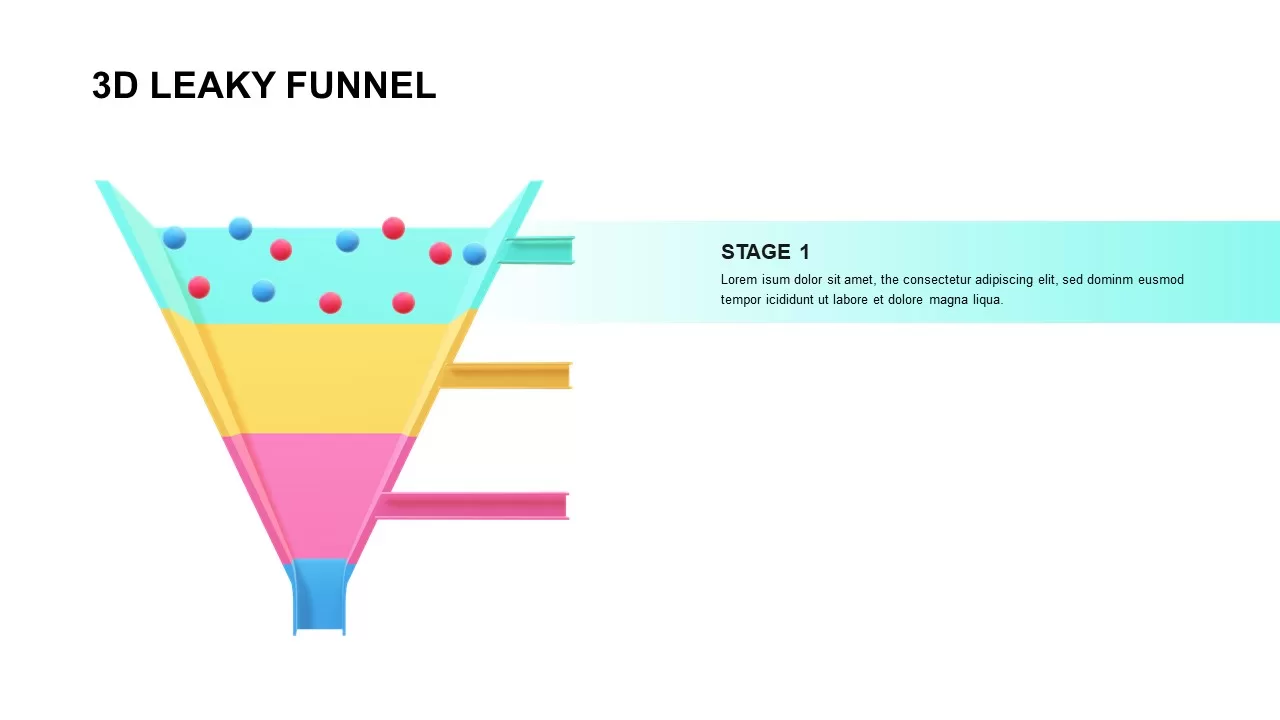
Business growth and organizations development is a multifaceted and challenging activity and process. Funnel flow diagram representations PowerPoint template display in what way an input becomes an effective product and what is the process behind it. Our funnel flow diagram keynote illustrates diverse stages of the filtering process. Hence, these PowerPoint slides are useful for any organization and business to present how sales and marketing targets can be met. The flow funnel template is probably one of the most frequently used flowchart diagrams in PowerPoint presentations. This template is not only for the business areas but also worthwhile for other sectors like student pass out, local administration, and information process. The funnel representation PowerPoint and keynote template slide are professionally designed; it is more useful to make descriptions about proportions. Your audience can understand fully what you want to convey, that is the advantage of this funnel flow diagram.
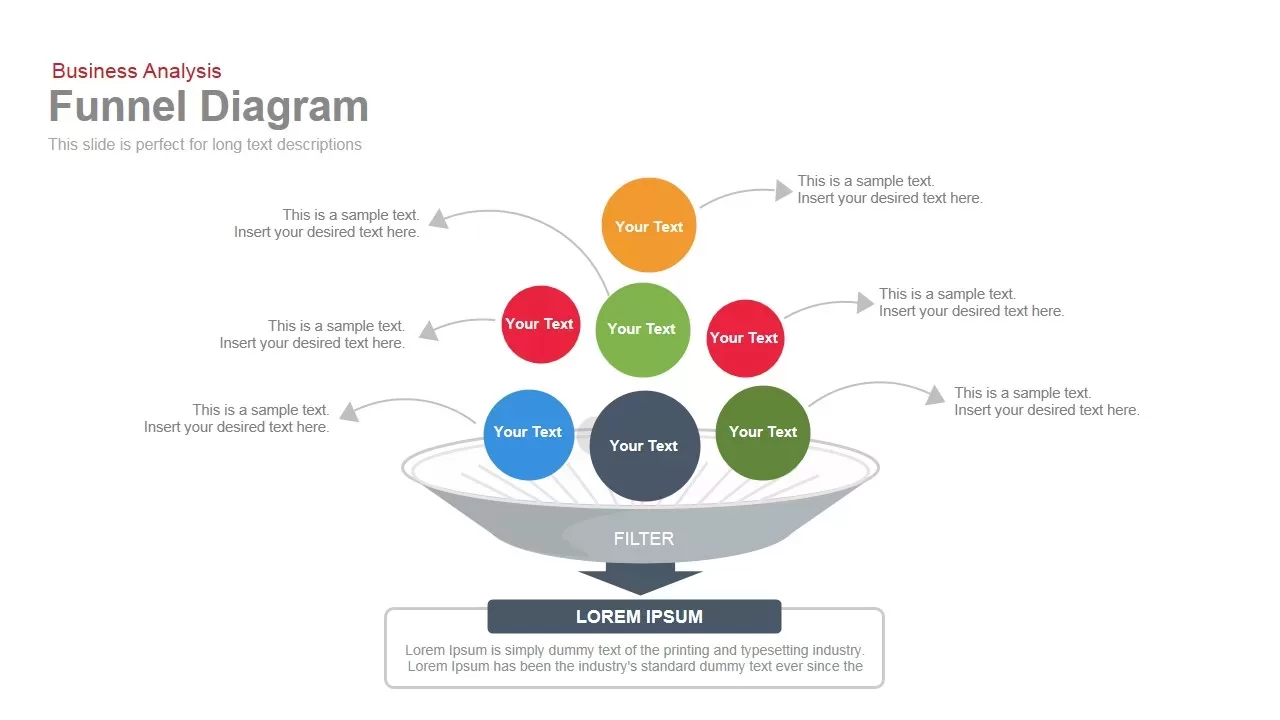
Business analysis funnel diagram shows the screening process of different entities. It may be marketing leads or sales revenues. The rounded objects represent data transformation through a management analysis process. The user can change the PowerPoint and objects, shapes, and effects of this diagram, along with alterations in color combination. Presenters can check out the slidebazaar.com funnel diagram category and download more appealing funnel designs.
Login to download this file


