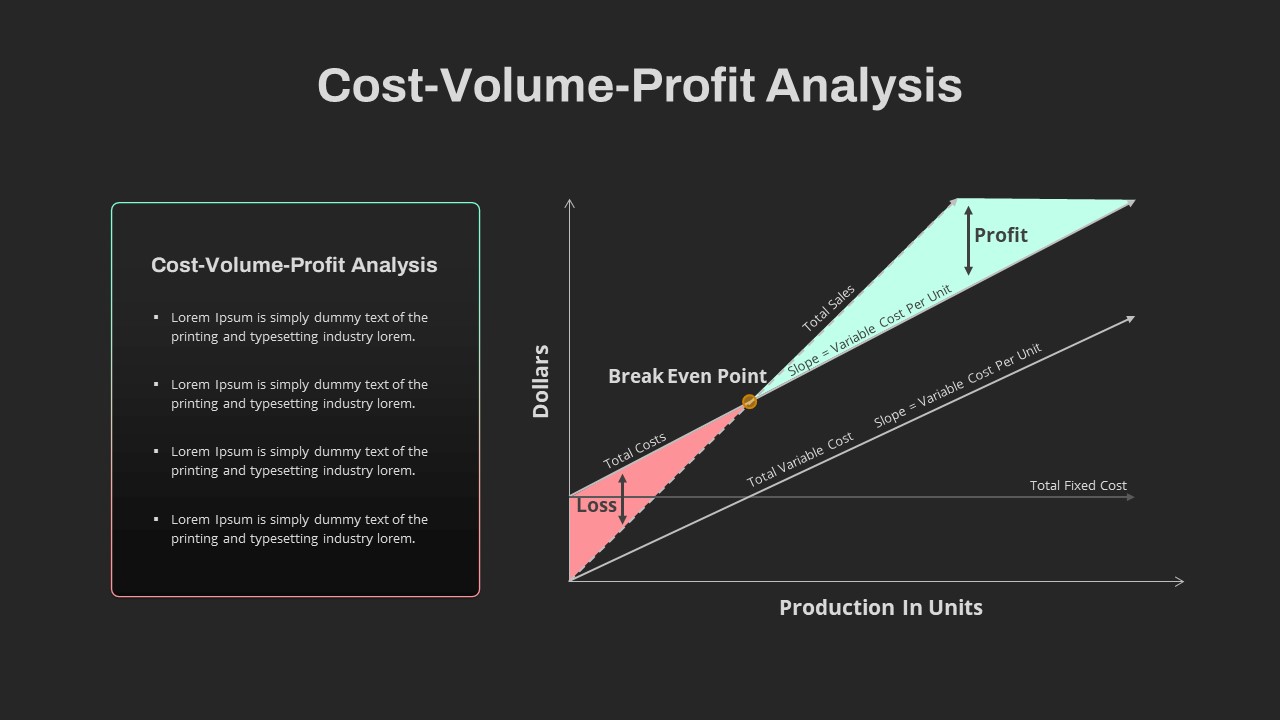
Cost-Volume-Profit Analysis Diagram Template for PowerPoint & Google Slides

Description
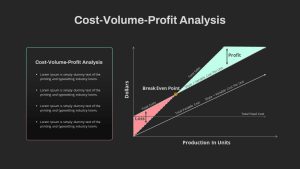
Elevate your financial presentations with this Cost-Volume-Profit Analysis diagram slide, designed to clearly depict the relationship between production volume, fixed and variable costs, and revenue. The slide features a crisp line chart with shaded loss (red) and profit (green) areas and a highlighted break-even point marker. Use the labeled axes for Dollars and Production in Units, and customize the slopes annotated as Variable Cost Per Unit to align with your data. A complementary text box with bullet placeholders lets you summarize key insights or strategic recommendations alongside the chart. The modern layout uses a clean white background, subtle grey grid lines, and intuitive color accents to ensure that your audience focuses on the core financial story. Fully editable vector shapes, master slide integration, and placeholder text fields make theme adjustments and content updates seamless. Optimized for both PowerPoint and Google Slides, this slide maintains full resolution clarity across devices and eliminates formatting issues.
Who is it for
Finance managers, accountants, and business analysts will benefit from this slide when conducting break-even studies, cost control workshops, or pricing strategy discussions. Project managers, consultants, product owners, and MBA students can leverage this asset to present clear cost-volume relationships during stakeholder briefings, business planning sessions, or academic presentations.
Other Uses
Beyond traditional cost-volume-profit analysis, repurpose this slide to illustrate revenue forecasts, sensitivity analyses, or production planning scenarios. Adapt the shaded areas to highlight margin targets, risk thresholds, or performance benchmarks. Use the bullet text box to outline pricing models, cost reduction initiatives, or capacity utilization plans, ensuring comprehensive financial storytelling across industries and departments.
Login to download this file

Item ID
SB04191
Related Templates

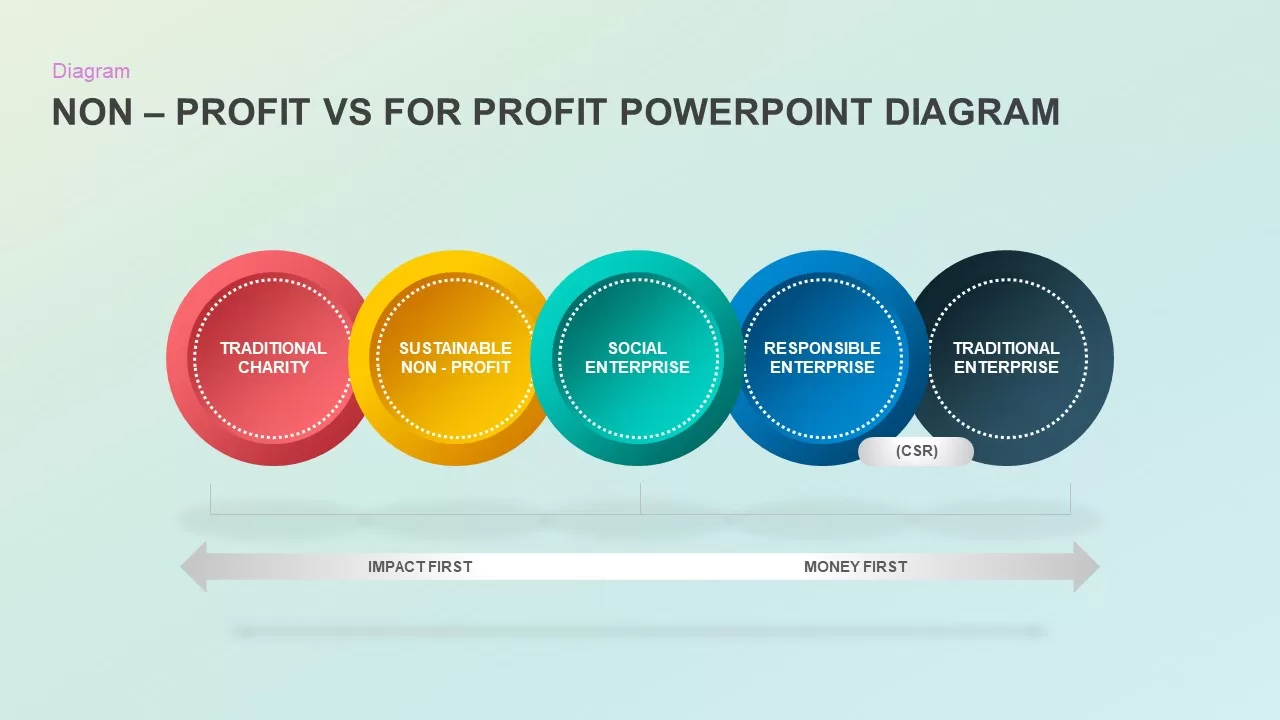
Non-Profit vs For-Profit Diagram template for PowerPoint & Google Slides
Business Models
Quarterly Network Volume Analysis Template for PowerPoint & Google Slides
Business Report
Dual-Color Cost vs Benefit Analysis Template for PowerPoint & Google Slides
Comparison
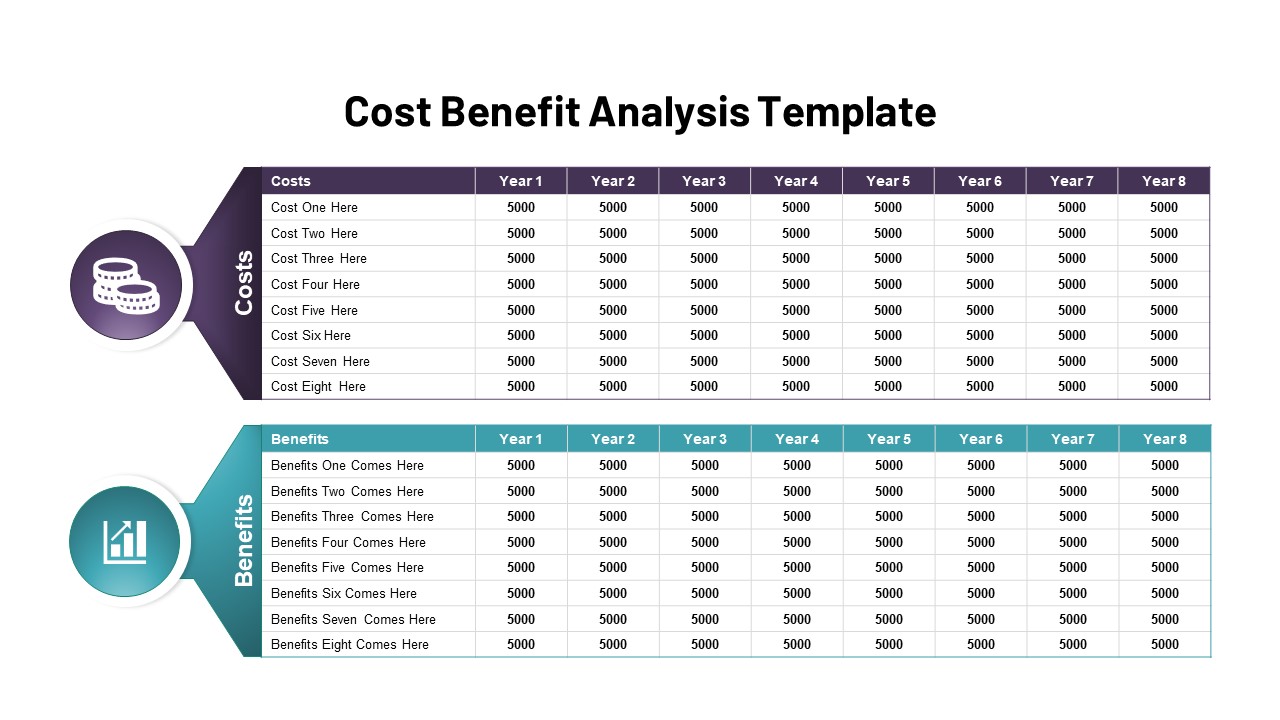
Cost Benefit Analysis Comparison Template for PowerPoint & Google Slides
Comparison
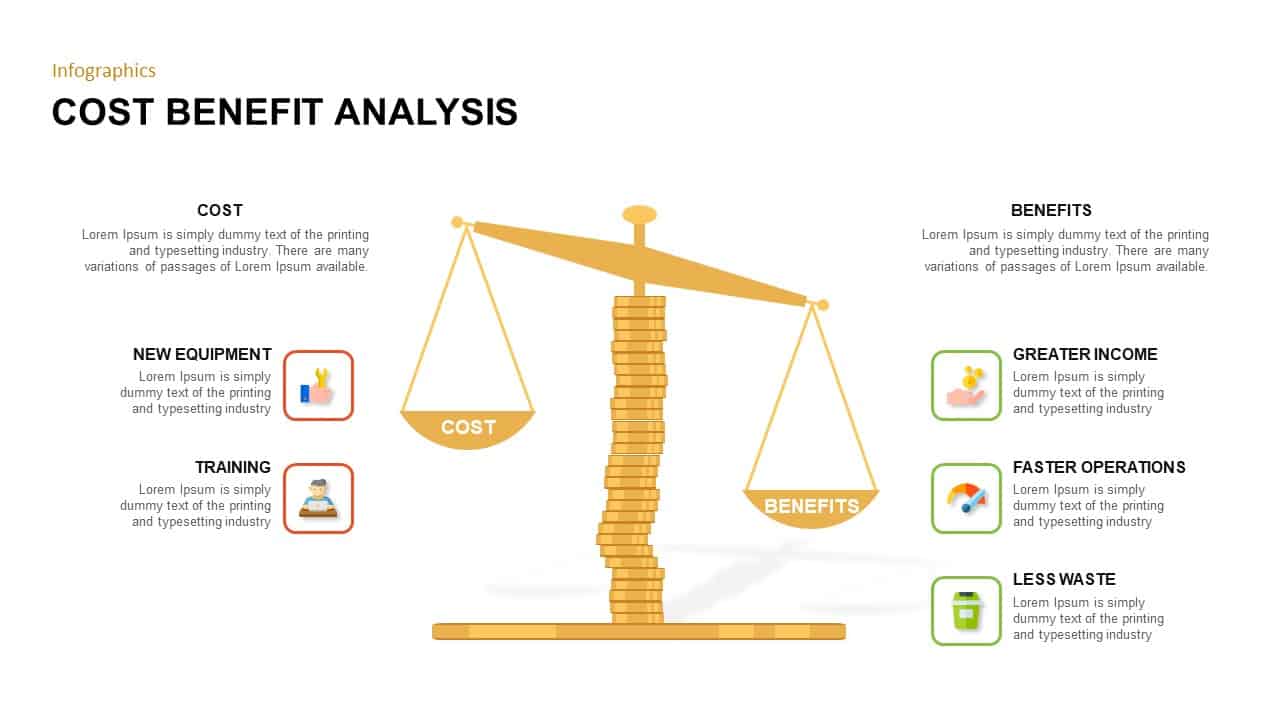
Cost Benefit Analysis infographic for PowerPoint & Google Slides
Comparison
Profit Performance Trend Chart Template for PowerPoint & Google Slides
Finance
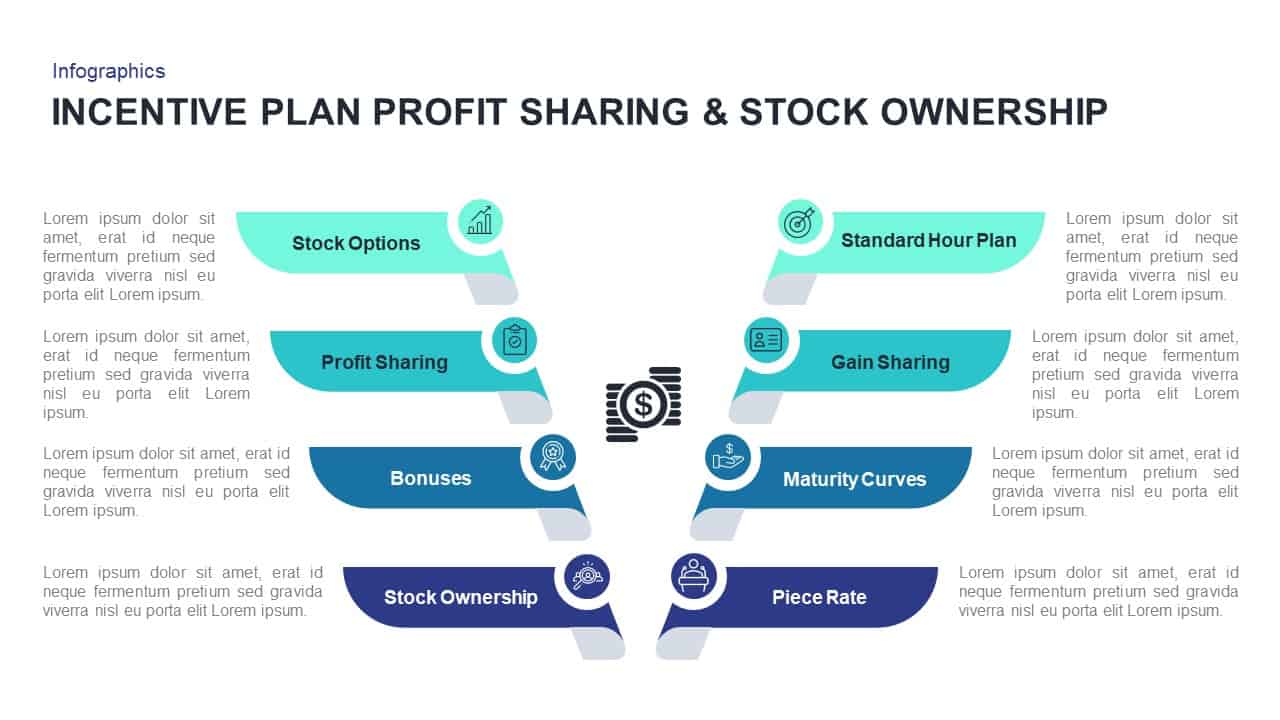
Profit Sharing & Stock Ownership Template for PowerPoint & Google Slides
Process

Non-Profit Organization Profile Deck Template for PowerPoint & Google Slides
Pitch Deck
Quarterly Gross Profit Rate Chart Template for PowerPoint & Google Slides
Revenue
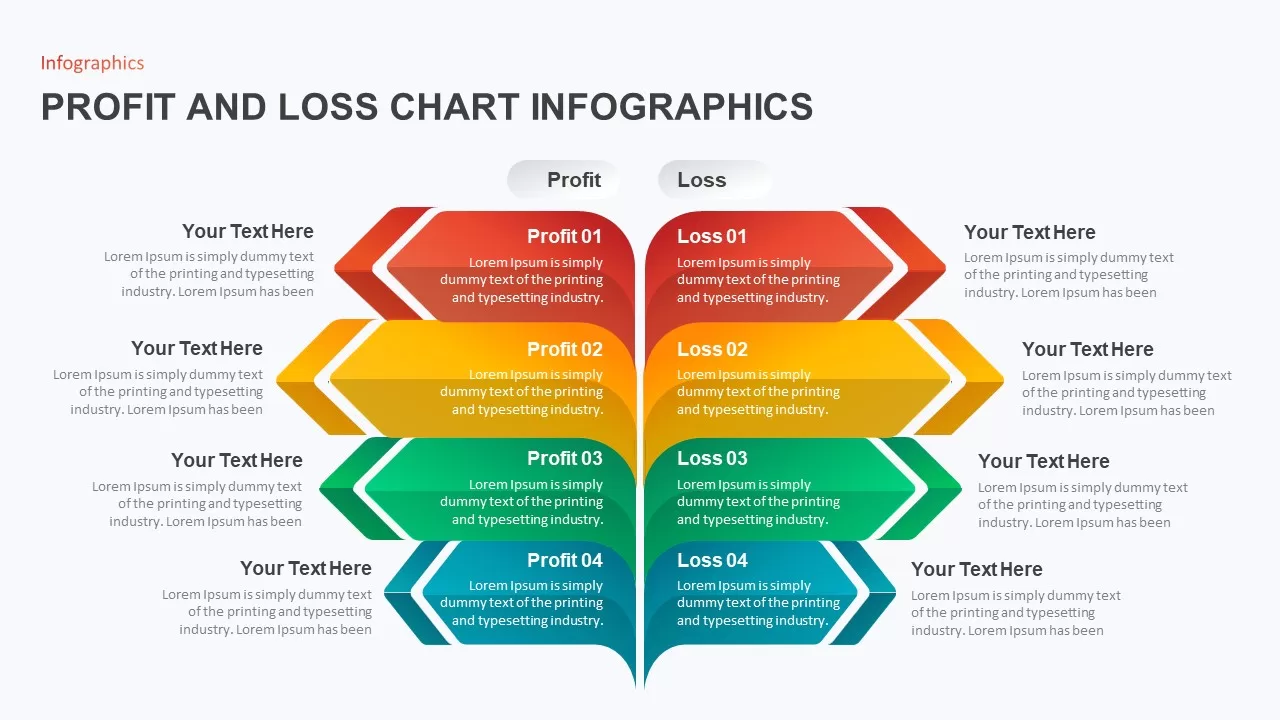
Profit and Loss Chart Infographics for PowerPoint & Google Slides
Business Report
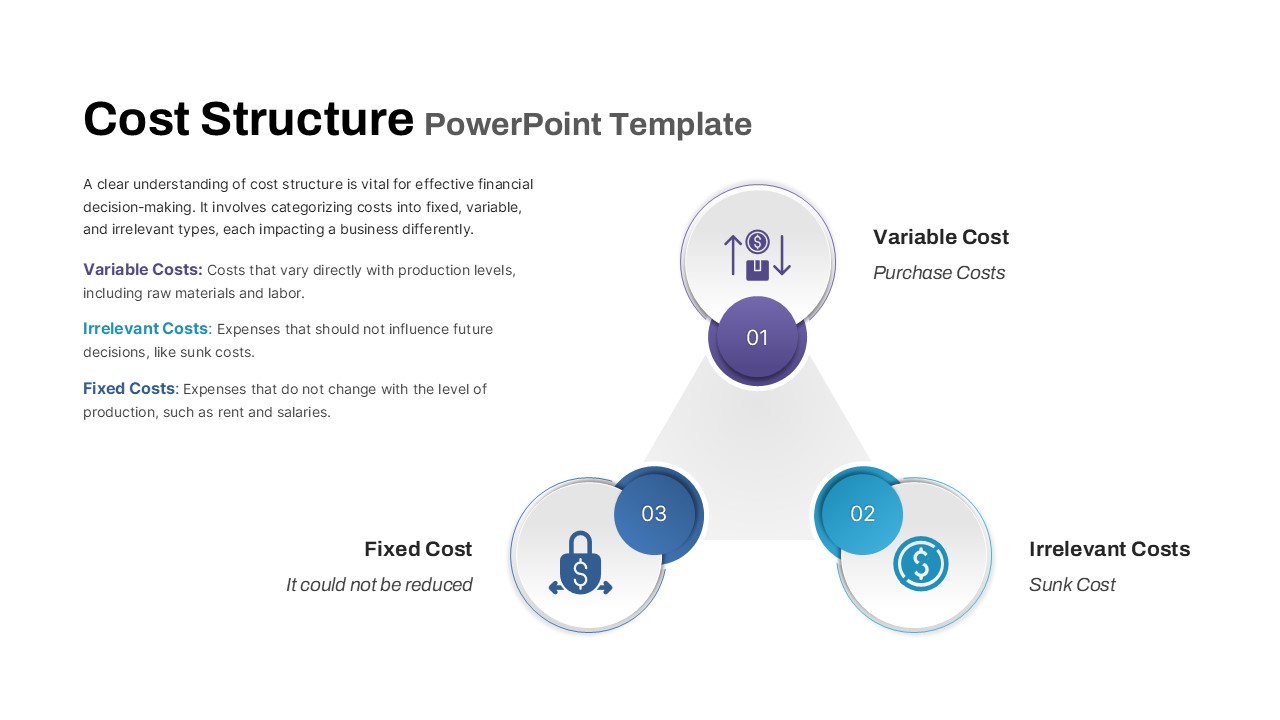
Cost Structure Triangle Diagram Template for PowerPoint & Google Slides
Finance
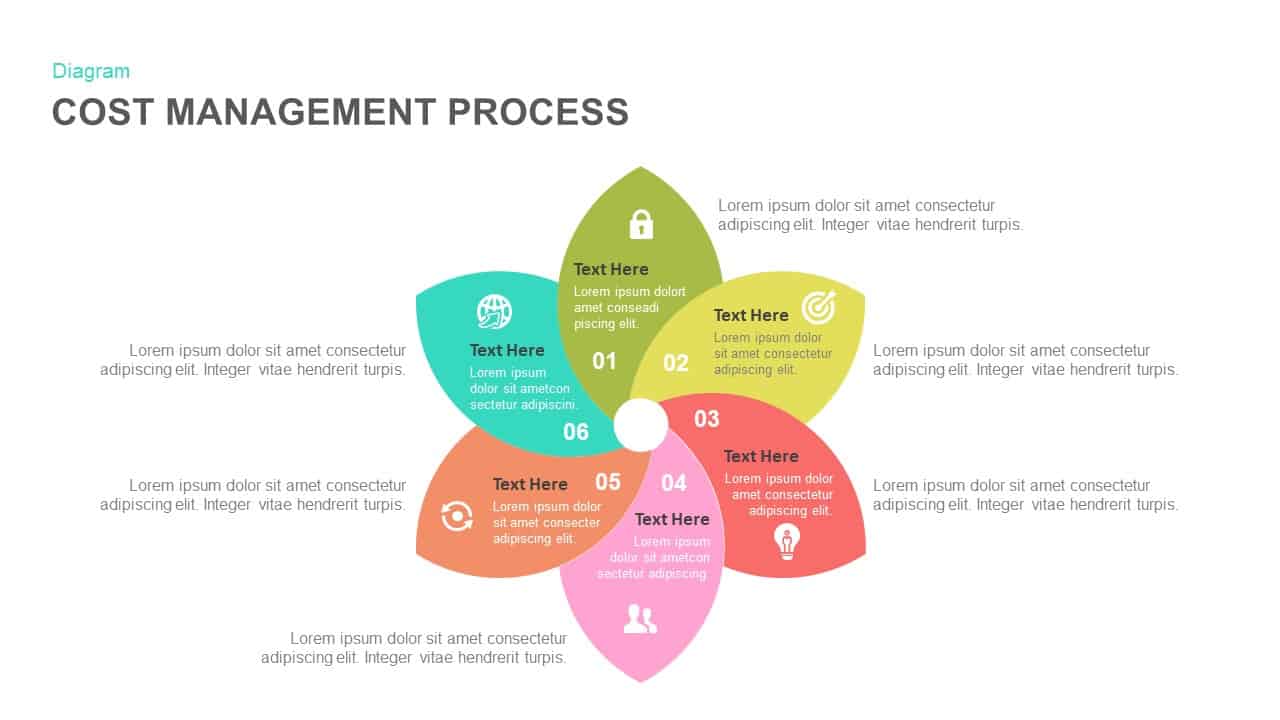
Cost Management Process template for PowerPoint & Google Slides
Process
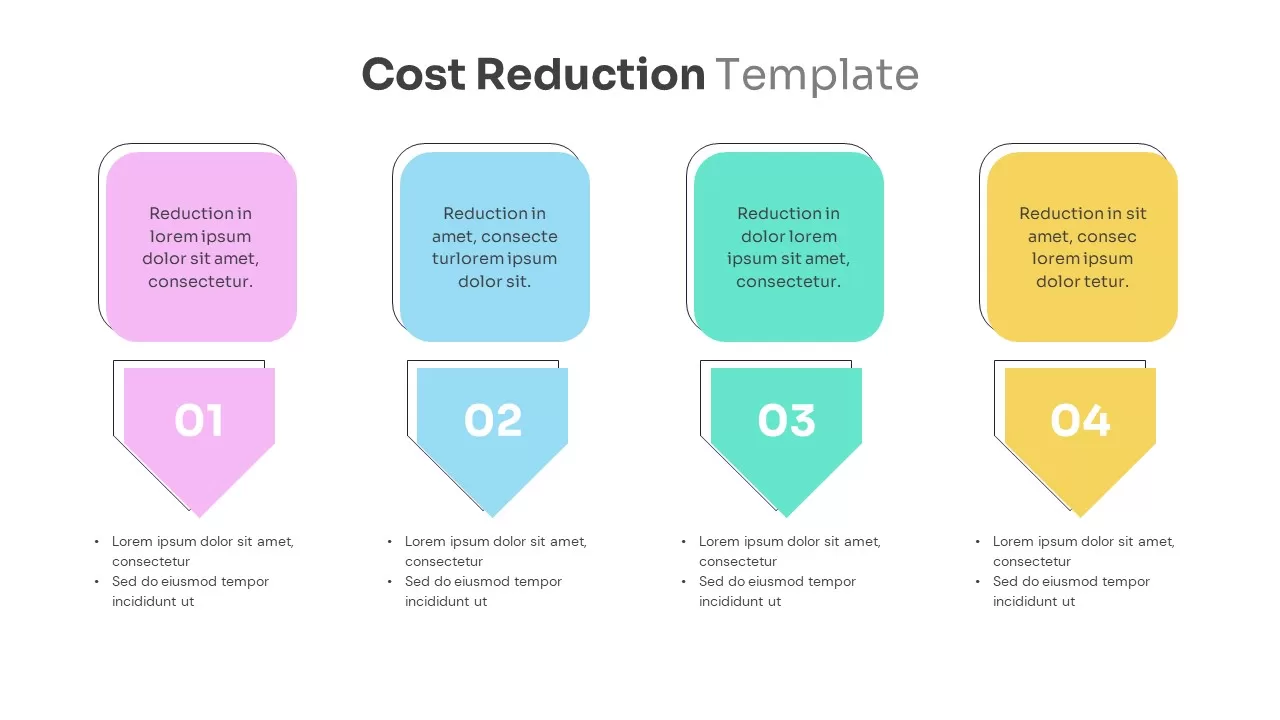
Cost Reduction Strategy template for PowerPoint & Google Slides
Business Strategy
Four-Step Cost Reduction Strategy Template for PowerPoint & Google Slides
Process
Cost Reduction Strategy Donut Chart Template for PowerPoint & Google Slides
Pie/Donut
Cost Reduction Infographic Template for PowerPoint & Google Slides
Process
Cost Reduction Strategy Roadmap Template for PowerPoint & Google Slides
Business Strategy
Interactive Multi-Use Cost Comparison Template for PowerPoint & Google Slides
Comparison
Cost Cutting Savings Dashboard Template for PowerPoint & Google Slides
Pie/Donut
Sunk Cost Fallacy Dragging Anchor Slide Template for PowerPoint & Google Slides
Infographics
Economies of Scale Cost Curve Comparison Template for PowerPoint & Google Slides
Comparison Chart
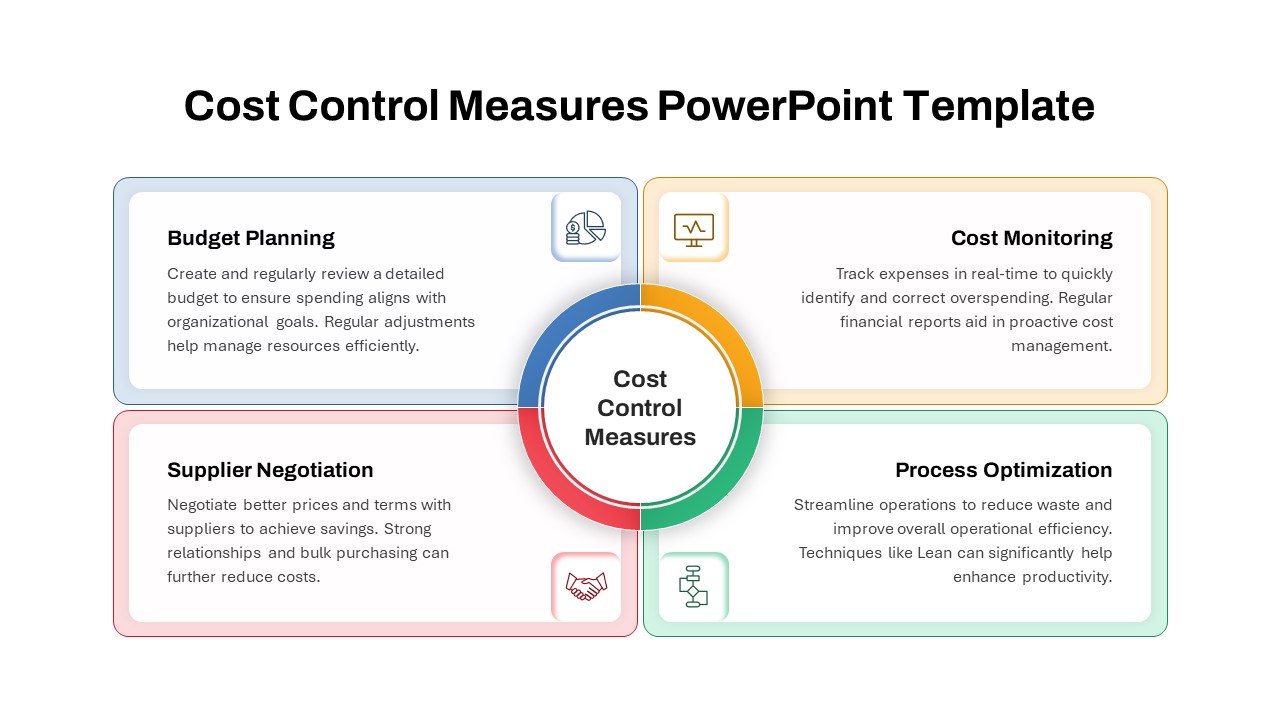
Cost Control Measures Infographic Template for PowerPoint & Google Slides
Circular
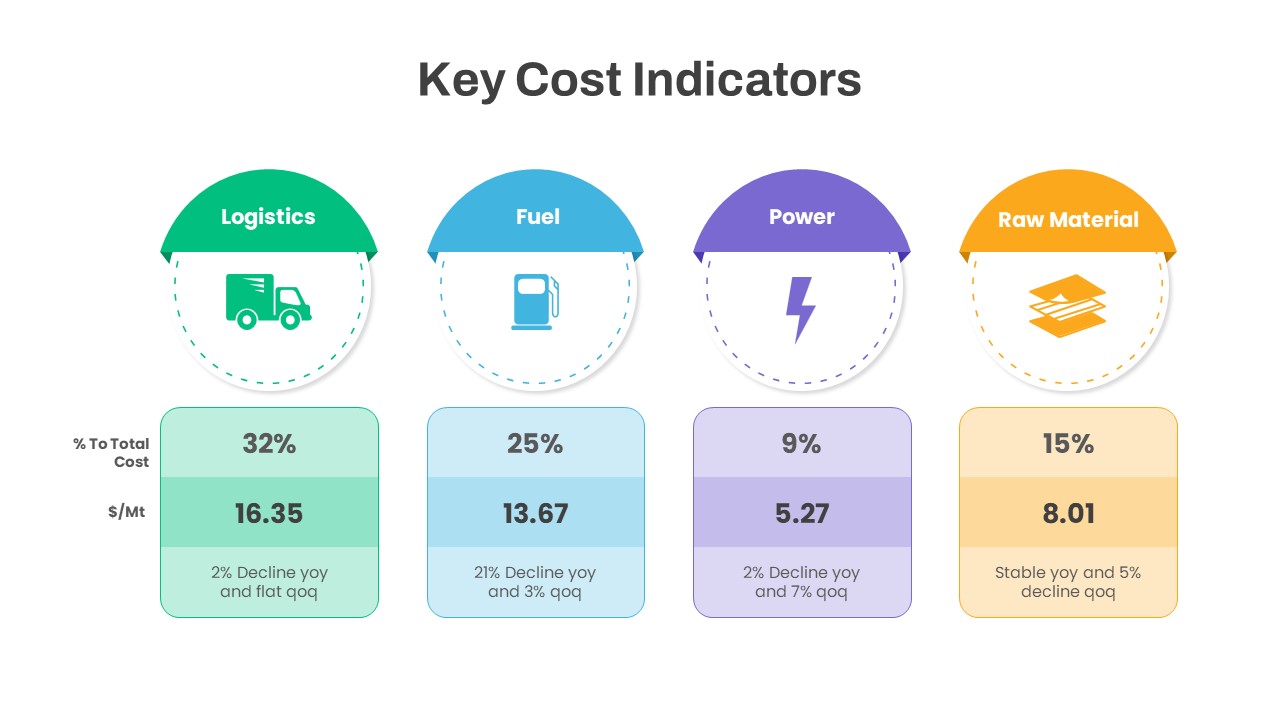
Key Cost Indicators Infographic Template for PowerPoint & Google Slides
Finance
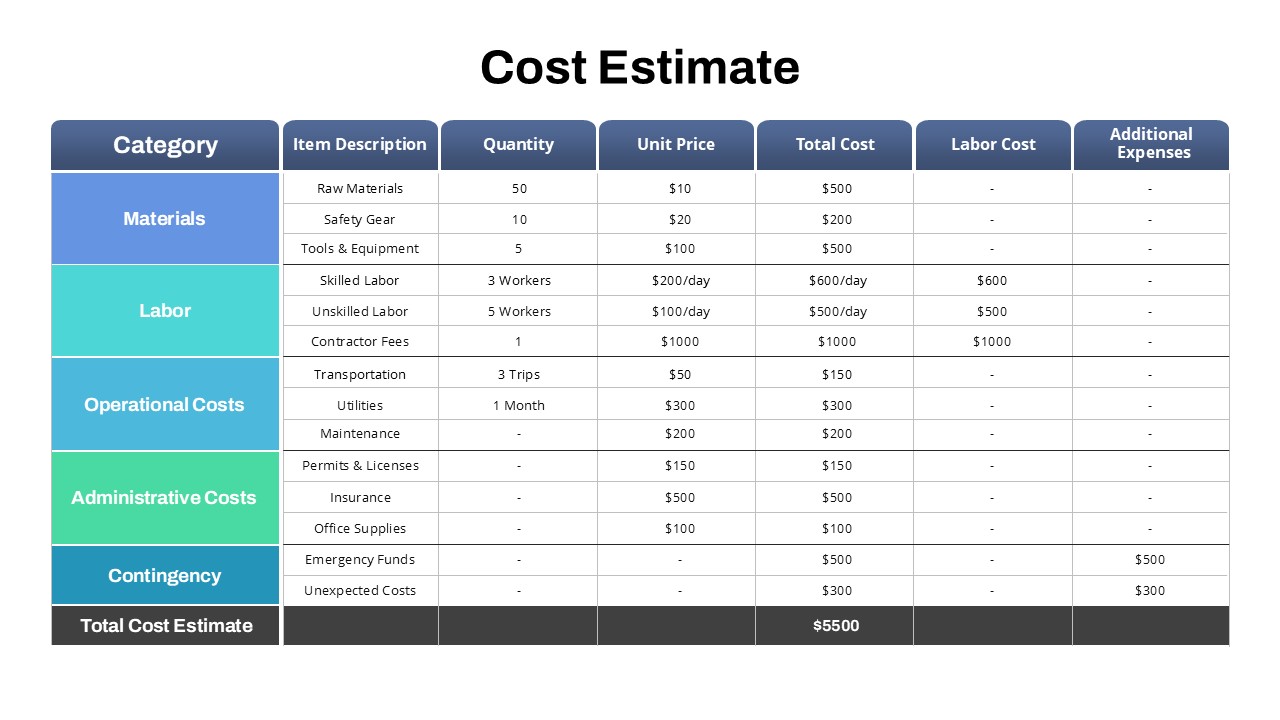
Project Detailed Cost Estimate Table Template for PowerPoint & Google Slides
Project
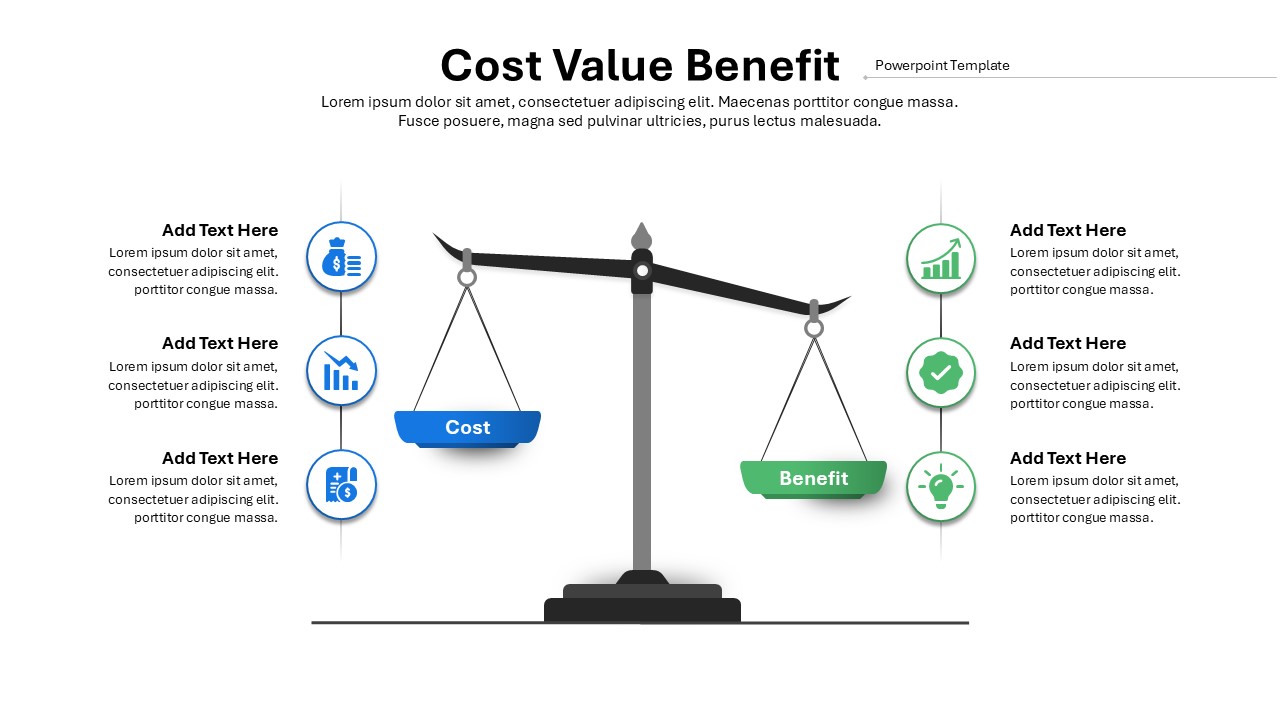
Cost vs Benefit template for PowerPoint & Google Slides
Charts
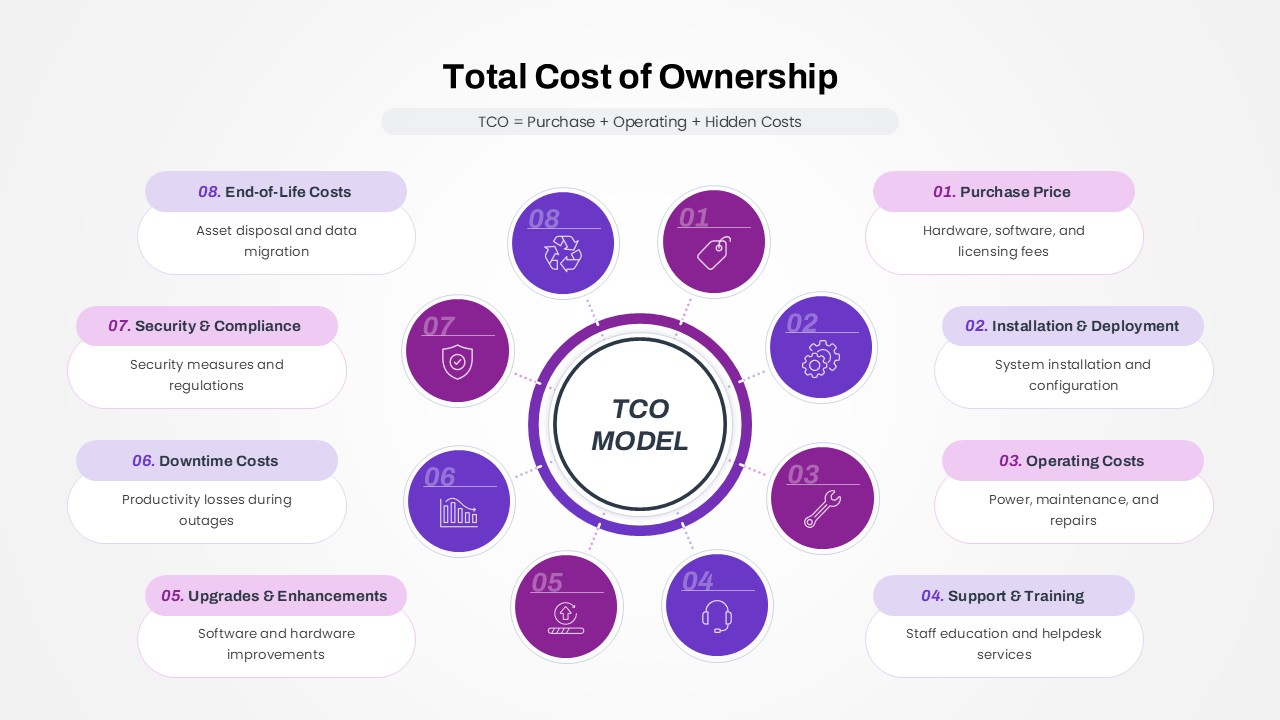
Total Cost of Ownership (TCO) Model template for PowerPoint & Google Slides
Business
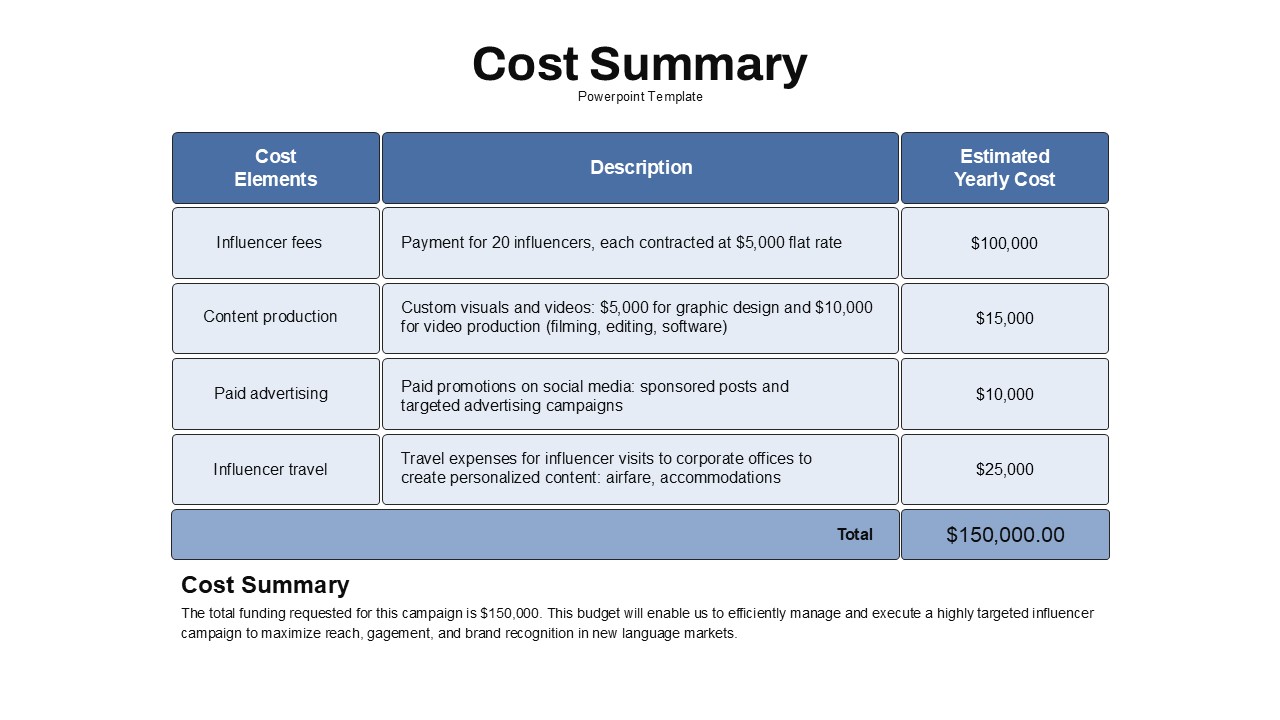
Cost Summary Table Template for PowerPoint & Google Slides
Business Report
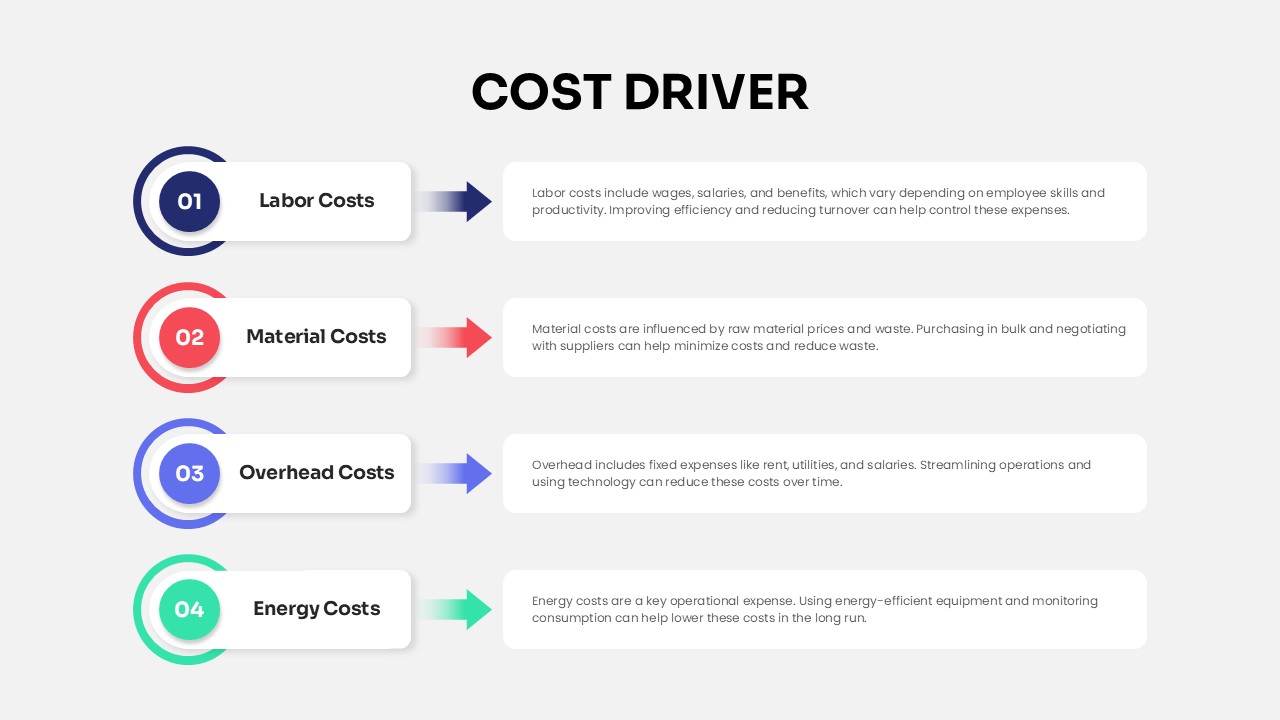
Cost Driver Infographic Slide Pack Template for PowerPoint & Google Slides
Process
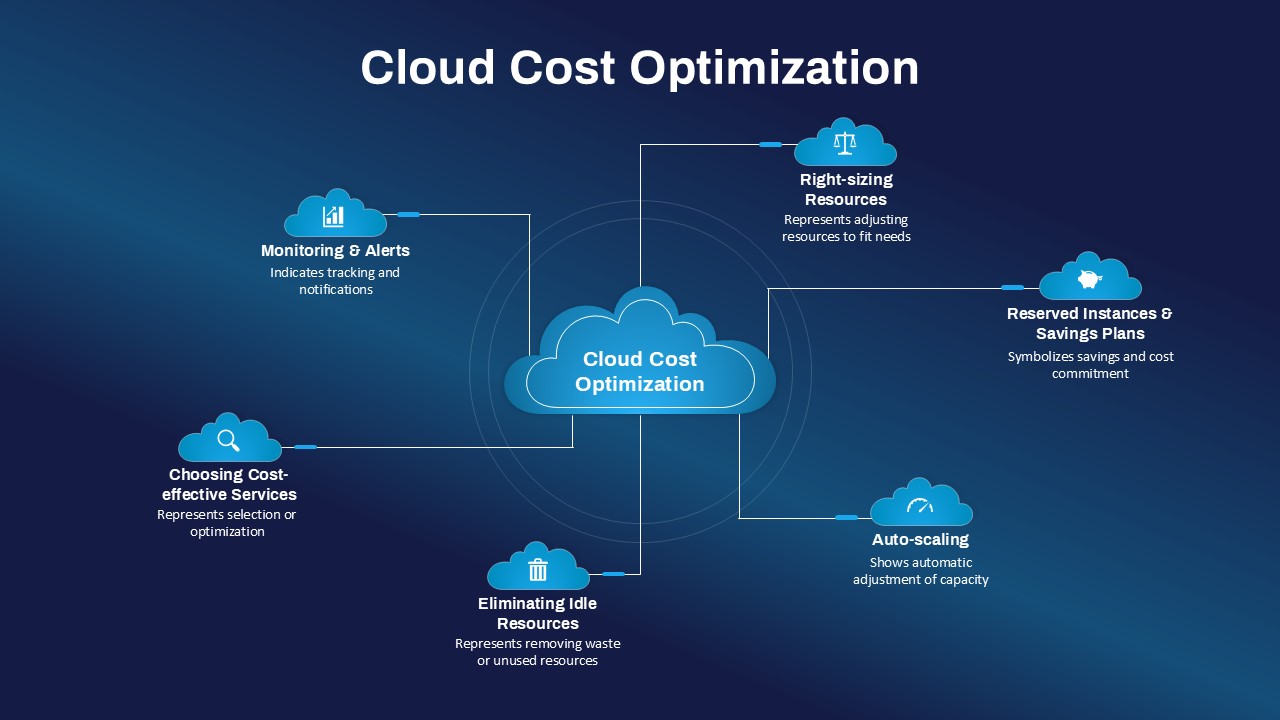
Cloud Cost Optimization Hub-and-Spoke Template for PowerPoint & Google Slides
Cloud Computing
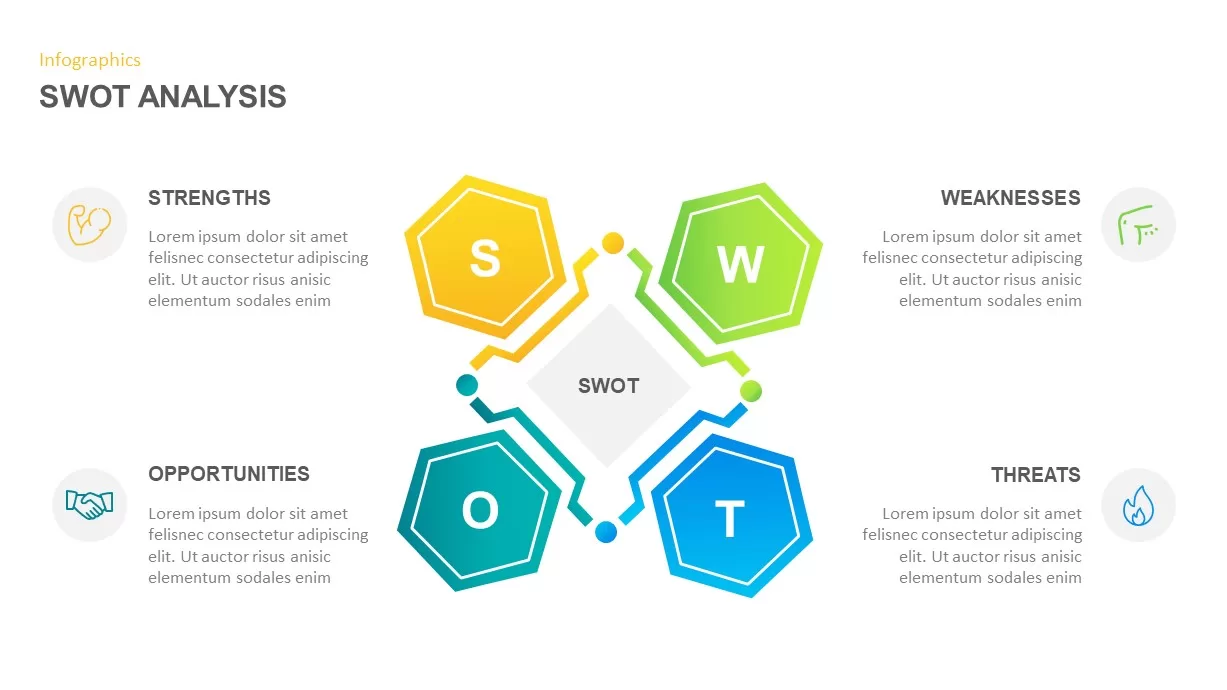
Modern Circle SWOT Analysis Diagram Template for PowerPoint & Google Slides
SWOT
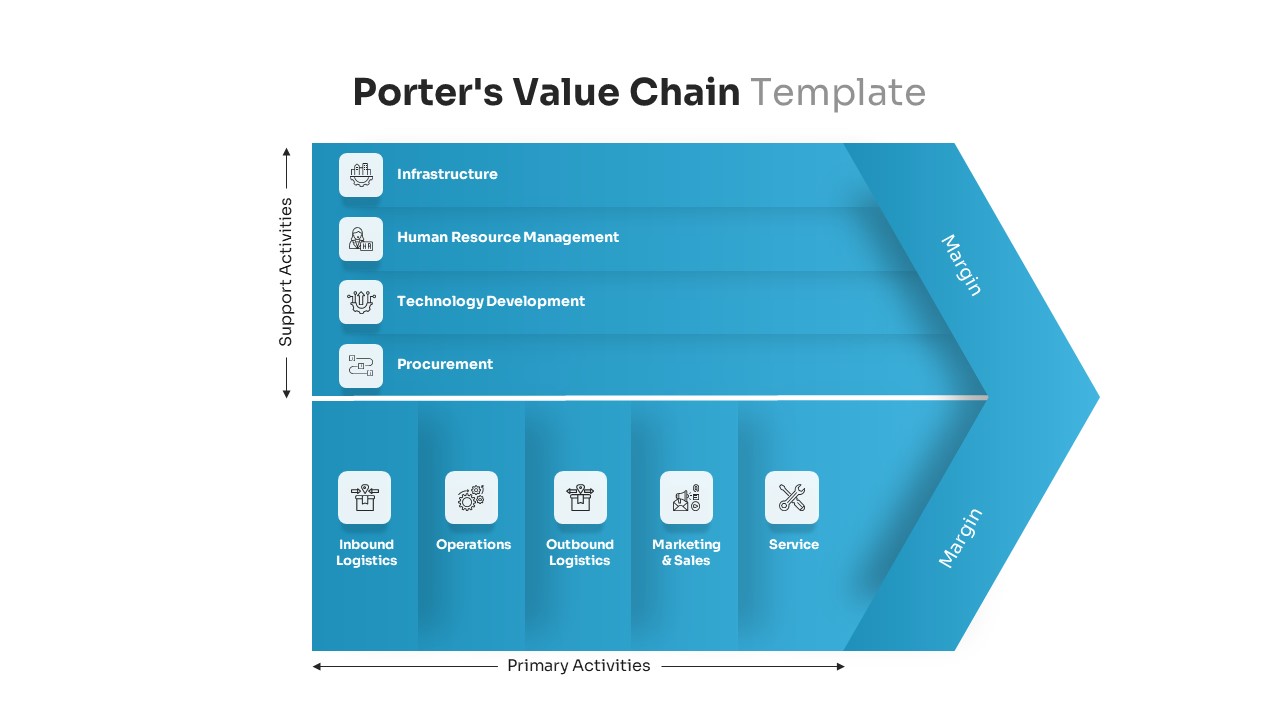
Porter’s Value Chain Analysis Diagram Template for PowerPoint & Google Slides
Business Strategy
Editable Force Field Analysis Diagram Template for PowerPoint & Google Slides
Business Plan

Professional PESTEL Analysis Diagram Template for PowerPoint & Google Slides
PEST
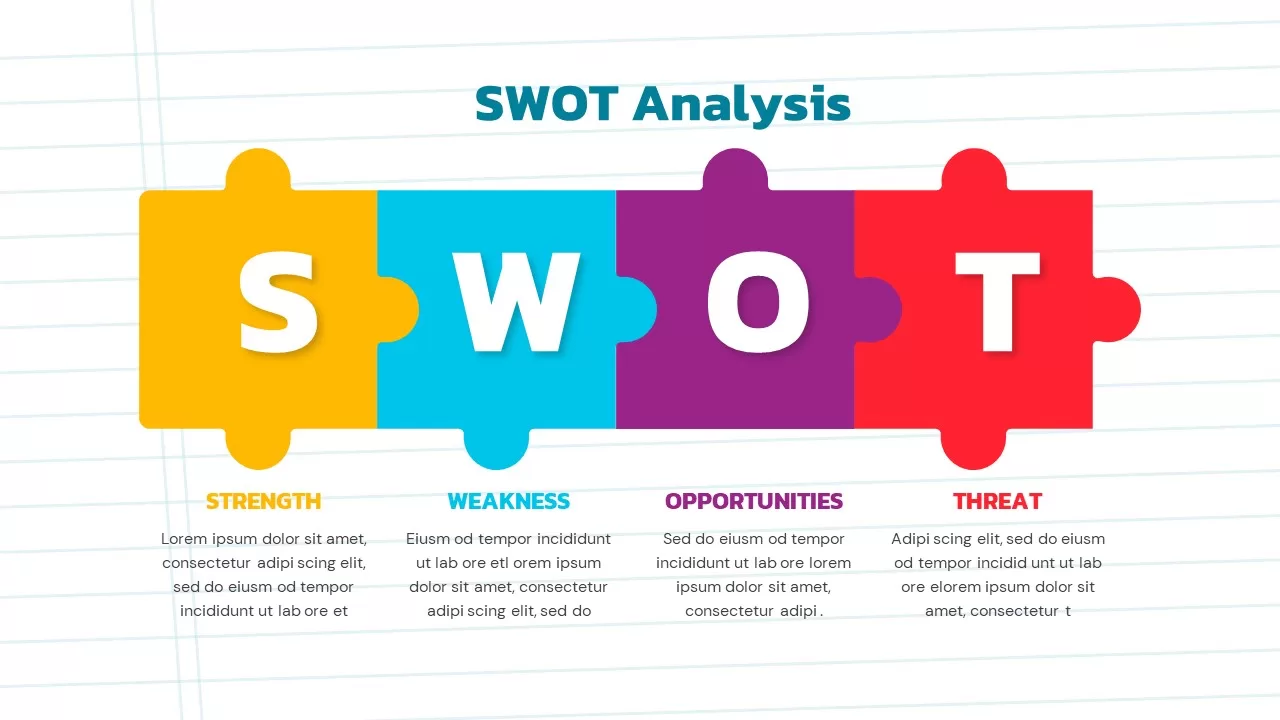
Puzzle-Style SWOT Analysis Table Diagram Template for PowerPoint & Google Slides
SWOT
PEST Analysis Circular Diagram Template for PowerPoint & Google Slides
PEST
PESTLE Analysis Table Layout Diagram Template for PowerPoint & Google Slides
PEST
SWOT Analysis Gear Diagram Slide Template for PowerPoint & Google Slides
SWOT

Interactive Gap Analysis Puzzle Diagram Template for PowerPoint & Google Slides
Gap
Cluster Analysis Infographic Diagram Template for PowerPoint & Google Slides
Business
Fishbone Diagram Analysis Template for PowerPoint & Google Slides
Flow Charts
Four-Quadrant SWOT Analysis Diagram Template for PowerPoint & Google Slides
SWOT
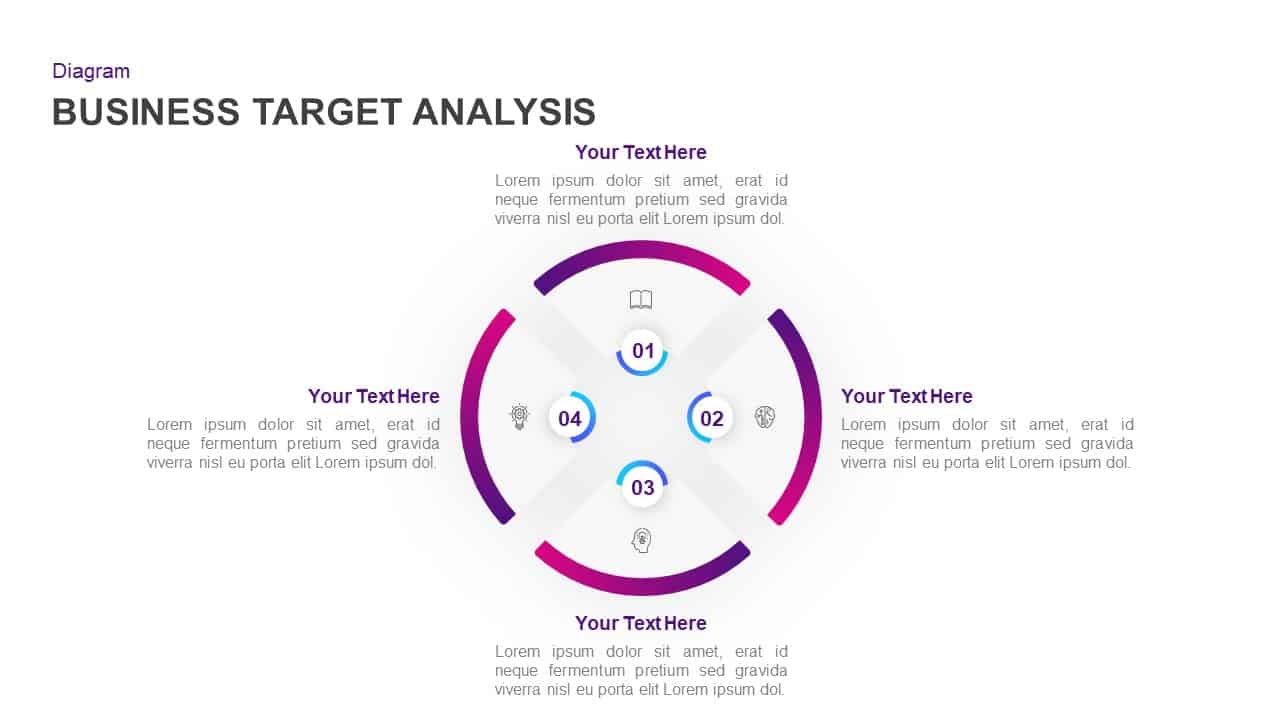
Business Target Analysis Diagram Template for PowerPoint & Google Slides
Circular
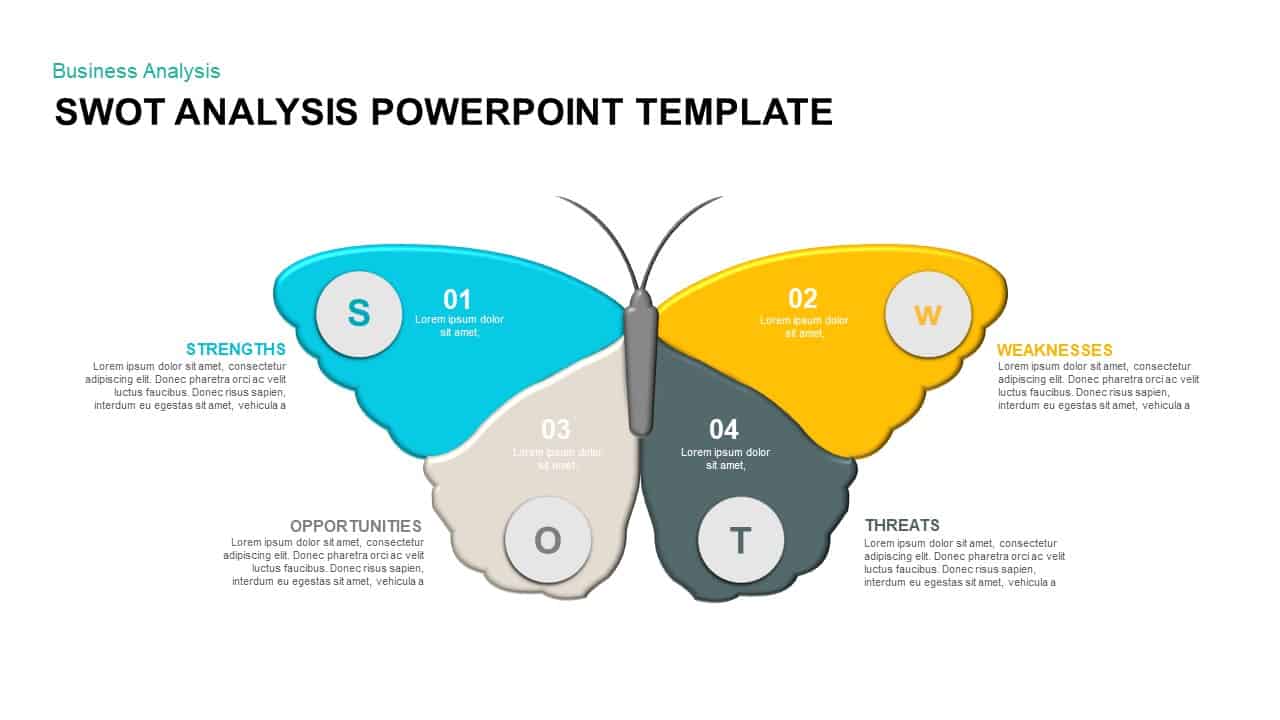
Butterfly SWOT Analysis Diagram Template for PowerPoint & Google Slides
SWOT
Four-Part SWOT Analysis Diagram Template for PowerPoint & Google Slides
SWOT
Fishbone Cause Analysis Diagram Template for PowerPoint & Google Slides
Process

SWOT Analysis Infographic Diagram Template for PowerPoint & Google Slides
SWOT
IQ Scale Analysis Diagram template for PowerPoint & Google Slides
Employee Performance
Puzzle Piece SWOT Analysis Diagram Template for PowerPoint & Google Slides
Opportunities Challenges
Six-Step Business Analysis Diagram template for PowerPoint & Google Slides
Circular
Business Process Analysis Cycle Diagram Template for PowerPoint & Google Slides
Business Strategy
Free Root Cause Analysis Fishbone Diagram Template for PowerPoint & Google Slides
Process
Free
Experience Curve Analysis Diagram Template for PowerPoint & Google Slides
Business Strategy

Colorful SWOT Analysis Diagram Template for PowerPoint & Google Slides
SWOT
Bottleneck Process Analysis Diagram Template for PowerPoint & Google Slides
Process
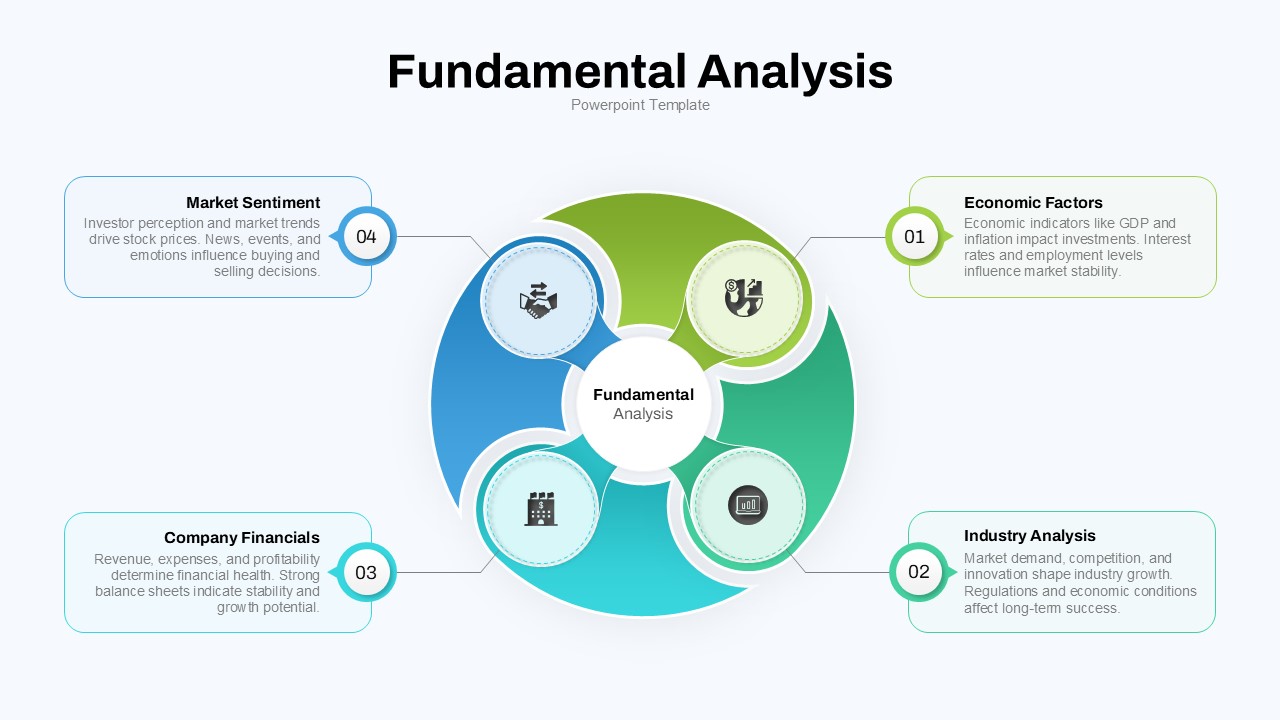
Fundamental Analysis Circular Diagram Template for PowerPoint & Google Slides
Circular
Cultural Web Analysis Circular Diagram Template for PowerPoint & Google Slides
Circular
DESTEP Marketing Analysis Diagram Template for PowerPoint & Google Slides
Circular
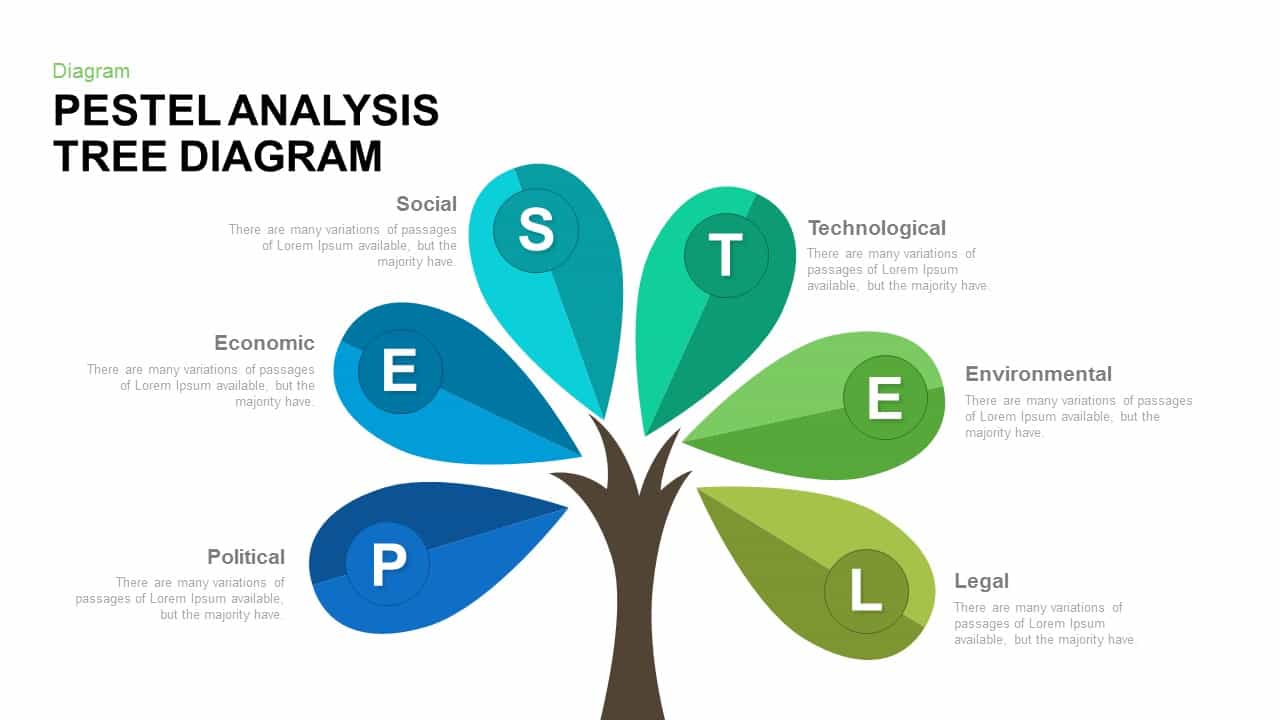
PESTEL Analysis Tree Diagram for PowerPoint & Google Slides
Process
5 Why Fishbone Diagram for Root Cause Analysis in PowerPoint & Google Slides
Process
PEST Analysis PowerPoint Template for PowerPoint & Google Slides
Business Strategy
Mobile Data Analysis Chart template for PowerPoint & Google Slides
Charts
Line Graph Analysis template for PowerPoint & Google Slides
Charts
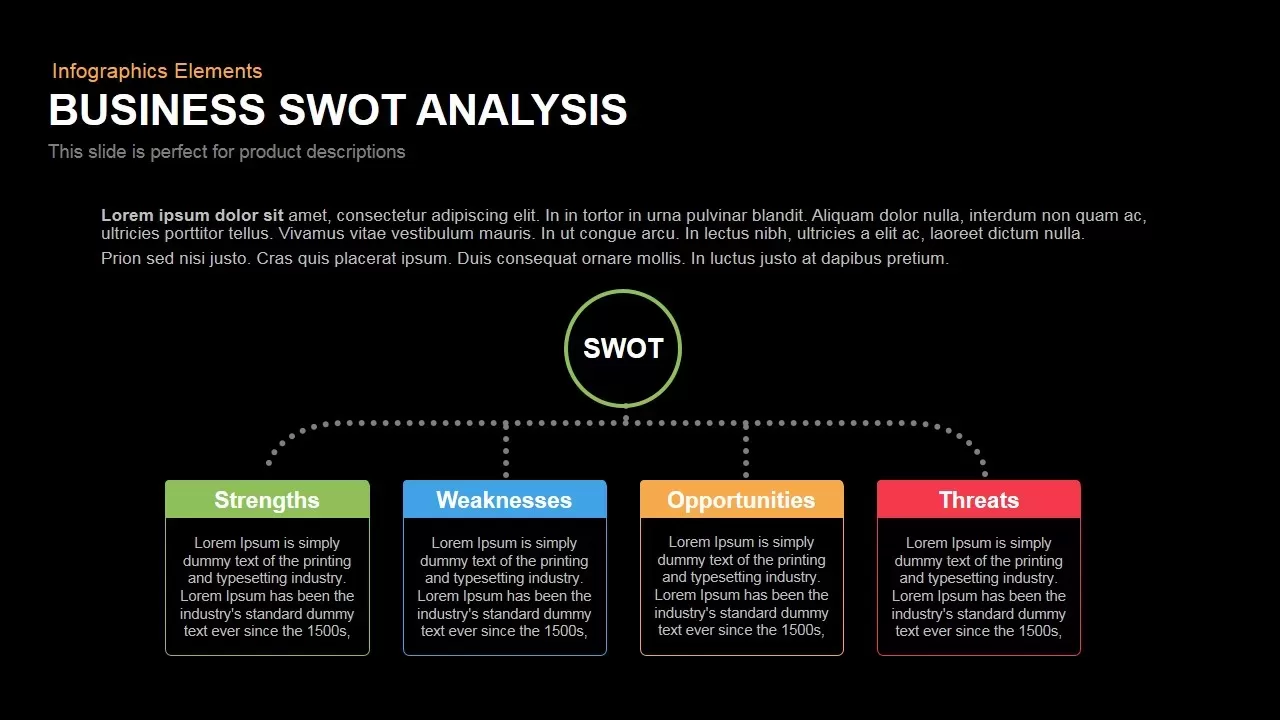
Box Business SWOT Analysis Template for PowerPoint & Google Slides
SWOT
Employee Skill Analysis Dashboard Template for PowerPoint & Google Slides
Employee Performance
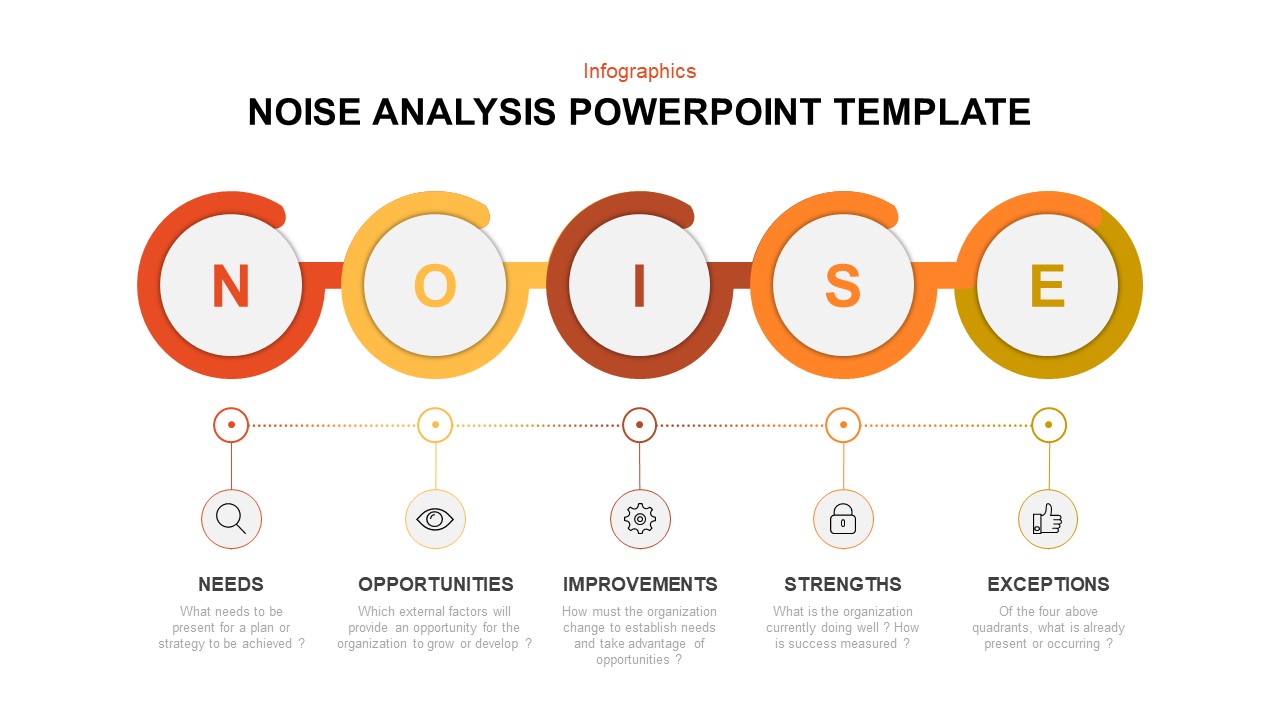
Modern Noise Analysis Infographic Template for PowerPoint & Google Slides
Process
Interactive 3D Puzzle SWOT Analysis Slide Template for PowerPoint & Google Slides
SWOT
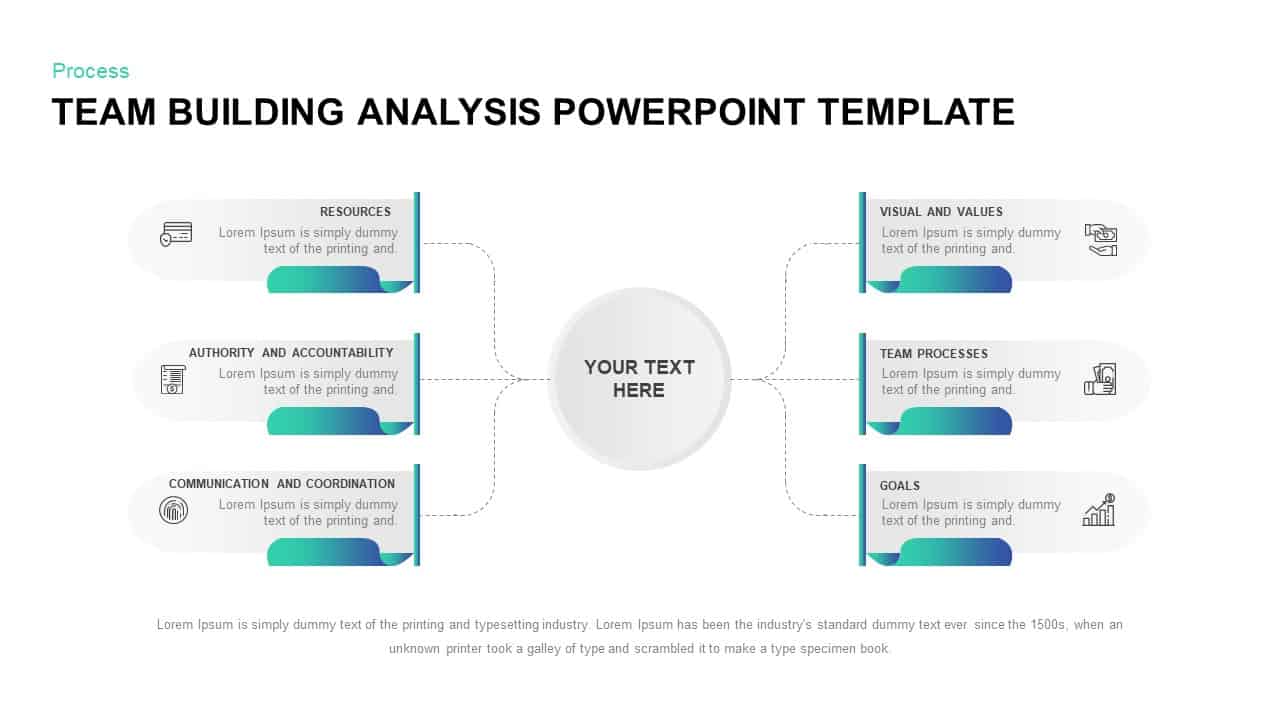
Team Building Hub-and-Spoke Analysis Template for PowerPoint & Google Slides
Process
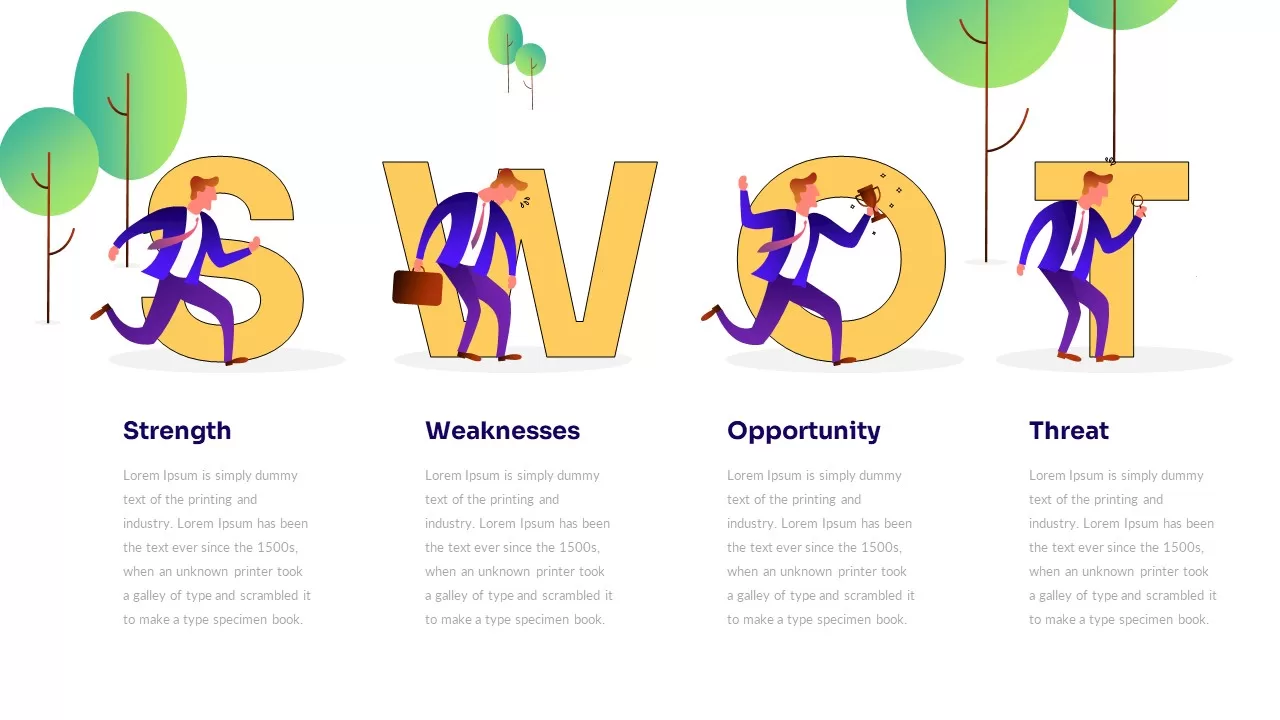
Illustrated Business SWOT Analysis Template for PowerPoint & Google Slides
SWOT
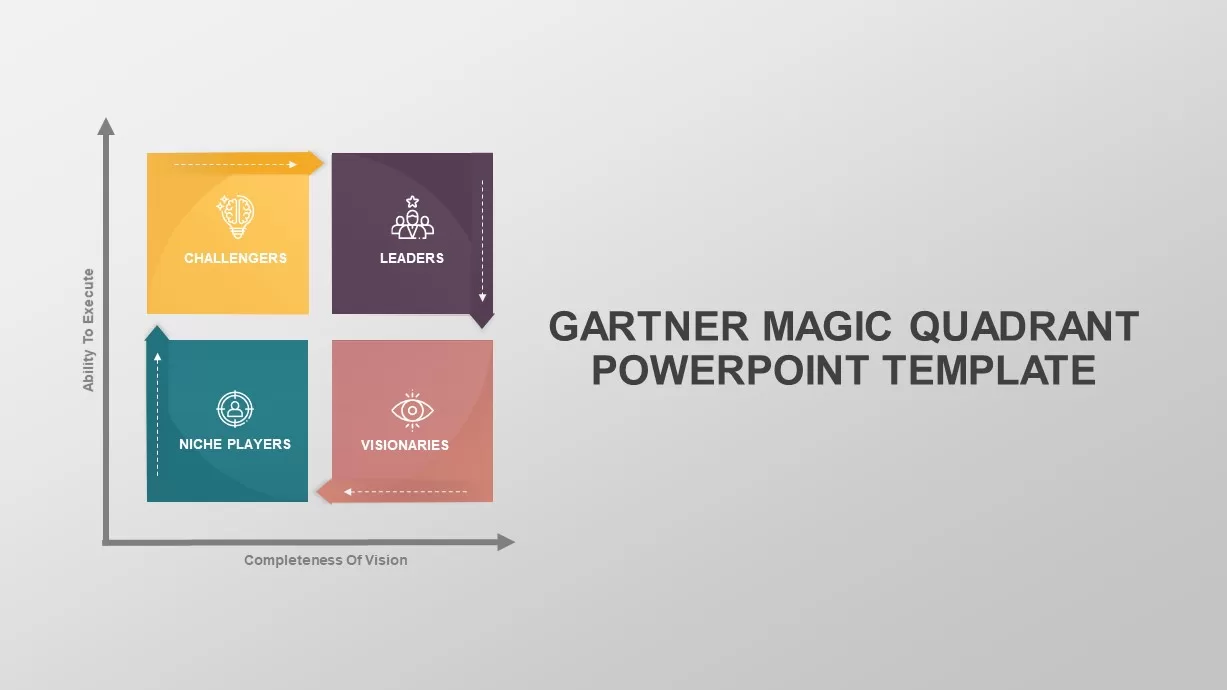
Gartner Magic Quadrant Analysis Template for PowerPoint & Google Slides
Business
Stakeholder Analysis Template for PowerPoint & Google Slides
Business
VRIO Analysis Infographic Template for PowerPoint & Google Slides
Business Strategy
SWOT Analysis Grid Infographic Template for PowerPoint & Google Slides
SWOT
Circular SWOT Analysis Infographic Template for PowerPoint & Google Slides
SWOT
CAGE Distance Analysis Framework Template for PowerPoint & Google Slides
Competitor Analysis
Colorful SWOT Analysis Quadrant Template for PowerPoint & Google Slides
SWOT
SWOT Analysis Overview template for PowerPoint & Google Slides
Business
SWOT Analysis Quadrant template for PowerPoint & Google Slides
Business Strategy
SWOT Analysis Blocks template for PowerPoint & Google Slides
Business Strategy
SWOT Analysis Template for PowerPoint & Google Slides
Business Strategy
SWOT Analysis template for PowerPoint & Google Slides
SWOT
Current vs Future State Analysis template for PowerPoint & Google Slides
Comparison
Six-Step Business Analysis Template for PowerPoint & Google Slides
Process
Trade Off Analysis Process template for PowerPoint & Google Slides
Process
Simple Scatter Chart Analysis Template for PowerPoint & Google Slides
Comparison Chart
Simple Area Chart Data Trends Analysis Template for PowerPoint & Google Slides
Comparison Chart
Expanding Margins Analysis Bar Chart Template for PowerPoint & Google Slides
Charts
Annual Growth Trend Analysis Chart template for PowerPoint & Google Slides
Business Report
Dynamic Financial Analysis Line Chart Template for PowerPoint & Google Slides
Finance
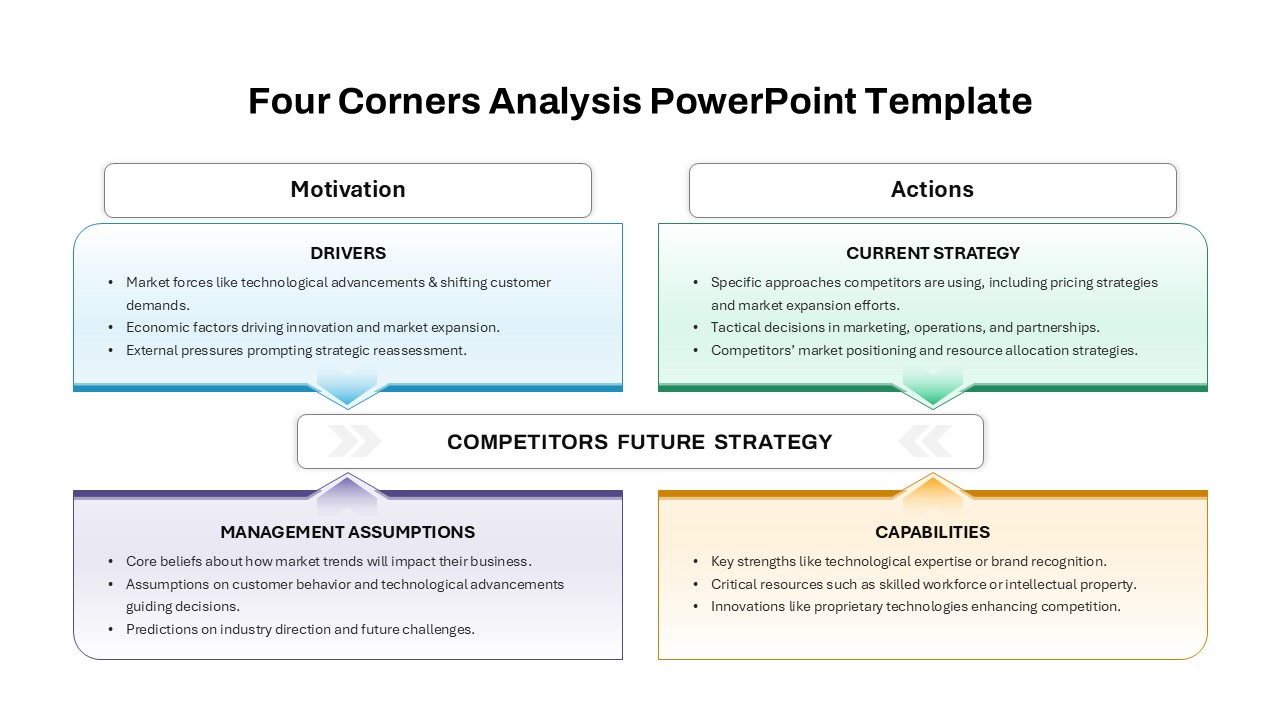
Four-Corners Strategic Analysis Quadrant Template for PowerPoint & Google Slides
SWOT
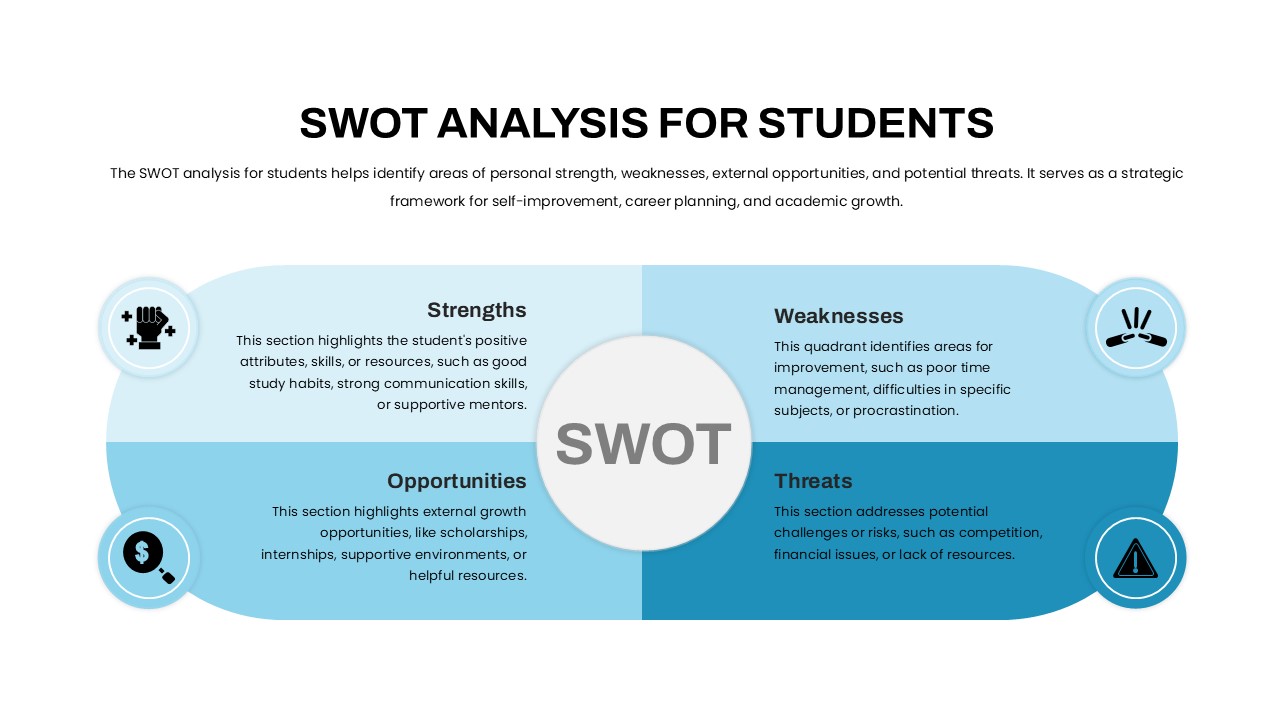
Student SWOT Analysis Framework Template for PowerPoint & Google Slides
SWOT
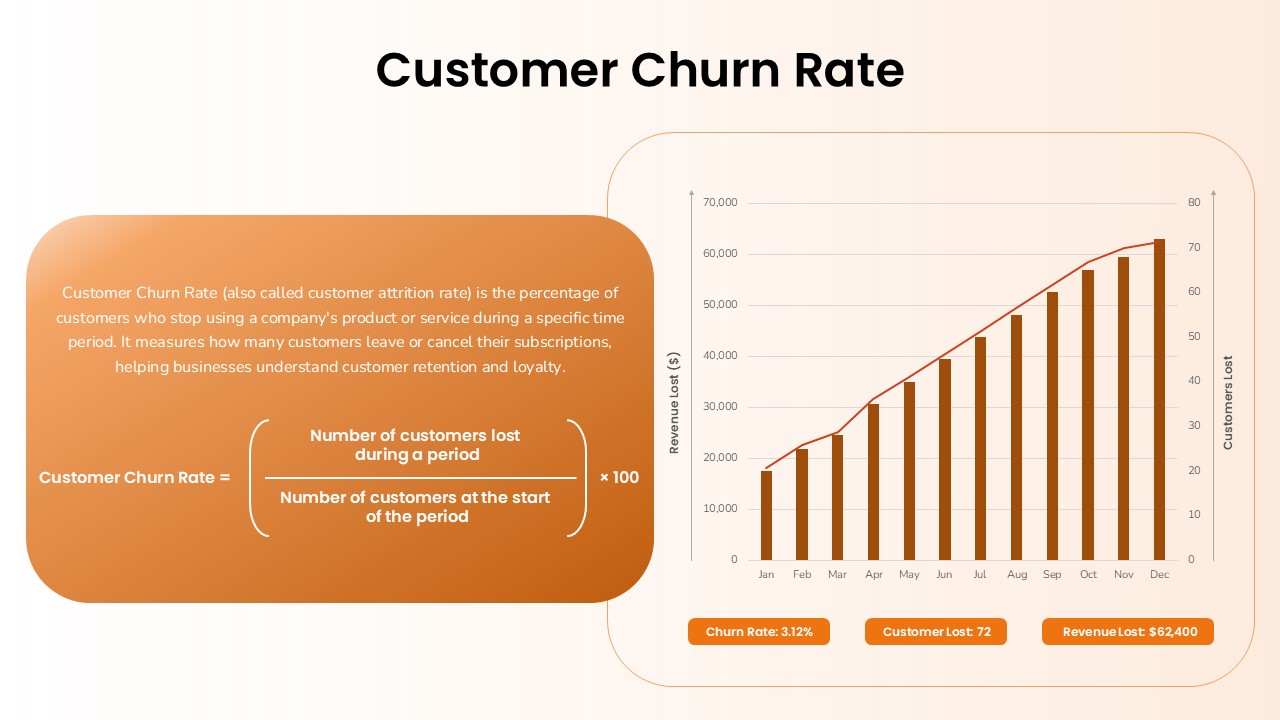
Customer Churn Rate Analysis template for PowerPoint & Google Slides
Business Report
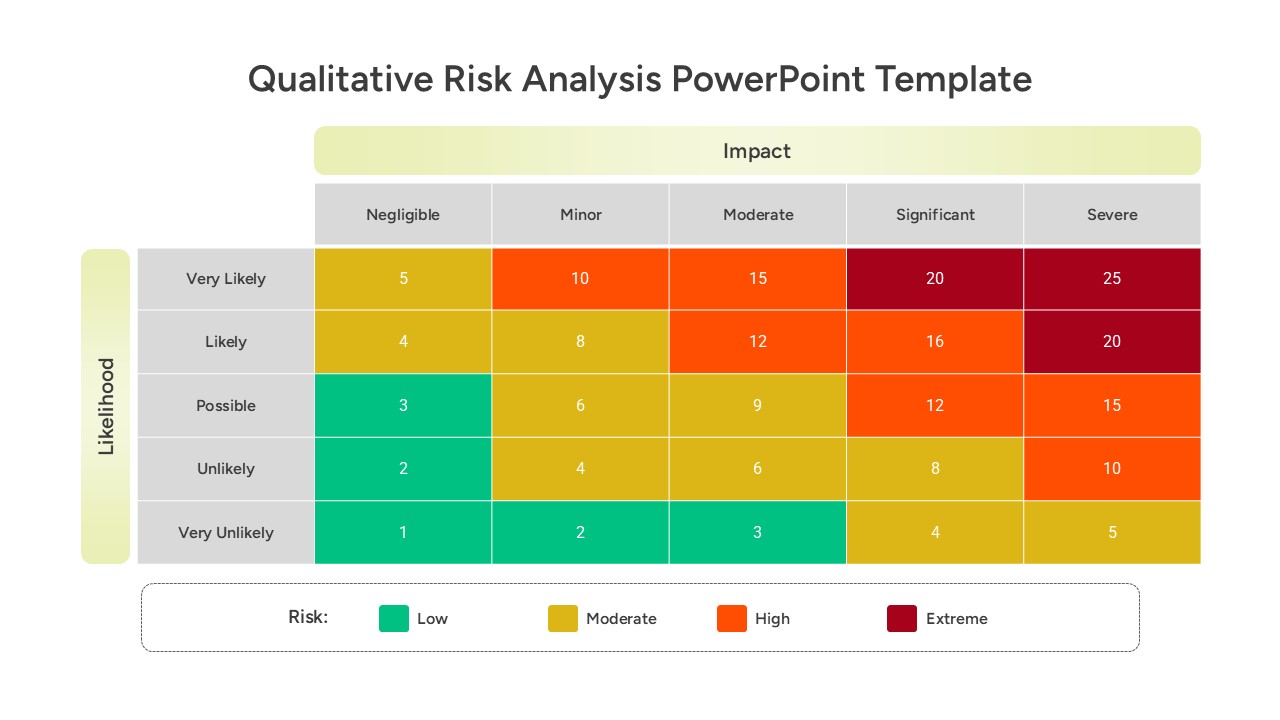
Qualitative Risk Analysis template for PowerPoint & Google Slides
Business
Quantitative Risk Analysis Matrix template for PowerPoint & Google Slides
Risk Management
Colorful SWOT Analysis Quadrant Template for PowerPoint & Google Slides
SWOT
SWOT Analysis Infographic with Circular Icons Template for PowerPoint & Google Slides
SWOT
Multi Color SWOT Analysis Quadrant Template for PowerPoint & Google Slides
SWOT
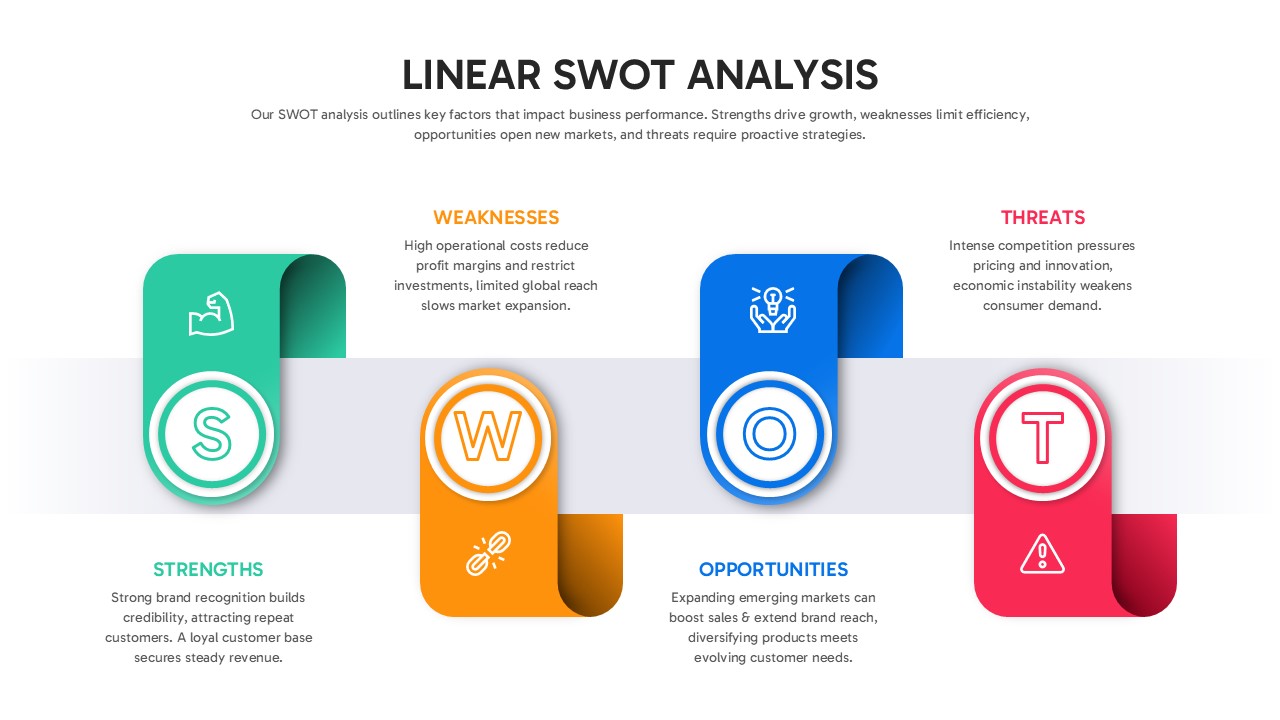
Linear SWOT Analysis Slide Template for PowerPoint & Google Slides
SWOT
Personal SWOT Analysis Matrix Cards Template for PowerPoint & Google Slides
SWOT
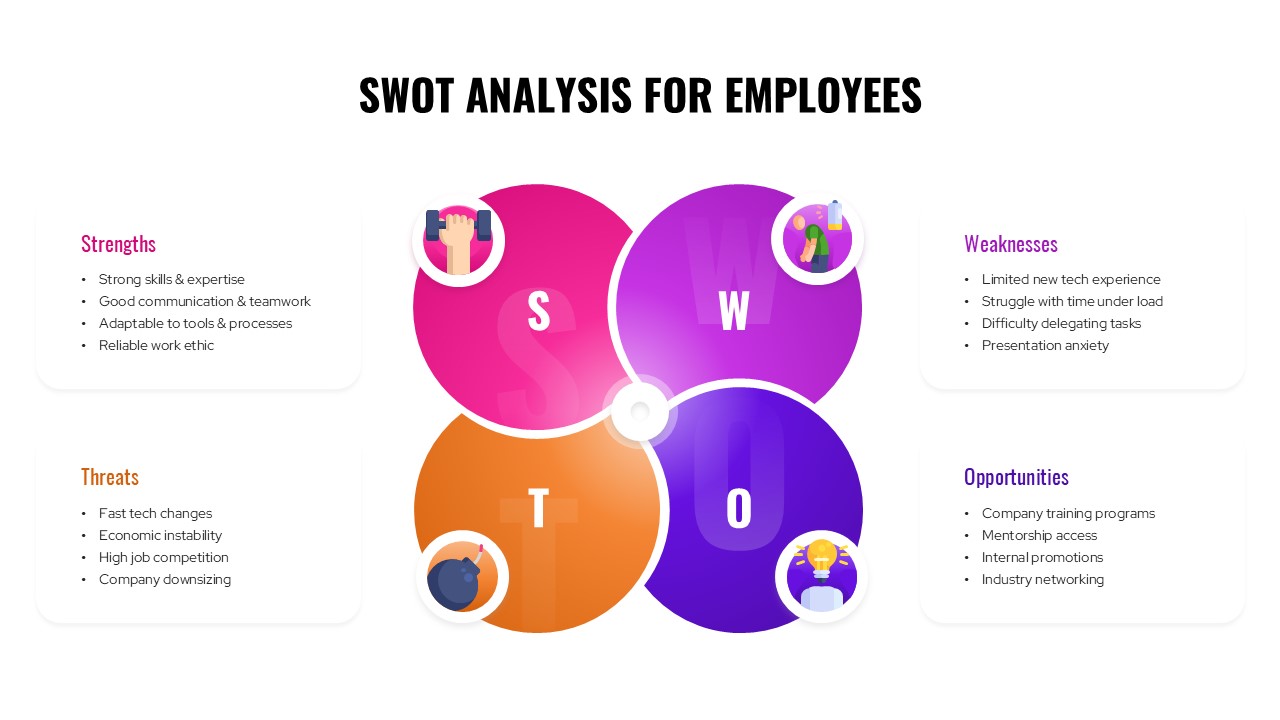
SWOT Analysis For Employees Template for PowerPoint & Google Slides
SWOT
Financial Gap Analysis Framework Template for PowerPoint & Google Slides
Finance