8 Step Circular Diagram Template for PowerPoint
8 Step Circular Diagram PowerPoint Template
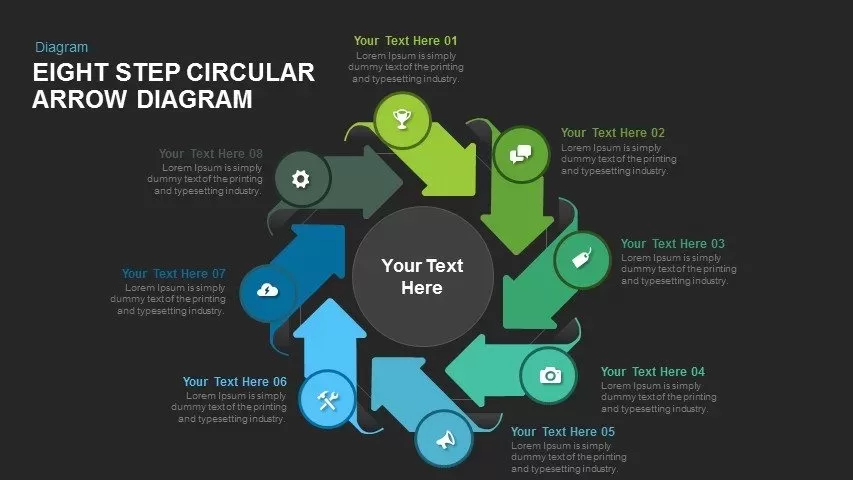
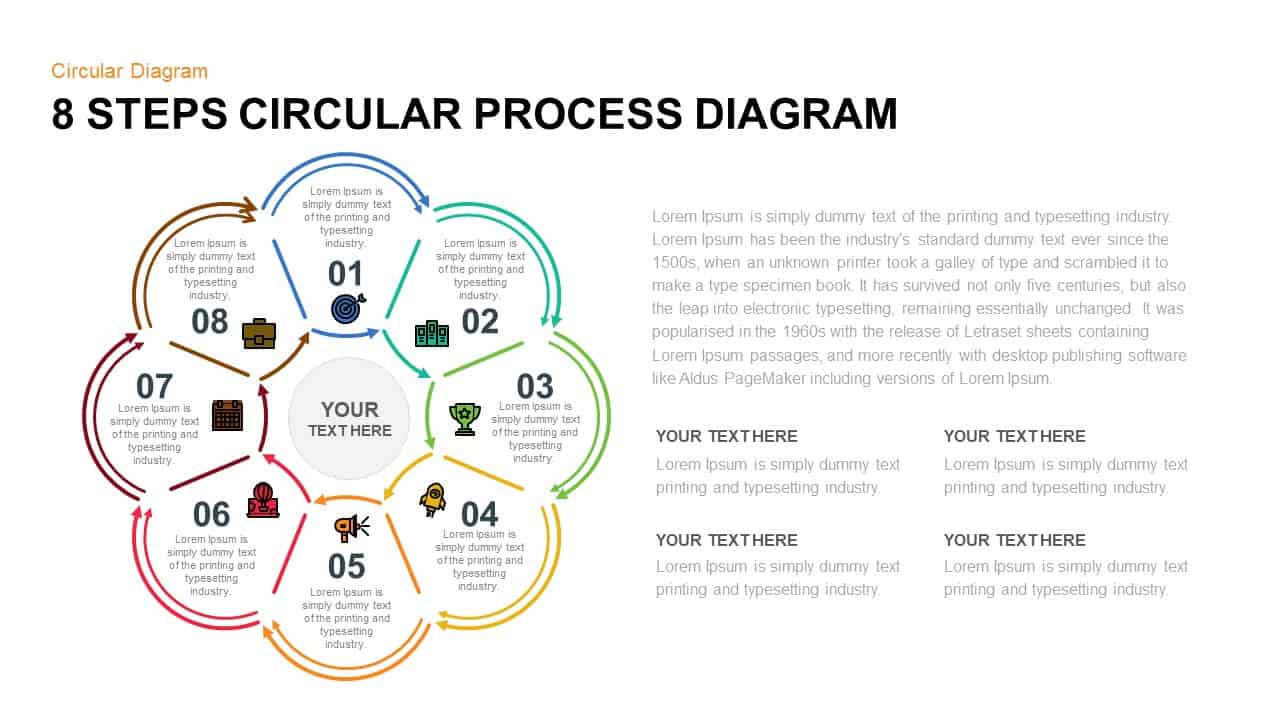
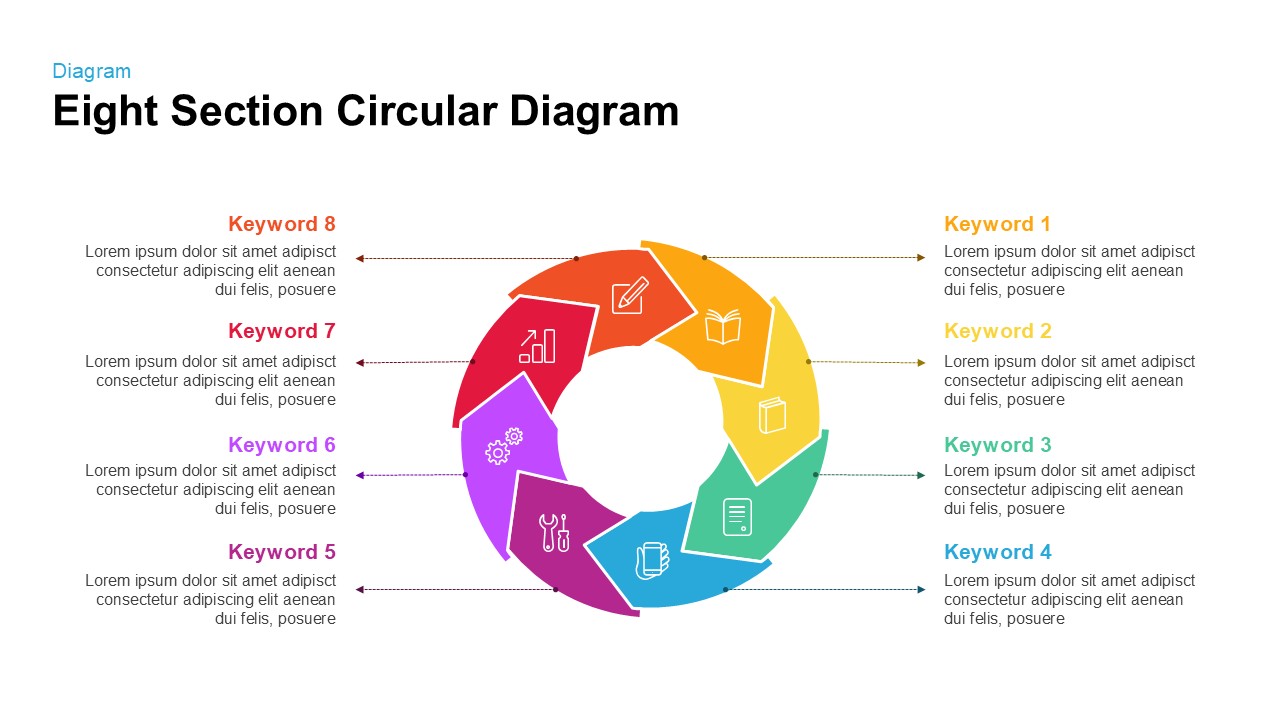
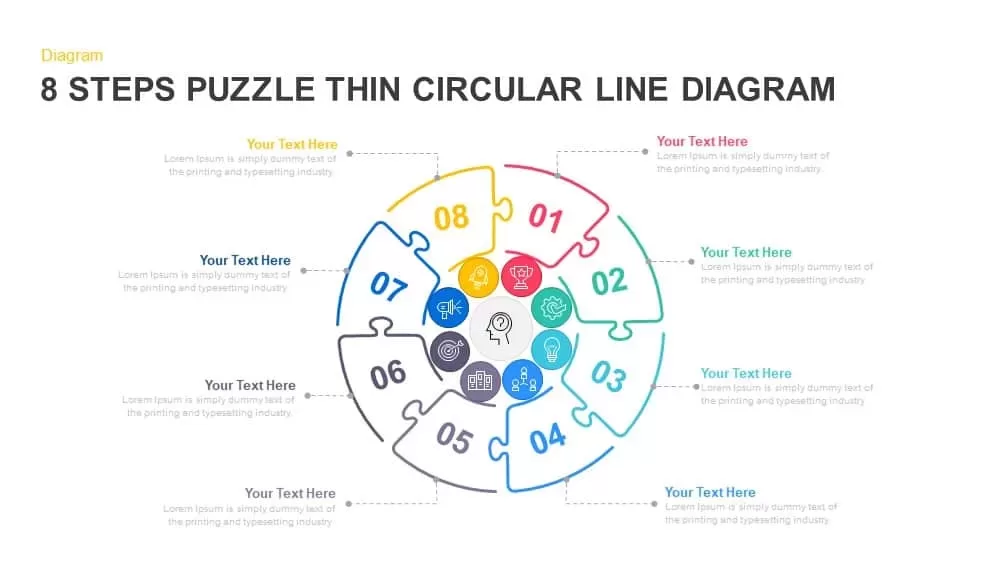
8 step circular diagram template is a creative star PowerPoint template with multi-colored segments. This innovative circle diagram template is created for presenting information in an engaging tone. Multi-functional infographics have several uses including business presentations and academic presentations. The presenters can use this diagram as their cover slide or introduction template for the presentation containing 8 steps or 8 concepts. in this diagram, the outer text descriptions zones are emptied, and the presenters can add their topics on the surface of the inner PowerPoint shapes that create process flow feeling. Add your key heading to the center and make your presentation impressive. The yellowish and orange color combinations have given saffron look to the diagram, so the viewers can hear your topic with the feel of tranquility. You can access more Circular Diagrams & PowerPoint templates here. Grab the free ppt now!
Eight-step circular diagram PowerPoint contains mini-circles on each star vertex. These mini-circles comprise meaningful infographic icons for your business management presentation. The eight vertexes are eight components of your presentation i.e. indicated by the numbers. The diagram is enabling to the illustration of eight stages of business development or eight strategies that improve your business and organization. The pattern is best to create a presentation on sales and marketing. Presenters can show the operational strategies to achieve sales growth and target. The users can select their own topic and deliver a simple and stunning presentation using the eight segment diagram PowerPoint template.
The customization does not need extraordinary PowerPoint knowledge; just updating the regular PowerPoint shapes, size, color, effects and updating the text placeholders will be sufficient for the regular user to reach a professional outcome without the help of a designer. The eight stages PowerPoint template can be used as the main concept of an infographic or the driving diagram of a process flow description. Moreover, you can add text placeholders on the empty areas if you needed. But don’t mess up your presentation by creating more zones for descriptions.
Login to download this file


