8 Circle Venn Diagram PowerPoint Template
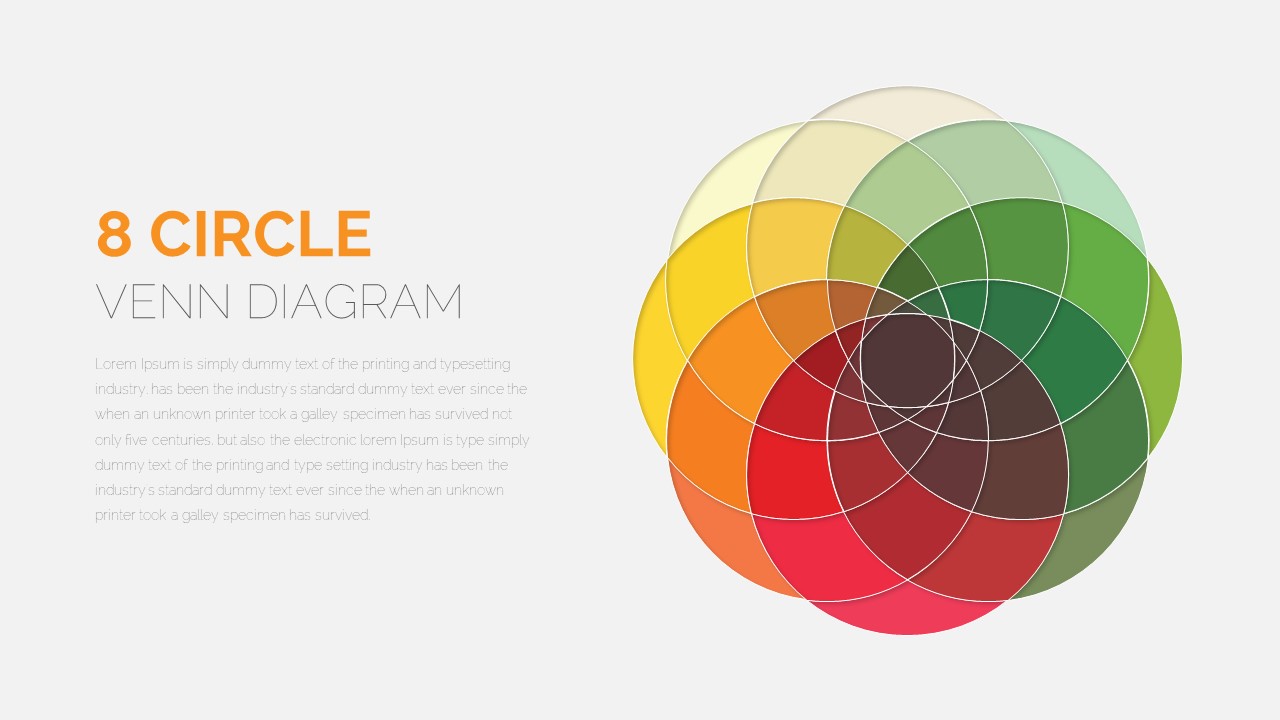
8 Circle Venn Diagram PowerPoint Template is a logical diagram demonstrating crossing circle shapes to show the relationship among eight groups. Generally, a Venn diagram presents similarities and differences between two or more items. This Venn also allows users to produce engaging presentations by evaluating complex data sets. Each circle PPT in the diagram intersects with one another. There is myriad use for Venn diagram PowerPoint templates, from research purposes to teaching fundamental set theory. Venn diagrams are the perfect alternative for statistics presentations and math presentations. These editable diagrams with complex Venn diagram PowerPoint design include text and graphics in the 8 circle Venn diagram template.
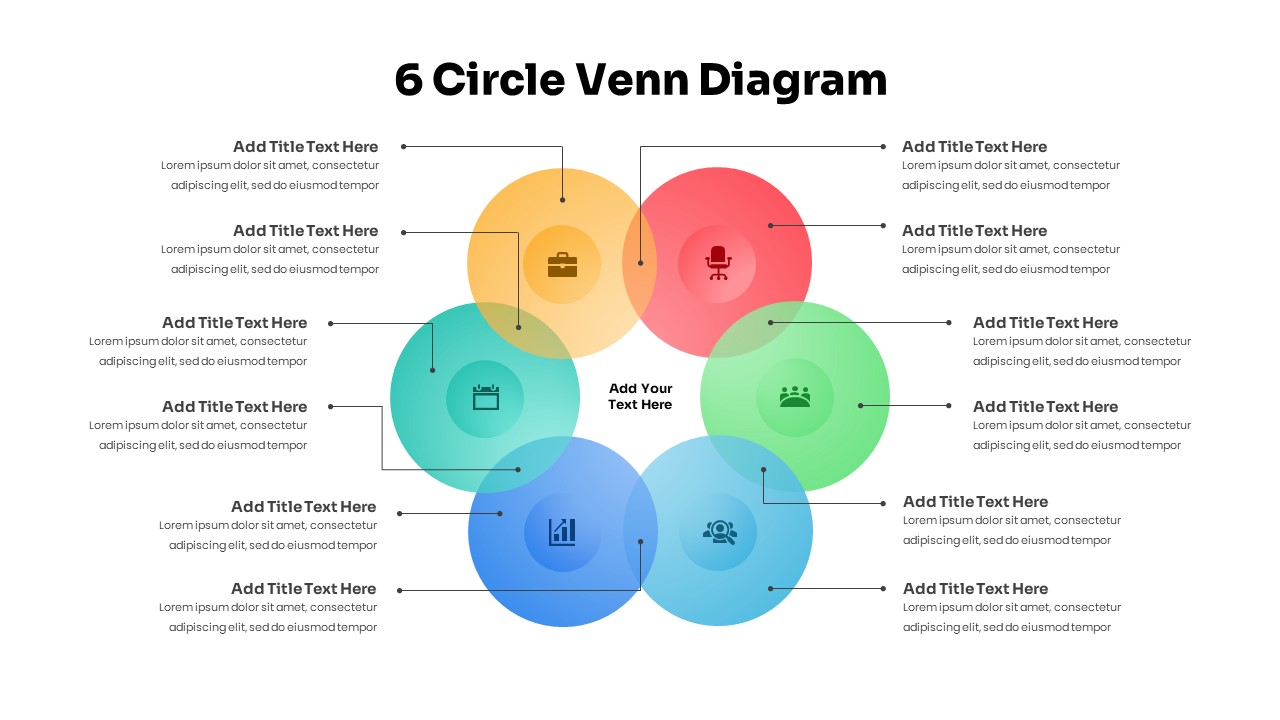
8 circle Venn diagram template for PowerPoint is a learning template for education. So, teachers, business managers, researchers, and professionals can use the PowerPoint Venn diagram for multiple purposes. This Venn diagram allows users to present similarities and differences between items. Each PPT circle is colored red, light green, light blue, blue, green, and yellow. This Venn diagram PowerPoint has two types of colorings; two slides come in full color fills all around. However, another two slides show a discoloring effect to project the logic in easy to understand color mix.
The color codes and the discolor pattern enable users to understand the logical relationship between the data sets. This diagram is created for professionals who want to show a complex data set using a Venn diagram PPT template. Download and make changes in color, size, and placement of text holders according to your requirements. If you want to know more, check out our blog about Best Venn Diagram Templates 2024.
Login to download this file


