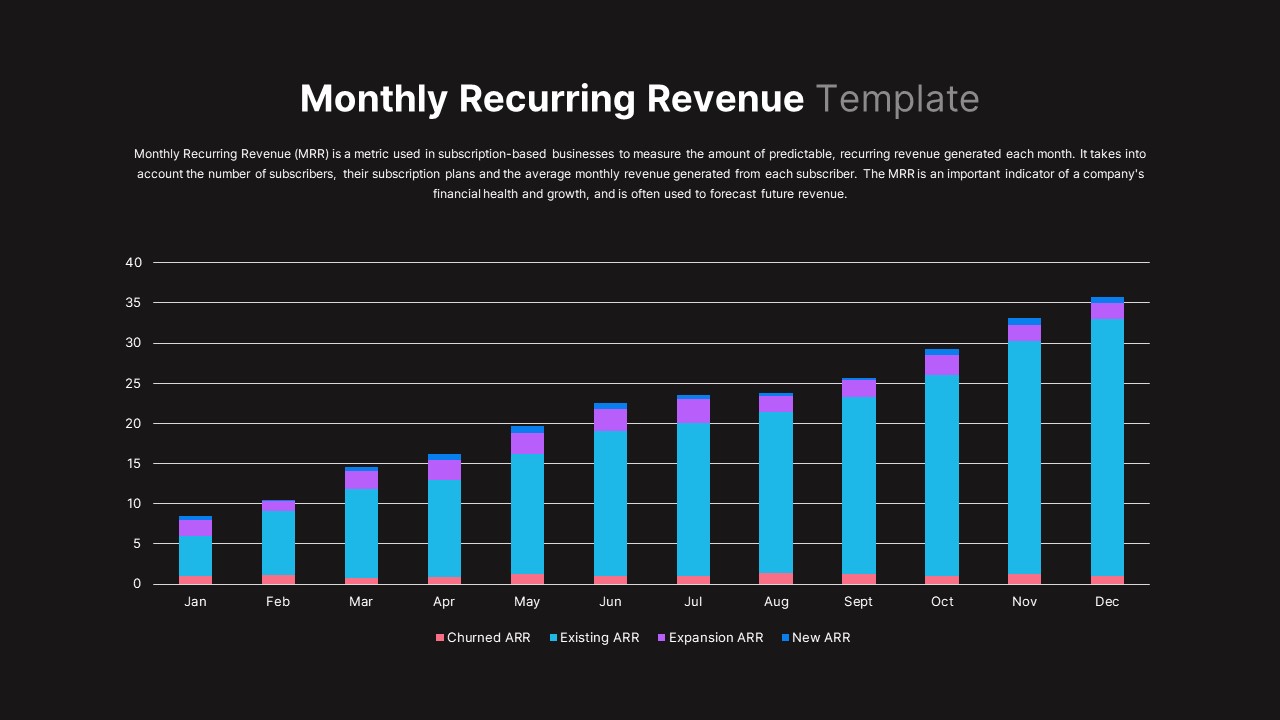
Monthly Recurring Revenue KPI Bar Chart Template for PowerPoint & Google Slides


Description
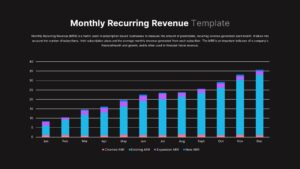
Use a robust chart template to present Monthly Recurring Revenue (MRR) trends with layered ARR segmentation—new, existing, expansion, and churned ARR—across a 12-month period. Each stacked bar uses a distinct pastel hue and clean axis labels, enabling audiences to compare revenue components at a glance. The slide features a clear title area at the top, a subtitle text block for metric definitions, and a full-width chart grid with horizontal guide lines to enhance readability. Vector-based bars and category markers ensure pixel-perfect scaling on any screen resolution, while the legend at the bottom automatically updates when ARR segment names or colors are edited. Fine-tune colors, swap icons, or adjust data labels within PowerPoint or Google Slides through master-slide controls—no advanced formatting required.
This template is built on master slides and grouped layers, making it easy to add annotations, callout shapes, or overlay trendlines without disrupting the underlying structure. Use built-in data placeholders to input your own ARR values, and leverage hidden alignment guides to maintain consistent formatting when resizing or moving elements. The neutral white background and minimalist typography keep the focus on the data, while subtle drop shadows under each stack bar add depth. Whether you need to showcase subscriber growth forecasting, churn analysis, or expansion revenue impact, this chart slide delivers a polished, professional presentation instantly—complete with dynamic editing options and seamless integration across devices.
Extend this slide by inserting trend markers, percentage callouts, or custom icons to highlight key months where ARR spikes or dips. Include comparison markers for year-over-year growth or overlay a target line to track performance against goals. All chart elements reside in named groups within the slide schema, simplifying layer visibility toggles and export of individual components for documentation.
Who is it for
CFOs, finance managers, subscription-based business leaders, and revenue analysts will benefit from this slide when reporting on MRR performance, forecasting growth, or conducting board-level financial reviews.
Other Uses
Beyond MRR reporting, repurpose this chart for sales pipeline analysis, quarterly KPI tracking, budget variance comparisons, or customer cohort revenue breakdowns.
Login to download this file

Item ID
SB03351
Related Templates

Annual Recurring Revenue Metrics Template for PowerPoint & Google Slides
Bar/Column
Premium

Application Revenue Line Chart KPI Template for PowerPoint & Google Slides
Revenue
Premium

Monthly Reports Bar Chart template for PowerPoint & Google Slides
Bar/Column
Premium
Statistics Infographic & KPI Bar Chart Template for PowerPoint & Google Slides
Bar/Column
Premium
Entertainment Industry Revenue Bar Chart Template for PowerPoint & Google Slides
Bar/Column
Premium
Quarterly Revenue Comparison Bar Chart Template for PowerPoint & Google Slides
Bar/Column
Premium
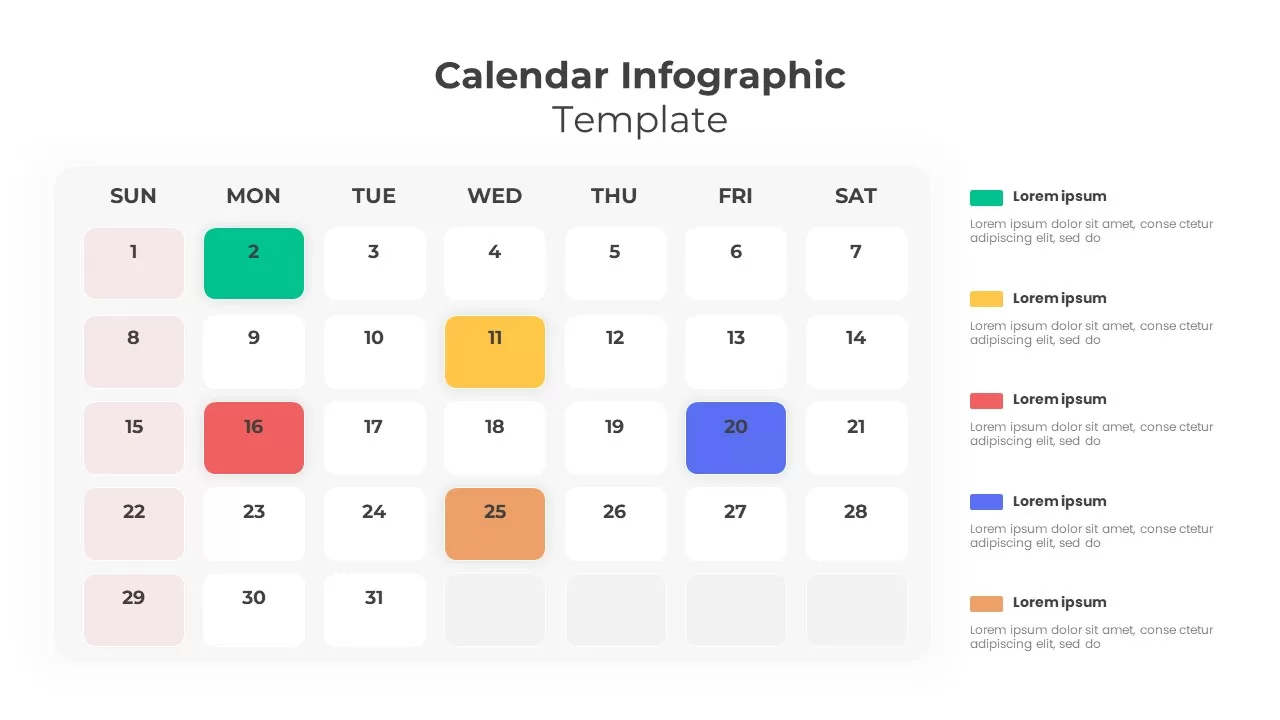
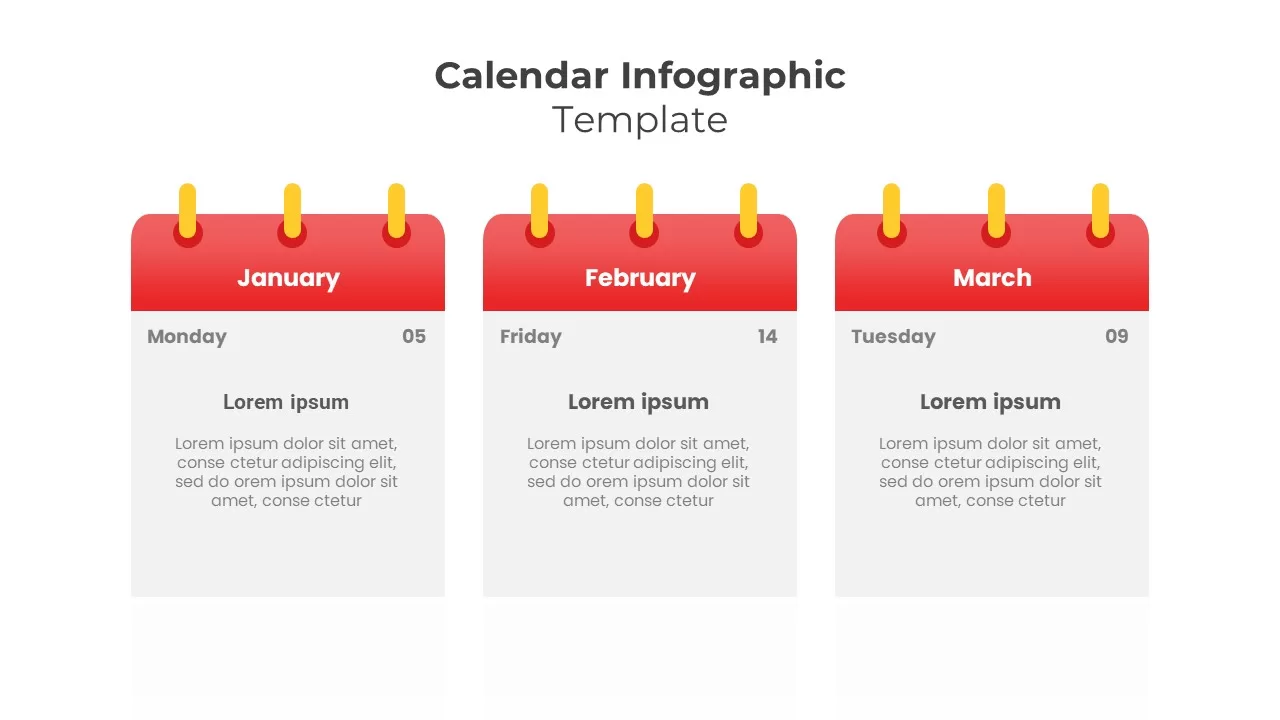
Monthly Calendar Infographic Scheduling Template for PowerPoint & Google Slides
Agenda
Premium

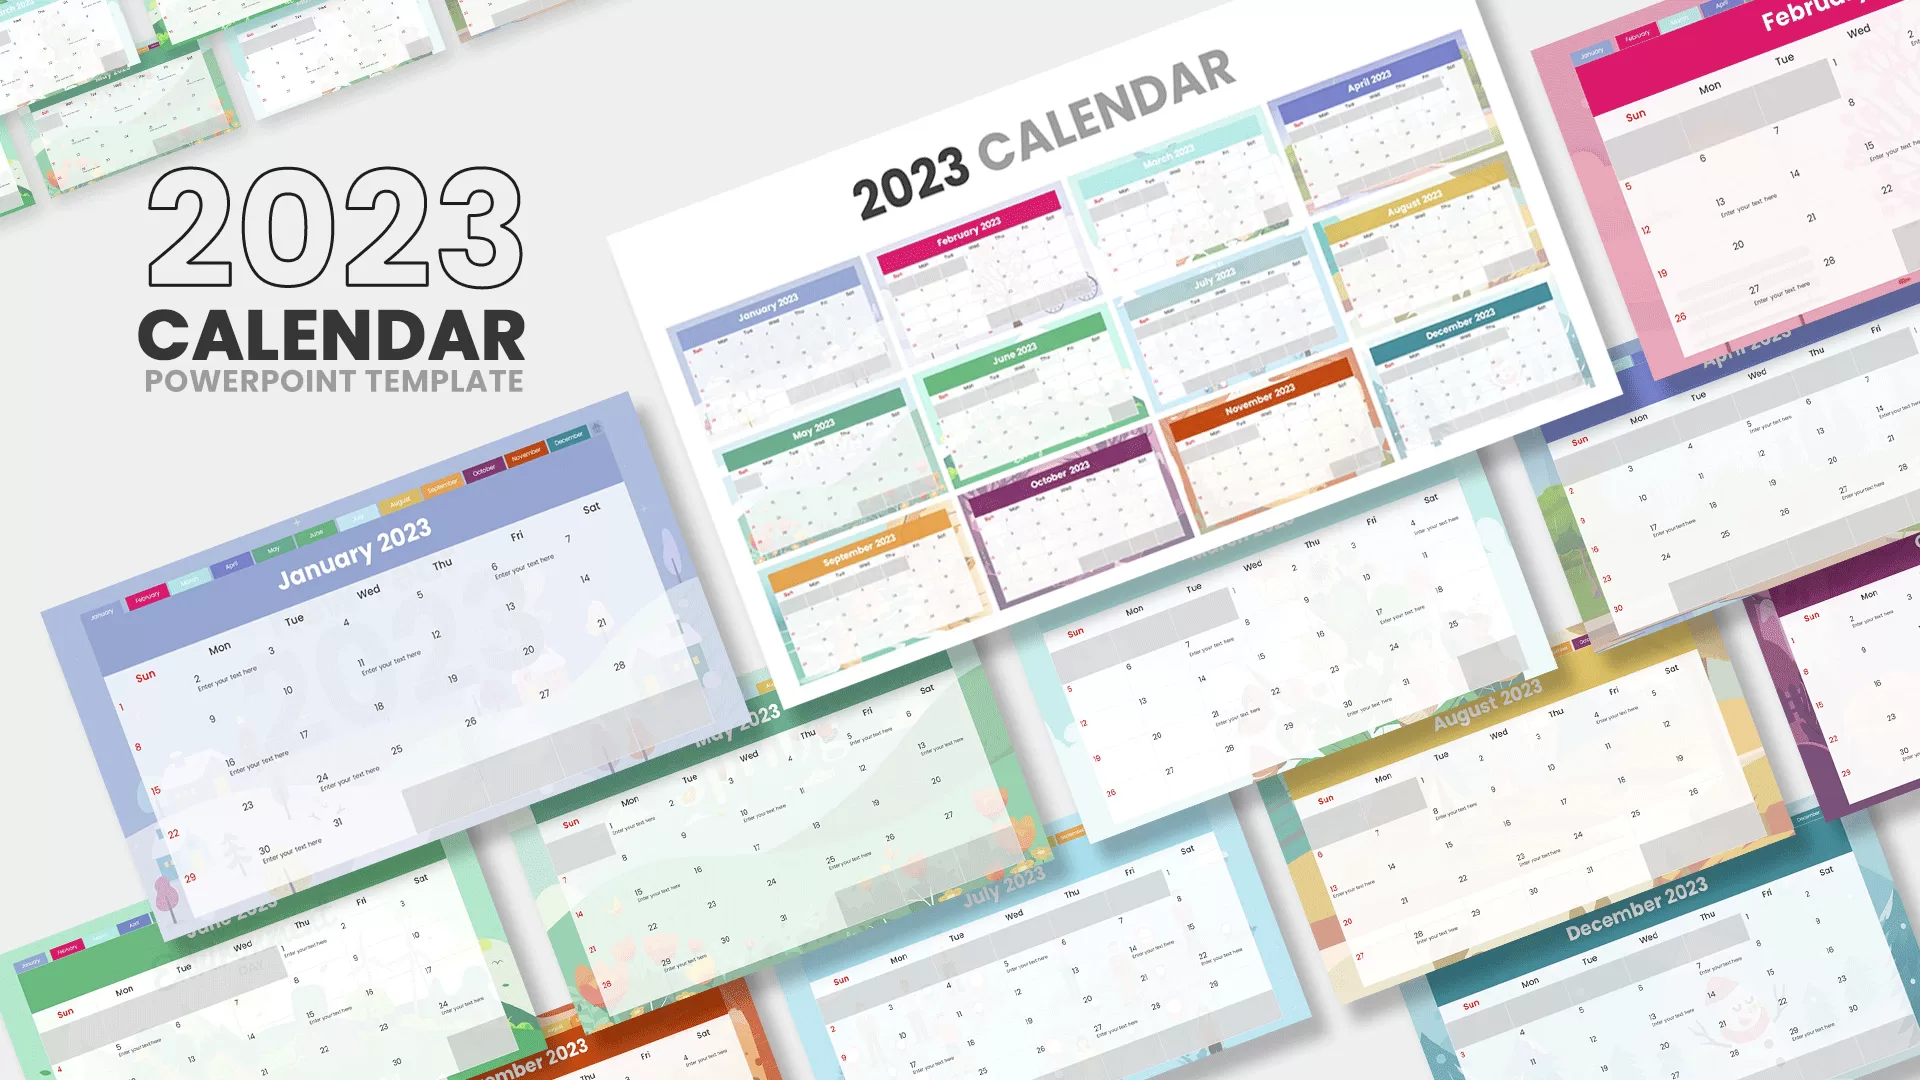
2023 Calendar Monthly Overview template for PowerPoint & Google Slides
Business
Premium
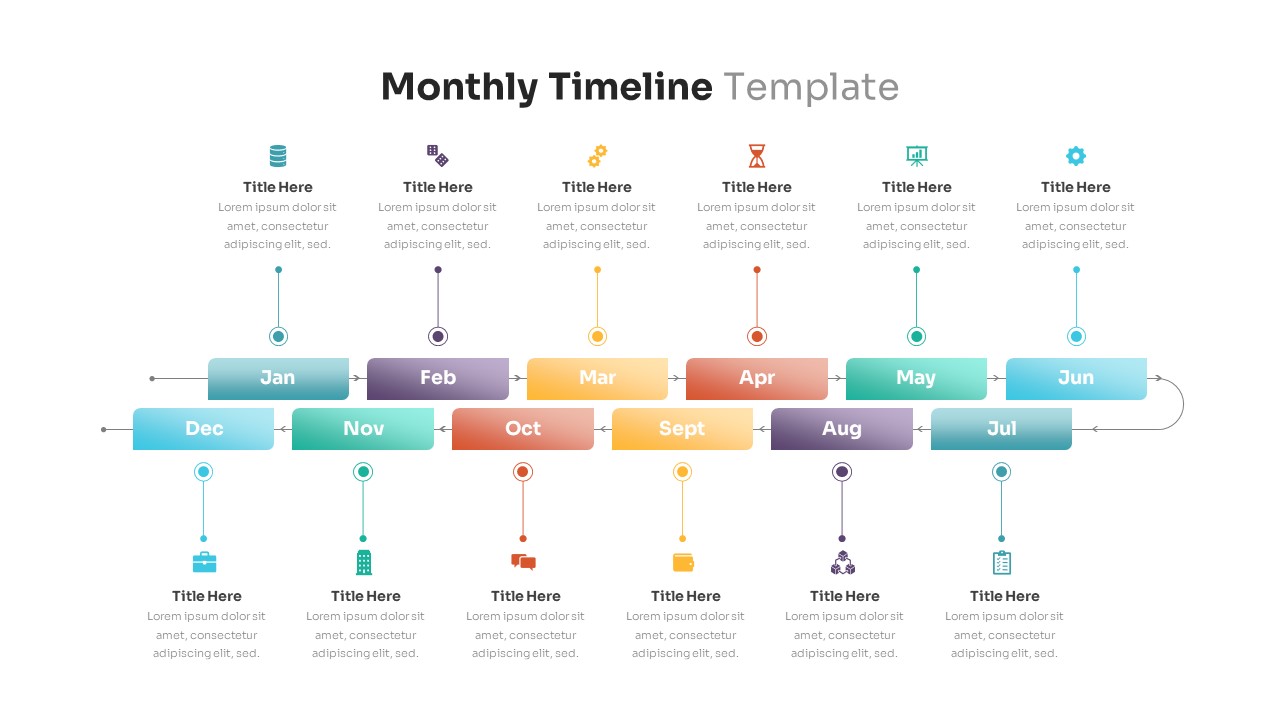
Editable Monthly Timeline Infographic Template for PowerPoint & Google Slides
Timeline
Premium
Free Monthly Financial Dashboard & Cash Flow Template for PowerPoint & Google Slides
Business Report
Free
Monthly Business Review Dashboard Deck Template for PowerPoint & Google Slides
Business Report
Premium
Monthly Sales Performance Dashboard Template for PowerPoint & Google Slides
Charts
Premium
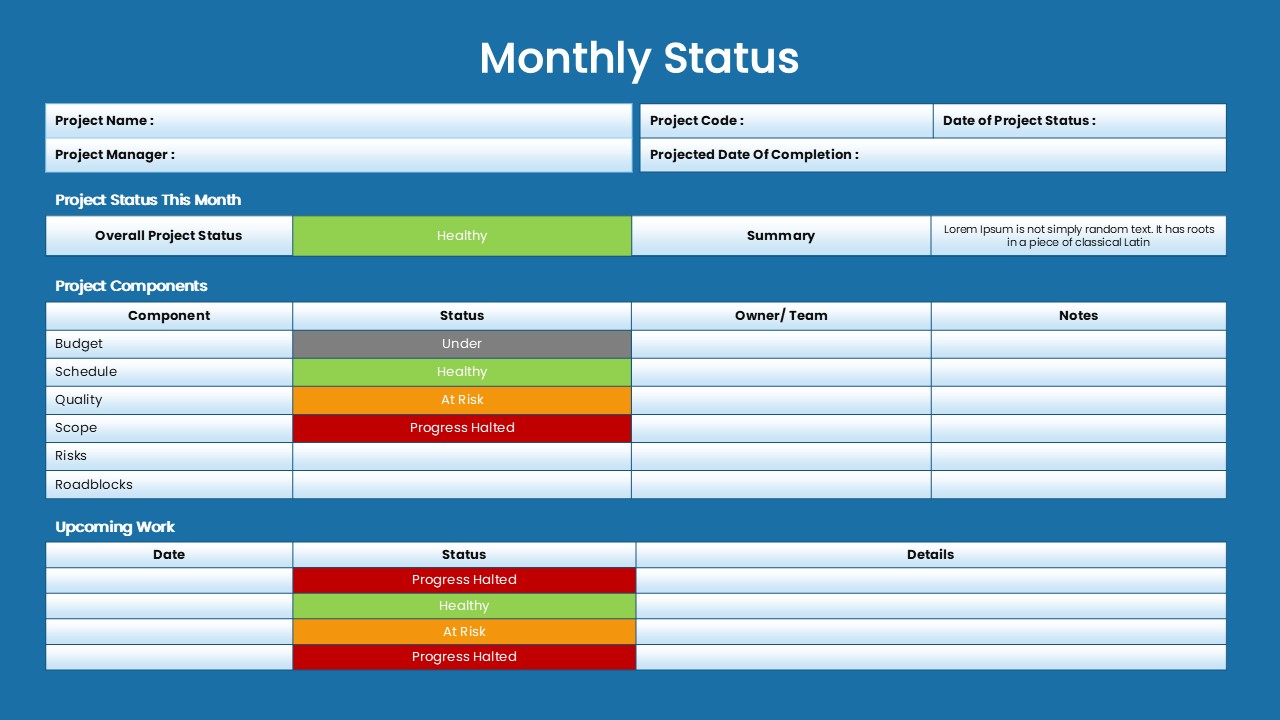
Monthly Status Report Template for PowerPoint & Google Slides
Project Status
Premium
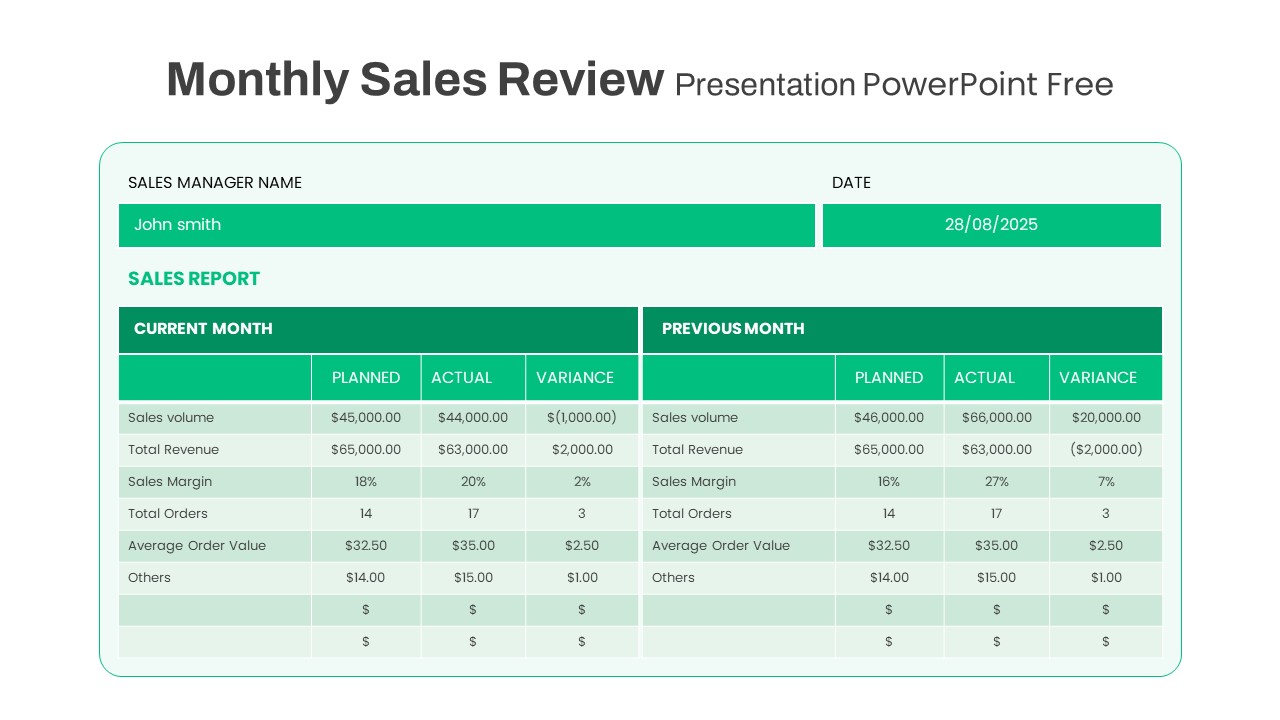
Free Monthly Sales Review template for PowerPoint & Google Slides
Business Report
Free
Redesigned Monthly Calendar Event Infographic for PowerPoint & Google Slides
Agenda
Premium
Free KPI Dashboard PowerPoint Template for PowerPoint & Google Slides
Charts
Free
Asia Map with KPI Metrics and Legend Template for PowerPoint & Google Slides
World Maps
Premium

Efficiency KPI Dashboard Metaphor Template for PowerPoint & Google Slides
Infographics
Premium
Sales Growth Dashboard: KPI Gauge & Line Template for PowerPoint & Google Slides
Revenue
Premium
Performance KPI Dashboard Slide Template for PowerPoint & Google Slides
Business Report
Premium
KPI Dashboard template for PowerPoint & Google Slides
Business Report
Premium
KPI Dashboard Overview template for PowerPoint & Google Slides
Finance
Premium
KPI Dashboard Data Visualization Template for PowerPoint & Google Slides
Bar/Column
Premium
KPI Dashboard Data Overview Slide Template for PowerPoint & Google Slides
Bar/Column
Premium
Professional Team Collage & KPI Slide Template for PowerPoint & Google Slides
Business
Premium
Circular Image Gallery & KPI Metrics Template for PowerPoint & Google Slides
Pie/Donut
Premium
Customer Satisfaction KPI Dashboard Template for PowerPoint & Google Slides
Customer Experience
Premium
Free Balanced Scorecard Quadrant KPI Layout Template for PowerPoint & Google Slides
Employee Performance
Free
Year in Review KPI Highlights Slide for PowerPoint & Google Slides
Business Report
Premium
Michigan County Map with KPI Dashboard Template for PowerPoint & Google Slides
World Maps
Premium
DevOps KPI Dashboard Performance Metrics Template for PowerPoint & Google Slides
Software Development
Premium
Purchasing KPI Metrics Dashboard Template for PowerPoint & Google Slides
Business Report
Premium
Procurement KPI Dashboard & Metrics Template for PowerPoint & Google Slides
Business Report
Premium
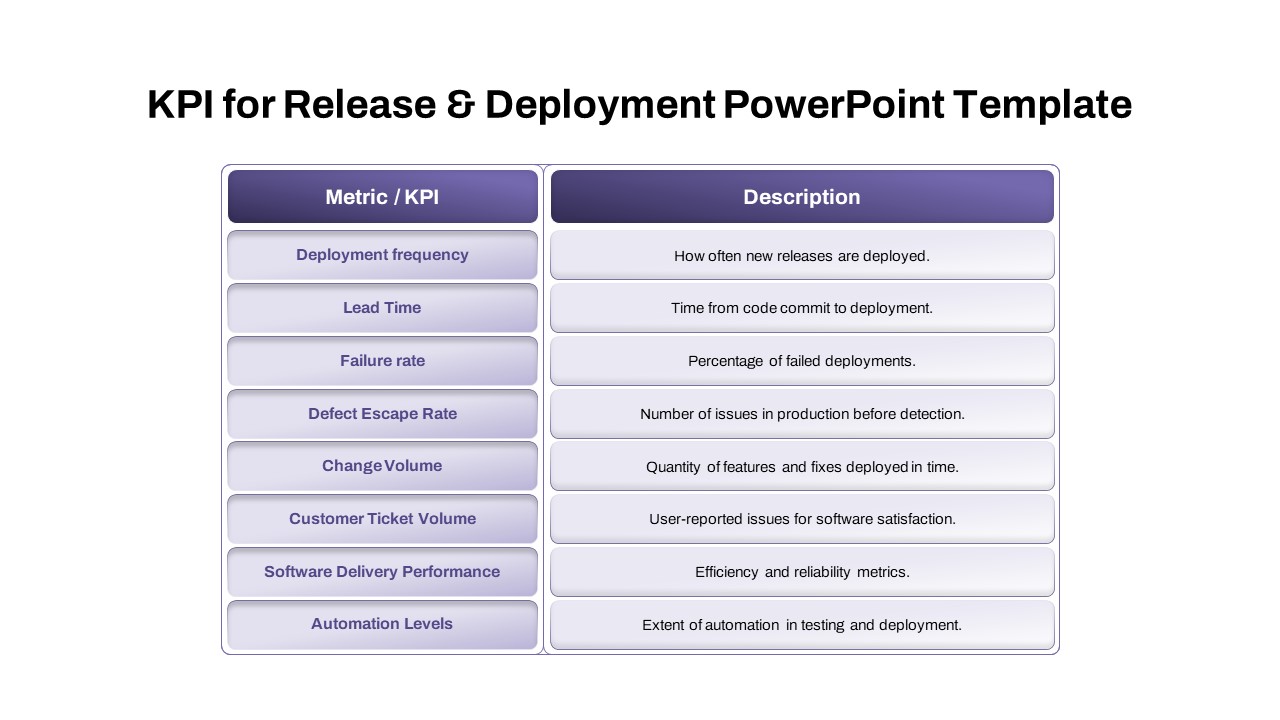
Comprehensive Release & Deployment KPI Template for PowerPoint & Google Slides
Software Development
Premium
Patient-Satisfaction KPI Dashboard for PowerPoint & Google Slides
Business
Premium
4 Step Revenue Growth Flow Diagram Template for PowerPoint & Google Slides
Process
Premium
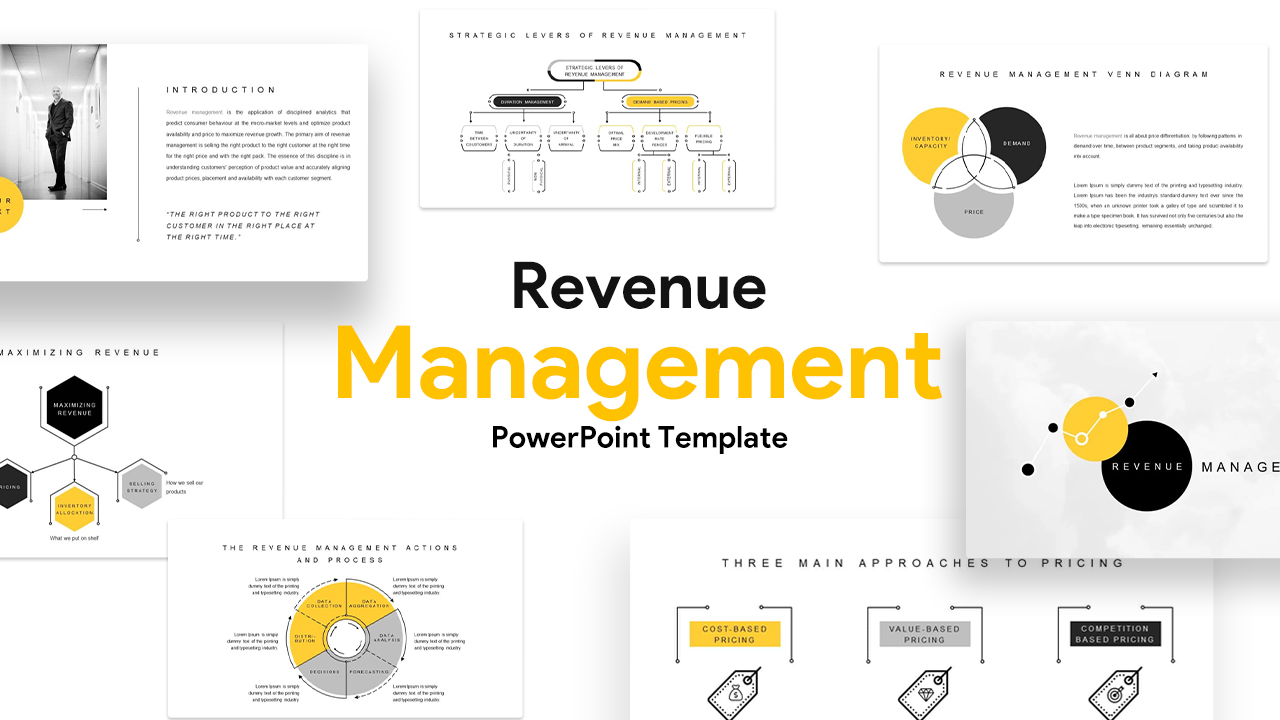
Revenue Management Business Strategy Template for PowerPoint & Google Slides
Revenue
Premium
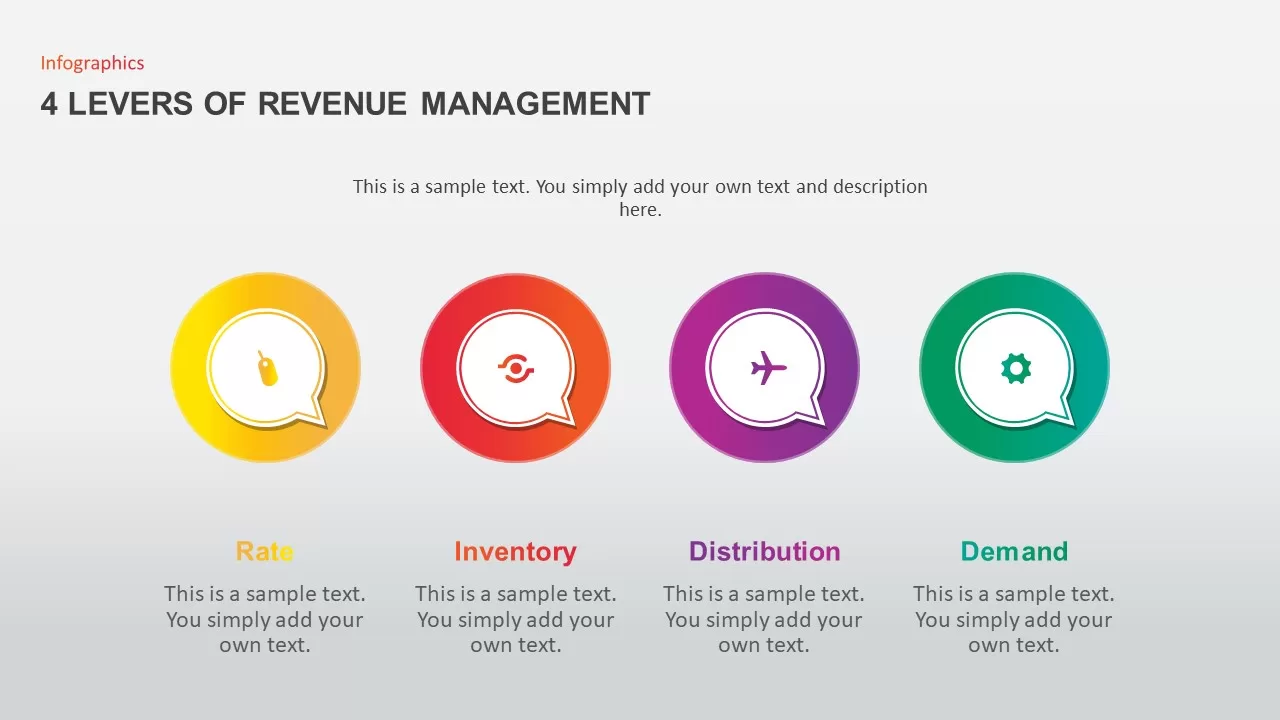
4 Levers of Revenue Management Infographic Template for PowerPoint & Google Slides
Infographics
Premium
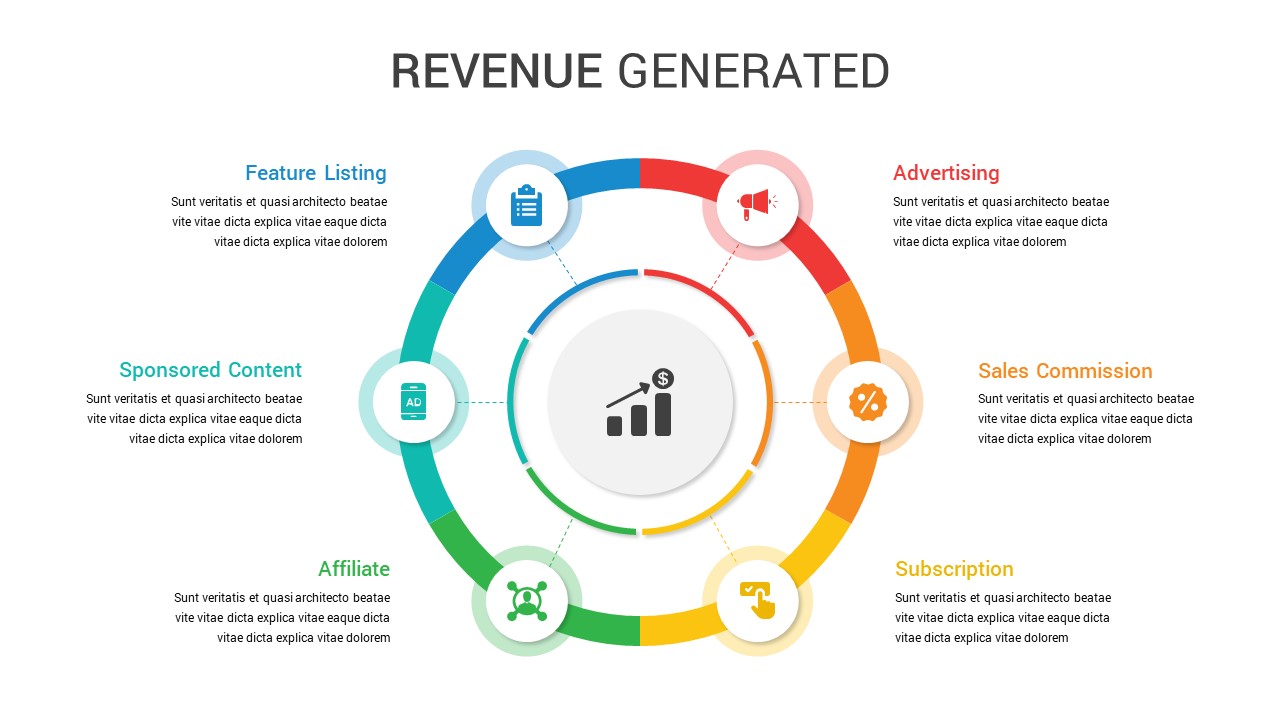
Circular Revenue Generation Diagram Template for PowerPoint & Google Slides
Revenue
Premium
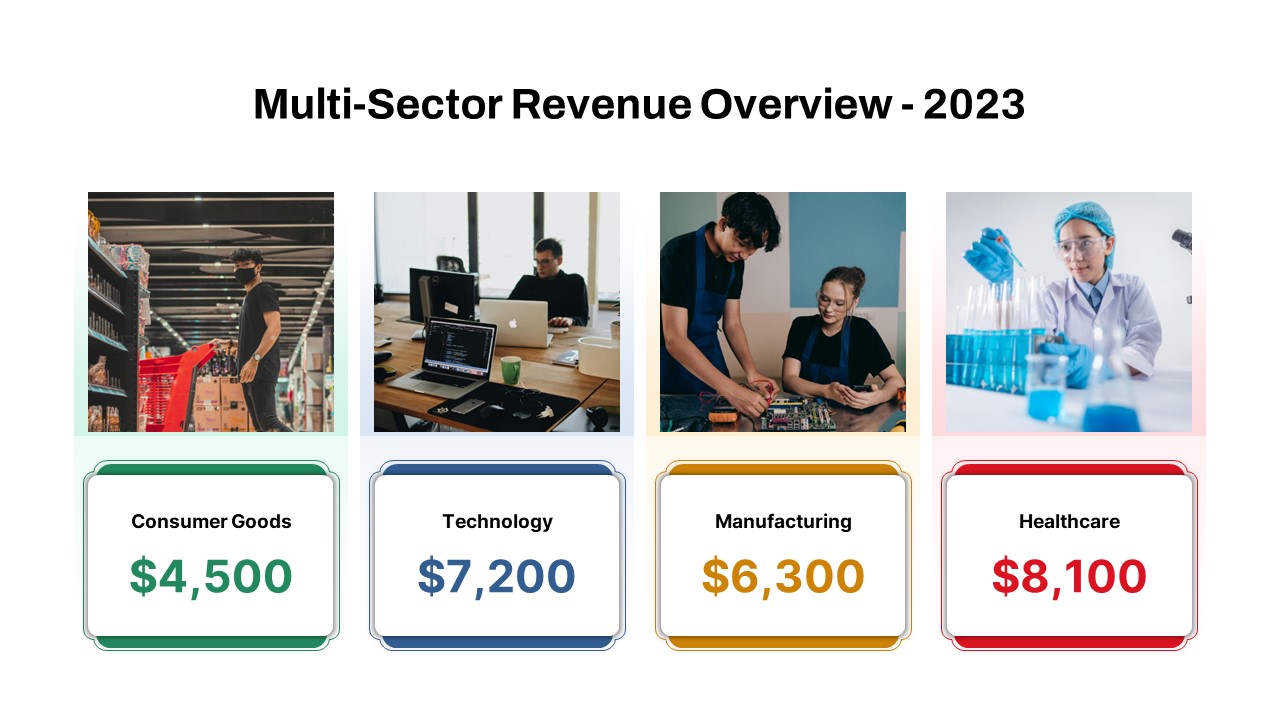
Multi-Sector Revenue Breakdown Cards Template for PowerPoint & Google Slides
Comparison
Premium
Regional Revenue Comparison Overview Template for PowerPoint & Google Slides
Comparison
Premium
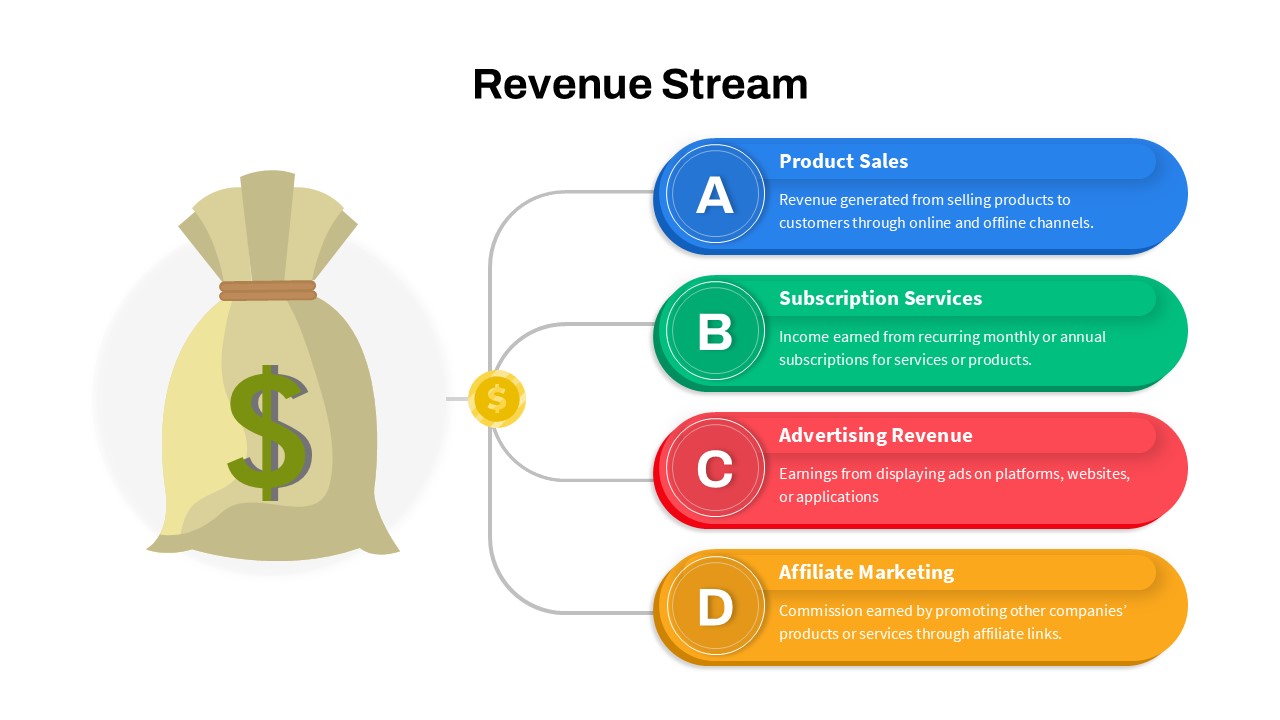
Revenue Streams: Four Channels Diagram Template for PowerPoint & Google Slides
Business Models
Premium
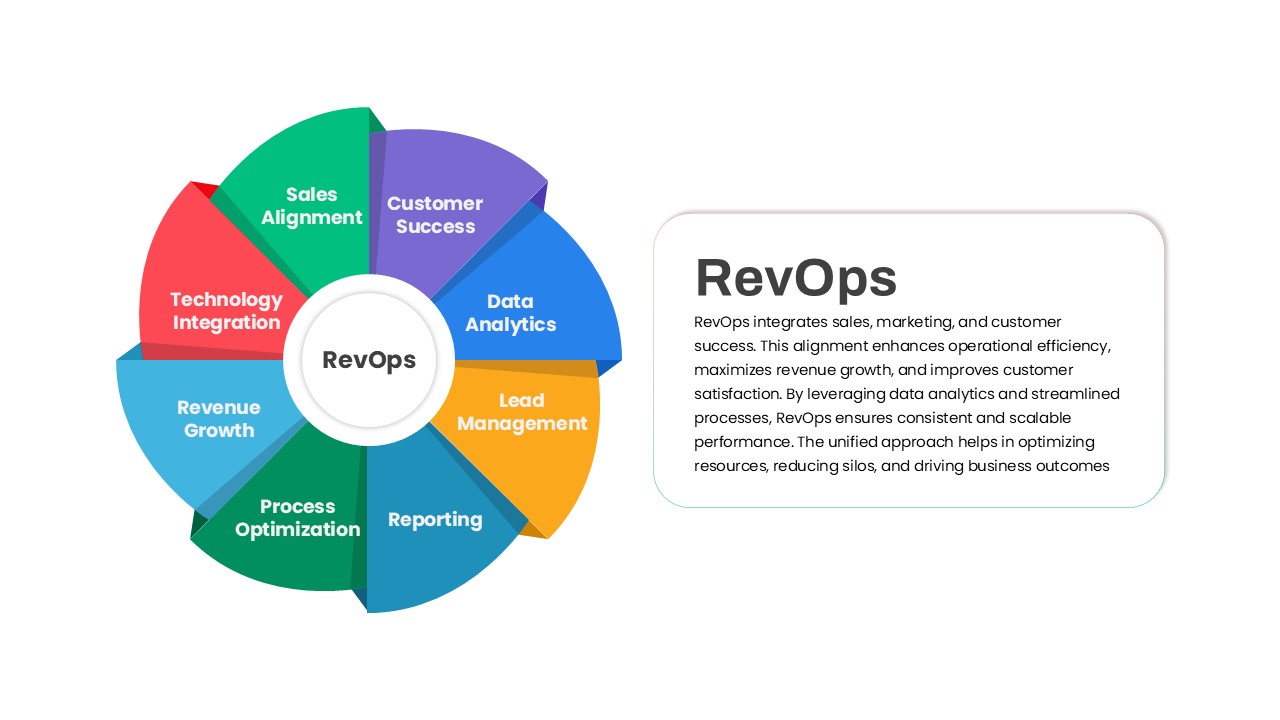
RevOps Revenue Operations Diagram Template for PowerPoint & Google Slides
Revenue
Premium
Six Revenue Stream Model Infographic Template for PowerPoint & Google Slides
Circle
Premium
Bar Chart Sample template for PowerPoint & Google Slides
Bar/Column
Premium
Creative Data Analysis Bar Chart template for PowerPoint & Google Slides
Bar/Column
Premium
3D Bar Chart Data Infographics Template for PowerPoint & Google Slides
Bar/Column
Premium
Creative Bar Chart template for PowerPoint & Google Slides
Charts
Premium
Comparison Bar Chart template for PowerPoint & Google Slides
Comparison Chart
Premium
Three-Year Bar Chart template for PowerPoint & Google Slides
Charts
Premium
3D Cylinder Bar Chart Template for PowerPoint & Google Slides
Bar/Column
Premium
Pencil Bar Chart Data Analysis Template for PowerPoint & Google Slides
Bar/Column
Premium

Colorful Radial Bar Chart Template for PowerPoint & Google Slides
Bar/Column
Premium
Sales Bar Chart for PowerPoint & Google Slides
Bar/Column
Premium
Interactive Product Comparison Bar Chart Template for PowerPoint & Google Slides
Bar/Column
Premium
Bar Data Chart Slide for PowerPoint & Google Slides
Bar/Column
Premium

Radial Bar Chart Diagram for PowerPoint & Google Slides
Bar/Column
Premium
For and Against Vote Count Bar Chart Template for PowerPoint & Google Slides
Bar/Column
Premium
Distracting Factors at Work Bar Chart Template for PowerPoint & Google Slides
Bar/Column
Premium
Stacked Bar Chart for PowerPoint & Google Slides
Bar/Column
Premium
100% Stacked Bar Chart for PowerPoint & Google Slides
Bar/Column
Premium
Multi-Series Stacked Bar Chart Template for PowerPoint & Google Slides
Bar/Column
Premium
Combination Bar and Line Chart Template for PowerPoint & Google Slides
Bar/Column
Premium
Animated Clustered Bar Chart Template for PowerPoint & Google Slides
Bar/Column
Premium
Animated Stacked Bar Chart Template for PowerPoint & Google Slides
Bar/Column
Premium
Simple Bar Chart Data Visualization Template for PowerPoint & Google Slides
Bar/Column
Premium
Clustered Bar Chart Comparison Template for PowerPoint & Google Slides
Bar/Column
Premium
Waterfall Bar Chart Analysis Template for PowerPoint & Google Slides
Bar/Column
Premium
Business Timeline Comparison Bar Chart Template for PowerPoint & Google Slides
Comparison Chart
Premium
Year-over-Year Stacked Gender Bar Chart Template for PowerPoint & Google Slides
Bar/Column
Premium
Mirror Bar Chart Comparison Template for PowerPoint & Google Slides
Bar/Column
Premium
Dynamic Bar-of-Pie Chart Comparison Template for PowerPoint & Google Slides
Pie/Donut
Premium
Expanding Margins Analysis Bar Chart Template for PowerPoint & Google Slides
Charts
Premium
Quarterly Sales Review Bar Chart Template for PowerPoint & Google Slides
Bar/Column
Premium
Data Analysis Bar Chart with Insights Template for PowerPoint & Google Slides
Bar/Column
Free
Horizontal Bar Chart Slide with Icons Template for PowerPoint & Google Slides
Bar/Column
Premium
Two-Option Bar Chart Comparison Table Template for PowerPoint & Google Slides
Comparison
Premium
Bar Gantt Chart Template for PowerPoint & Google Slides
Gantt Chart
Premium
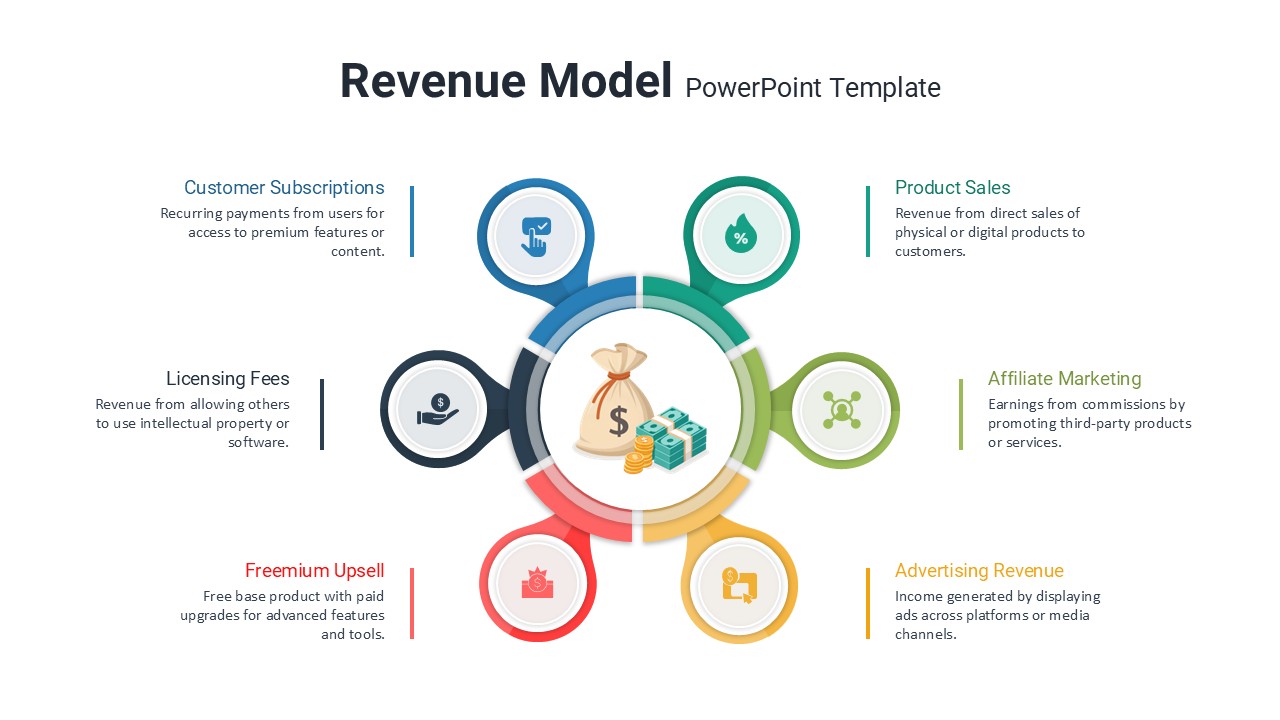
Revenue Model PowerPoint Template
Finance
Premium
3D Cylinder Bar Chart Visualization Template for PowerPoint
Bar/Column
Premium
3D Bar Graph Infographic Template for PowerPoint & Google Slides
Bar/Column
Premium
Five-Stage Vertical Bar Process Template for PowerPoint & Google Slides
Process
Premium
Progress Bar Graph Layout Design for PowerPoint & Google Slides
Charts
Premium
Progress Bar Infographic for PowerPoint & Google Slides
Business
Premium
Progress Bar infographic pack for PowerPoint & Google Slides
Business
Premium
Timeline Roadmap with Progress Bar Template for PowerPoint & Google Slides
Timeline
Premium
Progress Bar and Milestone Visualization Template for PowerPoint & Google Slides
Timeline
Premium
Five Options Business Bar Graph for PowerPoint & Google Slides
Business Report
Premium
Quad Chart Infographic Pack of 8 Slides Template for PowerPoint & Google Slides
Comparison Chart
Premium
Free Professional Gantt Chart Pack – 4 Slides Template for PowerPoint & Google Slides
Gantt Chart
Free
Comparison Chart Overview template for PowerPoint & Google Slides
Comparison Chart
Premium
Capital Structure Dynamic Split Chart Template for PowerPoint & Google Slides
Comparison Chart
Premium
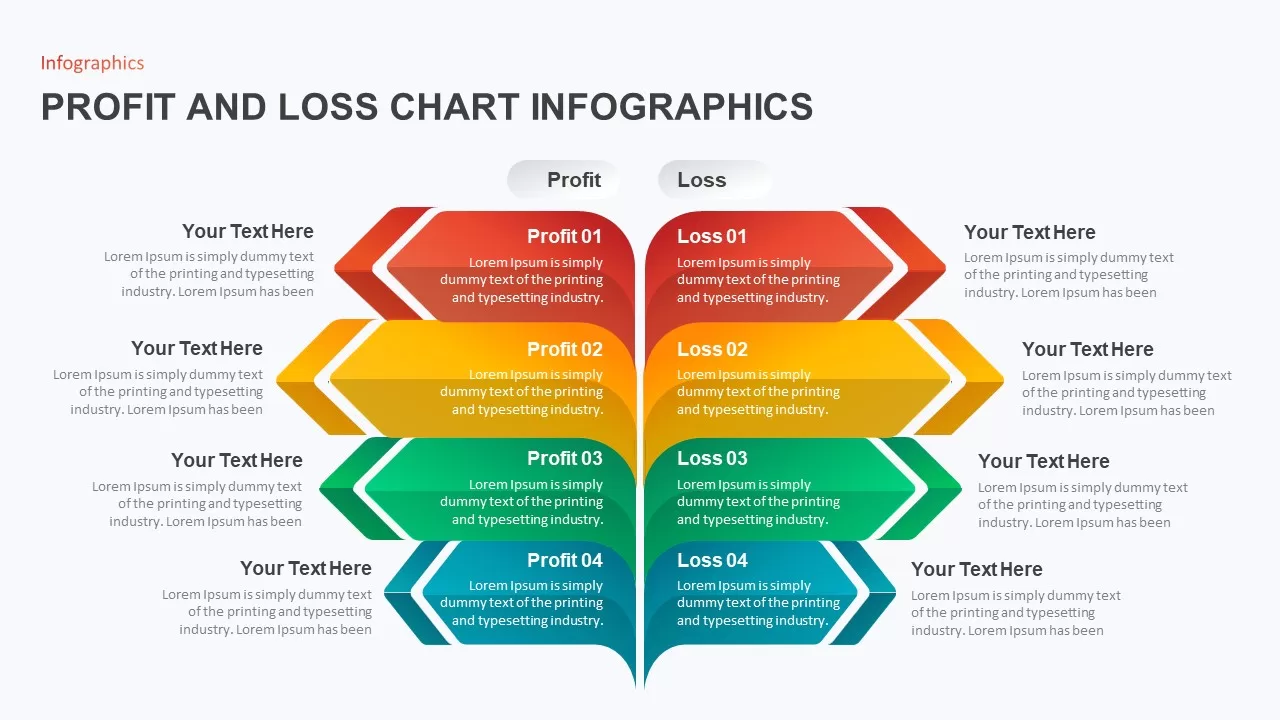
Profit and Loss Chart Infographics for PowerPoint & Google Slides
Business Report
Premium
Burndown Chart Template for PowerPoint & Google Slides
Charts
Premium
Modern Multi-Color Polar Chart Diagram Template for PowerPoint & Google Slides
Circle
Premium
Segmented Scatter Chart Data Visualization Template for PowerPoint & Google Slides
Business Strategy
Premium
Business Portfolio Changes Donut Chart Template for PowerPoint & Google Slides
Pie/Donut
Premium
Decision Matrix & Prioritization Chart Template for PowerPoint & Google Slides
Comparison Chart
Premium
Weekly Gantt Chart Project Timeline Template for PowerPoint & Google Slides
Gantt Chart
Premium
Research Gantt Chart template for PowerPoint & Google Slides
Project
Premium