Project Status Dashboard Table Template for PowerPoint & Google Slides

Description
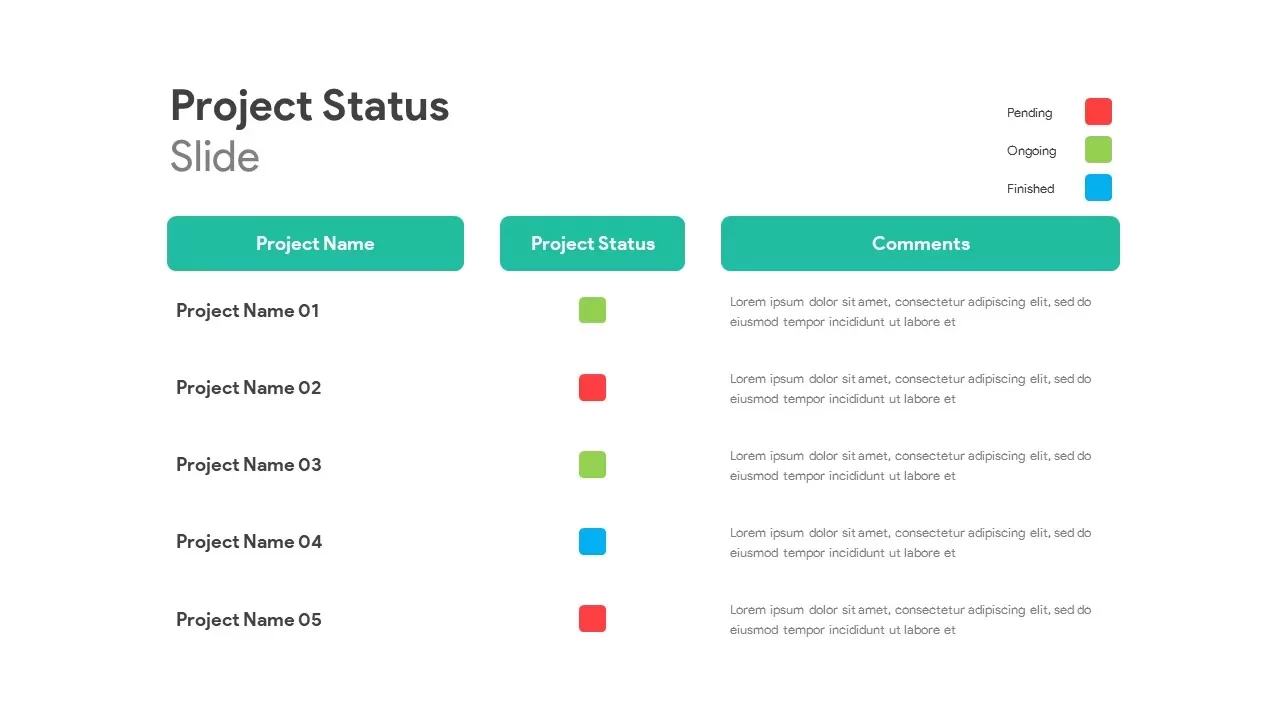
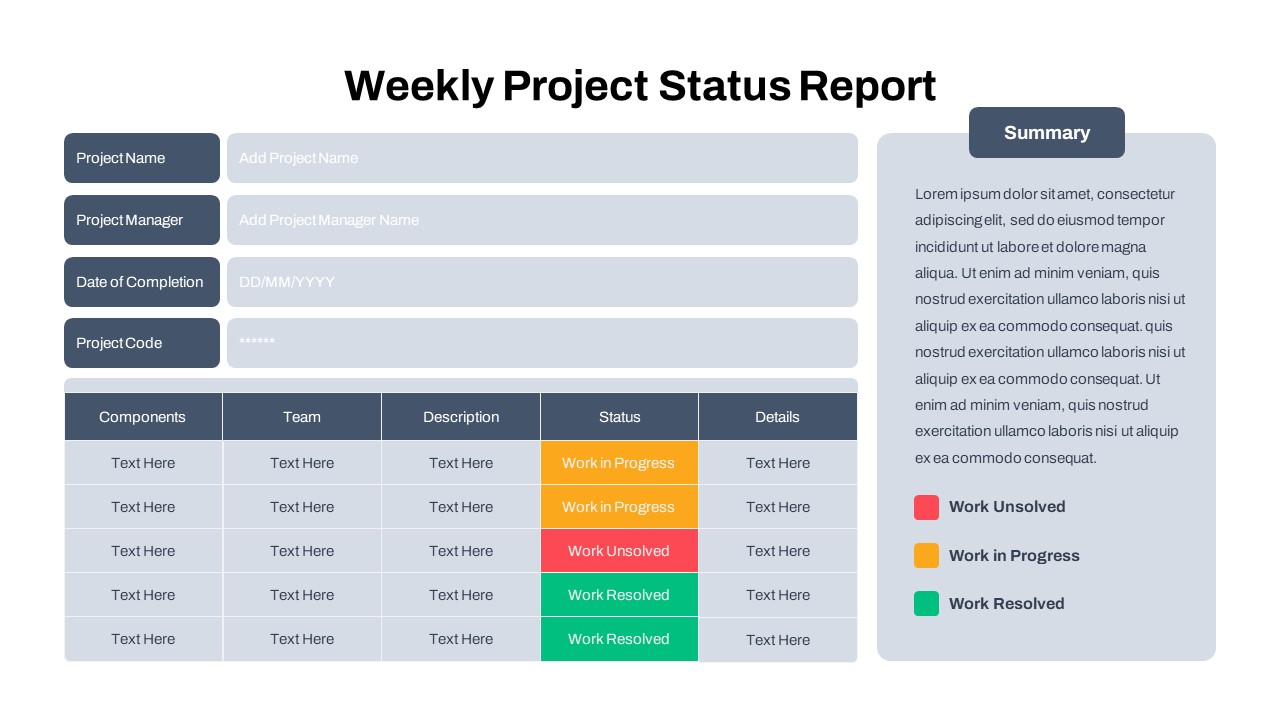
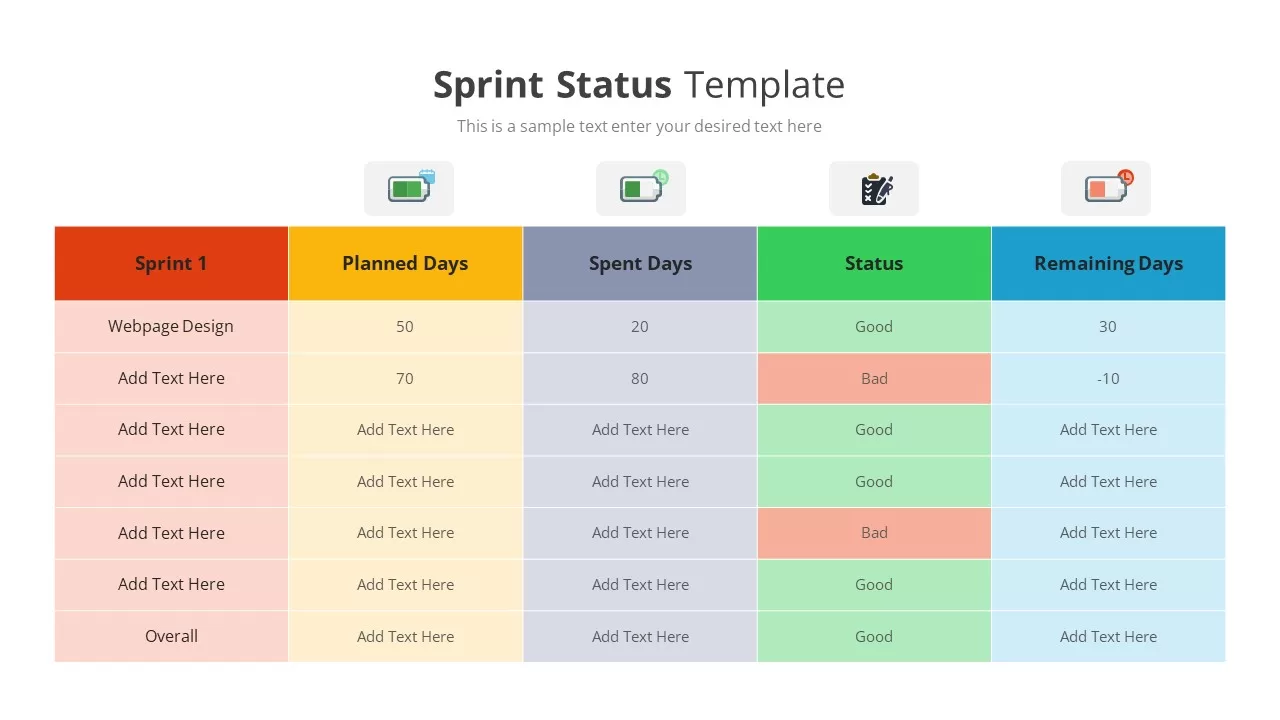
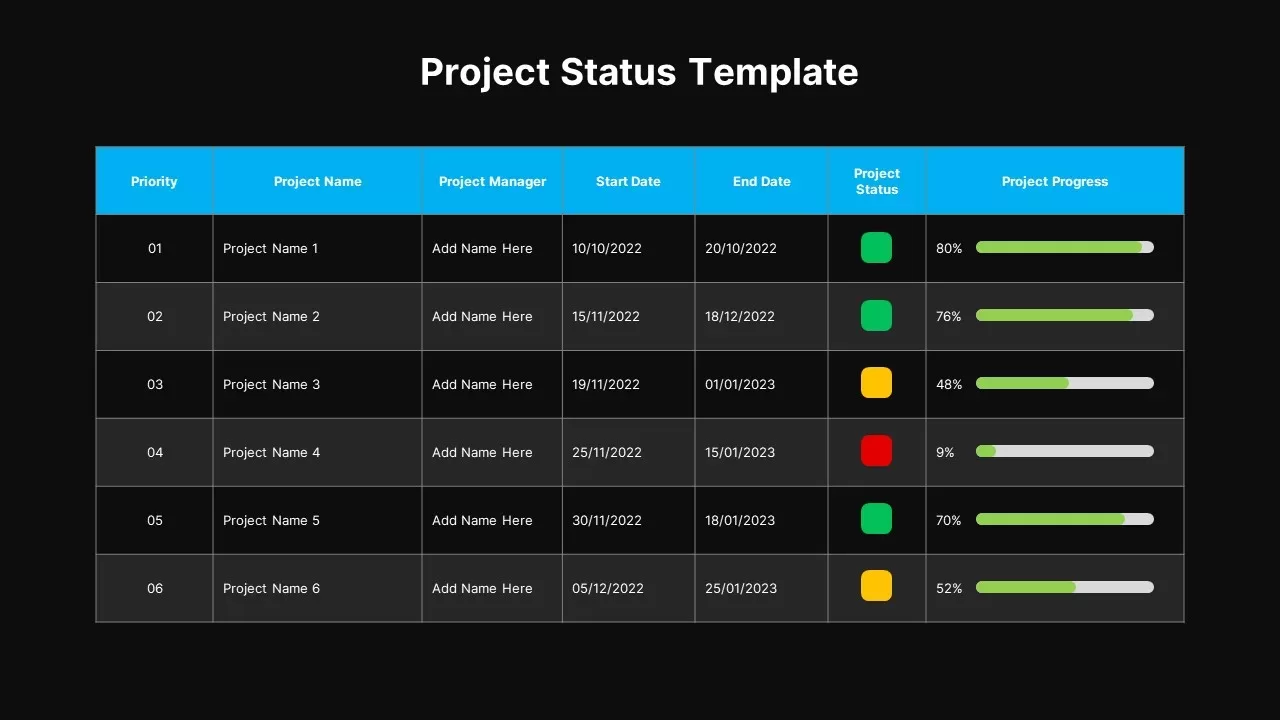
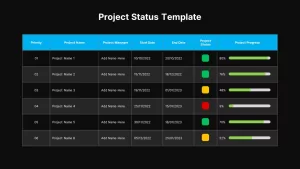
This Project Status Dashboard Table template provides a structured, at-a-glance overview of multiple initiatives, combining priority rankings, project owner details, start/end dates, status indicators, and progress bars in one cohesive layout. The header row uses a vibrant blue background for immediate column identification, while alternating white and light-gray rows enhance readability. Color-coded status squares (green, yellow, red) and horizontal progress bars with percentage labels offer intuitive visual cues to quickly assess health and completion across projects. Built on master slides in both PowerPoint and Google Slides, every element—from table dimensions to cell formatting and icon placeholders—is fully editable, ensuring seamless integration with your brand guidelines and data sets.
Use the built-in shapes to adjust column widths, update status icon colors, or modify progress bar scales without manual realignment. The clean, grid-based design maintains consistent spacing and typography across devices, making it ideal for boardroom presentations, stakeholder updates, and team stand-ups. Automated placeholder formulas can calculate totals or averages when linked to data exports, reducing manual entry and ensuring accuracy.
Who is it for
Project managers, PMO leads, portfolio analysts, and executives will benefit from this slide when monitoring multiple projects, reporting on timelines and deliverables, or communicating status updates to stakeholders.
Other Uses
Beyond project oversight, repurpose this table for sprint retrospectives, resource allocation reviews, risk tracking logs, budget vs. spend comparisons, or quarterly performance reporting. Simply rename columns, adjust status rules, and swap icons to tailor it to any operational dashboard need.
Login to download this file

Item ID
SB02951
Related Templates

Modern Project Status Report Dashboard Template for PowerPoint & Google Slides
Project Status
Premium
Project Status Dashboard with Metrics Template for PowerPoint & Google Slides
Project Status
Premium
Colorful Project Status Dashboard Template for PowerPoint & Google Slides
Project Status
Premium
Project Status Dashboard Template for PowerPoint & Google Slides
Project Status
Premium
One Pager Project Status Dashboard Template for PowerPoint & Google Slides
Project Status
Premium
Weekly Project Status Dashboard Template for PowerPoint & Google Slides
Project Status
Premium
Project Status Table Template for PowerPoint & Google Slides
Project Status
Premium
Project Tracking Dashboard Table Template for PowerPoint & Google Slides
Project Status
Premium
Weekly Status Report Dashboard Template for PowerPoint & Google Slides
HR
Premium
Action Items Management Dashboard Table Template for PowerPoint & Google Slides
Project Status
Premium
Clean Minimal Project Status Update Template for PowerPoint & Google Slides
Project
Premium
Color-Coded Project Status Template for PowerPoint & Google Slides
Project Status
Premium
Color-Coded Project Status Slide Template for PowerPoint & Google Slides
Project Status
Premium
Circular Project Status Template for PowerPoint & Google Slides
Project Status
Premium
Horizontal Timeline Project Status Template for PowerPoint & Google Slides
Project Status
Premium
Free Simple Weekly Project Status Report Template for PowerPoint & Google Slides
Project Status
Free
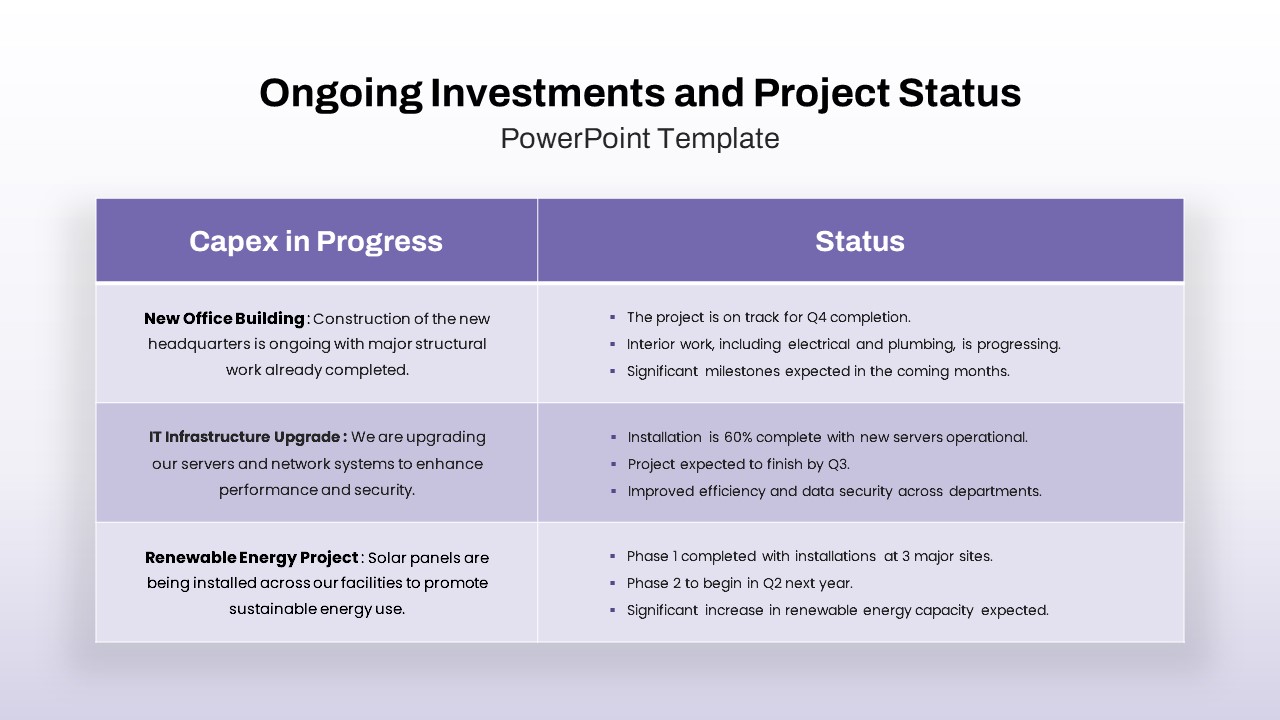
Ongoing Investments and Project Status Template for PowerPoint & Google Slides
Project Status
Premium
Project Status Report Tracker Slide for PowerPoint & Google Slides
Project Status
Premium

Project Management Dashboard Template for PowerPoint & Google Slides
Project
Premium
Project Progress Dashboard Pie Charts Template for PowerPoint & Google Slides
Project
Premium
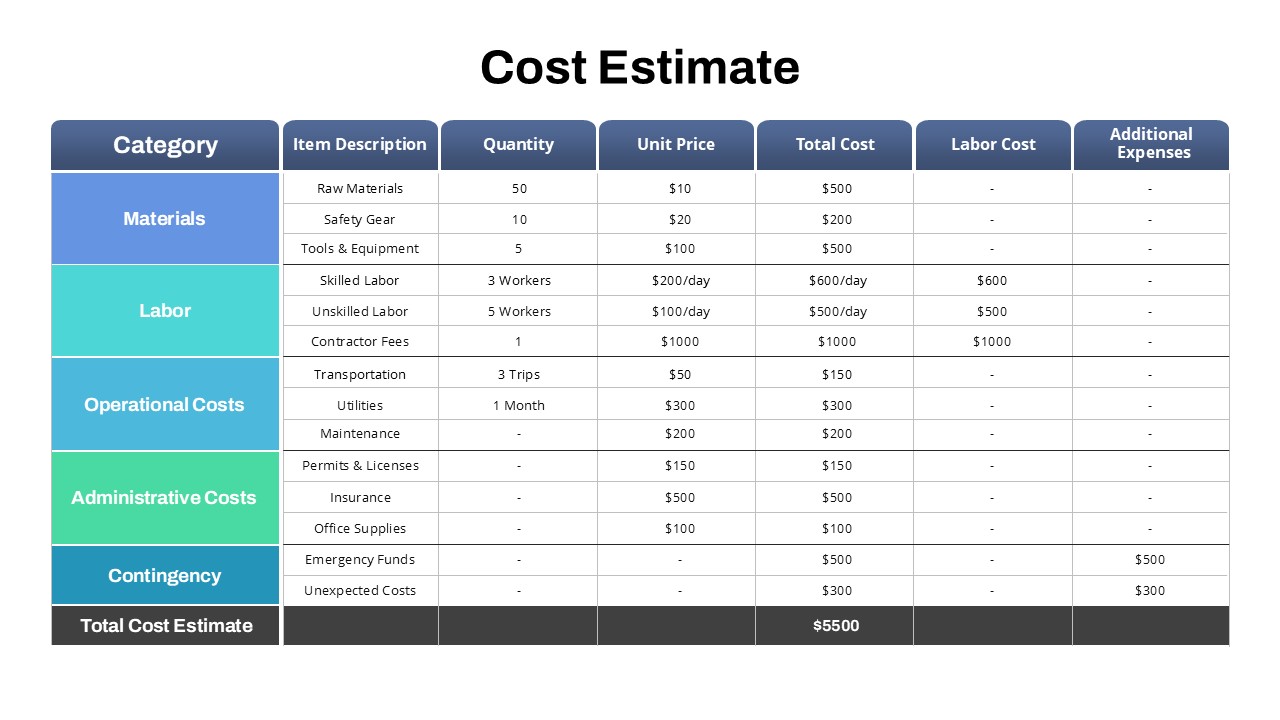
Project Detailed Cost Estimate Table Template for PowerPoint & Google Slides
Project
Premium
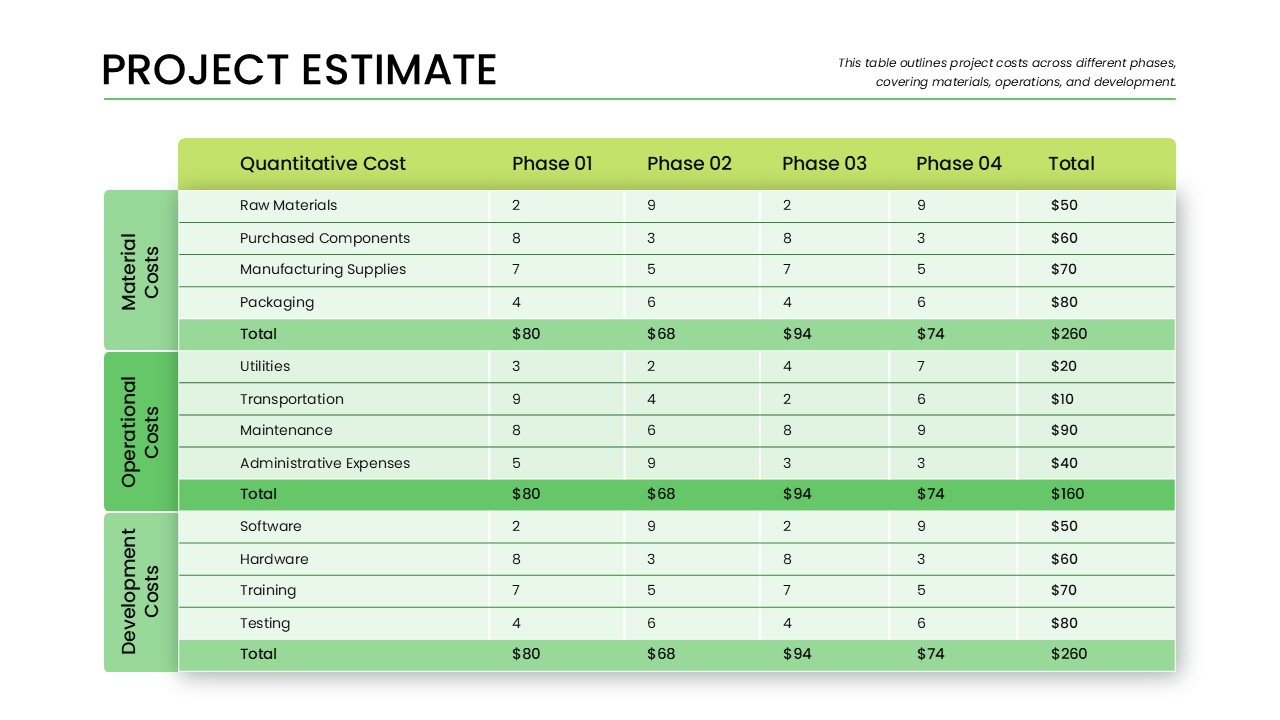
Phase-Wise Project Estimate Table Template for PowerPoint & Google Slides
Business Report
Premium
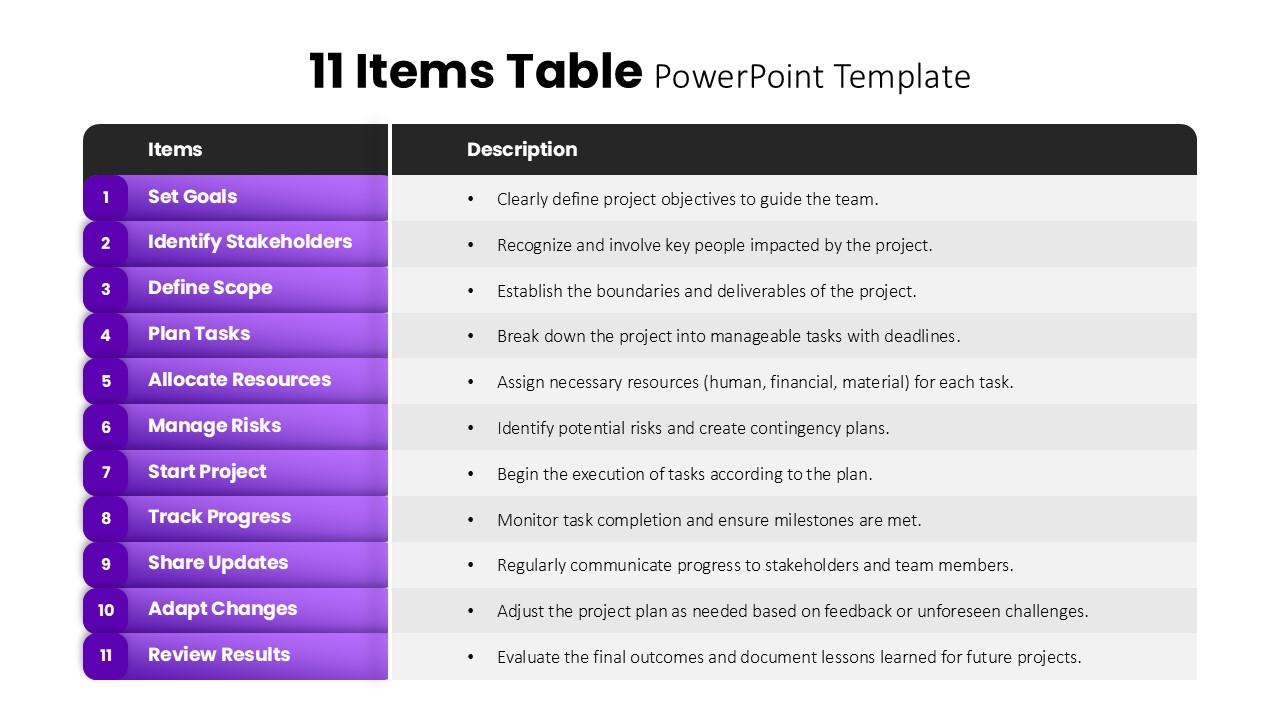
11 Items Table Project Planning Steps template for PowerPoint & Google Slides
Business Plan
Premium
RAG Status Infographic Comparison Template for PowerPoint & Google Slides
Project
Premium
Sprint Status Tracking Template for PowerPoint & Google Slides
Infographics
Premium
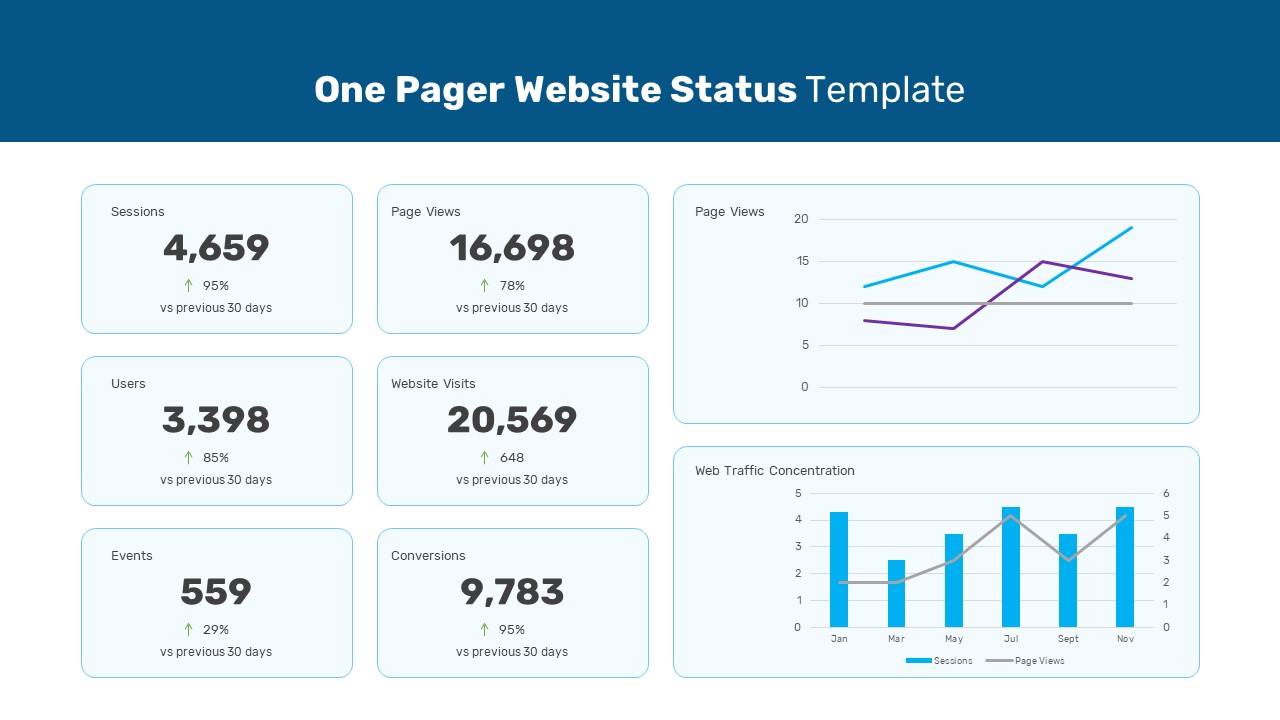
One Pager Website Status Template for PowerPoint & Google Slides
Digital Marketing
Premium
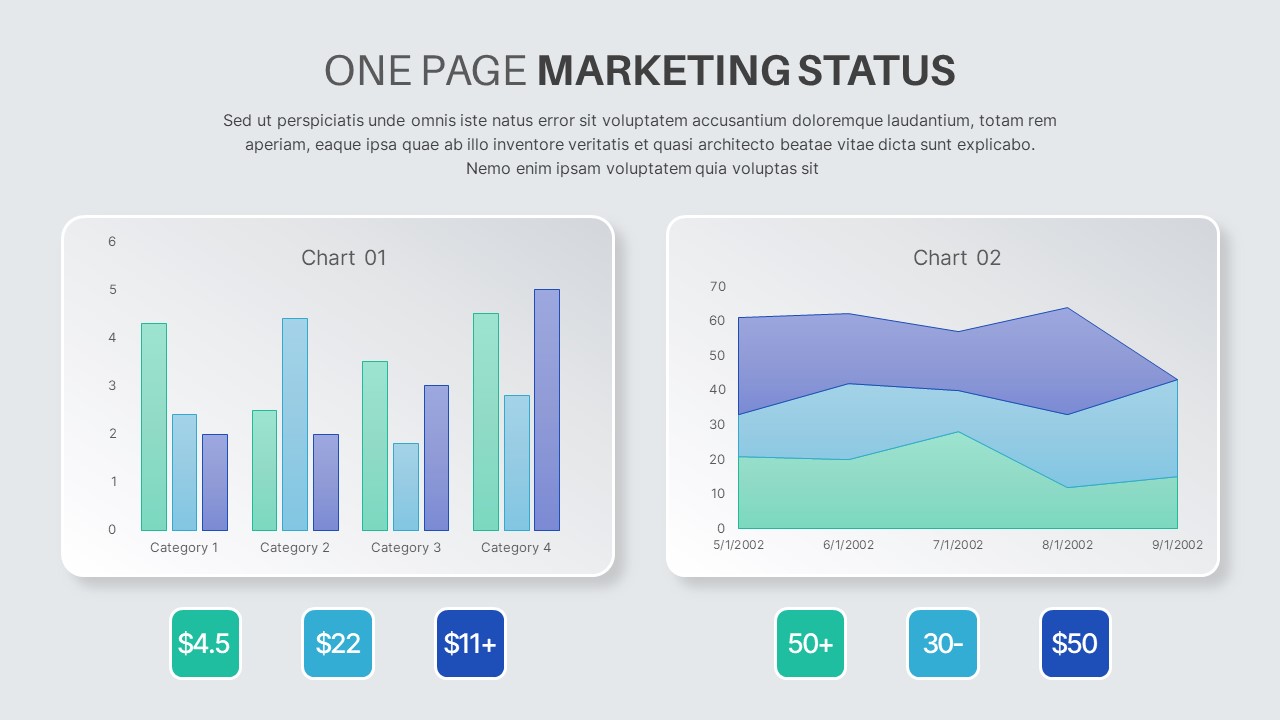
One Page Marketing Status Template for PowerPoint & Google Slides
Marketing
Premium
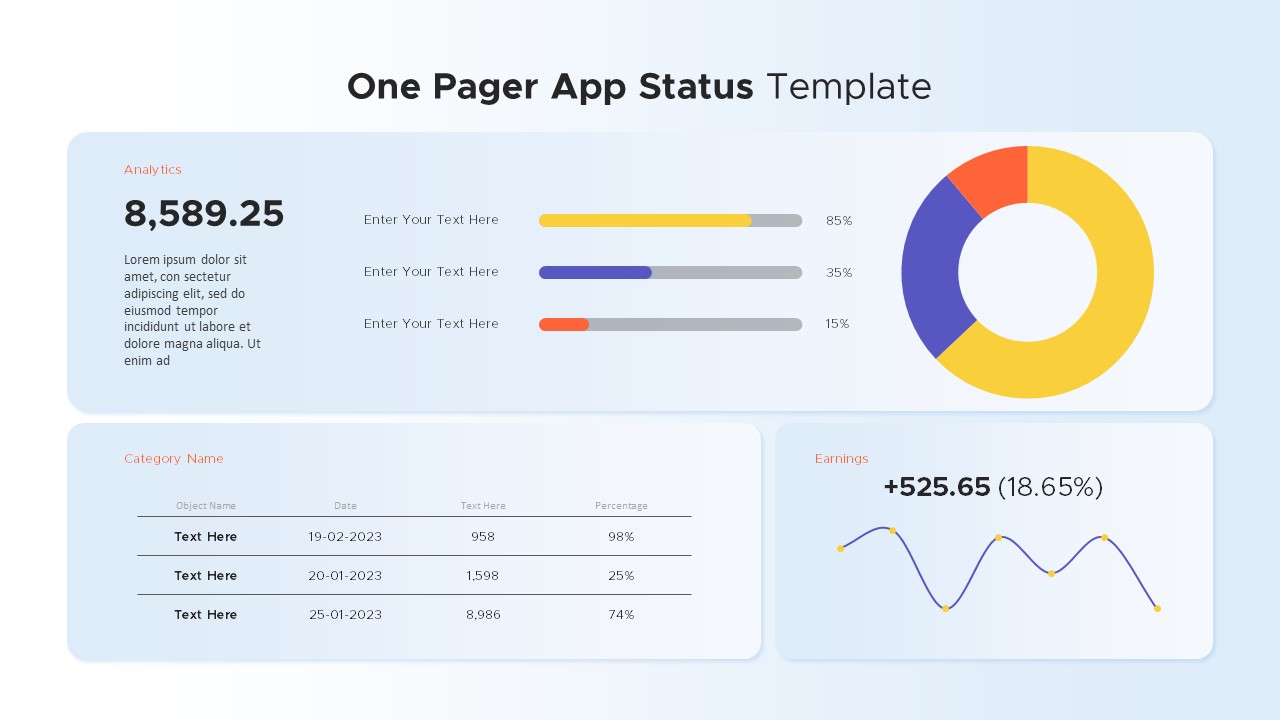
One Pager App Status template for PowerPoint & Google Slides
Business Report
Premium
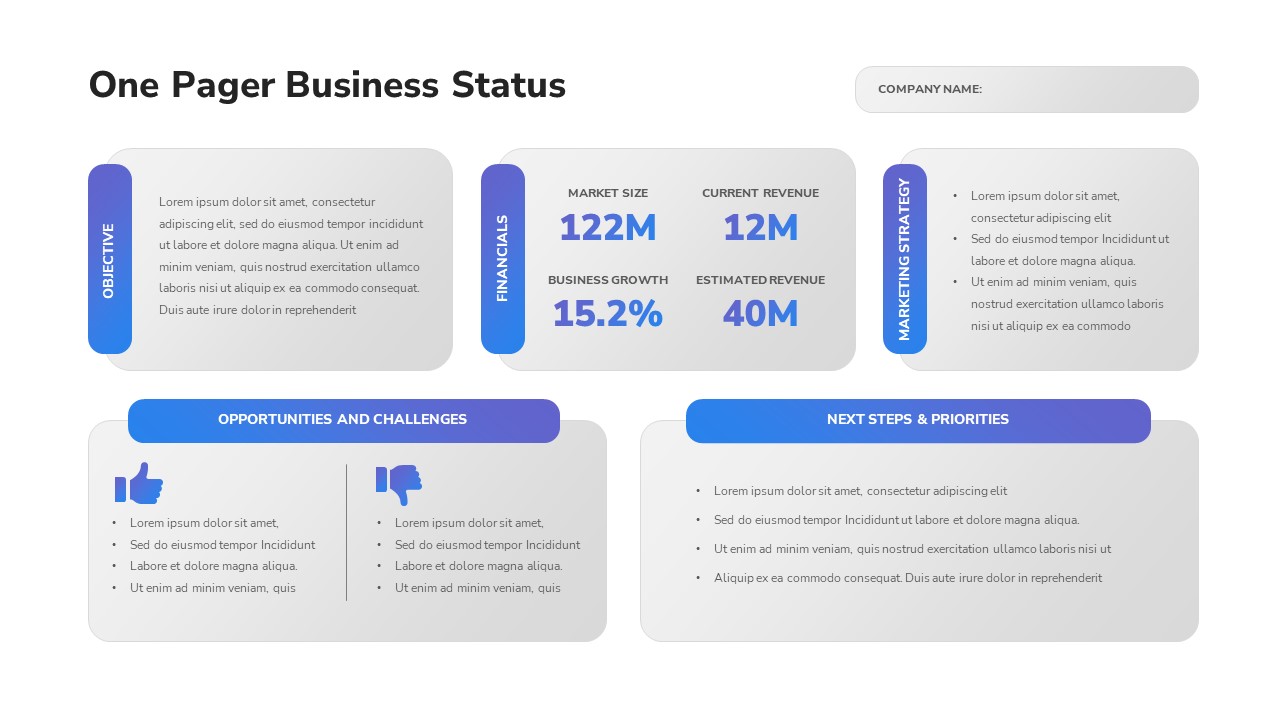
One-Pager Business Status Report Slide Template for PowerPoint & Google Slides
Business Report
Premium
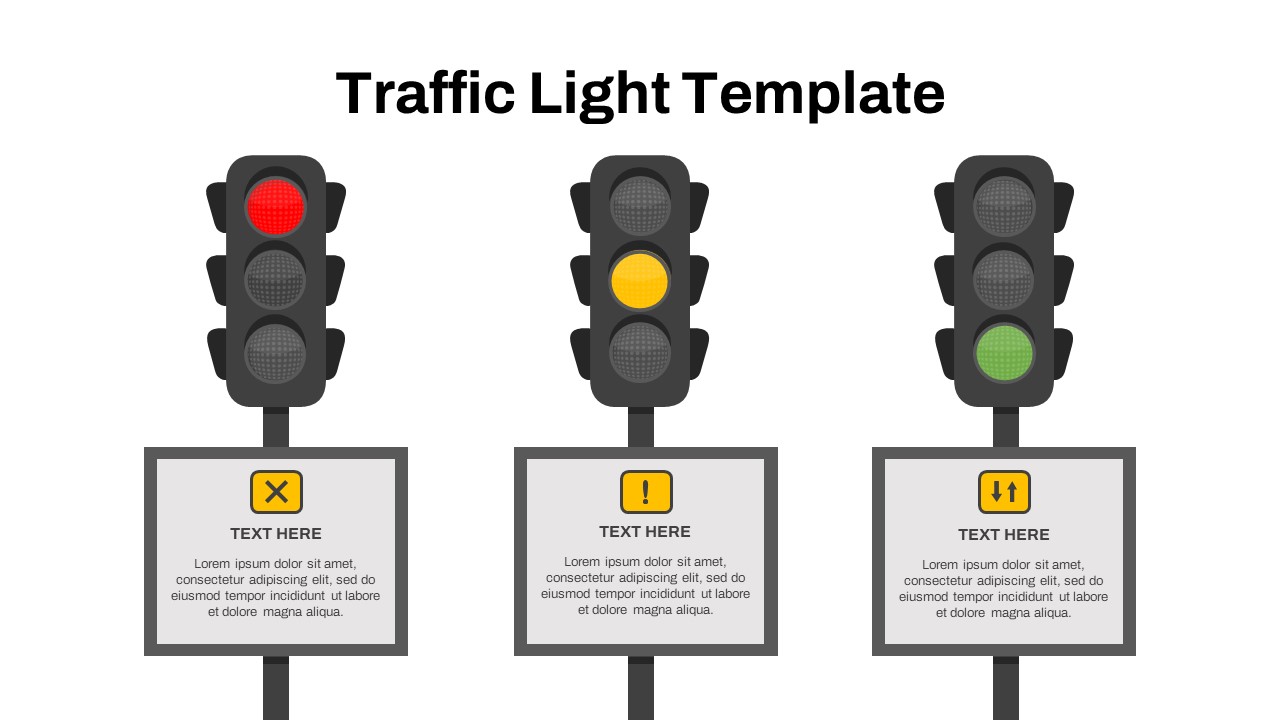
Free Traffic Light Status Indicator Slide Template for PowerPoint & Google Slides
Project Status
Free
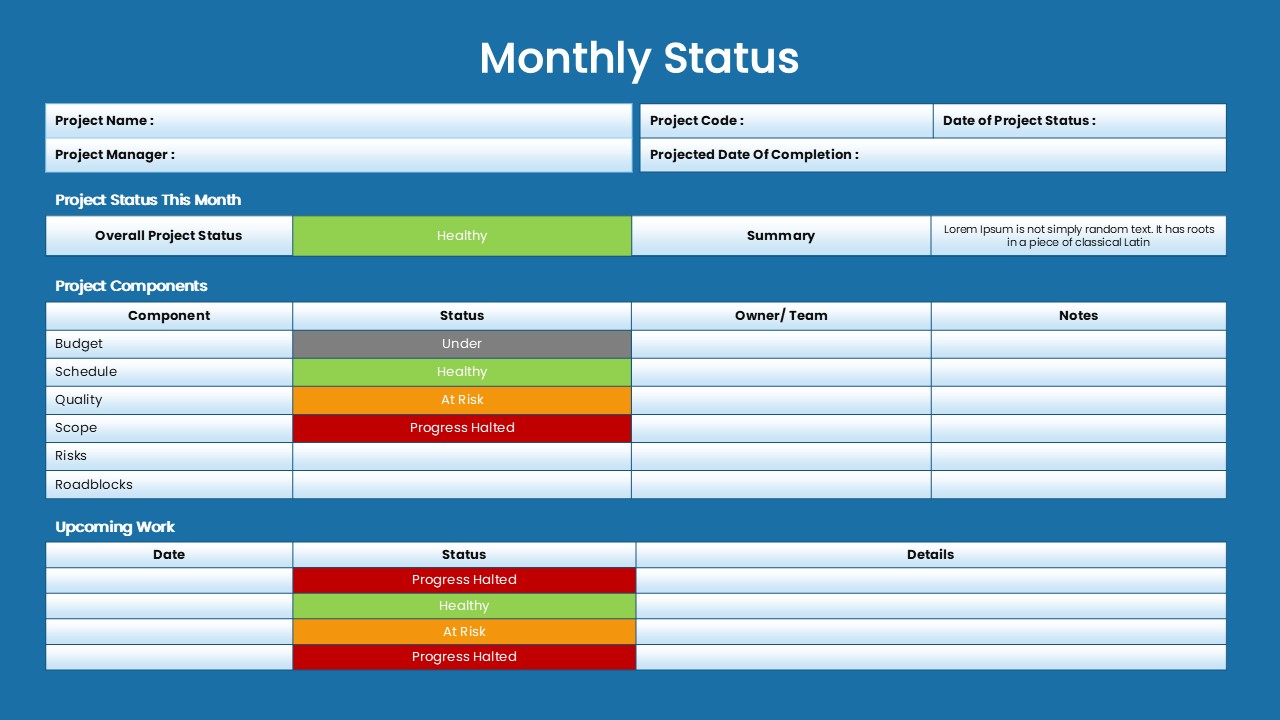
Monthly Status Report Template for PowerPoint & Google Slides
Project Status
Premium
Free KPI Dashboard PowerPoint Template for PowerPoint & Google Slides
Charts
Free
E-commerce Analytics Dashboard Template for PowerPoint & Google Slides
Bar/Column
Premium
Dynamic Data Dashboard Infographic Template for PowerPoint & Google Slides
Bar/Column
Premium
Product Usage Analytics Dashboard Chart Template for PowerPoint & Google Slides
Bar/Column
Premium
Data Analytics Dashboard Design template for PowerPoint & Google Slides
Bar/Column
Premium

Efficiency KPI Dashboard Metaphor Template for PowerPoint & Google Slides
Infographics
Premium
Business Dashboard Analytics & KPIs Template for PowerPoint & Google Slides
Bar/Column
Premium

Professional Team Efficiency Dashboard Template for PowerPoint & Google Slides
Business Report
Premium
Website Performance Dashboard template for PowerPoint & Google Slides
Charts
Premium
Sales Performance Dashboard template for PowerPoint & Google Slides
Business Report
Premium
Immigration Data Dashboard Template for PowerPoint & Google Slides
Bar/Column
Premium
Employee Skill Analysis Dashboard Template for PowerPoint & Google Slides
Employee Performance
Premium
Sales Growth Dashboard: KPI Gauge & Line Template for PowerPoint & Google Slides
Revenue
Premium
Social Media Performance Dashboard Template for PowerPoint & Google Slides
Bar/Column
Premium

Net Promoter Score Dashboard Template for PowerPoint & Google Slides
Customer Experience
Premium
Performance KPI Dashboard Slide Template for PowerPoint & Google Slides
Business Report
Premium
Bull and Bear Stock Market Dashboard Template for PowerPoint & Google Slides
Infographics
Premium
KPI Dashboard template for PowerPoint & Google Slides
Business Report
Premium
KPI Dashboard Overview template for PowerPoint & Google Slides
Finance
Premium
KPI Dashboard Data Visualization Template for PowerPoint & Google Slides
Bar/Column
Premium
KPI Dashboard Data Overview Slide Template for PowerPoint & Google Slides
Bar/Column
Premium
Professional Nurse Infographic Dashboard Template for PowerPoint & Google Slides
Nursing
Premium
Interactive Benchmarking Gauge Dashboard Template for PowerPoint & Google Slides
Pie/Donut
Premium
Heat Map Risk Matrix Dashboard Template for PowerPoint & Google Slides
Comparison Chart
Premium
Weekly Update Schedule Dashboard Template for PowerPoint & Google Slides
Agenda
Premium
Free Metro UI Dashboard Infographic Template for PowerPoint & Google Slides
Business Report
Free
Website Performance Monitoring Dashboard Template for PowerPoint & Google Slides
Business Report
Premium
One Pager Annual Report Dashboard Template for PowerPoint & Google Slides
Business Report
Premium
Social Media Analytics Dashboard Template for PowerPoint & Google Slides
Digital Marketing
Premium
Social Media Statistics 2023 Dashboard Template for PowerPoint & Google Slides
Comparison
Premium
Mastodon Metrics Infographic Dashboard Template for PowerPoint & Google Slides
Business Report
Premium
Soccer Match Stats Dashboard Slide Template for PowerPoint & Google Slides
Graphics
Premium
Employee Satisfaction Survey Dashboard Template for PowerPoint & Google Slides
Employee Performance
Premium
Customer Satisfaction KPI Dashboard Template for PowerPoint & Google Slides
Customer Experience
Premium
Freight Logistics Dashboard Infographic Template for PowerPoint & Google Slides
Comparison Chart
Premium
Free Quarterly Business Review Dashboard Template for PowerPoint & Google Slides
Business
Free
Cost Cutting Savings Dashboard Template for PowerPoint & Google Slides
Pie/Donut
Premium
Macroeconomic Indicators Dashboard Template for PowerPoint & Google Slides
PEST
Premium
Free Monthly Financial Dashboard & Cash Flow Template for PowerPoint & Google Slides
Business Report
Free
Michigan County Map with KPI Dashboard Template for PowerPoint & Google Slides
World Maps
Premium
Quarterly Financial Summary Dashboard Template for PowerPoint & Google Slides
Business Report
Premium
Banking Financial Overview Dashboard Template for PowerPoint & Google Slides
Finance
Premium
Quarterly Business Review Dashboard Template for PowerPoint & Google Slides
Pitch Deck
Premium
Monthly Business Review Dashboard Deck Template for PowerPoint & Google Slides
Business Report
Premium
DevOps KPI Dashboard Performance Metrics Template for PowerPoint & Google Slides
Software Development
Premium
Purchasing KPI Metrics Dashboard Template for PowerPoint & Google Slides
Business Report
Premium
Procurement KPI Dashboard & Metrics Template for PowerPoint & Google Slides
Business Report
Premium
Monthly Sales Performance Dashboard Template for PowerPoint & Google Slides
Charts
Premium
HR Report Dashboard Template for PowerPoint & Google Slides
Employee Performance
Premium
Budget Forecast Dashboard & Donut Charts Template for PowerPoint & Google Slides
Pie/Donut
Premium
Risk Level Gauge Comparison Dashboard Template for PowerPoint & Google Slides
Comparison
Premium
Inventory Management Dashboard Template for PowerPoint & Google Slides
Process
Premium
Digital Marketing KPIs Dashboard Dark Template for PowerPoint & Google Slides
Business Report
Premium
Employee Performance Metrics Dashboard Template for PowerPoint & Google Slides
Employee Performance
Premium
Turnover Analysis Dashboard Template for PowerPoint & Google Slides
Employee Performance
Premium
Electronic Health Records Dashboard template for PowerPoint & Google Slides
Health
Premium
Customer Interview Insights Dashboard Template for PowerPoint & Google Slides
Customer Experience
Premium
Account Overview Dashboard template for PowerPoint & Google Slides
Business
Premium
Dashboard Templates for PowerPoint & Google Slides
Bar/Column
Premium
Free Infographic Statistics Dashboard Slide for PowerPoint & Google Slides
Bar/Column
Free
Engineering Maintenance Dashboard Slide for PowerPoint & Google Slides
Software Development
Premium
Incident Tracking Dashboard for PowerPoint & Google Slides
Business Plan
Premium
Patient-Satisfaction KPI Dashboard for PowerPoint & Google Slides
Business
Premium

Free Data Analytics Dashboard Template for PowerPoint
Charts
Free
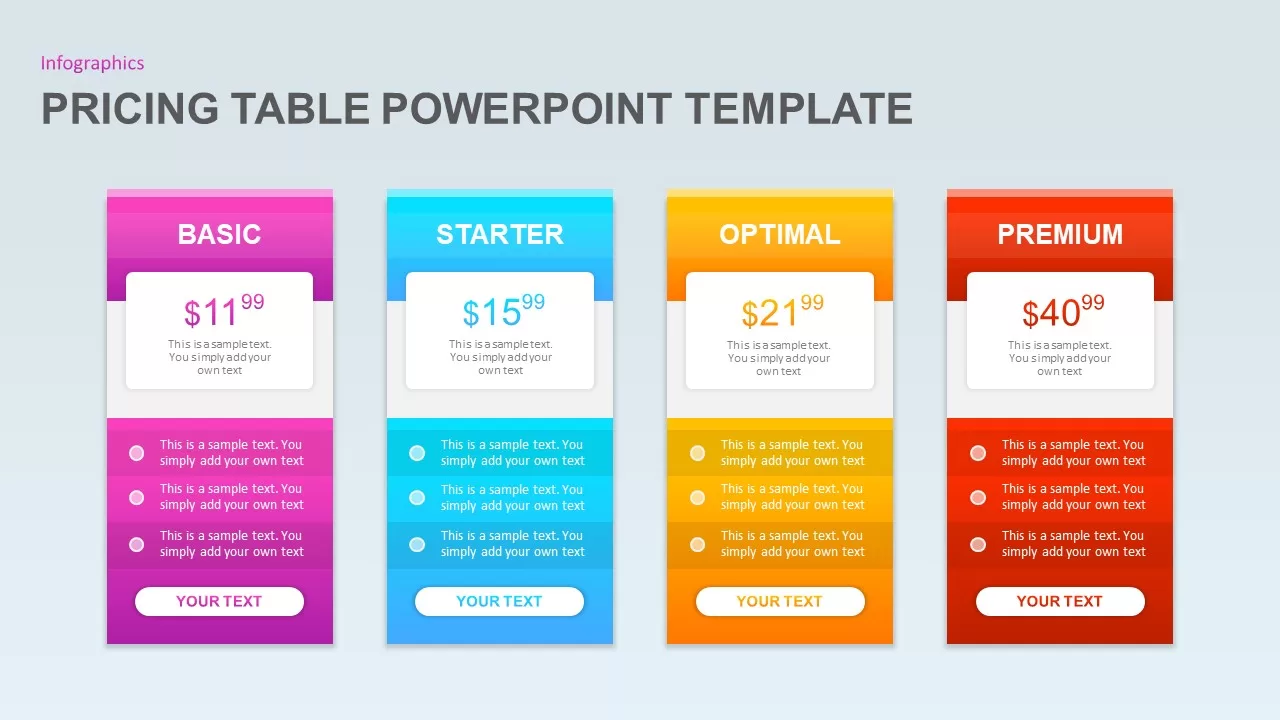
Pricing Table PowerPoint Template for PowerPoint & Google Slides
Infographics
Premium
Simple Comparison Table Template for PowerPoint & Google Slides
Comparison
Premium
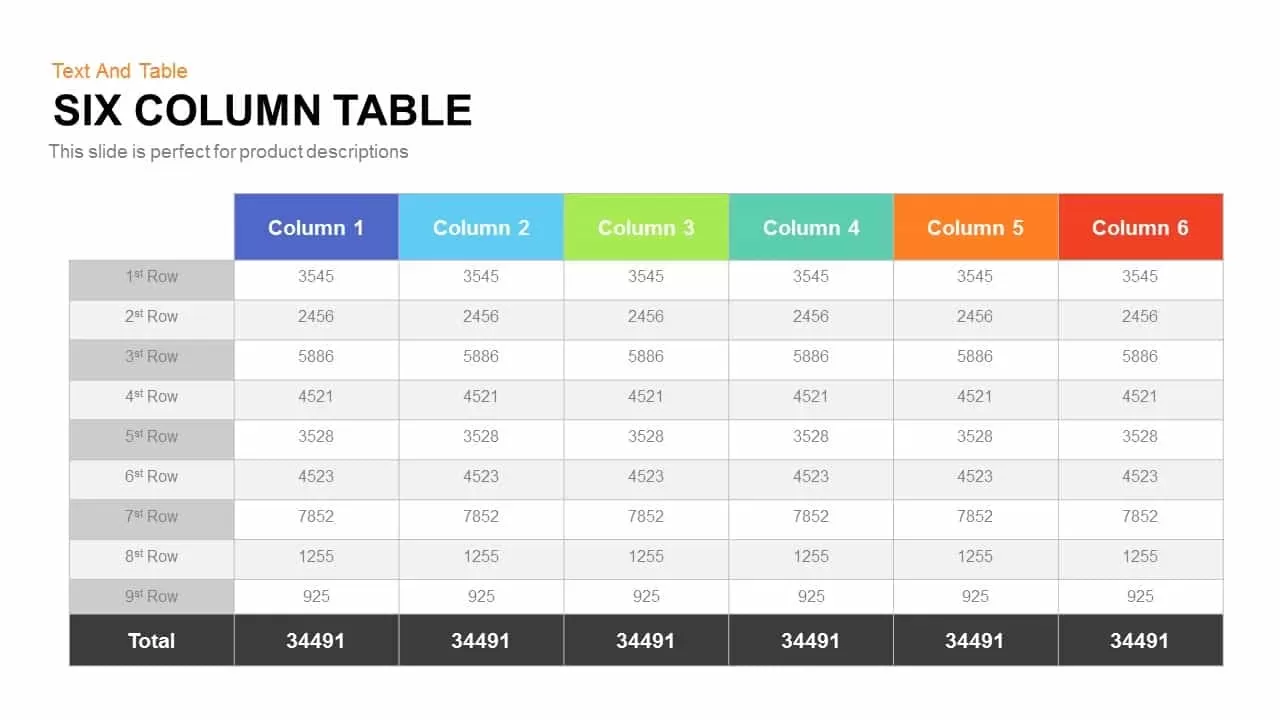
Six Column Table template for PowerPoint & Google Slides
Comparison
Premium
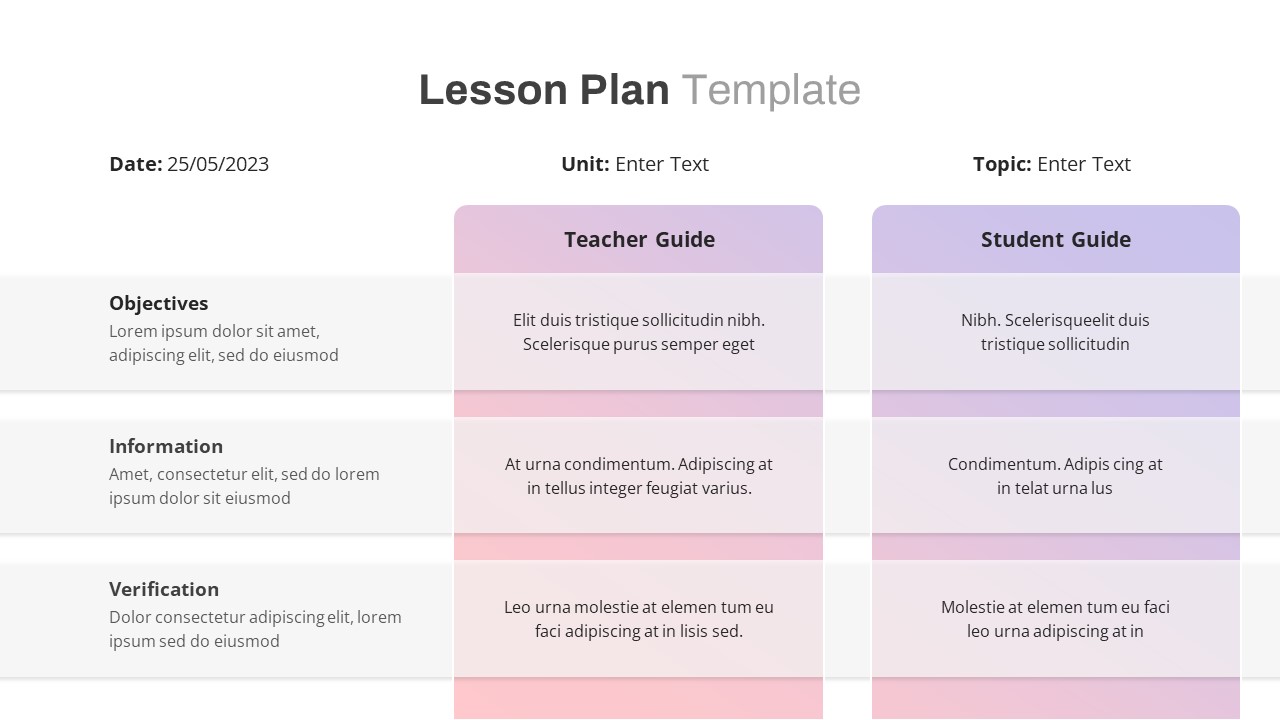
Free Lesson Plan Table Slide Template for PowerPoint & Google Slides
Agenda
Free
Sales Growth Comparison Chart & Table Template for PowerPoint & Google Slides
Bar/Column
Premium